

Crypto World
Bitcoin price falls below $64K ahead of Fed decision

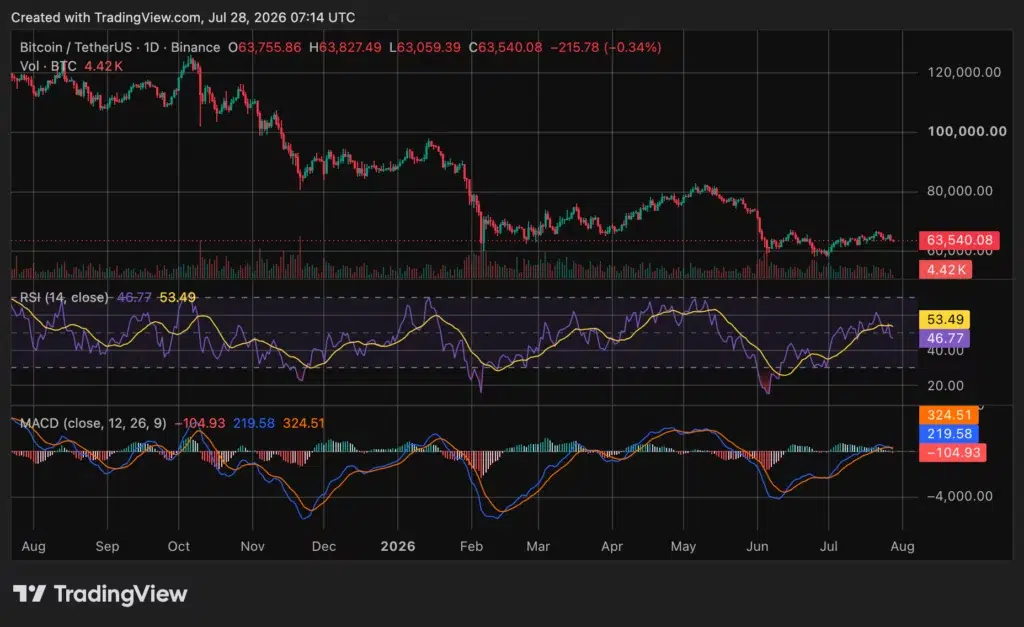
Bitcoin traded near $63,490 on July 28 after falling below $64,000 during a broad risk-off move across Asian markets.
Summary
- Bitcoin traded near $63,490, down 2.85%, as South Korea’s KOSPI triggered a circuit breaker Tuesday.
- $11.64 million left U.S. spot Bitcoin ETFs Monday, while IBIT posted the largest fund outflow.
- Wallets holding 10 to 10,000 BTC accumulated 19,696 coins during the latest eight-day period tracked.
According to crypto.news market data, BTC dropped about 2.85% over 24 hours, with a daily range between approximately $63,055 and $65,546 at the time checked.
The decline began after U.S. markets closed Monday and accelerated as South Korean technology shares sold off. Bitcoin dropped from nearly $65,000 to around $63,200 before recovering slightly, while ether, XRP and solana also weakened.
The move places BTC back inside the lower half of its recent $60,000–$66,000 range. Technical momentum has softened, although compressed volatility, whale accumulation and the approaching Federal Reserve decision leave the next direction unsettled.
Asian equity losses added pressure to Bitcoin price
South Korea’s KOSPI fell more than 8% on Tuesday morning, forcing the Korea Exchange to suspend marketwide trading for 20 minutes. The Level 1 circuit breaker was activated after the decline remained above the required threshold for one minute.
Selling continued after the halt. The KOSPI fell almost 10% during the session, while Samsung Electronics and SK Hynix lost more than 12%. Concerns centred on heavy AI spending, financing risks and growing competition from Chinese semiconductor companies.
Japan’s Nikkei also fell about 4%, following a 2.2% decline in the Philadelphia Semiconductor Index during Monday’s U.S. session. Nvidia had dropped 5%, adding another negative signal for technology-linked risk assets.
Bitcoin often trades alongside equities when selling is driven by interest rates, liquidity or broad macro concerns. However, the relationship is not constant. Bitcoin may decouple when pressure is limited to company earnings or sector-specific capital-spending concerns.
Tuesday’s price action suggests traders initially treated the Asian selloff as a wider risk event. It does not prove that the KOSPI decline alone caused Bitcoin’s fall, because Fed expectations, ETF flows and geopolitical developments were moving simultaneously.
Bitcoin remains trapped between $60,000 and $66,000
The BTC/USDT daily chart places Bitcoin near $63,500 after repeated failures to establish support above $65,000–$66,000. Price has consolidated since June’s sharp decline, but it remains in a broader downtrend from the previous peak above $100,000.
The relative strength index on the supplied chart stands at 46.77, below its moving average of 53.49. An RSI reading below 50 shows that short-term momentum has moved slightly towards sellers, although it remains well above the traditional oversold level of 30.
Bitcoin price chart, source: crypto.news
The moving average convergence divergence indicator has also weakened. Its histogram is negative at about minus 104.93, while the MACD line near 219.58 remains below the signal line around 324.51. That structure shows that the earlier July recovery has lost momentum.
Ali Martinez said Bitcoin’s three-day Bollinger Bands were beginning to squeeze. Bollinger compression usually reflects falling realised volatility and can precede a larger move, but it does not establish whether the eventual break will be higher or lower.
Crypto Patel separately argued that BTC had broken trendline support, retested approximately $65,600 and faced rejection. His bearish scenario targets the 0.618 Fibonacci area near $61,000 while price remains below reclaimed resistance. That level is an analyst projection, not a confirmed destination.
The chart therefore presents three immediate zones. Bitcoin must recover $65,000–$66,000 to improve its short-term structure. The $61,000 area is the first lower support identified by the bearish Fibonacci setup, while $60,000 remains the main floor of the broader consolidation.
A sustained daily close below $60,000 would weaken the range and expose the June lows near $58,000. Conversely, a close above $66,000 would invalidate part of the short-term bearish setup and place the July resistance near $67,181 back in focus.
Bitcoin reclaimed $65,000 on July 27 as falling oil prices briefly supported risk assets. That recovery failed to produce a breakout above the wider resistance band.
ETF selling conflicts with whale accumulation
U.S. spot Bitcoin ETFs recorded combined net outflows of $11.64 million on July 27, according to SoSoValue data. BlackRock’s iShares Bitcoin Trust recorded the largest individual fund outflow at $8.82 million.
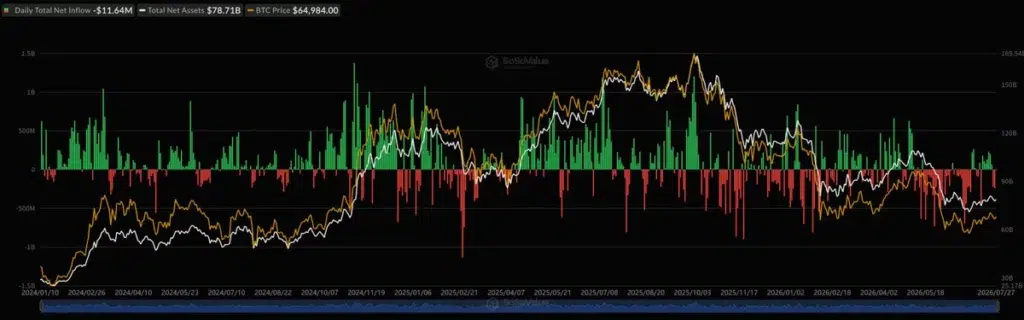
Bitcoin spot ETF net inflow, Source: SoSoValue
The daily total was modest compared with the $240.08 million withdrawn on July 24. However, another negative session shows that institutional demand remains uneven rather than firmly returning to sustained inflows.
ETF activity has become an important source of marginal Bitcoin demand. Persistent inflows require authorised participants to create shares and source underlying exposure, while extended outflows can reduce that source of buying.
One session should not be treated as a trend. The four-week flow direction offers a more useful measure because individual daily totals can be affected by portfolio rebalancing, market making and settlement timing.
On-chain data present a different picture. Santiment said wallets holding between 10 and 10,000 BTC added 19,696 BTC over eight days. The analytics firm also said wallets holding less than 0.01 BTC showed weaker dip-buying activity.
The divergence suggests larger holders have accumulated while very small accounts have shown less urgency. Still, wallet cohorts do not map perfectly to individual investors. Large addresses can represent exchanges, custodians, funds or several customers rather than one whale.
Whale accumulation may provide support if those coins remain off exchanges. It becomes less constructive if large holders begin transferring inventory to trading platforms during price rebounds.
Fed, GDP and core PCE create a volatility window
The Federal Open Market Committee is meeting on July 28 and 29. At its previous meeting on June 17, the Fed kept the federal funds target range at 3.5%–3.75% and said inflation remained above its 2% goal.
Interest-rate markets assigned a roughly 38% probability to a 25-basis-point increase before the decision. That estimate represents market pricing and can change quickly before the announcement.
The July meeting is not marked as one accompanied by a new Summary of Economic Projections. Traders will therefore focus on the rate decision, the statement and the central bank’s language about inflation, energy prices and future tightening.
Thursday brings two major U.S. releases at 8:30 a.m. Eastern Time. The Bureau of Economic Analysis will publish its advance estimate of second-quarter gross domestic product and the June Personal Income and Outlays report, which contains the Fed’s preferred personal consumption expenditures inflation measures.
A rate increase or a more restrictive statement could lift Treasury yields and the dollar, conditions that often weigh on Bitcoin and other assets without fixed cash flows. Under that scenario, the $61,000 and $60,000 zones would become more exposed.
A rate hold accompanied by less restrictive guidance could help BTC challenge $65,000–$66,000 again. Cooler core PCE data on Thursday could support that move, while stronger inflation or GDP figures could renew expectations that rates must remain higher.
The outcomes should not be considered in isolation. A hold on Wednesday could initially lift Bitcoin, only for hotter inflation data to reverse the move on Thursday. Likewise, a restrictive Fed decision could be partly offset by weaker economic data the following day.
As previously reported, Bitcoin entered July with the Fed meeting and ETF flows as its main external catalysts. The earlier analysis identified $58,000 as major downside support, while the market has since established a nearer resistance zone around $65,000–$67,181.
Bitcoin needs confirmation outside the current range
Bitcoin’s immediate trend remains neutral to mildly bearish while price trades below $65,000–$66,000. The negative MACD histogram and sub-50 RSI support that reading, but neither indicator confirms a full breakdown while $60,000 remains intact.
A bullish confirmation would require a sustained close above $66,000, preferably accompanied by stronger spot volume and renewed ETF inflows. That would return attention to $67,181 and the higher resistance area near $68,000.
A bearish confirmation would require a decisive close below $60,000. Such a move would break the current consolidation and bring the late-June low near $58,000 back into view.
Until either boundary fails, Bitcoin remains range-bound. The Bollinger Band squeeze suggests that volatility may expand soon, while the Fed decision, GDP release and core PCE data provide clear events capable of triggering that expansion.
FAQs
Why is Bitcoin falling today?
Bitcoin weakened as South Korean and Japanese technology shares sold off, U.S. semiconductor stocks declined and traders prepared for the Federal Reserve decision. Fresh ETF outflows added another negative signal, although no single factor fully explains the move.
Is $60,000 the key Bitcoin support?
Yes. Bitcoin has repeatedly traded between approximately $60,000 and $66,000 since the June selloff. The $61,000 level may offer earlier Fibonacci support, but a daily close below $60,000 would represent a clearer range breakdown.
Does the Bollinger Band squeeze predict a rally?
No. A squeeze shows that volatility has contracted. It can precede a strong price move, but it does not predict the direction. Price confirmation above resistance or below support is still required.
When are the Fed, GDP and core PCE events?
The Fed’s two-day meeting ends Wednesday, July 29. The advance second-quarter GDP estimate and June Personal Income and Outlays report are scheduled for Thursday, July 30, at 8:30 a.m. Eastern Time.



Hyperliquid’s SK Hynix perpetual contract briefly fell about 17.9% on July 28 after an unusually low pre-market trade in South Korea fed into the contract’s oracle pricing.
Summary
- 17.9% intraday decline followed one anomalous NXT trade involving only a single SK Hynix share.
- Trade.xyz operates the SKHX market and is investigating the oracle-driven move, Hyperliquid representatives said publicly.
- HIP-3 deployers control oracle inputs, leverage settings and settlements for markets they independently create themselves.
The market, officially listed as xyz:SKHX, tracks the U.S. dollar value of one common SK Hynix share traded in South Korea. Hyperliquid’s interface displays the contract as SKHYNIX-USDC and permits leverage of up to 10 times.
A Hyperliquid representative said the market was deployed and operated by Trade.xyz under the HIP-3 framework. Trade.xyz is investigating and plans to publish an update after reaching a conclusion, according to a statement reported by ChainThink.
One SK Hynix share triggered the initial price anomaly
The disruption began shortly after South Korea’s alternative exchange, NextTrade, opened its pre-market session. One SK Hynix share changed hands at 1.272 million won, 29.96% below the previous close of 1.816 million won.
The trade briefly placed the stock at its daily lower price limit. Korean reports attributed the print to a possible order error combined with limited liquidity during the early session. The underlying price later moved back above that isolated trade.
On-chain tracker HyperInsight said SKHX dropped from about $1,128.20 to $927 as the external price change moved through the oracle and mark-price system. The contract later recovered above $1,100.
The event occurred during a broader decline in South Korean semiconductor shares. SK Hynix closed the regular Seoul session at 1.55 million won, down 14.65%, although that closing move was less severe than the initial one-share print.Trade.xyz documentation states that the SKHX oracle tracks one SK Hynix common share and converts its Korean won price into U.S. dollars using the prevailing exchange rate.
That design allowed the unusual NXT transaction to affect the on-chain contract even though it involved only one share. Leveraged positions linked to the mark price could then face liquidations or automatic deleveraging as the contract moved lower.
DefiLlama’s later snapshot showed SKHX at approximately $1,067, down 13.7% over 24 hours. Open interest stood near $406 million after falling about 20%, while daily volume exceeded $1 billion. These figures can continue changing as positions are opened and closed.
There is no verified evidence that Hyperliquid’s blockchain or smart contracts were compromised. The available information points to an external market print passing through Trade.xyz’s pricing methodology.
HIP-3 makes Trade.xyz responsible for market operation
HIP-3 allows independent teams to launch perpetual markets on Hyperliquid while using the network’s order books, margin system and liquidation engine. The deployer defines the contract, selects its oracle and controls leverage limits and settlement.
Hyperliquid’s API documentation says deployers supply oracle prices, external perpetual prices and as many as two additional mark-price inputs. The protocol combines those values with a local price based on the best bid, best offer and latest trade. Deployers are expected to consider unusual market conditions when designing price feeds. They must stake 500,000 HYPE and can face slashing for misconduct involving their markets.
As previously reported, Hyperliquid’s HIP-3 framework places oracle selection and market controls with outside deployers. That structure expands the number of tradable assets but makes each deployer’s price methodology central to risk management.
Trade.xyz has not published its conclusion
Trade.xyz had not issued a final incident report when checked. Key unanswered questions include which NXT price inputs entered the oracle, whether filters operated as designed and whether any safeguards will change.
The market remained active after the disruption. Hyperliquid’s documentation allows deployers to halt trading, adjust open-interest limits or settle a contract, but no permanent SKHX suspension had been announced.
Notably, other decentralised exchanges have also introduced perpetual contracts for Korean stocks, increasing the links between thin local trading sessions and continuously operating crypto derivatives.
The next verified update is expected from Trade.xyz. Any final assessment should clarify whether the contract behaved according to its published rules or whether its oracle methodology requires changes.


The IMF said Brazil’s stablecoin market has expanded rapidly since 2017, with cross-border crypto flows growing faster than traditional capital flows.
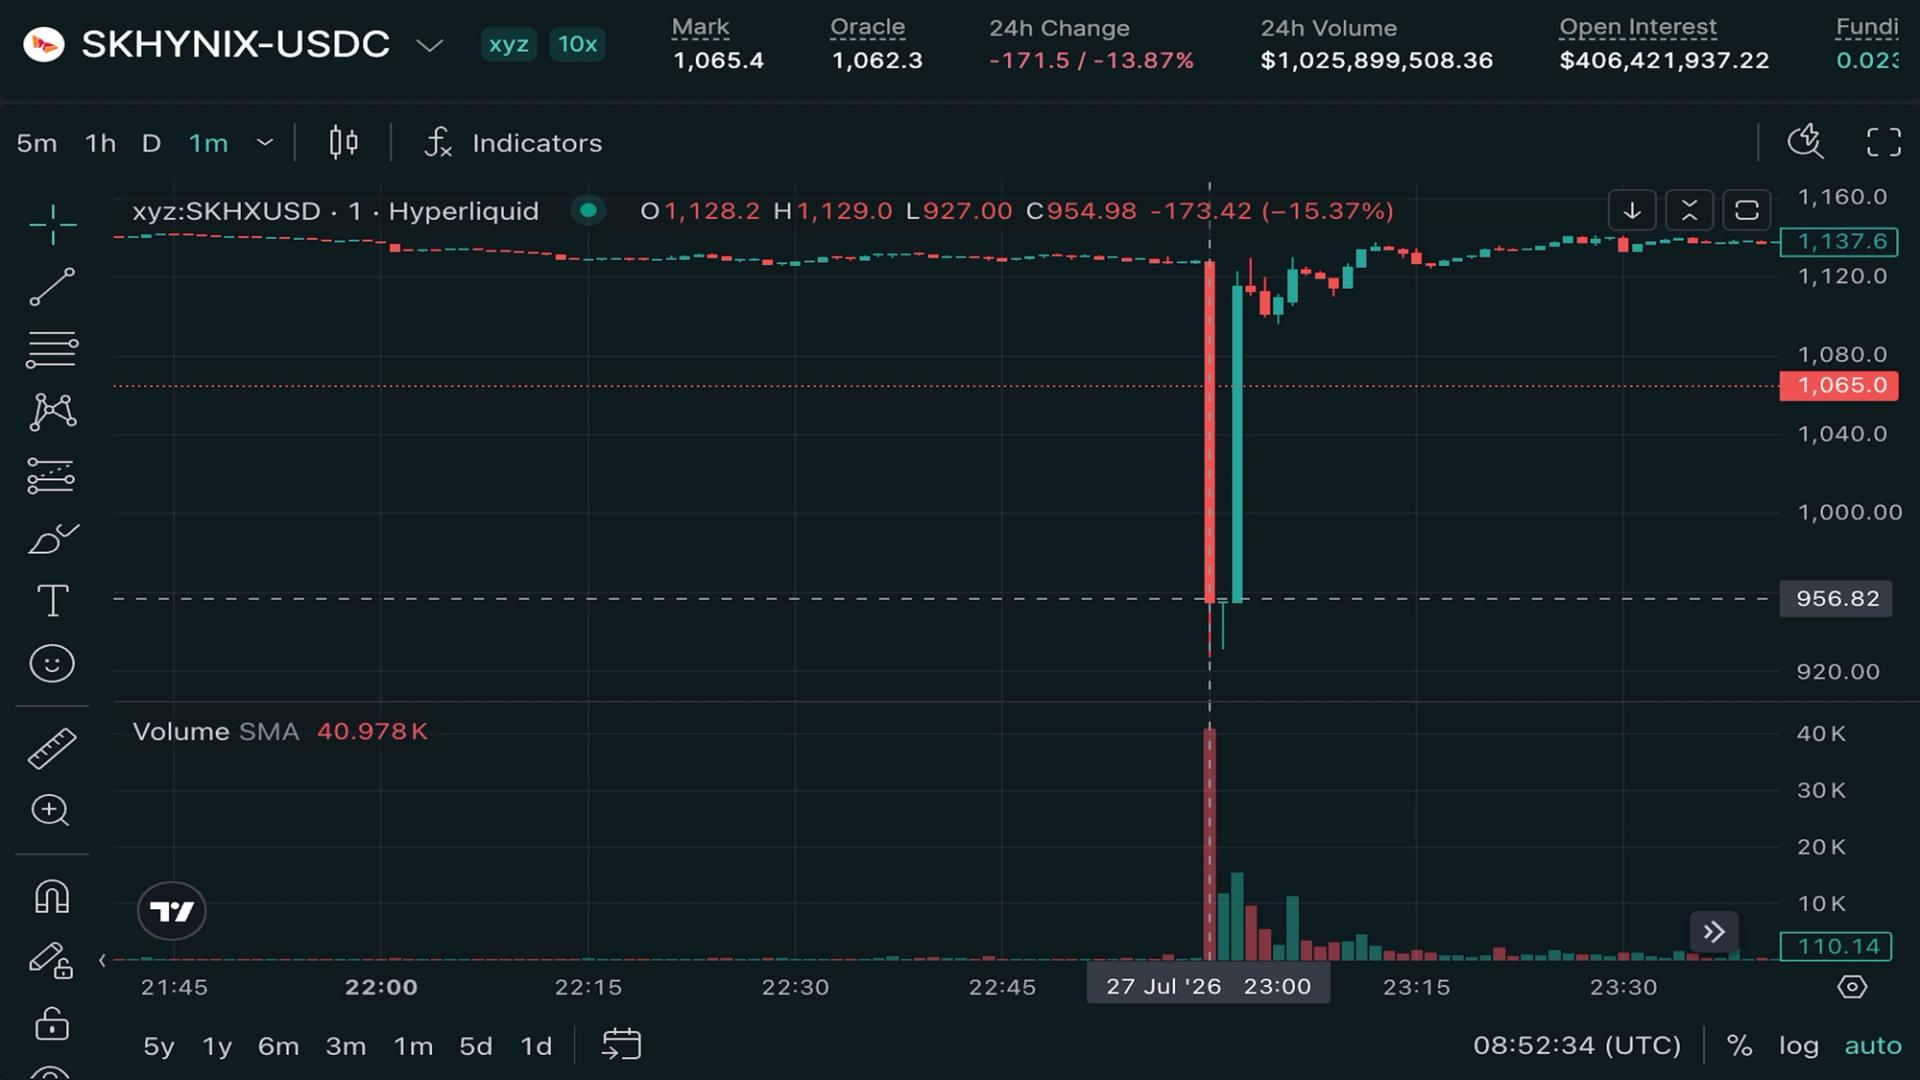
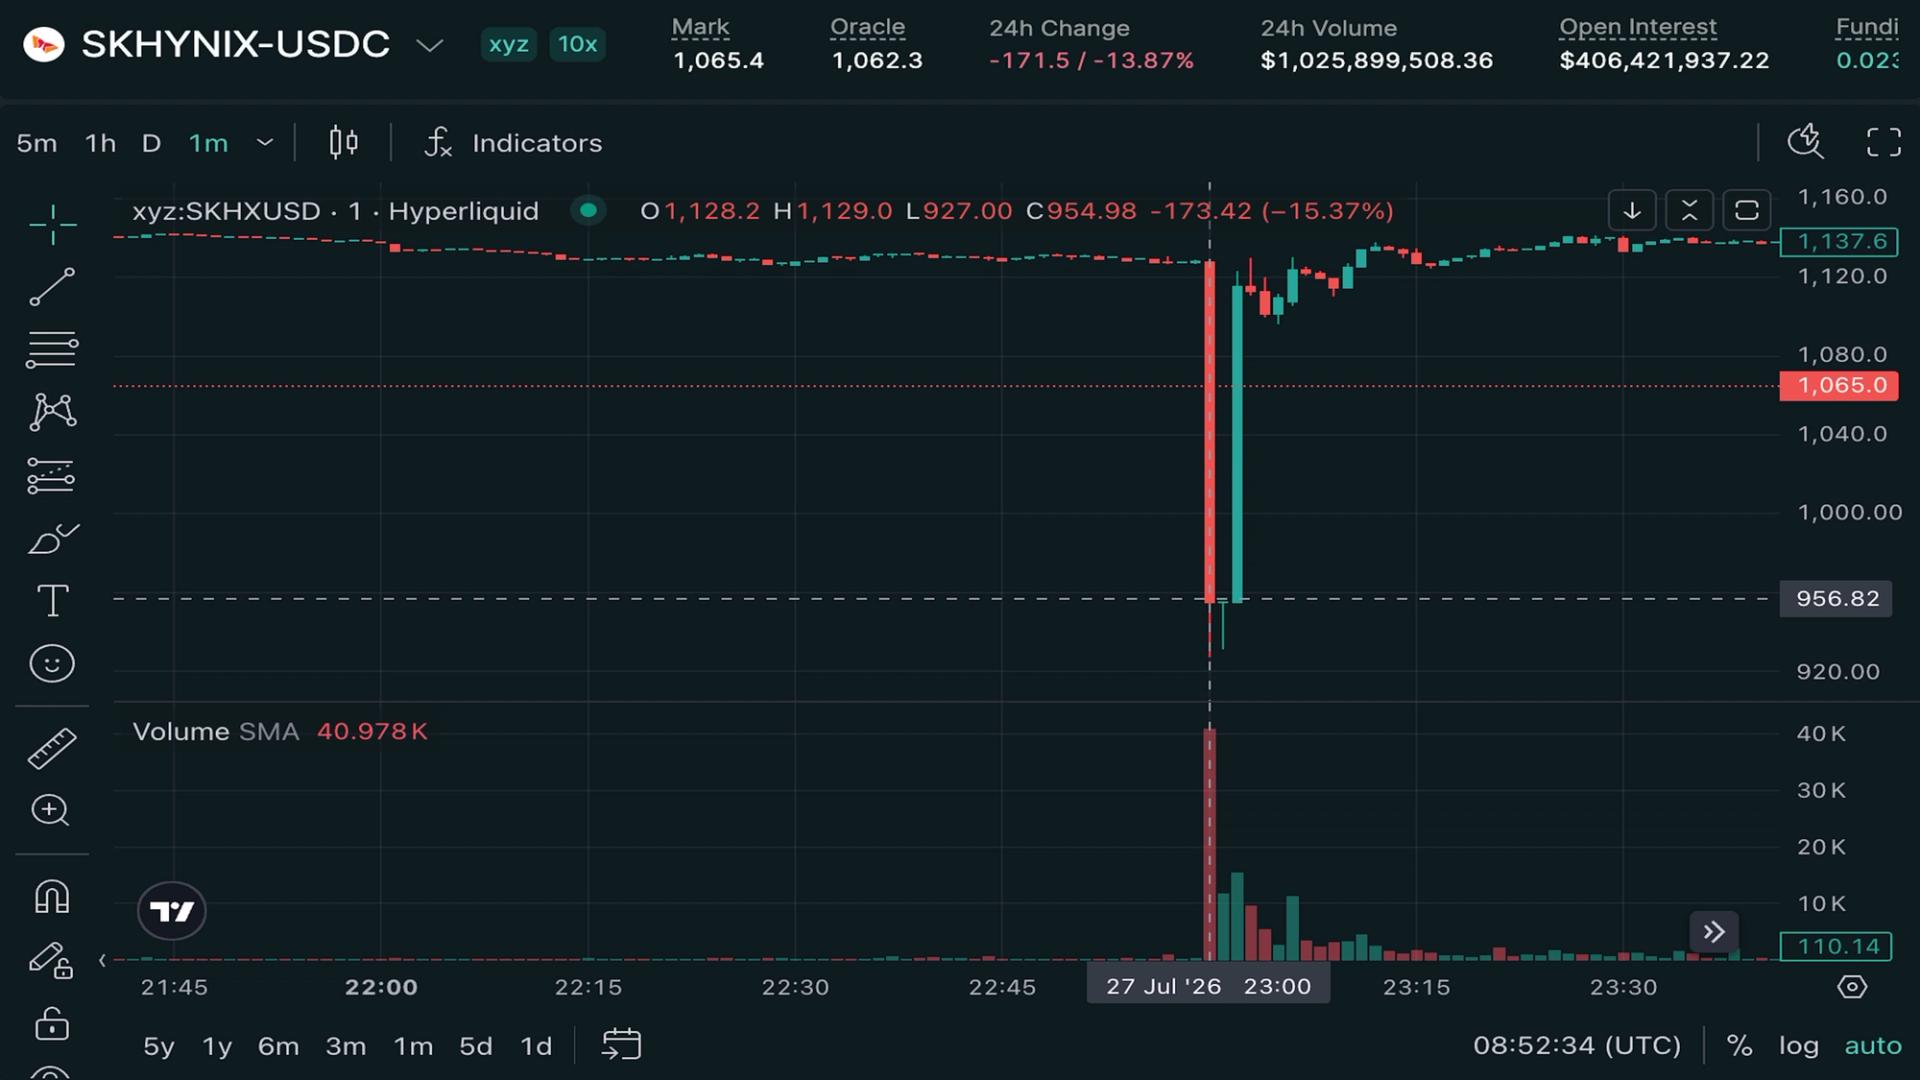
Perpetual futures tied to SK Hynix, a South Korean chipmaker whose American depositary receipts debuted on Nasdaq earlier this month, suffered a flash crash on Hyperliquid shortly before the underlying share price came under pressure in its home market.
Between 23:00 UTC and 23:01 UTC, the price of perpetuals tracking the Seoul-traded stock crashed 20% to $900, according to data from Hyperliquid. The price rebounded to over $1,000 the very next minute and was recently priced at $1,092. The contract is traded and denominated in dollar-pegged stablecoin USDC.
An hour later, the Korean stock market opened on a negative note, led by chipmakers. By the end of the day, SK Hynix shares had dropped by 15% to 1,550,000 won ($1,762). Other losers included Samsung Electronics and carmaker Hyundai Motor. The benchmark Kospi index fell 11%.
SK Hynix ADRs, 10 of which equal one share, fell 4.5% in pre-market trading to $136.51.
Hyperliquid, the leading perpetuals-focused decentralized exchange, has emerged as a hot favorite of traders looking to express their view on traditional assets, especially since the onset of the Iran war in late February. The exchange had not responded to a request for comment by publication time.


BitMEX is now facing legal action alleging it withheld trader collateral and engaged in insider trading. The new lawsuit accuses Hayes and fellow co-founders, Ben Delo and Samuel Reed, of designing a system to retain customers’ collateral and transfer the remaining bitcoin to the platform’s insurance fund.
“One lawsuit won’t move the market, but allegations involving 622 BTC (worth over $40.5 million) of withheld collateral reinforce the oldest doubt in crypto: your funds are safe until the day they aren’t,” said Samuel Videau, chief technology officer at Genius. “What’s ending is opacity,the model where you wire assets to a black box and take the operator’s word for it.”
The overall crypto derivatives market has barely flinched. The perpetual swap product BitMEX built now generates the bulk of trading activity on larger exchanges like Binance and OKX, alongside traditional platforms like the Chicago Mercantile Exchange (CME).
“The derivatives market is now much larger and more diversified,” said Edwin Cheung, executive director at crypto trading platform Gate. “Most displaced volume is likely to be absorbed by other established platforms.”
The shift suggests exchanges now need scale, regulatory compliance and broader services to survive, rather than relying on retail trading alone.
Although most of the cryptocurrency market has turned red today, some altcoins are taking the storm worse than others. This is typically true for Pi Network’s native token, and today is no exception.
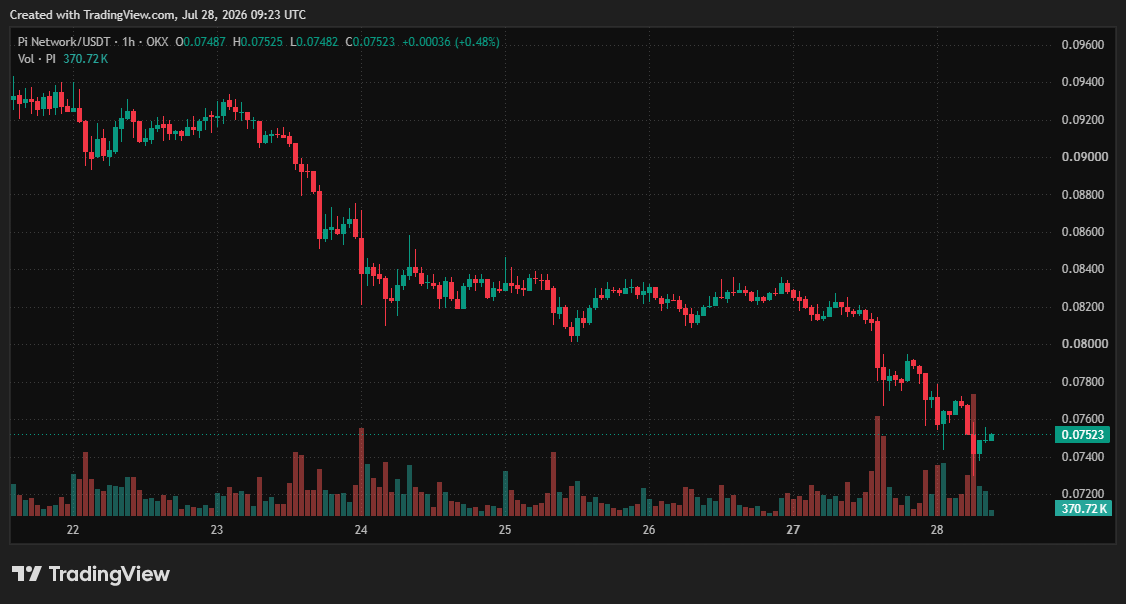
The asset has plummeted by 9% in the past 24 hours and has come painfully close to breaking below $0.07, which would mean a fresh all-time low.
PI Crashes Again
Looking at PI’s price performance, you can easily quote one of the most recognizable songs of all time, which was immortalized from the TV show Friends. It just hasn’t been PI’s day, week, month, or even a year. Aside from a few impressive but very brief pumps, such as the one in March that sent the asset to $0.30 within days, the bears have been in total control, pushing it to a new low after a new low.
The last example came precisely two weeks ago. At the time, PI had broken below the crucial $0.10 support and went into price discovery territory (but on the wrong side). It kept plunging until it finally found some support at $0.07, but only after it had charted a new all-time low.
Although the bulls reemerged at this point and helped it recover some ground to $0.10 in the following 10 days or so, the overall bearish sentiment remained high, and the inevitable transpired. PI was rejected once again, plummeted to $0.08, and after a few days trading above that line, it broke below it in the past 24 hours.
Hours ago, the asset tanked below $0.074, coming about 5% away from its ATL. Although it has rebounded slightly to over $0.075 now, it remains deep in the red daily (-9%) and weekly (-19%).
Washed Out Sentiment
Even before PI’s nosedive to $0.074, popular analyst Ben (co-founder of BSCNew) commented that the sentiment around the asset remains “as washed out as I have seen it.” And all of that comes despite the continuous updates, redesigned apps, and protocol upgrades delivered by the Core Team.
As such, Ben commented that his position is still unchanged as he cares about “shipping cadence more than the weekly candle.” And, he concluded that “the cadence is accelerating.”
Other accounts dedicated to covering Pi Network news, such as Pi Town, are also supportive of what the team is doing, and seemingly remain unfazed by the overall price calamity of the native token.
The post Pi Network Price Nears Record Low: What ‘Washed Out’ Sentiment Means for PI Holders appeared first on CryptoPotato.

The Hyperliquid Policy Center and Multicoin Capital submitted a joint comment to the US Commodity Futures Trading Commission (CFTC) on July 27th.
They expressed support for the agency’s proposed prediction market framework but also pressed for two changes that could affect how on-chain event contracts are designed and approved.
The filing is a direct response to the CFTC’s “Prediction Markets; Public Interest Determinations” proposal published earlier in June. It aims to amend Regulation 40.11 and seeks to establish a 90-day process for reviewing event contracts that may involve gaming, war, terrorism, assassination, or other activities listed in the Commodity Exchange Act, among other things.
HPC and Multicoin called the plan a “clear and well-reasoned framework.” They argued that prediction markets belong under the CFTC’s exclusive federal jurisdiction.
The letter also states that regulating prediction markets on a state level, creating “fifty separate state regimes,” would fragment national derivatives markets.
Prediction markets topped $50 billion in trading volume last month, and the biggest names in traditional finance are moving in.
Today, with @multicoin, we filed a joint comment supporting the @CFTC ‘s proposed prediction markets framework.
These markets have grown up. The… https://t.co/pYG4mevmbT
— Hyperliquid Policy Center (@HyperliquidPC) July 27, 2026
Settlement: Key Regulatory Test
The first concern that the group outlines is related to the use of one word in the Commodity Exchange Act: “involve.” Under the statute’s rule, the CFTC can review contracts that involve certain listed activities and prohibit them when they are contrary to the public interest.
The letter supports an interpretation focused on settlement. Instead of treating trading itself as gaming, regulators would have to examine the event that determines the payout. A contract would fall within the special rule when settlement directly turns on illegal activity, not merely because buying it resembles placing a wager.
In addition, the group asked for more examples. Edge cases may include certain contracts with several potential paths to settlement or products that reference a sensitive activity only indirectly. Clear illustrations would help exchanges and developers assess regulatory exposure before having to commit resources to a launch.
Transparency Could Become a Competitive Requirement
The second recommendation concerns what happens after a review under Regulation 40.11. Under the current proposal, the CFTC would publish written findings when it blocks a contract and explain how that particular decision fits with earlier findings.
HPC and Multicoin argue that this could create an information gap: an approval, including by inaction, can reveal as much about the regulatory boundaries as a prohibition. Without any public reasoning, other platforms may repeat the same legal work, seek guidance, or avoid products that could have been permissible.
In any case, it’s interesting to follow developments surrounding the letter and whether the CFTC would adopt the two requested changes. This could be a signal that regulators are actively listening to industry experts and attempt to legislate in a way that’s both fair to anyone involved.
The post Hyperliquid and Multicoin Push CFTC Toward One Prediction Market Rulebook appeared first on CryptoPotato.


A federal judge blocked Minnesota’s prediction market ban on Monday, handing Kalshi, Polymarket US, and the Commodity Futures Trading Commission (CFTC) a preliminary injunction days before the law’s August 1 effective date.
US District Judge Katherine Menendez found the Commodity Exchange Act (CEA) likely preempts the statute. Her order bars enforcement against CFTC-registered designated contract markets (DCMs) until a final merits decision.
Why the Court Found Federal Law Likely Preempts Minnesota’s Statute
Menendez issued the order in 3 related cases against Minnesota, Attorney General Keith Ellison, Governor Tim Walz, and other state officials. Kalshi, Polymarket US, and the federal government each won their injunction motions.
Minnesota’s law, Minn. Stat. § 609.7615, makes operating or creating a prediction market a felony. It covers sports, elections, legal actions, pop culture, and statements by specific people. Advertising and providing data services also carry criminal penalties.
The CFTC filed its lawsuit in May, after Walz signed the legislation. Chairman Michael Selig argued the ban would criminalize weather contracts that Minnesota farmers use for hedging.
Menendez ruled that the CEA gives the CFTC exclusive jurisdiction over swaps traded on DCMs. She found many contracts on both platforms, including election and geopolitical markets, that likely qualify as swaps. Consequently, Minnesota likely cannot regulate them.
“Kalshi and Polymarket US are designated contract markets, so the CFTC has exclusive jurisdiction to regulate transactions involving those swaps,” the order read.
Follow us on X to get the latest news as it happens
Judge Signals Final Relief Could Be Narrower
However, Menendez stressed that not every event contract fits the swap definition. She pointed to Kalshi markets on Love Island USA winners and World Cup announcer mentions as likely failing the test.
Both sides briefed the case as all-or-nothing, she noted. That left the court little guidance for crafting a narrower remedy, so she froze the entire statute for now.
Irreparable harm weighed heavily in the decision. Kalshi reported over 90,000 verified Minnesota users as of May 26, with millions of dollars in open positions. Sovereign immunity would bar any recovery of damages if enforcement proceeded.
The court did not address the First Amendment claims raised by both exchanges. Those questions, along with the implied preemption issue, now await a full merits ruling.
Subscribe to our YouTube channel to watch leaders and journalists provide expert insights
The post Court Sides With Kalshi and Polymarket Over Minnesota’s August 1 Ban appeared first on BeInCrypto.

In Washington, momentum can vanish as quickly as it arrives. The Clarity Act now sits on the shelf, while the Bitcoin price slips under renewed pressure after a sharp selloff across Asian markets.
Senate Majority Leader John Thune has shifted attention toward federal nominations and a Russia sanctions bill, delaying debate on crypto legislation. The Digital Asset Market Clarity Act, designed to define SEC and CFTC oversight, now faces an increasingly narrow window before Congress begins its August recess.
— Crypto Banter (@crypto_banter) July 28, 2026
 SENATE SHELVES CLARITY ACT FOR NOW!
Majority Leader John Thune is prioritizing nominations and a Russia sanctions bill, pushing the crypto market structure legislation aside amid limited floor time, CoinDesk reports.
Clarity is unlikely to reach a vote before next week, the… pic.twitter.com/XKztbFL7cf
That delay arrives at a supposedly bullish moment. Risk appetite was at its top, and now, the delay leaves crypto exposed to fresh volatility.
Discover: The Best Token Presales
Clarity Act Delay Extends Regulatory Limbo
The Clarity Act is a reminder that politics don’t move in straight lines. Ethics concerns surrounding public officials’ digital asset holdings continue to complicate negotiations. Meanwhile, a proposed 2029 sunset clause remains another point of contention before lawmakers can reach consensus.
Outside Capitol Hill, opposition continues to build. New York Attorney General Letitia James argues the Clarity Act could weaken states’ ability to prosecute crypto fraud, potentially limiting local enforcement powers. Her criticism adds another obstacle as supporters race against the congressional calendar.
Not just in the States, regulatory pressure is also unfolding overseas. Thailand’s SEC has filed criminal complaints against Bitkub and two former executives over allegations they concealed a 2021 cyberattack worth about $50 million. Although customers were reimbursed, authorities allege the exchange submitted inaccurate reports, reviving concerns over transparency throughout the industry.
Elsewhere, prediction markets continue advancing despite federal uncertainty. A U.S. judge temporarily blocked Minnesota’s restrictions on platforms including Kalshi and Polymarket, citing potential conflicts with federal commodities law. As the CFTC seeks faster legal clarity, the Clarity Act remains trapped in Washington’s legislative queue.
Discover: The Best Crypto to Diversify Your Portfolio
Bitcoin Price Slides as Asian Markets Trigger Risk Aversion

The Bitcoin price weakened after Asian equity markets suffered a huge selloff, extending losses from the previous U.S. session. Bitcoin briefly fell below recent support before stabilizing. It’s not just crypto, but a wider retreat from risk assets as investors reduced exposure across multiple markets.
The butchering started with South Korea’s Kospi, which recorded one of its sharpest declines in months, led by heavy selling in major technology stocks. This could be the culprit, dragging the Bitcoin price lower alongside market sentiment.

Recent gains have also begun to lose momentum. Bitcoin price previously rebounded from July lows but struggled to reclaim higher resistance levels as buying pressure softened. Spot Bitcoin ETFs continued attracting inflows over recent weeks, although significant late-week withdrawals showed institutional demand remains sensitive to macroeconomic shifts.
Large holders have largely avoided aggressive accumulation during the latest decline. Strategy maintained its existing Bitcoin position without announcing any additional purchases, instead preserving billions in available cash. At the same time, miners may receive modest relief as network difficulty appears set for its first annual decline in nearly two decades.
Attention now shifts toward the Federal Reserve and Washington alike. Bitcoin price could remain trapped in a cautious range until investors receive clearer signals from policymakers and lawmakers. For now, delayed legislation and fragile market sentiment continue moving together, leaving the Clarity Act and crypto markets waiting for the next decisive chapter.
Trade Bitcoin and Major Cryptocurrencies on Bybit and Get a Chance to Win Our $1,000 USDT Airdrop
The post Crypto News, July 28: CLARITY Act Shelved, Bitcoin Drops in Asian Market Rout appeared first on Cryptonews.

The rather impressive Monday rally didn’t last long, as the entire cryptocurrency market has turned red today, with the market cap losing over $80 billion from top to bottom.
Ripple’s native token is no exception. The asset has dropped from yesterday’s peak at $1.11 to $1.05. Here are some of the possible reasons behind this decline and what could be next.
XRP Dives and ETF Inflows Can’t Save It
Perhaps the most obvious reason behind XRP’s crash is that it’s not an isolated case; the entire market has turned red, led by bitcoin’s dive from $65,600 to $63,000. As such, the cross-border token cannot be simply ruled out, as it tends to follow the overall market trend.
It appears investors are reducing their exposure to risk-on assets like crypto ahead of the next Federal Reserve FOMC meeting. The US central bank will announce its interest rate decision tomorrow evening. According to some reports, there’s an actual chance of a rate hike despite easing inflation in June.
The rejection at $1.11 and the subsequent decline to $1.05 meant that XRP has actually lost a crucial support zone at $1.08-$1.10, which managed to halt its free falls for most of July. Aside from this technical side of things, the asset’s drop triggered a large wave of liquidations, which also created the snowball effect of a more profound decline.
The silver lining is that the ETF net flows remained in the green. However, it was a very modest number of under $600,000, which is evidently not sufficient to help XRP avoid such price losses.
So What’s Next?
The daily leg down hasn’t changed popular analysts’ opinion on XRP’s claimed bright future. Xaif Crypto acknowledged the rising leverage and XRP’s rather tight trading range. The market observer commented that “two-sided liquidations are getting hit on both longs and shorts,” which, aligned with neutral funding and drying up spot liquidity on Binance, will likely lead to a much bigger move soon.
Meanwhile, CasiTrades outlined once again that she expects the next XRP wave to be “violent.” The analyst noted that XRP has returned to macro support, which, if broken to the downside, will likely lead to a more painful decline to $0.87, her targeted bottom.
ripple:native’s Next Wave Could Be Violent!
Do you see how nicely we’re following the purple scenario?

During Friday’s livestream, I highlighted the importance of the $1.09 level we were testing at the time. I explained that it would likely provide a small reaction… pic.twitter.com/9pjn0EbOZS
— CasiTrades
(@CasiTrades) July 27, 2026

The post Why Is Ripple’s XRP Down by 4.5% Today (July 28)? appeared first on CryptoPotato.
All eyes are on July 30, when Amazon reports Q2 2026 earnings, with Wall Street increasingly convinced the bar has been set too low. Consensus sees EPS near $1.82-$2.26 on roughly $197 billion in revenue, but the real story is AWS: after posting its fastest growth in 15 quarters at 28% in Q1, several major banks—including Bank of America—now expect acceleration toward 32-33%, fueled by surging AI demand and Bedrock workloads tied to Anthropic and OpenAI.
That optimism comes with a catch. Amazon’s $200 billion AI capex plan has already squeezed free cash flow to just $1.2 billion, and investors will be watching closely for any further guidance hike, following similar moves from Alphabet. Options markets are pricing a 6.3% swing on earnings day, above the stock’s typical 5.4% post-earnings move, signaling traders expect this report to matter more than usual.
With shares up roughly 18% year-to-date and trading at a below-average forward multiple, the setup favors strength—but only if AWS growth and margin guidance clear an already demanding bar.
Technical Analysis of Amazon
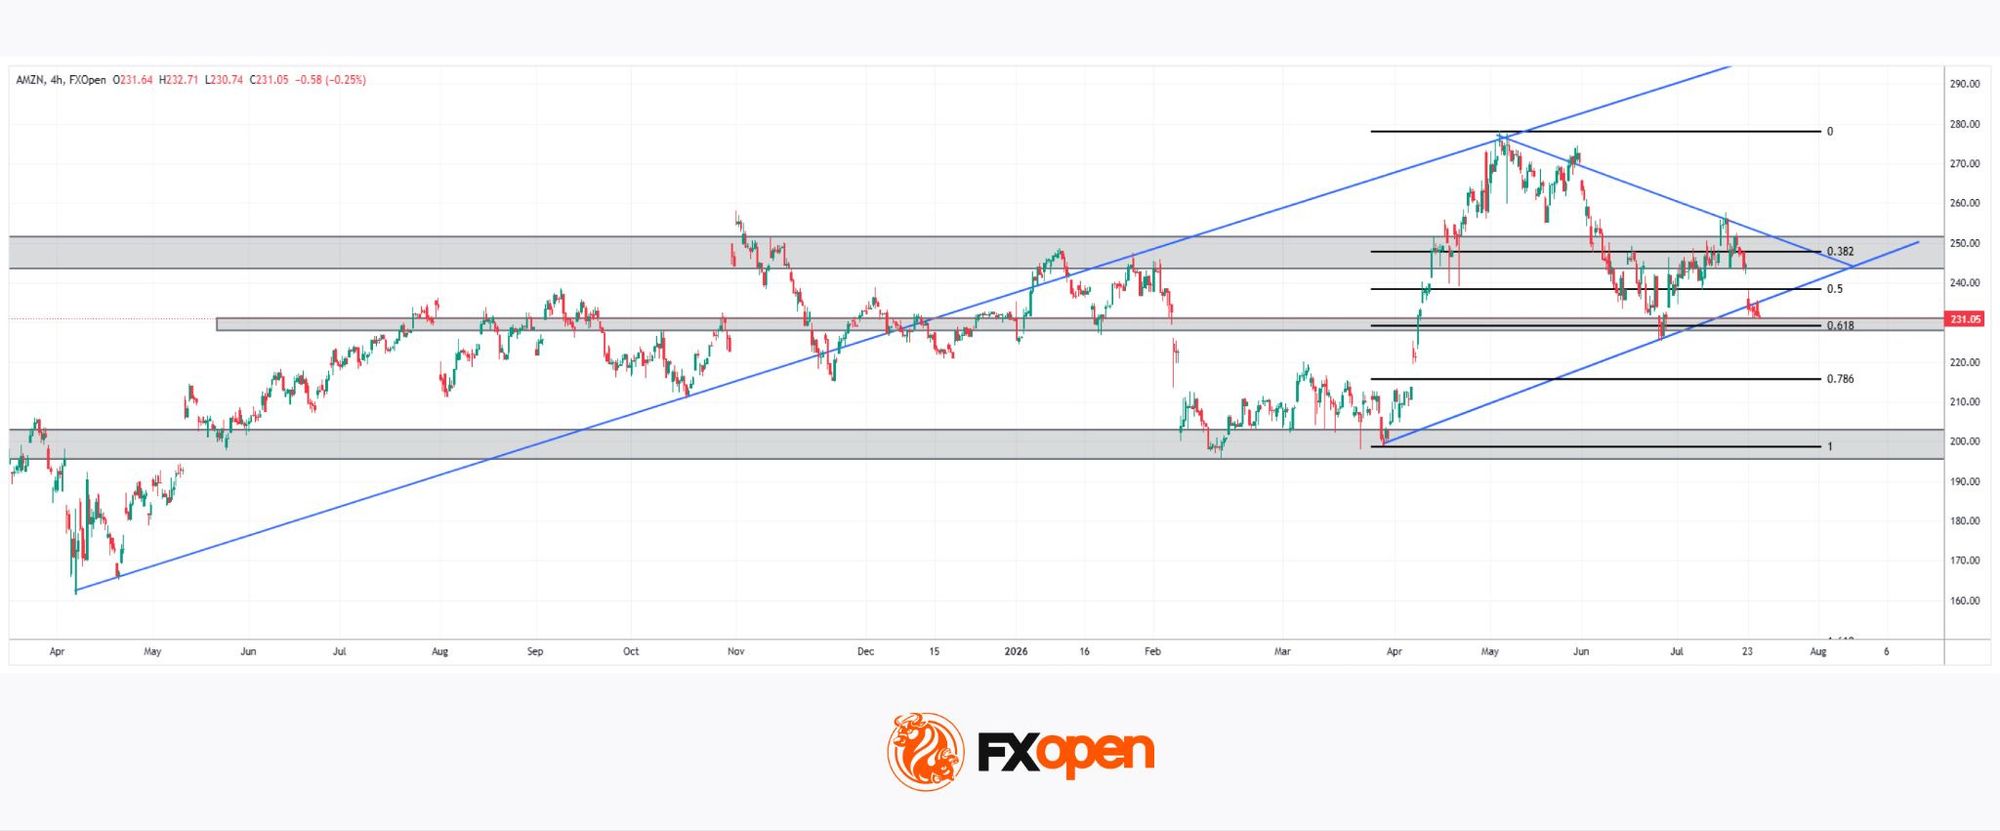
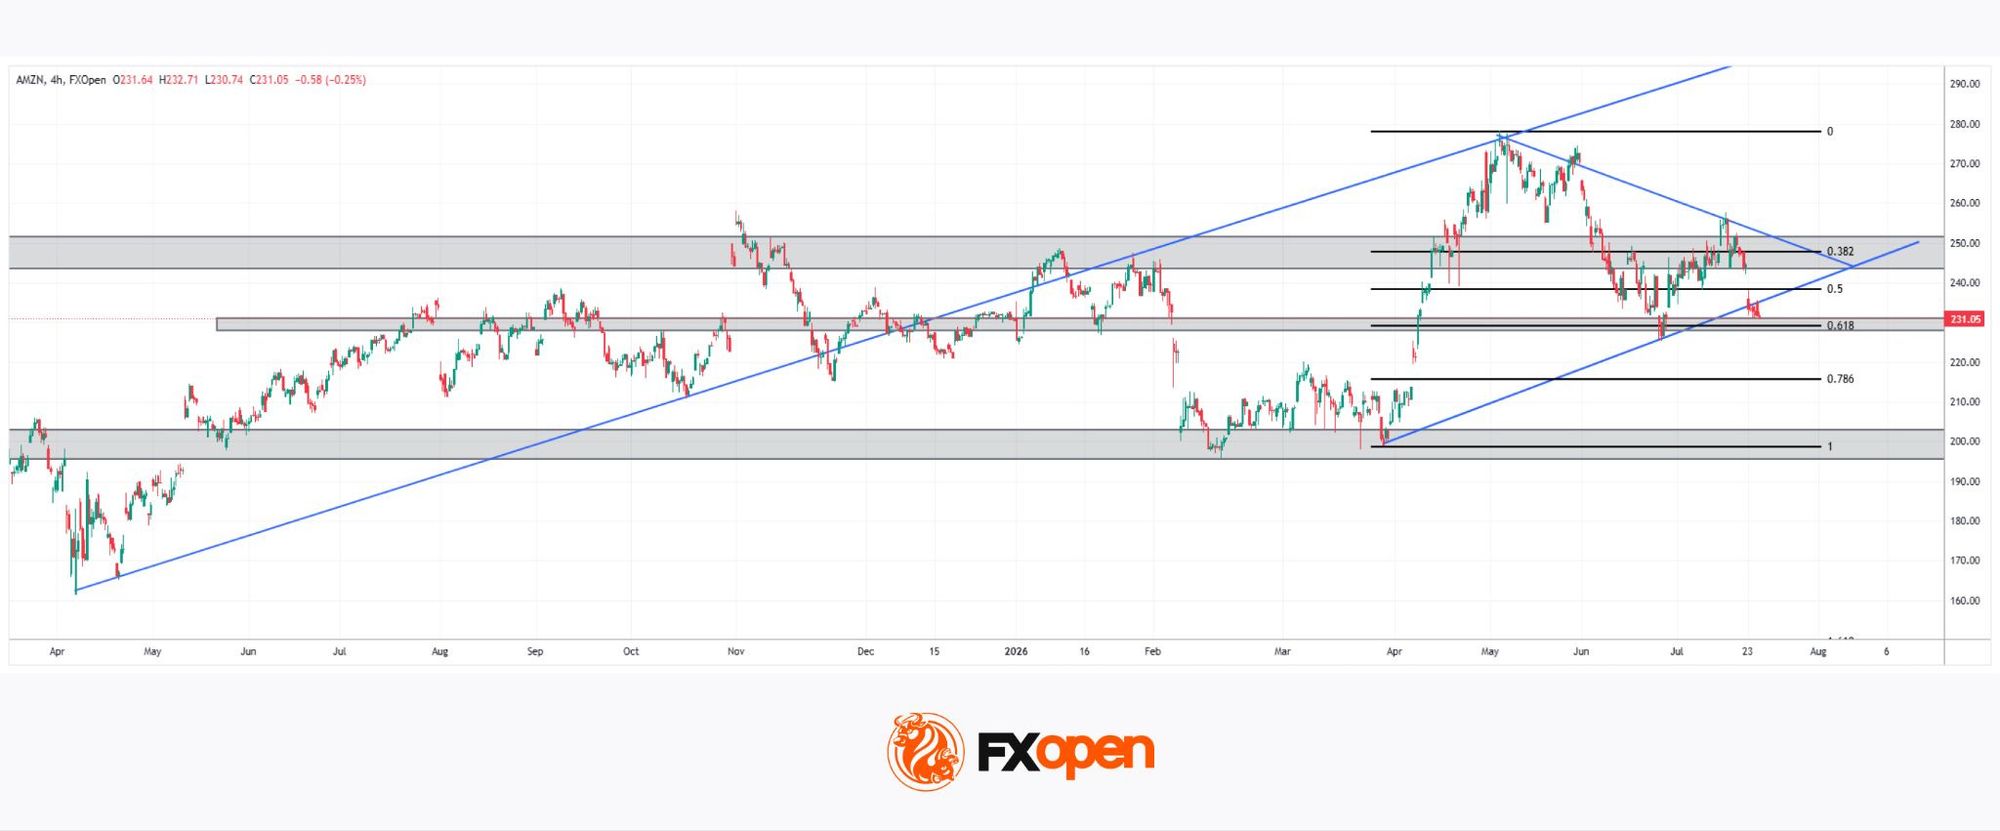
As the chart shows, Amazon stock has pulled back from April’s highs near $280 within a broader ascending channel, with price now testing the confluence of the rising trendline and the 0.618 Fibonacci retracement near $225-$230—precisely where Thursday’s earnings could prove decisive.
Bullish Scenario
Should Amazon deliver on the AWS acceleration Wall Street is now pricing in, a strong earnings beat could fuel a bounce off this trendline-Fibonacci confluence. A confirmed reclaim of the 0.5 retracement near $240, followed by a push back above the 0.382 level around $248, would put the broader uptrend firmly back in play, opening the door toward a retest of the channel’s upper boundary and the April highs.
Bearish Scenario
Conversely, a disappointing report—particularly around capex guidance or AWS margins—could send price breaking below both the ascending trendline and the 0.618 retracement. That would expose the deeper 0.786 level near $215, with a more severe reaction potentially dragging price back toward the $200 psychological support that has held since April.
With earnings landing squarely on this technical crossroads, AMZN stock’s next move could be one of the most consequential of the summer—will AWS’s AI story be enough to reignite the rally, or does the chart already know something the numbers don’t?
Buy and sell stocks of the world’s biggest publicly-listed companies with CFDs on FXOpen’s trading platform. Open your FXOpen account now or learn more about trading share CFDs with FXOpen.
This article represents the opinion of the Companies operating under the FXOpen brand only. It is not to be construed as an offer, solicitation, or recommendation with respect to products and services provided by the Companies operating under the FXOpen brand, nor is it to be considered financial advice.

Hyperscalers: A ‘Toxic Waste’ Investment

Hyperliquid probes 17.9% SK Hynix perp plunge

Kaitlan Collins Reacts to Donald Trump’s Dylan Mulvaney Dig

Renter of Home in Anne Heche Crash Denies Settlement With Son

No Jackpot Winner as $257 Million Prize Rolls Over to $269 Million Monday Draw

Weekend Open Thread: Staud – Corporette.com

NEW SOLO MONEY GLITCH IN GTA 5 ONLINE! SIMPLE METHOD FOR MAKING MILLIONS RIGHT NOW! PS4/PS5/XBOX

Huge financial angle on this viral quarter!! #pcgspartner #quarter #quarters #coin @PCGScoin

Money football teams actually earn at the FIFA World Cup 2026. #worldcup #fifa #money #earring
-

 Fashion4 days ago
Weekend Open Thread: Brooks Brothers
-

 NewsBeat7 days ago
How a former Blue Peter presenter stunned America’s Got Talent judges
-

 Tech1 day ago
Intel is reversing course and bringing hyper-threading back to its server chips
-
 Business6 days ago
New Jersey voter registration controversy explained: How 6,600 noncitizens got on the rolls, and what happens next
-
 Entertainment7 days ago
Johnny Depp’s R-Rated Gothic Cult Classic Gets New Release Ahead of Sydney Sweeney Remake
-

 Crypto World5 days ago
Ethics, other provisions in crypto Clarity Act to be further discussed
-

 Politics23 hours ago
Luke Littler dismantles Gerwyn Price to retain title in Blackpool
-
 Sports2 days ago
Commonwealth Games boxing: Jadumani Singh seals dominant 5-0 win over Pakistan’s Sumama Rehman to enter quarter-finals | Commonwealth Games News
-

 Sports4 days ago
2026 3M Open leaderboard: Scottie Scheffler finds putter in Round 1, sits three back
-

 Fashion4 days ago
16 Dresses for the High Summer Event
-

 News Videos5 days ago
The Peugeot Family: How 200 Years of an “Old Money” Dynasty Died in A Boardroom
-

 Politics2 days ago
Spain sweeps the board at 2026 World Cup with individual awards
-

 News Videos2 days ago
BITCOIN JUST ENTERED THIS CRITICAL ZONE…
-
 Entertainment4 days ago
A New Post-Apocalyptic Gundam Anime Series Blasts Into SDCC
-

 Politics1 hour ago
The Part of the Electric Transition Nobody Wants to Discuss
-

 Crypto World2 days ago
XRP Ledger adds $2.6B as RWA inflows rank second
-

 Tech3 days ago
Anthropic launches Claude Opus 5, a cheaper AI model for coding, agents and enterprise workflows
-

 Crypto World5 days ago
Uniswap (UNI) pushes deeper into tokenized RWAs with permissioned trading pools
-

 Crypto World3 days ago
Ripple bought a bank in pieces. The $4 billion audit
-

 Entertainment2 days ago
Sara Gilson Killed By Husband After Viral “Pedophile” TikTok Video
You must be logged in to post a comment Login