
Crypto World
Bitcoin price holds steady as short-term holders stay calm

Bitcoin price holds near $68,000 as short-term holders show restraint despite US-Iran war tensions.
Summary
- Bitcoin price is trading near the top of its weekly range between $62,900 and $69,300.
- Short-term holder exchange inflows remain muted despite geopolitical escalation.
- A daily close above $70,000 could shift short-term momentum.
Bitcoin (BTC) trades at $68,308 at press time, up 1.3% over the past 24 hours. The asset is positioned near the top of its seven-day range between $62,905 and $69,340, recovering from a sharp dip earlier in the week.
The larger trend, however, is still corrective. After reaching an all-time high of $126,080 in October 2025, Bitcoin has dropped about 45% from that peak. So far in 2026, it is down roughly 20%, reflecting continued pressure following last year’s rally.
Derivatives activity has increased over the past day. CoinGlass data shows trading volume rising 8.7% to $72.3 billion, while open interest has edged up 1.6% to $44.9 billion. When open interest climbs alongside price, it often suggests that new positions are being opened rather than closed.
Short-term holders are not rushing to sell
A March 1 analysis from a CryptoQuant contributor examined Bitcoin’s Short-Term Holder P&L to Exchanges metric. This indicator tracks whether recent buyers are sending coins to exchanges at a profit or a loss. Short-term holders tend to react quickly to fear-driven events and can amplify volatility.
According to the report, on Feb. 5–6, during a sharp market drop, roughly 89,000 BTC were sent to exchanges at a loss within 24 hours. That episode marked a clear capitulation from newer market participants. Since then, those loss-driven inflows have steadily declined.
The recent geopolitical escalation involving U.S. and Iran provided another stress test. Bitcoin briefly dipped toward the $63,000–$64,000 area, yet exchange inflows from short-term holders did not spike.
There was no surge in panic selling or aggressive profit-taking from this typically reactive group.
That shift is notable. Markets often stabilize once forced sellers have exited. The current data suggests much of the recent liquidation pressure may already have played out.
Selling from recent buyers has slowed, and weak hands seem to be less active. Whether or not this calm continues will be crucial going forward.
Seller fatigue would be evident if exchange inflows from short-term holders continued to be low. A sharp increase in realized losses would indicate a resurgence of stress.
Bitcoin price technical analysis
Since January, Bitcoin has continued to move within a downward structure marked by lower highs and lower lows. The recent rebound comes after a sharp decline, and the price is currently consolidating rather than showing a strong trend in either direction.
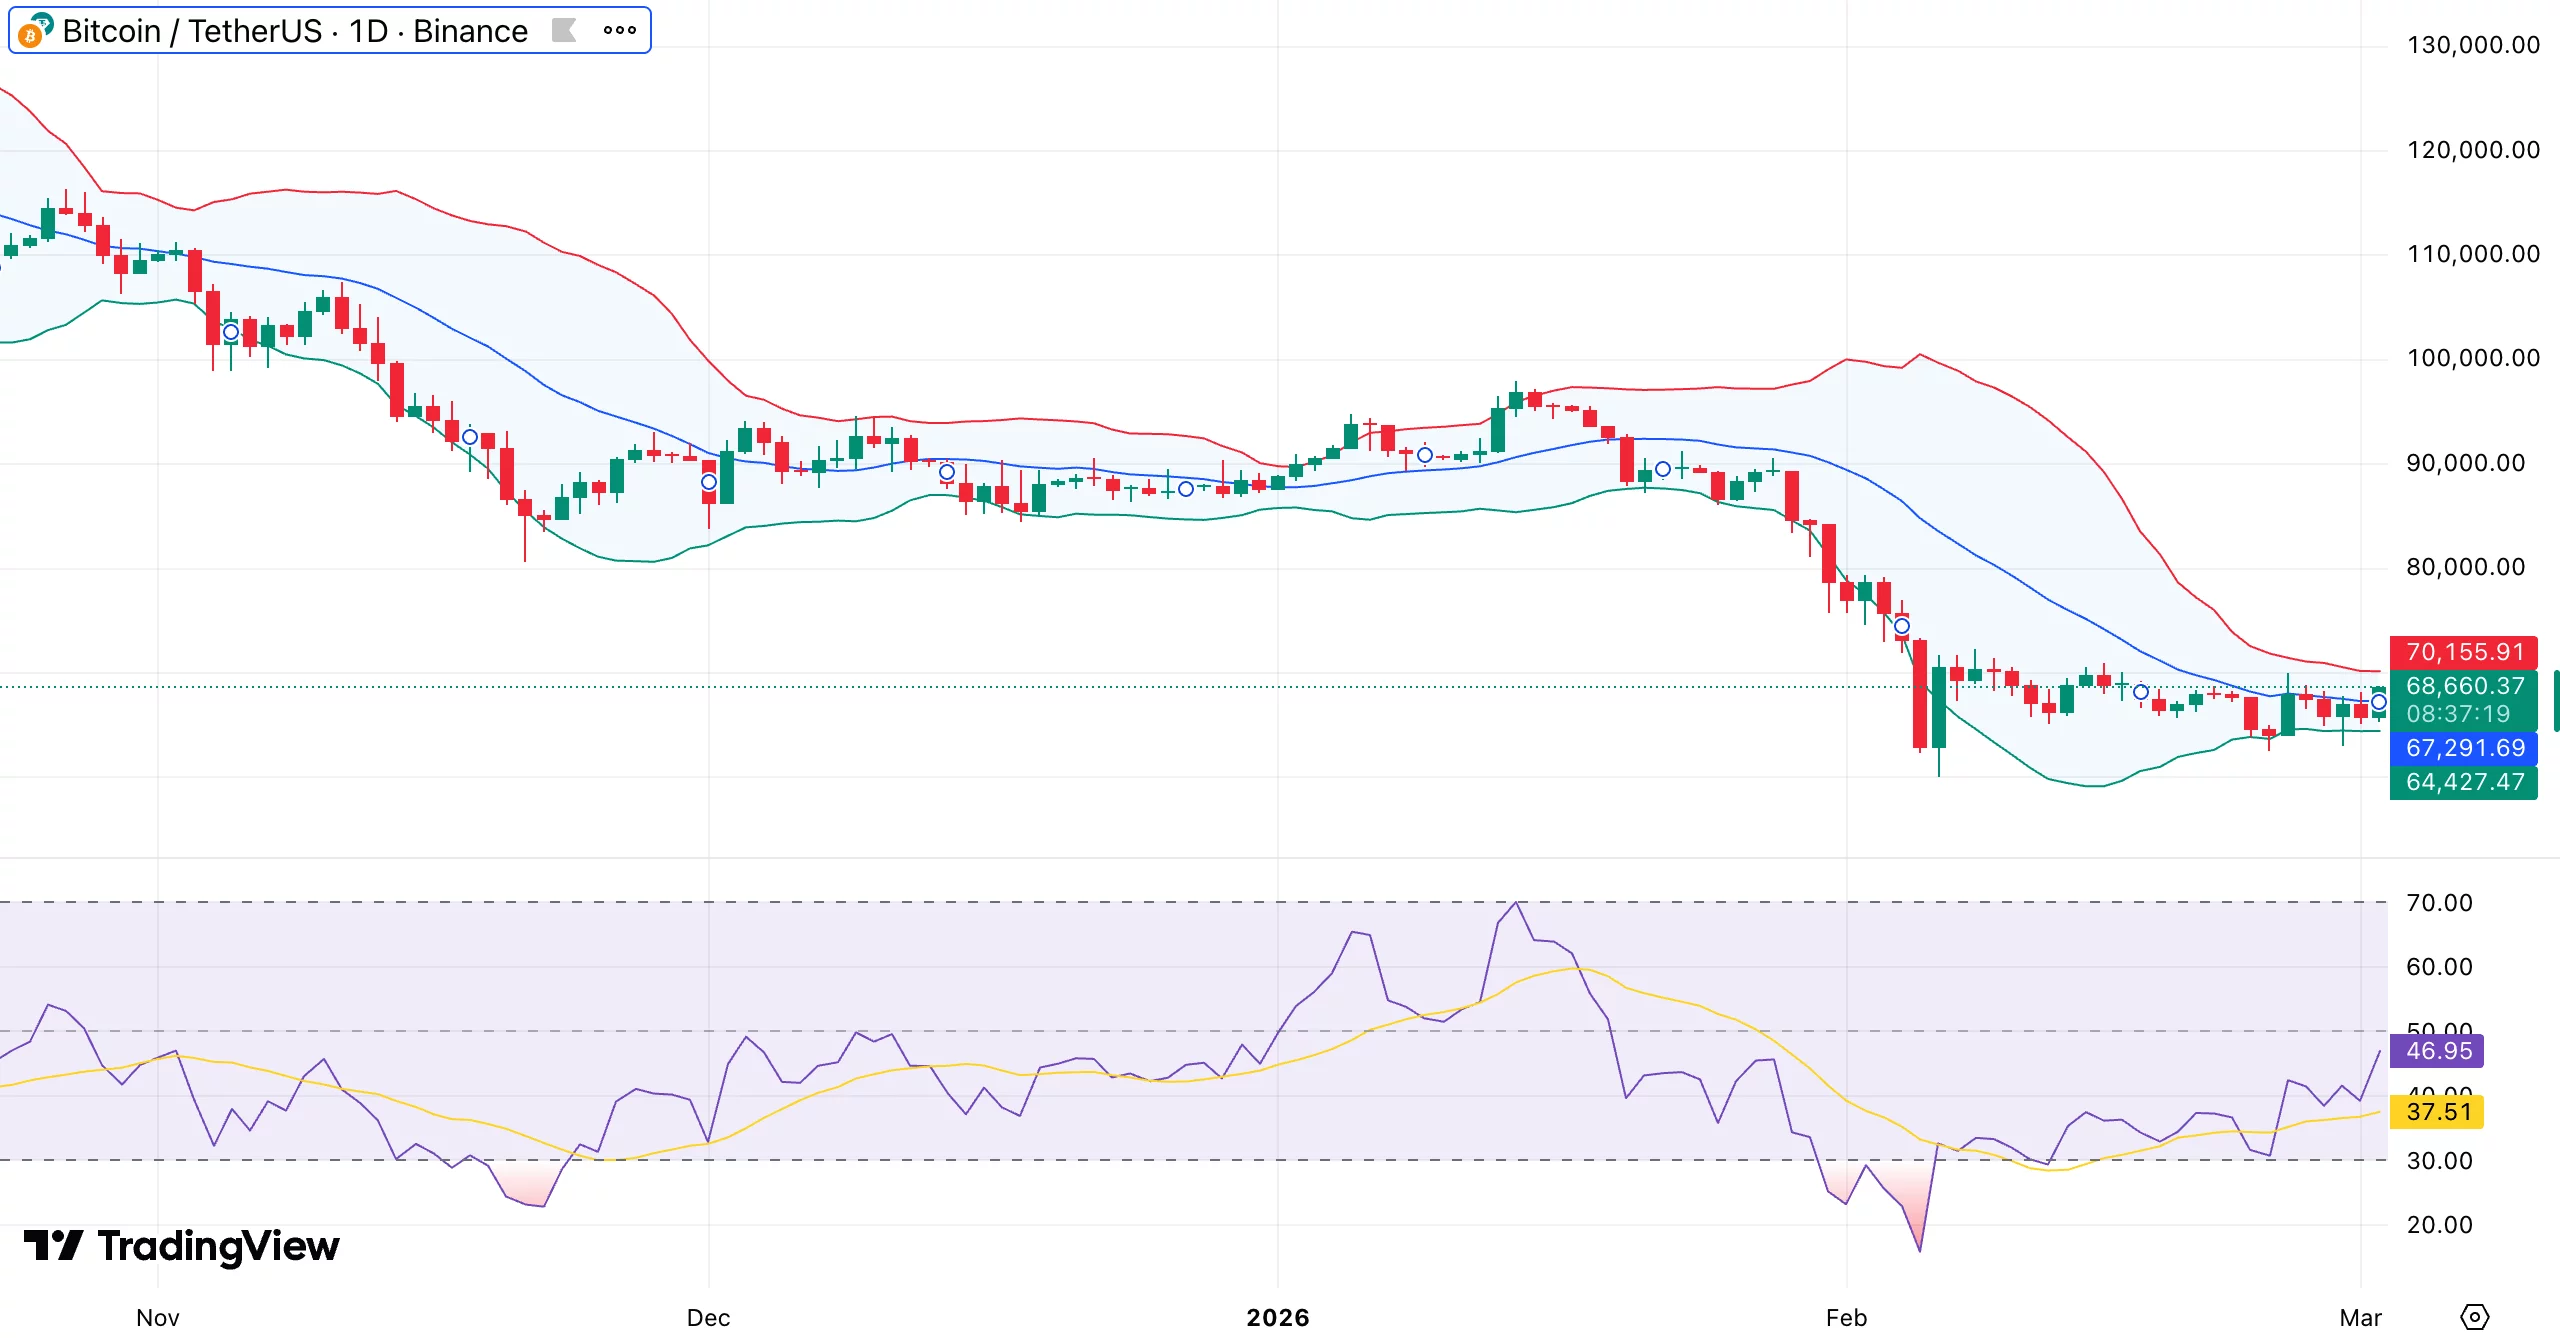
Bollinger Bands show that before rising, Bitcoin touched the lower band around $64,400. At $67,300, it currently trades near the middle band. The upper band, near $70,100, marks immediate resistance.
A rejection in the $70,000–$71,000 zone would keep pressure on the upside, while a strong daily close above that area could shift short-term momentum.
The relative strength index has climbed from oversold levels in the low 20s to around 47. Momentum is improving, though it has not crossed above 50, a level often associated with stronger buyer control.
The current structure resembles a sharp impulse lower followed by sideways compression, which can develop into a bear flag. If that pattern resolves downward, a return to the low $60,000s becomes plausible.
Support sits between $64,000 and $65,000. If that area fails, the next psychological level near $60,000 could come into focus.


TLDR:
- The Solana Foundation reports 15 million on-chain agent payments already processed on its network
- Stablecoins are emerging as the default payment rail for AI agents buying computational resources.
- Vibhu Norby says 95 to 99% of future crypto transactions will originate directly from AI agents.
- Solana developers are building machine-readable skill files and AI-first platforms for agents.
Solana is positioning itself as core infrastructure for an emerging “agentic” internet. The Solana Foundation reports the network has already processed 15 million on-chain agent payments.
Stablecoins are emerging as the default payment rail for AI-driven compute and services. Vibhu Norby, the foundation’s chief product officer, shared these updates at the Digital Asset Summit in New York on March 25, 2026. This shift, he said, could change how the internet is monetized at its core.
Solana Emerges as the Default Payment Layer for AI Agents
The Solana Foundation is making a strong case for the network’s role in machine-to-machine commerce. Norby confirmed the network has already “processed 15 million payments onchain from agents,” pointing to real and measurable activity.
He added that “the programmatic aspect of crypto payments is what is making it interesting for agents.” Stablecoins, he noted, are “going to be the default thing that agents use to pay for any computational resource.”
Traditional payment systems are not built to handle sub-cent, pay-per-use transactions at scale. Norby pointed to this gap directly, stating that agentic payments support low-cost, high-frequency activity that “traditional rails cannot handle.”
Solana’s performance-focused design addresses this need efficiently. This gives the network a clear edge as AI-driven commerce continues to grow across industries.
Norby described AI agents as logical and performance-driven systems that prioritize results over loyalty. “Agents are cold, calculated machines… they don’t subscribe to crypto religiosity,” he told panelists at the summit.
He went further, noting that “if you ask an agent what’s the best way to pay for something with crypto, most of the time, Solana is showing up at the top.” This positions Solana not by preference, but by performance.
The 15 million on-chain agent payments already processed reflect steady, measurable real-world activity on the network. This figure confirms that machine-to-machine commerce is gaining ground on Solana.
As AI systems scale globally, transaction volumes from agents are expected to increase substantially over time.
Agentic Payments Signal a Broader Shift in Internet Monetization
Beyond payments, the Solana Foundation is watching a wider platform transformation take shape across the tech sector.
Norby stated that “AI is not really a vertical. It’s a platform shift… affecting everything across every industry, including crypto.”
He argued that “agentic payments are probably going to change the entire way that the internet is monetized.” This framing sets the stage for entirely new internet business models built around autonomous agents.
Developers on Solana are already building tools designed directly for AI systems to use. Norby noted that “what agents like is APIs and documentation and skills,” pointing to machine-readable skill files and AI-first developer platforms.
The aim is to make Solana more accessible for agents through clean, structured tooling. This active development effort reflects a deliberate shift in how the ecosystem is being built.
Advances in AI are also removing long-standing technical barriers for developers working across ecosystems. Machines and developers can now build cross-platform tools more easily than before.
This opens room for more AI-native applications and cross-chain solutions to take hold on Solana. The result is a more open and developer-friendly network overall.
Looking ahead, Norby expects AI agents to become the standard interface through which people interact with crypto.
He projected that “the default way people will interact with crypto is going to be through their agent… 95 to 99% of all transactions… will be coming from LLMs.” Agentic payments, in his assessment, are set to transform the entire way the internet operates financially.


- Ondo price hovered around $0.26 on Thursday.
- A partnership with Franklin Templeton brings $1.7 trillion AUM ETFs on-chain.
- The real-world assets market continues to attract institutional adoption.
The Ondo token traded higher after Ondo Finance announced a key partnership with Franklin Templeton, the global asset manager overseeing $1.7 trillion in assets under management (AUM).
According to the Ondo Finance team, this collaboration is about tokenizing Franklin Templeton’s ETFs to bolster adoption via on-chain access.
The move comes as traditional investment products get increased attention through real-world assets (RWA).
Franklin Templeton’s tokenized ETFs now live on Ondo Global Markets, including the Growth ETF, Income Equity focus ETF and High Yield Corporate ETF.
This launch sees Ondo, a leading RWA protocol, continue to expand its ecosystem. It’s attracting institutional interest amid rising demand for tokenized securities.
“Franklin is partnering with Ondo to have all their ETFs be tokenized so people on-chain can enjoy the awesomeness of cheap beta,” Bloomberg senior ETF analyst Eric Balchunas noted via X.
“Like I’ve been saying, tokenization isn’t a threat to ETFs, on the contrary, it’s a distribution mechanism.”
Ondo, Chainlink and Avalanche are some of the coins riding high on the tokenized assets narrative.
Adoption trends across the globe, with major banks and other top financial institutions keen on a piece of the cake, mean notable long-term gains for ONDO among others.
“Financial assets are becoming software. And as more assets move into the digital wallet-based ecosystem, there’s endless potential for their on-chain utility,” Franklin Templeton’s Robert Crossley said at a tokenization summit in London.
Ondo price analysis
Ondo (ONDO) price reacted bullishly to the announcement, climbing to highs of $0.273.
Despite the optimism around tokenization and real-world assets, RWA ecosystem tokens mirror the broader market in terms of recent performance.
Ondo has traded lower since hitting resistance around $2.00 in late 2024.
The downtrend accelerated below $1.00 in September 2025, with Ondo hitting multi-year lows as cryptocurrencies fell in February this year.
From a technical perspective, key support holds at $0.24 (recent swing low) and $0.21. The latter provides a solid reload zone amid broader market volatility.
Meanwhile, resistance looms at $0.28, with a breakout potentially targeting $0.50.
If Bitcoin maintains stability above $70,000, the next leg up could see ONDO test the $1 mark. Hurdles above this psychological level would be around $1.20 and $1.50.
However, macroeconomic risks like US Federal Reserve rate decisions could combine with geopolitical shocks to cap gains.
BTC is eyeing the $75,000 mark, but an escalation in the Iran war could plunge prices to lows of $50,000.

Cardano just dropped to $0.257, down 5%, as one of the worst performers today, even after a landmark regulatory ruling just hit the tape that is pushing its price prediction to bullish. The SEC and CFTC officially classified ADA as a “digital commodity” earlier this week, stripping away the securities ambiguity that has shadowed the asset for years.
The joint SEC/CFTC designation covers 16 cryptocurrencies in total, meaning Cardano shares the regulatory tailwind with a crowded field of competitors. Still, the ruling carries specific implications for ADA: staking services that previously operated in a legal grey zone are now on firmer ground, and airdrop distributions across the Cardano ecosystem are no longer treated as securities offerings under most standard conditions.
— Our Crypto Talk (@ourcryptotalk) March 17, 2026
 The SEC and CFTC Just Named
16 Crypto Assets as "Digital Commodities”
• Aptos (APT)
• Avalanche (AVAX)
• Bitcoin (BTC)
• Bitcoin Cash (BCH)
• Cardano (ADA)
• Chainlink (LINK)
• Dogecoin (DOGE)
• Ethereum (ETH)
• Hedera (HBAR)
• Litecoin (LTC)
• Polkadot (DOT)
•… pic.twitter.com/GFiJmlQOJr
Discover: The best pre-launch token sales
Cardano Price Prediction: Can ADA Price Recover to $0.30 Soon?
Institutional capital that sat on the sidelines over compliance concerns now has fewer excuses. Meanwhile, network-level catalysts are stacking, the van Rossum hard fork is slated for April, the Midnight privacy sidechain mainnet approaches, and whale wallets accumulated $161M in ADA over the past 48 hours while TVL crossed $1.1B.
The macro backdrop remains a headwind. US CPI data and a March Fed meeting have kept risk appetite compressed across the broader crypto market, and ADA’s chart still sits in a defined downtrend below key moving averages. The regulatory win is real, but price action doesn’t always care about fundamentals on a short timeframe.
ADA is consolidating in a tight band between $0.24 and $0.3, with neutral daily RSI at 47, neither oversold enough to trigger aggressive dip-buying nor strong enough to signal momentum.

Motley Fool analyst Dominic Basulto has floated a $1.00 ADA target for 2026, a 250% return from here, contingent on spot ETF approvals and sustained institutional inflows. That’s a compelling long-term thesis. Short-term, the chart needs to clear $0.30 to confirm any trend reversal is actually underway.
Discover: The best crypto to diversify your portfolio with
LiquidChain Targets Early-Mover Upside as Cardano Tests Key Resistance
ADA’s regulatory clarity is a step forward, but a commodity classification at a $0.27 price point still leaves investors waiting for a catalyst chain to actually fire. For traders unwilling to sit through months of SMA compression, early-stage infrastructure plays offer a different risk-reward geometry altogether.
LiquidChain ($LIQUID) is a Layer 3 infrastructure project positioning itself as the cross-chain liquidity layer, fusing Bitcoin, Ethereum, and Solana liquidity into a single execution environment. The core proposition: developers deploy once and access all three ecosystems simultaneously via a Unified Liquidity Layer, Single-Step Execution, and Verifiable Settlement architecture.
Things are heating up.
The Order grows.⟁https://t.co/vqvBcdSQYC pic.twitter.com/2vIhIFSyKX
— LiquidChain (@getliquidchain) March 26, 2026

The presale is live at $0.014 per $LIQUID, with more than $600K raised to date. The deploy-once architecture addresses one of DeFi’s most persistent friction points, fragmented liquidity across siloed chains, which gives the project a use case that extends well beyond the current market cycle.
Research LiquidChain’s presale here.
This article is for informational purposes only and does not constitute financial advice. Crypto assets are highly volatile. Always conduct your own research before investing.
The post Cardano Price Prediction: Time to Buy ADA Right Now? appeared first on Cryptonews.

Gold price just broke its own mythology, and this is somewhat resulting in a bearish analysis. The metal that traders have leaned on through wars, recessions, and currency crises dropped 14% this month, not because the world got safer, but because a de-escalation headline was enough to trigger a mass exit.
Meanwhile, Bitcoin is trading just below $70,000, posting a 10% gain in a month while Gold bled. That divergence is the story. Donald Trump announced a five-day delay to military strikes on Iran following what he described as “very good and productive” talks, with discussion of joint Strait of Hormuz management and Iran’s potential agreement to halt nuclear pursuits 2 days ago.
Iran subsequently denied negotiations, triggering a partial recovery in gold, but the damage was done. Oil markets reacted similarly, with risk-on flows rotating out of traditional safe havens at speed. The broader question now: is gold’s safe-haven status structurally impaired, or just temporarily out of fashion?
Discover: The best crypto to diversify your portfolio with
Gold Price Analysis: Can XAU Reclaim $5,000, Or Is the Safe-Haven Trade Broken?
Gold’s price mechanics have changed. After surging to an all-time high near $5,600 per ounce in late January, effectively double its level from a year prior, XAU has shed roughly 20% from its peak. The Iran de-escalation headlines accelerated the decline, pulling gold down nearly 15% since early March alone before Iran’s denial softened the drop. Intraday losses mostly recovered after that denial, but the pattern is telling.
The core issue is financialization. Derivatives exposure and ETF flows now dominate gold’s price action more than physical demand or genuine crisis hedging. When risk-on sentiment flips, institutional desks unwind paper gold positions fast, faster than any geopolitical nuance can absorb. That’s not a bug in modern markets; it’s the feature.
Gold is still up almost 300% over the past decade by historical measure. But Santiment data notes Bitcoin is outpacing traditional assets including the S&P 500 and gold amid the current Middle East conflict cycle. The correlation is breaking. That matters for portfolio allocation decisions made this week.
Discover: The best pre-launch token sales
LiquidChain Targets Early-Mover Upside as Gold Tests Key Levels
Gold’s 10% drawdown in three weeks is a useful reminder: even “safe” assets carry rotation risk when macro narratives shift overnight. Traders watching XAU underperform Bitcoin by more than five percentage points since March 4 are already asking where early-stage upside lives, before a narrative becomes consensus. Historical macro dislocations have repeatedly front-run crypto allocation shifts, and the current setup is no different.
A new layer emerges. Only a few see it first. — LiquidChain (@getliquidchain) March 24, 2026
The future is LiquidChain ⟁https://t.co/vqvBcdSj94 pic.twitter.com/R7ZeZ0NPGl
LiquidChain ($LIQUID) is a Layer 3 infrastructure project positioning itself as the cross-chain liquidity layer — fusing Bitcoin, Ethereum, and Solana liquidity into a single execution environment. The architecture is built around four pillars: a Unified Liquidity Layer, Single-Step Execution, Verifiable Settlement, and a Deploy-Once Architecture that lets developers ship once and access all three ecosystems simultaneously.
The presale is currently priced at $0.01435, with more than $600K raised to date. LiquidChain has drawn attention as cross-chain infrastructure demand grows alongside multi-ecosystem trading activity. The presale also rewards stakers with more than 1700% APY in staking rewards, and is audited by Certik for safety.
Review the LiquidChain presale details here.
This article is not financial advice. Crypto assets are highly volatile. Always conduct your own research before making investment decisions.
The post Gold Price Analysis: Why US-Iran Tension Drops XAU Price appeared first on Cryptonews.
Key Takeaways
- Reflection AI is pursuing funding that would value the Nvidia-backed company at $25 billion
- The AI startup aims to secure $2.5 billion, representing over three times its prior $8 billion assessment
- JPMorgan Chase may participate via its security-oriented investment division
- Founded by former Google DeepMind team members, Reflection AI develops open-source AI systems and developer tools
- The company focuses on sovereign AI collaborations with U.S. partner nations to challenge China’s AI advancement
Reflection AI, an artificial intelligence startup with Nvidia backing, is pursuing $2.5 billion in fresh capital at a $25 billion valuation, the Wall Street Journal reports. This represents more than a threefold increase from its approximately $8 billion valuation in its previous funding round.
Launched in 2024 by alumni of Google DeepMind, the venture specializes in creating AI solutions for software developers, such as coding assistance platforms. In collaboration with Nvidia, the company produces open-source artificial intelligence frameworks accessible to enterprises, governmental bodies, and academic institutions at no cost.
Nvidia has committed approximately $800 million to Reflection AI thus far. Beyond capital, the semiconductor giant actively facilitates customer introductions, including foreign governments seeking to establish independent AI infrastructure.
Reports indicate JPMorgan Chase is evaluating participation in this funding initiative through its security-centered investment arm. Disruptive, an existing backer, is anticipated to contribute additional capital as well.
Reflection AI has accumulated over $2 billion in total funding to date. However, the organization remains in early revenue generation stages.
National AI Infrastructure Strategy
Among Reflection AI’s most significant recent achievements is a partnership with South Korea’s Shinsegae Group to develop Korean-language artificial intelligence frameworks. This initiative will operate on thousands of Nvidia processors.
The startup intends to replicate this model across global markets. Its objective centers on becoming a leading provider of “sovereign AI” — artificial intelligence infrastructure developed and governed by individual nations or American allies.
This approach directly addresses competition with China’s accelerating AI development. U.S. policymakers have prioritized establishing a domestic AI infrastructure, with Reflection AI positioned as a central component of this initiative.
Open-Source Models and Nvidia’s Ecosystem Play
Reflection AI represents one of multiple startups working intimately with Nvidia to develop sophisticated AI frameworks optimized for its hardware architecture. These open frameworks offer flexibility for deployment across diverse sectors.
Nvidia’s engagement extends well beyond financial investment. The chipmaker proactively connects Reflection AI with prospective clients and assists in expanding its partnership ecosystem.
Financial analysts maintain optimistic projections for Nvidia. TipRanks shows the stock carries a Strong Buy consensus rating, supported by 41 buy recommendations and a single hold rating across the last three months. Analysts’ average price target of $273.34 suggests approximately 53% potential upside from present trading levels.
JPMorgan Chase’s prospective involvement creates an intriguing dynamic, connecting two influential financial sector participants — a banking institution and a chip manufacturer — to a single AI company’s expansion trajectory.
Despite being established less than two years ago, Reflection AI has secured billions in investment commitments and forged partnerships spanning multiple nations.


- Ethereum (ETH) price shows early signs of a potential bullish trend reversal.
- On-chain data suggests accumulation and weakening selling pressure.
- A break above $2,300 could trigger further upside momentum.
Ethereum has slipped below the $2,200 mark, but the broader picture suggests something more interesting is unfolding beneath the surface.
The recent dip reflects short-term weakness, although it does not fully capture the growing signals pointing toward a potential shift in trend.
While the price action over the past week shows mild selling pressure, zooming out reveals that Ethereum is still holding onto gains built over the last month.
This creates a mixed environment where caution and optimism exist side by side.
On-chain signals a possible rebound
One of the most notable indicators is the MVRV ratio, which recently dipped into a zone that has historically marked undervaluation.
This level often appears when investors are sitting on losses, a condition that tends to precede accumulation.
In simple terms, weaker hands exit while stronger hands quietly step in.
Momentum indicators are also starting to shift in favour of buyers.
A key trend-following signal has flipped bullish for the first time in months, suggesting that selling pressure may be losing strength.
This does not guarantee an immediate rally, but it does indicate that the balance between buyers and sellers is beginning to change.
At the same time, Ethereum has been trading within an ascending triangle on the weekly chart, a structure that often leads to a breakout.
As Ethereum $ETH recovers, these are the MVRV Pricing Bands that could act as resistance:
• $2,356
• $2,647
• $3,639
• $4,632
• $5,624https://t.co/DSj59wXjWE— Ali Charts (@alicharts) March 25, 2026
Such patterns do not always resolve upward, but when combined with improving on-chain data, the probability of a bullish outcome increases.
Bitcoin’s quantum-resistance lag supports a rebound
Beyond technicals, a longer-term narrative is quietly gaining traction in the background.
Concerns around quantum computing and its potential impact on blockchain security are starting to enter the conversation.
In a recent post on X, Nic Carter, the founding partner at Castle Island Ventures, stated, “The only thing that matters is how quickly blockchain developers recognise that they need to bake in cryptographic mutability into their networks.”
While this threat remains distant, it is serious enough to influence how investors think about the future.
The key difference lies in how networks are preparing for it.
Ethereum appears to be moving toward adapting its cryptographic systems over time, with plans that acknowledge the need for future upgrades.
Bitcoin, on the other hand, faces a more complex path due to its conservative approach to change.
This contrast could eventually shape investor perception.
If Ethereum is seen as more adaptable, it may gain an edge in long-term positioning.
Narratives like this do not move markets overnight, but they often build slowly before having a powerful impact.
In this case, the idea of being “future-ready” could become a meaningful driver of demand.
The targets in case of a bullish reversal
For now, price levels remain the clearest guide for what happens next.
Ethereum is currently trading below a key resistance zone that sits just above $2,355.

A clean break above this level would be the first strong sign that buyers are regaining control.
If that happens, analysts note that the next target to watch lies around $$2,525.
These levels have previously acted as barriers and are likely to attract attention again.
Beyond that, the path opens toward the higher ranges last seen during previous rallies.
However, none of this unfolds unless the market confirms the shift.
On the downside, support around $1,939 remains critical.
A drop below that level would weaken the bullish case and suggest that more time is needed before any sustained recovery.

Ethereum price is holding just above $2,100, dropping by 2% in 24 hours, and the supply picture underneath that price action and prediction is becoming harder to ignore. Exchange reserves have collapsed to their lowest level since 2016, staking absorption is accelerating, and analysts are split between a $7,500 end-year target and a weekly chart pattern that could cut ETH in half.
Right now, we wait because the next 72 hours around the $2,160–$2,180 neckline may determine which scenario plays out first.
Is the ETH supply crunch accelerating? — Declan Barrett
Data shows tightening liquid supply via net outflows, rising staking, and falling exchange reserves.
This contraction could signal a major shift.
Options flow anticipated.
Strategy: Scale in.  pic.twitter.com/QFUpjcKBc6
 (@declan_bar_styl) March 26, 2026
Data confirms ETH exchange supply has hit multi-year lows, with Binance-specific balances hovering near 3.3 million ETH, levels last seen in December 2020. Approximately 38.1 million ETH sits locked in staking, 33.1% of the circulating supply, a record, with the validator entry queue holding 2,876,752 ETH against an exit queue of just 40,504 ETH.
Whether that structural argument translates into near-term price strength depends entirely on whether ETH can hold and reclaim a critical technical zone that bulls have been defending since earlier this month.
Discover: The best crypto to diversify your portfolio with
Ethereum Price Prediction: Will ETH USD Reclaim $2,400 Before the Weekly Head-and-Shoulders Takes Over?
ETH is down by more than 40% of its all-time high, but a confirmed break above the $2,400 zone opens a measured move toward $2,600, with Changelly projecting $2,401 as the March peak and $2,241 by March 28.
The Fear & Greed Index sits at 32 fear, with only a little of technical indicators flashing bullish, the kind of sentiment reading that historically precedes either capitulation or a sharp short-squeeze reversal.
The RSI reads neutral at 49-53 suggests trend strength is building but not yet committed. Key supports stack at $2,050, then $1,830 and $1,790. Lose $1,790 and the weekly head-and-shoulders pattern, which targets $1,320, becomes the dominant technical narrative. Bears will maintain control until a convincing $3,000 reclaim materializes, per multiple analysts tracking the setup.

Standard Chartered’s $7,500 end-2026 call remains the bull case, but that view requires Federal Reserve rate cuts, ETF inflow recovery, and sustained Layer 2 TVL growth to all line up simultaneously.
Discover: The best pre-launch token sales
LiquidChain Targets Early-Mover Upside as Ethereum Tests Key Levels
ETH’s structural supply squeeze tells a compelling long-term story, but right now, the near-term upside is capped by heavy resistance and a macro environment still priced for fear. Traders who want asymmetric exposure to the same liquidity fragmentation problem that’s been pressuring Ethereum’s growth narrative are looking one layer deeper.
A new layer emerges. Only a few see it first. — LiquidChain (@getliquidchain) March 24, 2026
The future is LiquidChain ⟁https://t.co/vqvBcdSj94 pic.twitter.com/R7ZeZ0NPGl
LiquidChain ($LIQUID) is a Layer 3 infrastructure project positioning itself as the cross-chain liquidity layer, fusing Bitcoin, Ethereum, and Solana liquidity into a single execution environment. The architecture centers on four components: a Unified Liquidity Layer, Single-Step Execution, Verifiable Settlement, and a Deploy-Once Architecture that lets developers access all three ecosystems without redeploying contracts.
The presale is currently priced at $0.014 with more than $600K raised to date, and a huge 1700% APY in staking rewards. Research LiquidChain here before the current round closes.
This article is not financial advice. Cryptocurrency investments are volatile. Always do your own research before committing capital.
The post Ethereum Price Prediction: Exchange Supply Lowest Since 2016 appeared first on Cryptonews.

Bitcoin Depot has named former MoneyGram chief executive Alex Holmes as its new chief executive as the crypto ATM operator faces growing pressure from US regulators.
Summary
- Bitcoin Depot appoints Alex Holmes as CEO after Scott Buchanan exits within three months.
- Multiple US states accuse Bitcoin Depot of excessive fees scam exposure and weak compliance controls.
- Company cuts revenue outlook as regulatory pressure and enforcement actions weigh on crypto ATM operations.
The leadership change comes as several states step up action against crypto kiosk companies over scam losses, fees, and compliance controls.
Bitcoin Depot said on Tuesday that Scott Buchanan stepped down as chief executive effective immediately after less than three months in the role. In a regulatory filing, the company said his resignation ”was not due [to] a disagreement.”
The company appointed Alex Holmes, who already served on the board, as chief executive and chair. Holmes spent 16 years at MoneyGram in senior roles, including chief financial officer and chief executive, where compliance and regulated payments were central parts of the business. He said,
”As I step into the role, my priorities are operational stability, regulatory progress, and accelerating the Company’s evolution into a more diversified fintech platform.”
The management change arrived as Bitcoin Depot faces action in several states. In Connecticut, the state banking regulator suspended the company’s money transmission license and issued a temporary cease-and-desist order on March 9, citing alleged violations that included excessive fees, weak compliance, and incomplete refunds to scam victims.
Massachusetts also sued Bitcoin Depot in February. State officials alleged the company overcharged consumers, failed to take proper steps against scam activity, and refused some refunds. Maine and Missouri also took action earlier this year, while Iowa sued Bitcoin Depot and CoinFlip in 2025 over claims that scammers moved millions of dollars through their kiosks.
Bitcoin Depot also said founder Brandon Mintz moved from executive chair to a non-executive board role and will serve as an adviser to Holmes. The company is now trying to steady operations while its compliance position remains under review in several markets.
Earlier this month, Bitcoin Depot cut its 2026 outlook and said revenue could fall 30% to 40% because of what it called a ”dynamic regulatory environment.” Shares closed Wednesday at $2.62, down 6.6% for the day, though the stock rose after hours. The company’s shares are down sharply from their June 2024 peak.
Crypto ATM scrutiny keeps rising
Regulators across the US have increased attention on crypto ATMs as fraud cases grow. Industry reports and state enforcement actions have tied the machines to scam complaints, especially cases involving older consumers and high fees.
That backdrop makes Holmes’ compliance record a central part of Bitcoin Depot’s next phase. The company now faces pressure to improve controls while protecting its position in the crypto ATM market.
Corporate bitcoin buying has narrowed to a single company, and the trade that was supposed to broaden the asset’s institutional base is now a concentration risk.
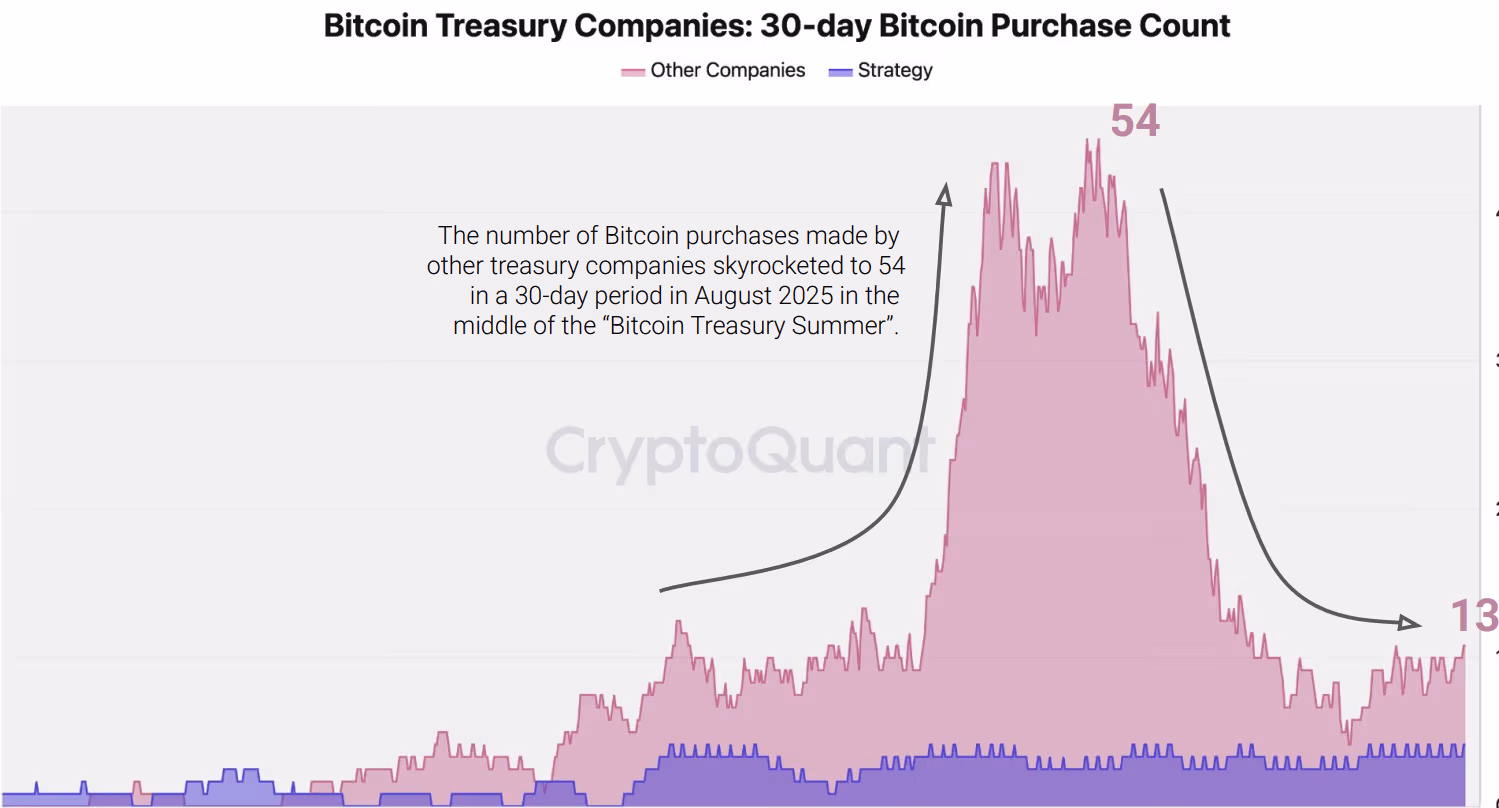
Strategy, the largest corporate bitcoin holder in the world, purchased roughly 45,000 BTC over the past 30 days, its fastest accumulation pace since April 2025, according to a CryptoQuant report published this week.

Every other treasury company combined bought approximately 1,000 BTC in the same period, a 99% decline from a peak of 69,000 BTC in August last year. Their share of total purchases has collapsed to 2%, from 95% at the height of the trade.

Michael Saylor’s Strategy now holds roughly 76% of all bitcoin held by treasury companies, according to CryptoQuant data.
The numbers confirm what Galaxy Digital warned about last summer. In a July report, Galaxy argued that the digital asset treasury company model was fundamentally a liquidity derivative that worked only as long as equities traded at a premium to their underlying bitcoin holdings.
Once those premiums compressed, the flywheel would reverse: lower prices would shrink net asset values, squeeze out the equity premium, and make share issuance dilutive rather than accretive.
That scenario has played out almost exactly as described.
In July and August of 2025, the DATCO summer when these companies were accumulating, BTC was trading north of $110,000. Now, it’s trading under $70,000, according to CoinDesk market data, as it slowly recovers from the crash of October 10.
Companies that bought aggressively near the cycle top, including Metaplanet and Nakamoto Holdings, carried average costs above $107,000 as of December, according to Galaxy’s analysis, putting them deep underwater at current prices.
Strategy has moved to insulate itself, disclosing in December a $1.44 Billion cash reserve with the goal to eventually build this up to a point to cover 24 months of dividend and interest obligations.
That defensive posture has not slowed its buying. But the CryptoQuant data makes clear that no other firm is keeping pace, and most have stopped trying.
The result is a far more concentrated demand profile than the market was promised.
At Bitcoin Asia in Hong Kong last summer, treasury firms pitched themselves as a scalable new class of corporate buyers that could absorb bitcoin supply and outperform passive exposure.
For now, that vision has narrowed to a single balance sheet.

Key Highlights
- Shares of Intel and AMD each climbed approximately 7% following revelations of upcoming CPU price increases between 10% and 15%
- According to Nikkei Asia, both semiconductor manufacturers informed clients that pricing adjustments would take effect beginning in March and April
- Intel attributed the price changes to “sustained demand, increased component and material costs” among other factors
- These adjustments represent the latest in a series of price hikes implemented throughout the current year, accompanied by extended delivery timelines
- The wider semiconductor sector index advanced 1%, with notable gains for Nvidia, Marvell, and Qualcomm
Shares of Intel and AMD experienced significant upward momentum on Wednesday following revelations that both semiconductor manufacturers are implementing price increases across their central processing unit portfolios. The announcement propelled both companies to the forefront of the S&P 500’s top-performing stocks for the trading session.
Advanced Micro Devices, Inc., AMD
According to a report published by Nikkei Asia, both Intel and AMD have communicated upcoming pricing adjustments to their customer base for their CPU product ranges. These modifications are scheduled to commence during March and April, with typical increases falling within the 10% to 15% range. Certain product categories may experience even more substantial price adjustments.
Intel validated these developments in an official statement provided to Investopedia. A company representative indicated that the pricing modifications account for “sustained demand, increased component and material costs, and evolving market dynamics.” AMD has not yet provided commentary on the matter.
Intel shares appreciated by approximately 7% during Wednesday’s trading session. The stock has accumulated nearly 20% in gains year-to-date for 2026, fueled partly by positive sentiment surrounding governmental backing for domestic semiconductor production and speculation regarding potential new customer partnerships.
AMD’s stock similarly advanced roughly 7% during the session. Nevertheless, the shares remained down approximately 4% for the year prior to Wednesday’s trading. Market participants have expressed reservations about AMD’s competitive positioning against Nvidia within the artificial intelligence chip sector.
Factors Behind the Semiconductor Pricing Surge
This latest round of price adjustments marks not the initial instance where Intel and AMD have implemented pricing increases during the current year. Both organizations have already executed multiple price elevations throughout 2026, as supply chain limitations have intensified. Lead times for product delivery have similarly extended, based on information from the Nikkei Asia report.
Chip demand has maintained its robustness across consumer and enterprise segments alike. Elevated pricing combined with consistent demand patterns could enhance revenue generation and profitability margins for both semiconductor manufacturers.
The PHLX Semiconductor Index recorded a 1% gain on Wednesday. Nvidia, Marvell Technology, and Qualcomm similarly posted advances alongside Intel and AMD.
Wider Market Dynamics Contributed to Stock Performance
Beyond semiconductor-specific developments, broader equity markets trended upward on Wednesday. S&P 500 futures contracts increased approximately 0.6% following news reports indicating the U.S. had formulated a proposal to cease hostilities in the Middle East region.
Crude oil valuations declined 5% to trade beneath the $100 per barrel threshold. This development alleviated certain concerns regarding energy-related inflationary pressures, which had weighed on technology sector equities in recent trading periods.
AMD benefited from additional company-specific positive catalysts. The organization recently unveiled an agreement with Meta for the deployment of 6 gigawatts worth of graphics processing units. This partnership contributed to favorable investor sentiment regarding AMD’s business trajectory.
Intel’s shares began Wednesday’s session carrying robust year-to-date upward momentum, whereas AMD was working to regain previously lost valuation. The CPU pricing increase revelations provided simultaneous upward impetus for both stocks during the same trading day.
Processor delivery lead times have expanded in tandem with the price increases, based on the Nikkei Asia reporting, indicating more constrained supply dynamics throughout the semiconductor industry.
Solana Targets the Agentic Internet as AI Agents Drive Millions in On-Chain Payments

Politics Home Article | The illegal gambling market: real risk, real harm
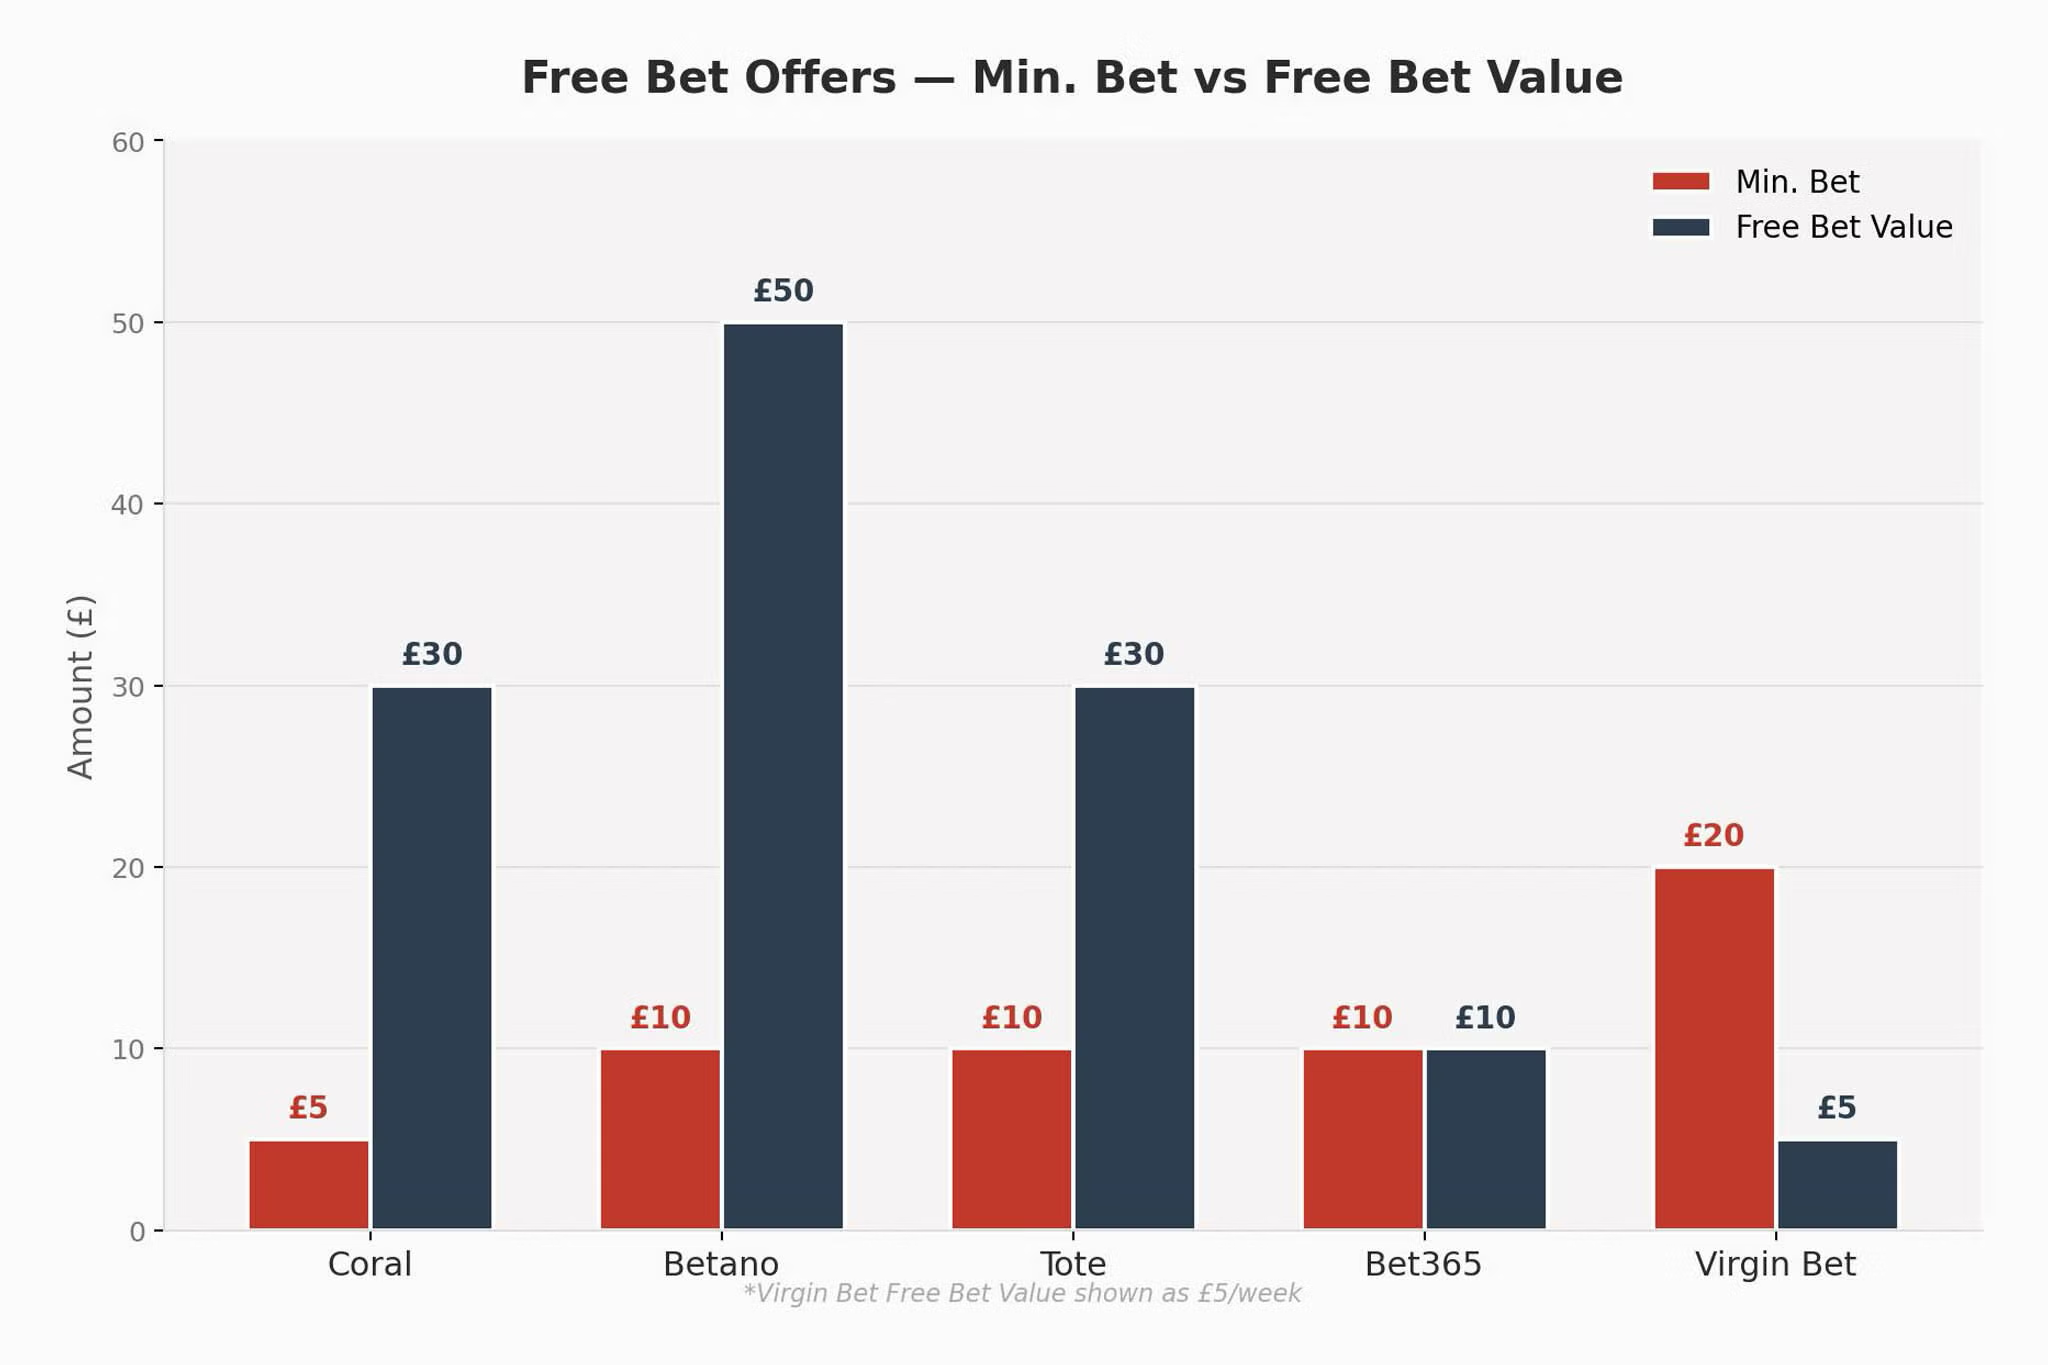
Betting sign up offers and free bets for March 2026

Smart energy pays enters the US market, targeting scalable financial infrastructure

Why Israel is blocking foreign journalists from entering

Bitcoin: We’re Entering The Most Dangerous Phase

Truth About Marriage and Financial Burden | #marriageandfinance #financialfreedom #ytshorts #shorts

ONLY THE XRP PRICE GLITCHES – DTCC $100 TRILLION IN 50 WEEKS! – PARITY ACT VS CLARITY ACT – XRP NEWS

STOP WASTING Money on Photography!
-
 Crypto World5 days ago
NIO (NIO) Stock Plunges 6.5% as Shelf Registration Sparks Dilution Worries
-

 Fashion6 days ago
Weekend Open Thread: Adidas – Corporette.com
-
 NewsBeat1 day ago
Manchester United reach agreement with Casemiro over contract clause amid transfer speculation
-

 Politics6 days ago
Jenni Murray, Long-Serving Woman’s Hour Presenter, Dies Aged 75
-

 Crypto World4 days ago
Best Crypto to Buy Now: Strategy Just Spent $1.57 Billion on Bitcoin During Fear While Early Investors Quietly Enter Pepeto for 150x Potential
-

 Crypto World5 days ago
Bitcoin Price News: Bhutan Sells $72 Million in BTC Under Fiscal Pressure, but the Smart Money Entering Pepeto Sees What the Market Does Not
-

 Tech6 days ago
inKONBINI Lets You Spend Summer Days Behind the Register
-

 News Videos8 hours ago
Parliament publishes latest register of MPs’ financial interests
-

 Sports3 days ago
Remo Stars and Kano Pillars Strengthen Survival Hopes in NPFL
-

 Politics7 days ago
Gender equality discussions at UN face pushbacks and US resistance
-

 Business4 days ago
No Winner in March 21 Drawing as Prize Rolls to $133 Million for Next
-

 Sports3 days ago
Gary Kirsten Accuses Pakistan Cricket Board Of ‘Interference’, Mohsin Naqvi Responds
-

 Tech4 days ago
Give Your Phone a Huge (and Free) Upgrade by Switching to Another Keyboard
-

 Sports6 days ago
2026 Kentucky Derby horses, odds, futures, preview, date: Expert who nailed 12 Derby-Oaks Doubles enters picks
-

 Tech4 days ago
AI enters the chat: New Seattle dating app relies on tech to facilitate meaningful human connections
-

 Politics7 days ago
Scotland’s rejection of assisted dying is a victory for humanity
-

 Business7 days ago
DLocal: Entering 2026 At Escape Velocity
-
Business5 days ago
Columbia Sportswear enters $500 million credit agreement with JPMorgan Chase
-

 NewsBeat7 days ago
Missile lands next to presenter during live report
-

 Tech4 days ago
Today’s NYT Connections Hints, Answers for March 22 #1015
You must be logged in to post a comment Login