
Crypto World
Bitcoin Price Shows Bottom Signal Not Seen Since 2022
Bitcoin has attempted to recover in recent sessions, but upward momentum has stalled as the market waits for a clearer direction. Price remains range-bound after a sharp correction, frustrating short-term traders.
Despite this pause, historical indicators suggest a bottom may be forming. Past cycles show similar conditions often precede renewed recovery phases.
Sponsored
Sponsored
Bitcoin Profitable Supply Hits 2022 Level
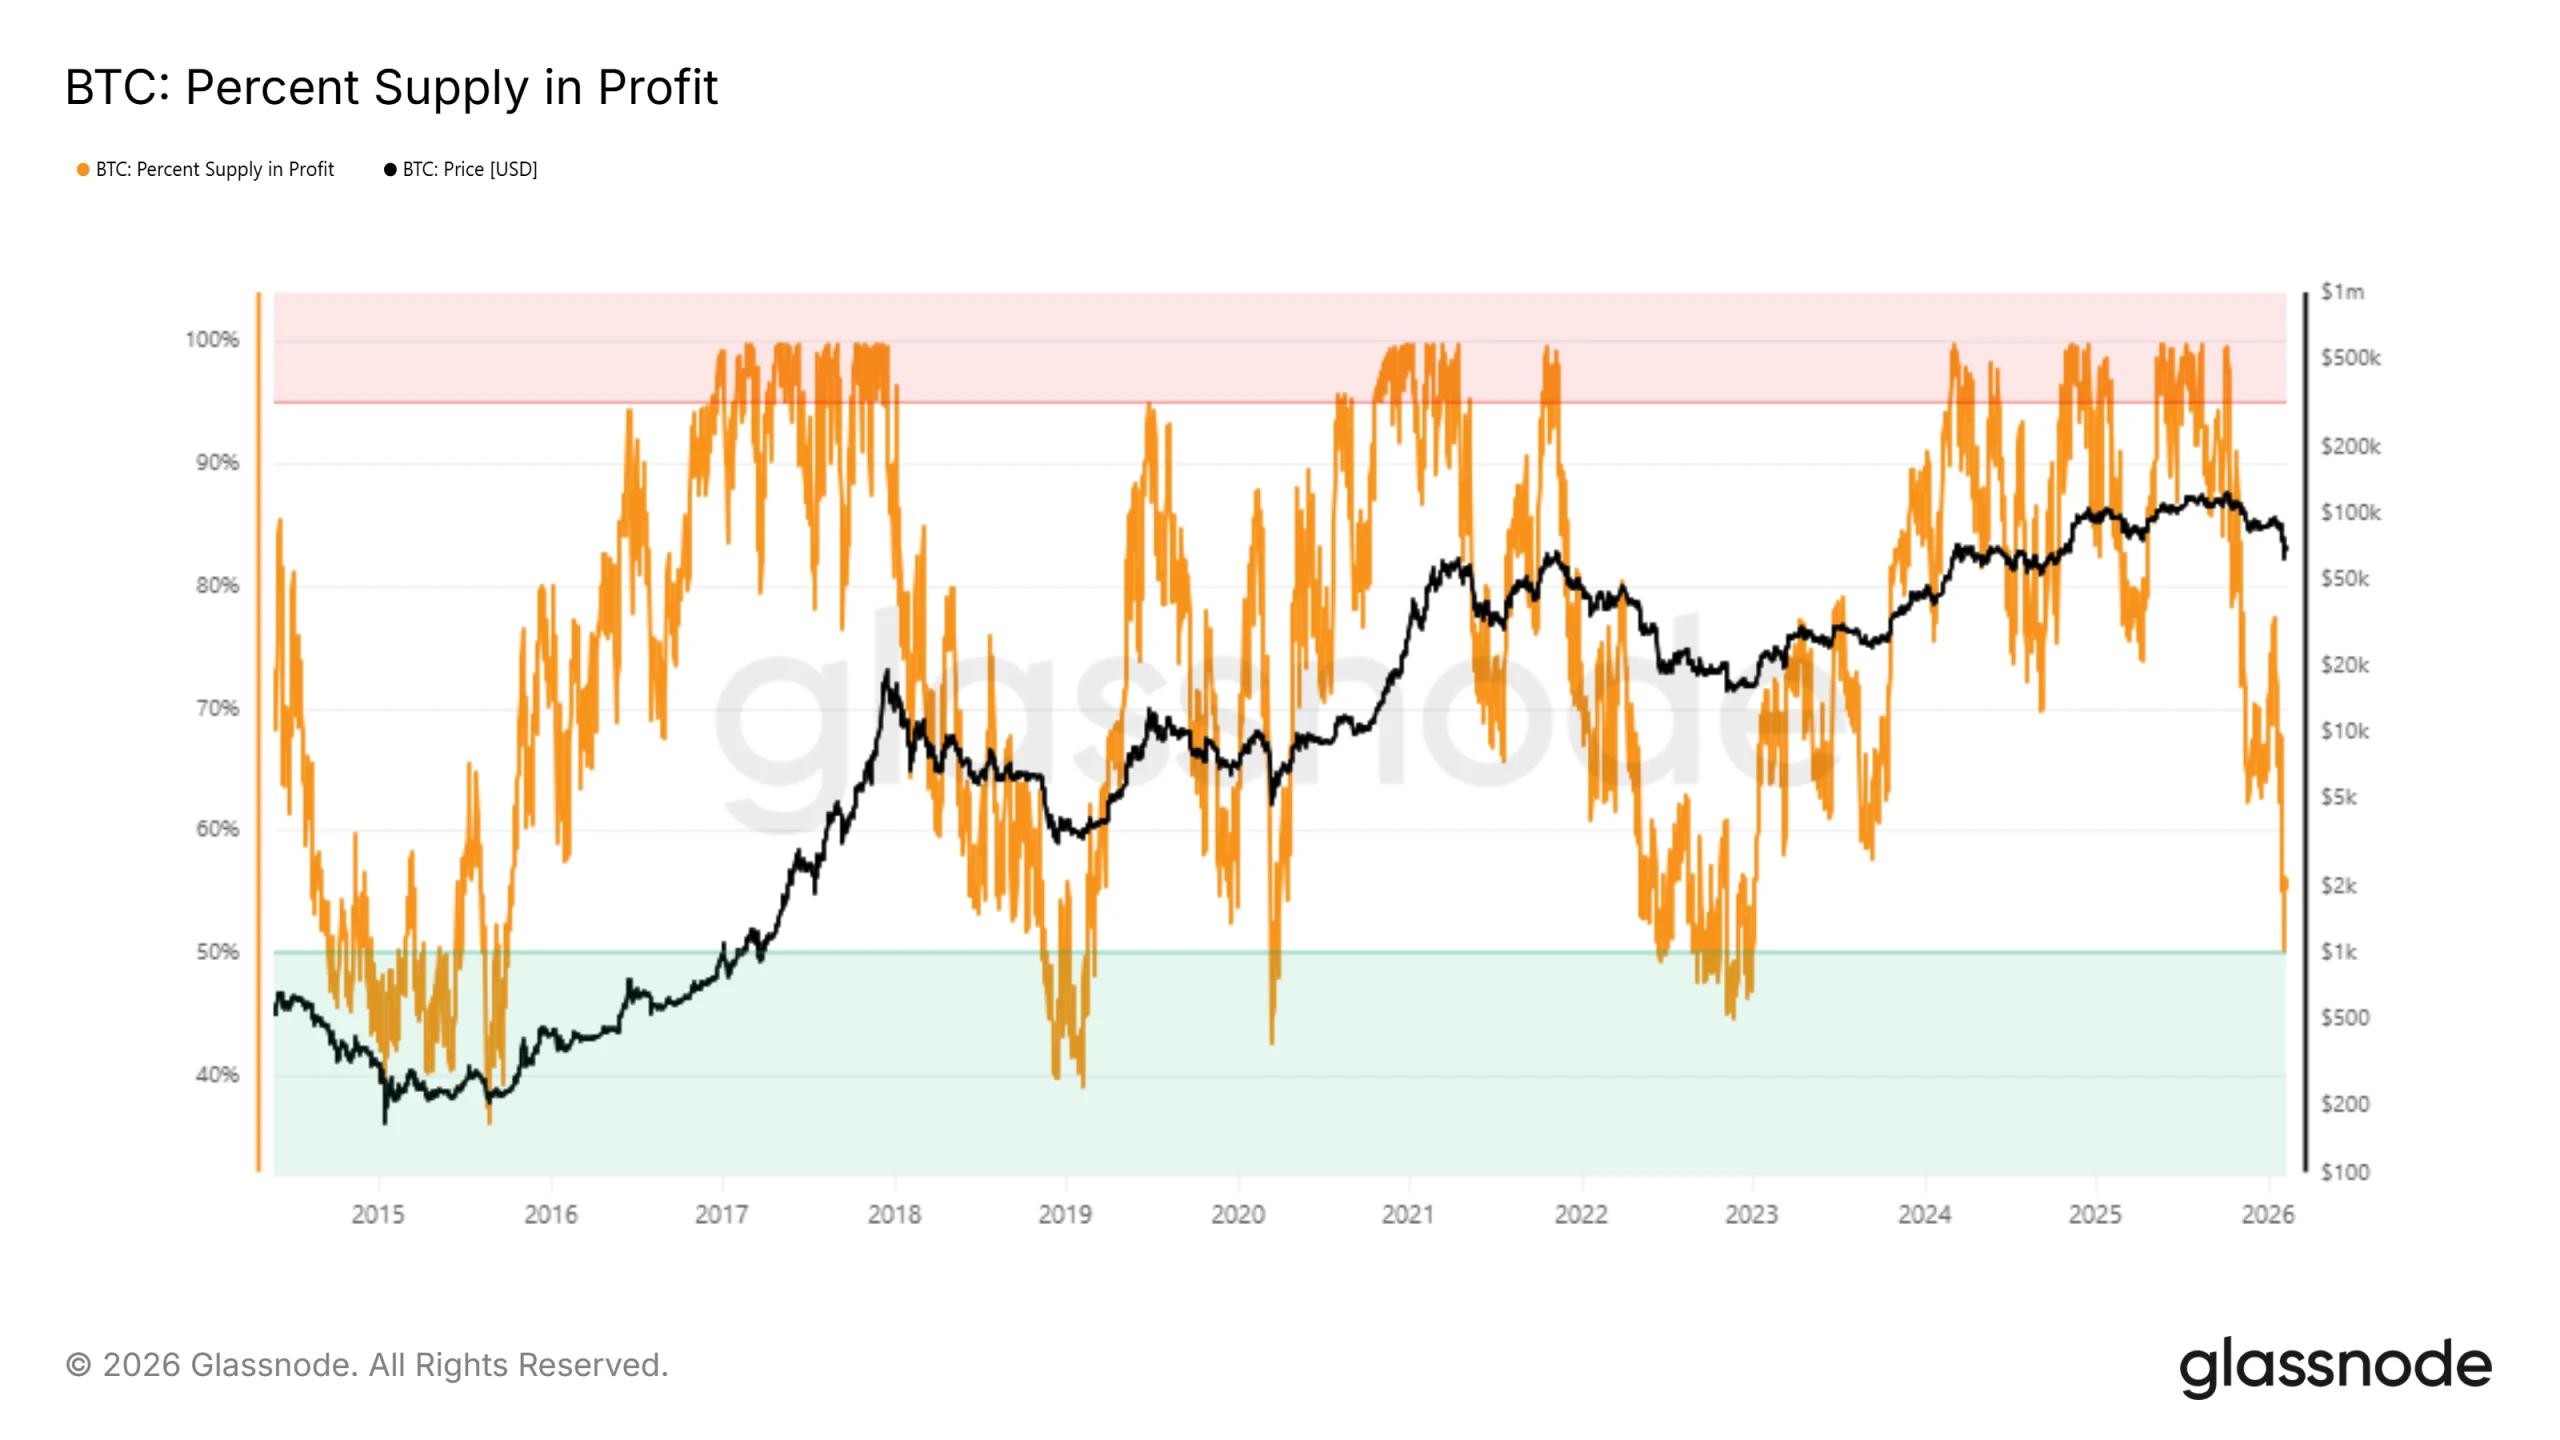
Bitcoin’s recent decline triggered a signal last seen during the 2022 bear market. The percentage of supply in profit fell to around 50%, meaning half of all circulating BTC is now underwater. This threshold has historically coincided with market bottoms rather than prolonged sell-offs.
When profitable supply compresses to these levels, selling incentives weaken. Holders become less willing to realize losses, reducing sell-side pressure. In previous cycles, this dynamic encouraged investors to hold through volatility, allowing the price to stabilize before recovery resumed.
Want more token insights like this? Sign up for Editor Harsh Notariya’s Daily Crypto Newsletter here.

Lower prices also attract fresh capital. Value-oriented buyers tend to enter when downside risk appears limited relative to upside potential. This influx of new demand has historically helped revive Bitcoin recoveries once profitable supply falls to or below the 50% mark.
Why Is Bitcoin Likely To Bounce Back?
Macro indicators reinforce the bottoming narrative. The Pi Cycle Top Indicator, which compares the 111-day moving average to a doubled 350-day moving average, remains far from signaling BTC overheating. This indicator historically flags major tops when the shorter average crosses the higher threshold.
Sponsored
Sponsored
Currently, the opposite setup is unfolding. The shorter moving average is diverging below the longer one, signaling cooling conditions rather than excess speculation. In past cycles, such divergence often preceded sustained rebounds as Bitcoin reset from overheated levels.
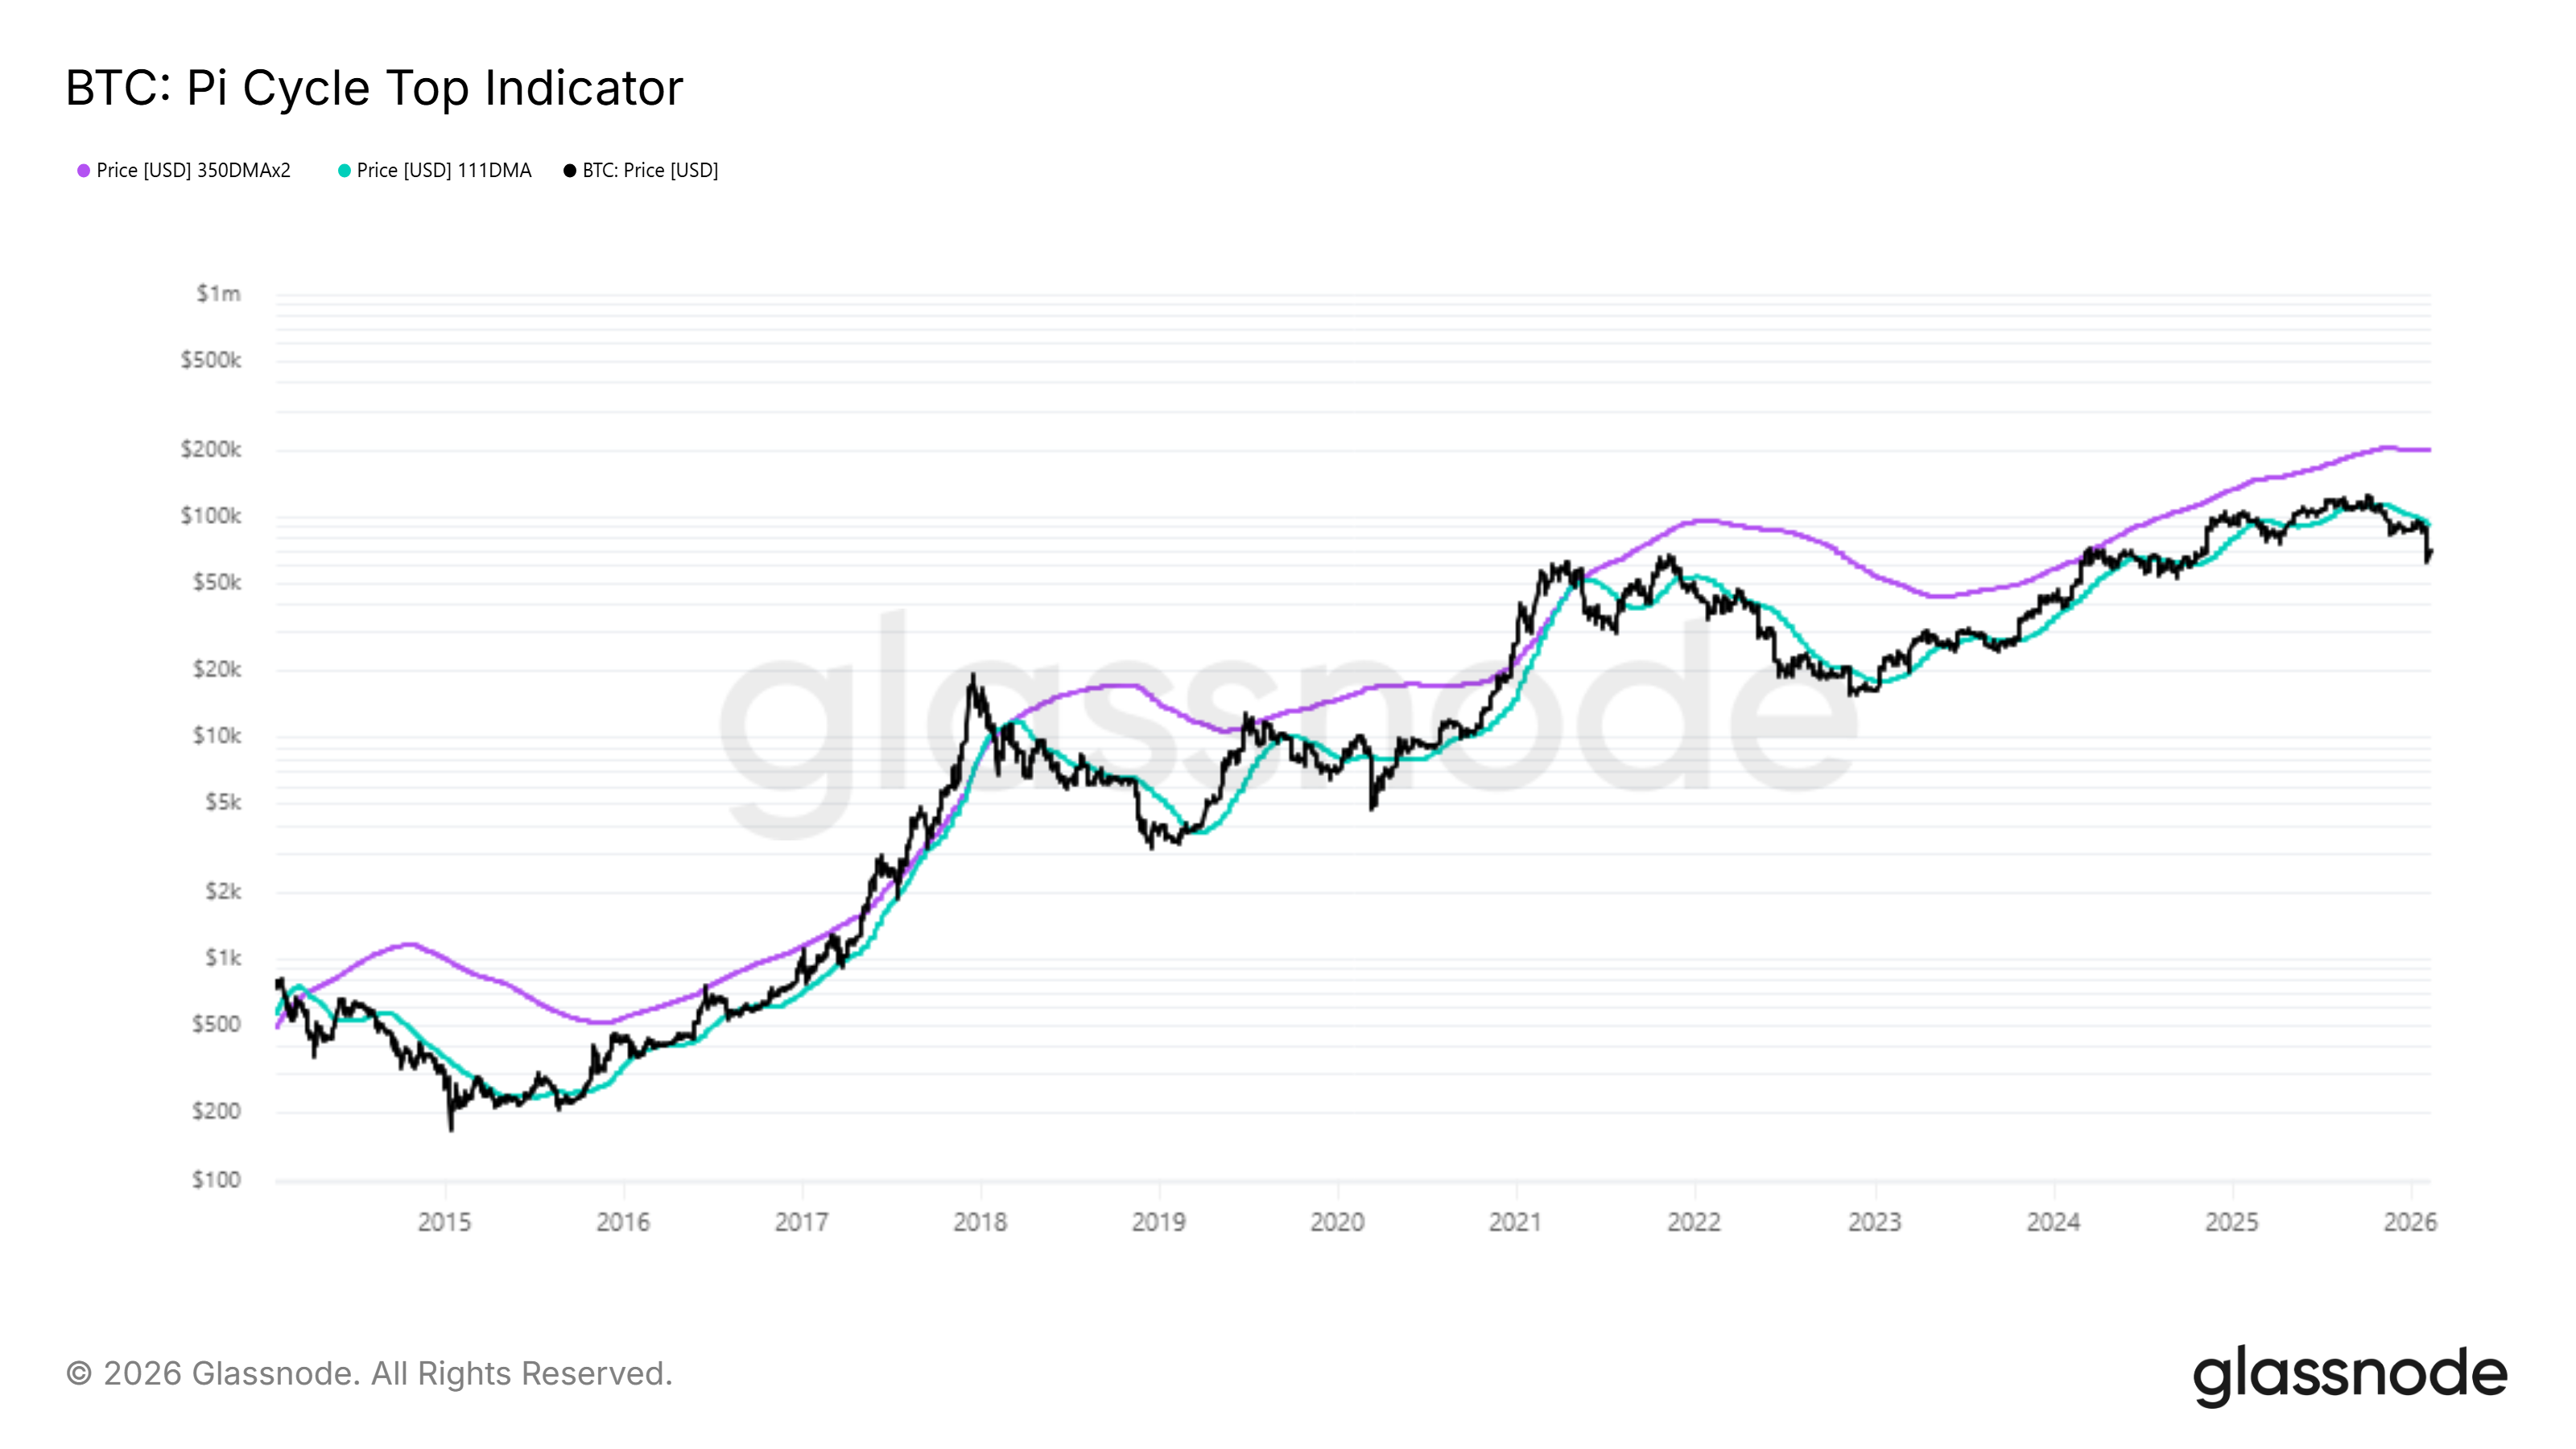
This cycle differs from prior ones. Since March 2023, Bitcoin has maintained a macro uptrend without excessive overheating. Gradual price appreciation limited speculative excess, making this the first clear bottom signal in nearly three years rather than a sharp capitulation-driven low.
BTC Price Levels To Watch
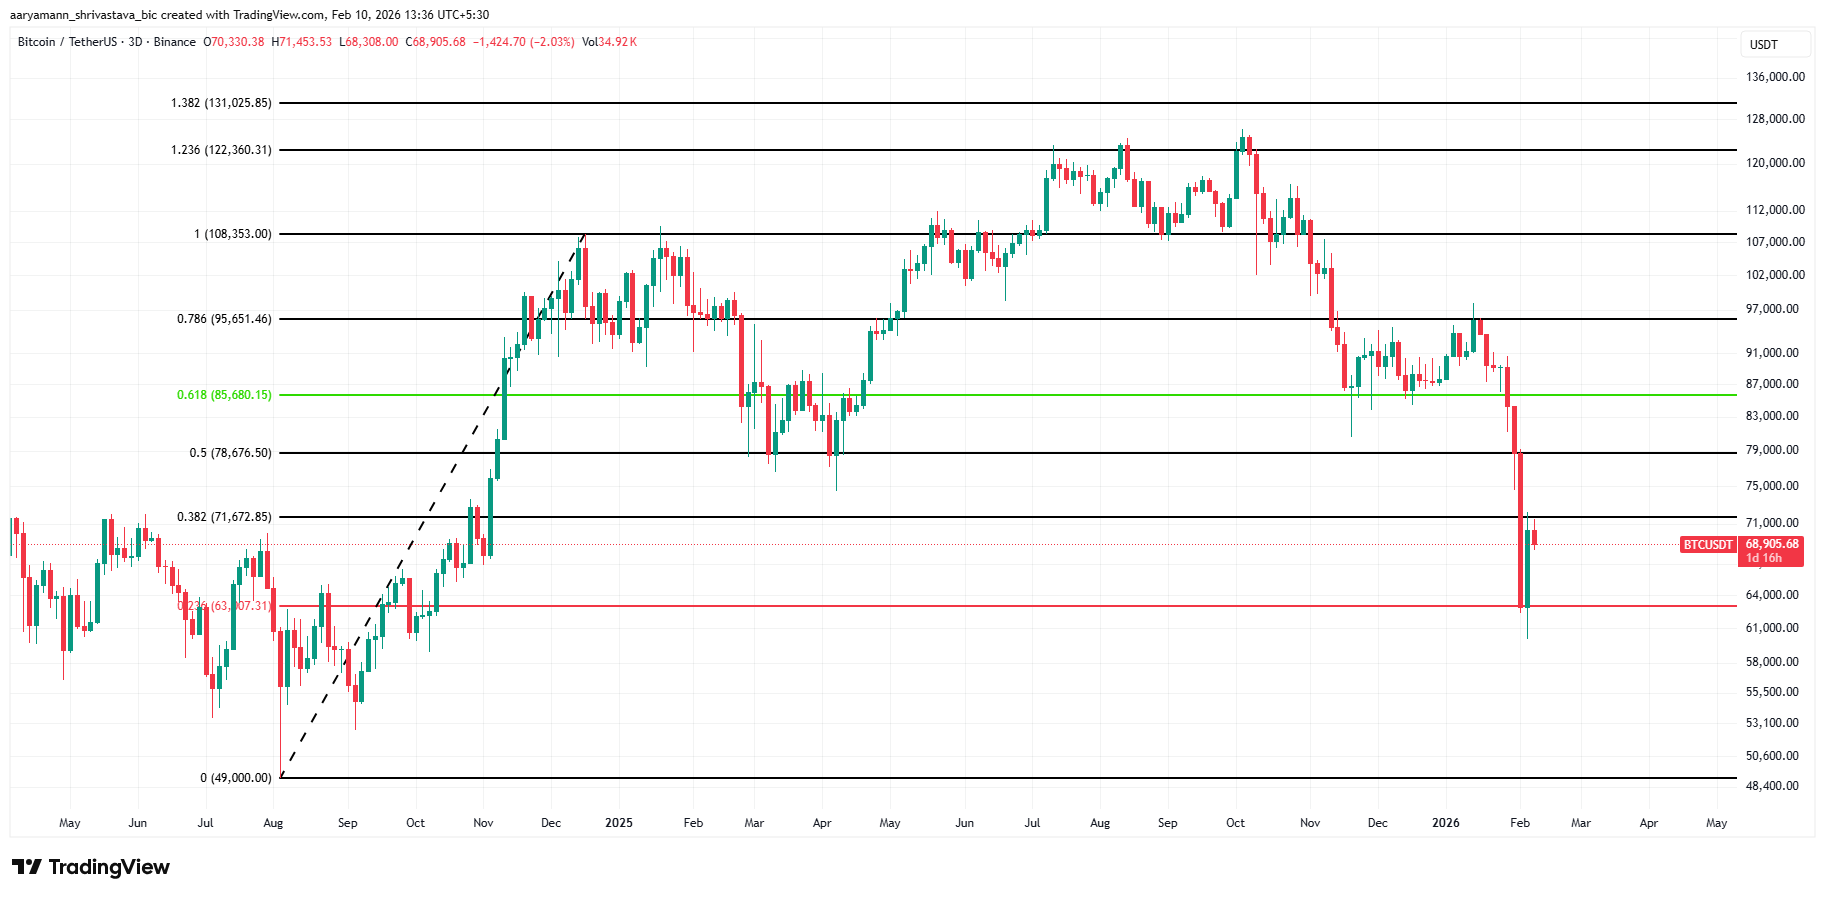
In the short term, Bitcoin is holding above the 23.6% Fibonacci retracement near $63,007. At the time of writing, BTC trades around $68,905, maintaining support despite repeated tests. However, price remains capped below the $71,672 resistance, limiting immediate upside.
If on-chain signals continue holding and inflows strengthen, Bitcoin could break above $71,672. Such a move would open the path toward $78,676. Stronger confirmation of recovery would come only if BTC reclaims $85,680 as a sustained support level.
Risks remain on the downside due to the shifting market structure. The short-term holder to long-term holder supply ratio has moved above its upper band. This reflects growing short-term participation, often linked to higher volatility.
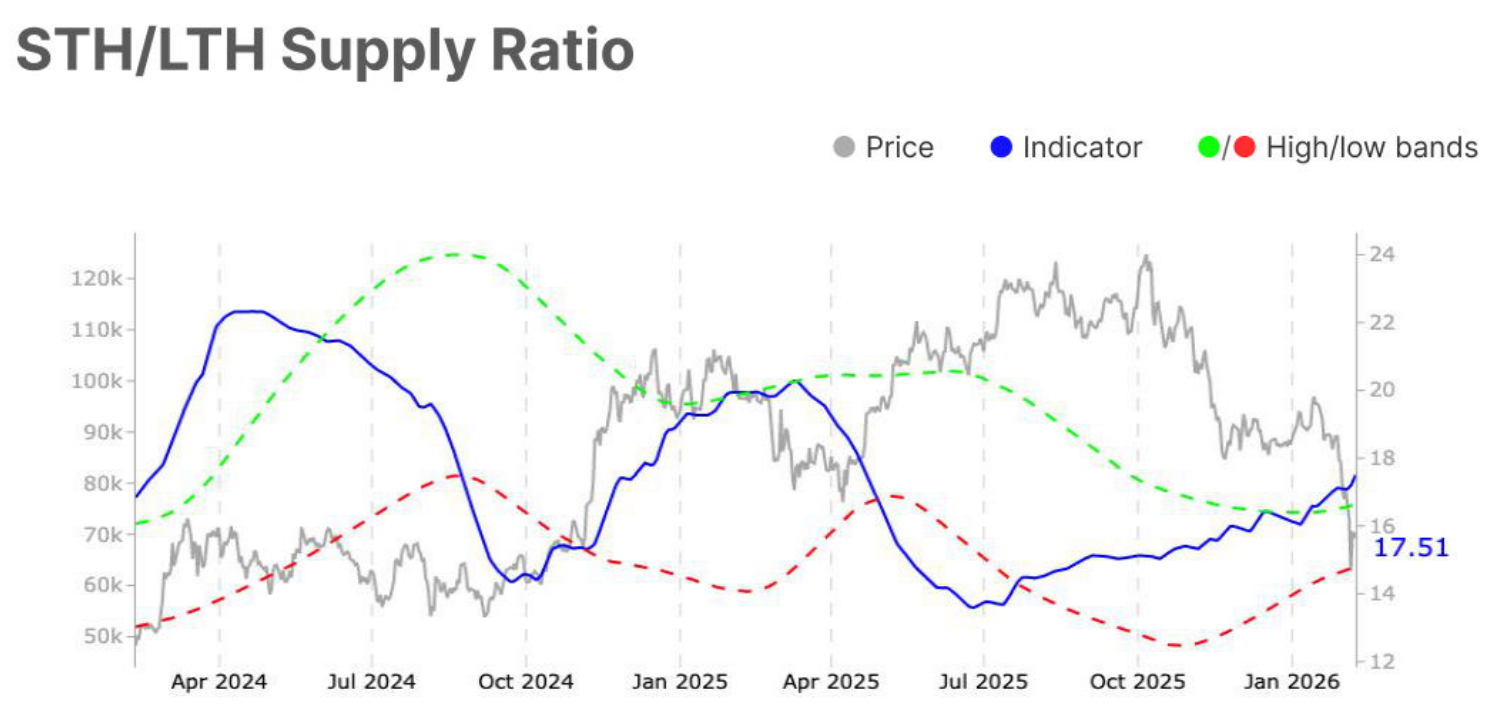
This would hurt Bitcoin’s price chances of crossing the $71,672 barrier, continuing its consolidation. Even if BTC does push past said resistance, the selling will pull it back down towards $63,000, invalidating the bullish thesis.

Bitcoin (BTC) closed March in green, ending the longest monthly losing streak since 2018. Data suggests that the coming months may prove to be profitable for BTC.
Key takeaways:
-
Bitcoin ended March 2% higher, marking the first green monthly close in six months.
-
A similar streak in 2018/2019 led to an over 316% BTC price rebound over five months.
-
Bitcoin price faces stiff resistance at $70,000-$72,000, where key trend lines converge.
Past multi-month downtrends were followed by 300% price gains
Historical price data from CoinGlass confirms Bitcoin printed its first green monthly candle in six months, closing March 2% higher after five straight months of losses.
“This is a massive dose of hopium,” analyst Ash Crypto said in an X post on Wednesday.
The analyst was referring to a possible shift in momentum, which might lead to a sustained recovery, as seen in previous cycles.
Related: Crypto Fear & Greed Index stuck on ‘extreme fear,’ but is there a silver lining?
The last time this happened was in 2018/2019 when BTC closed February 2019 in green, after six consecutive red months, as shown in the figure below.
This led to a reversal with over 300% returns the following five months, as Bitcoin recovered from the 2018 bear market.
“Last time BTC dumped 6 months in a row, it pumped the following 5 months in a row that came after!” trader Satoshi Flipper said in a Wednesday post on X.

If history repeats itself, the reversal may continue in April, suggesting that BTC price may have bottomed at $60,000.
Bitcoin’s bullish monthly close is a ”catalyst for fresh inflows into early April,” Trader Caleb said, adding:
“April starts with momentum.”
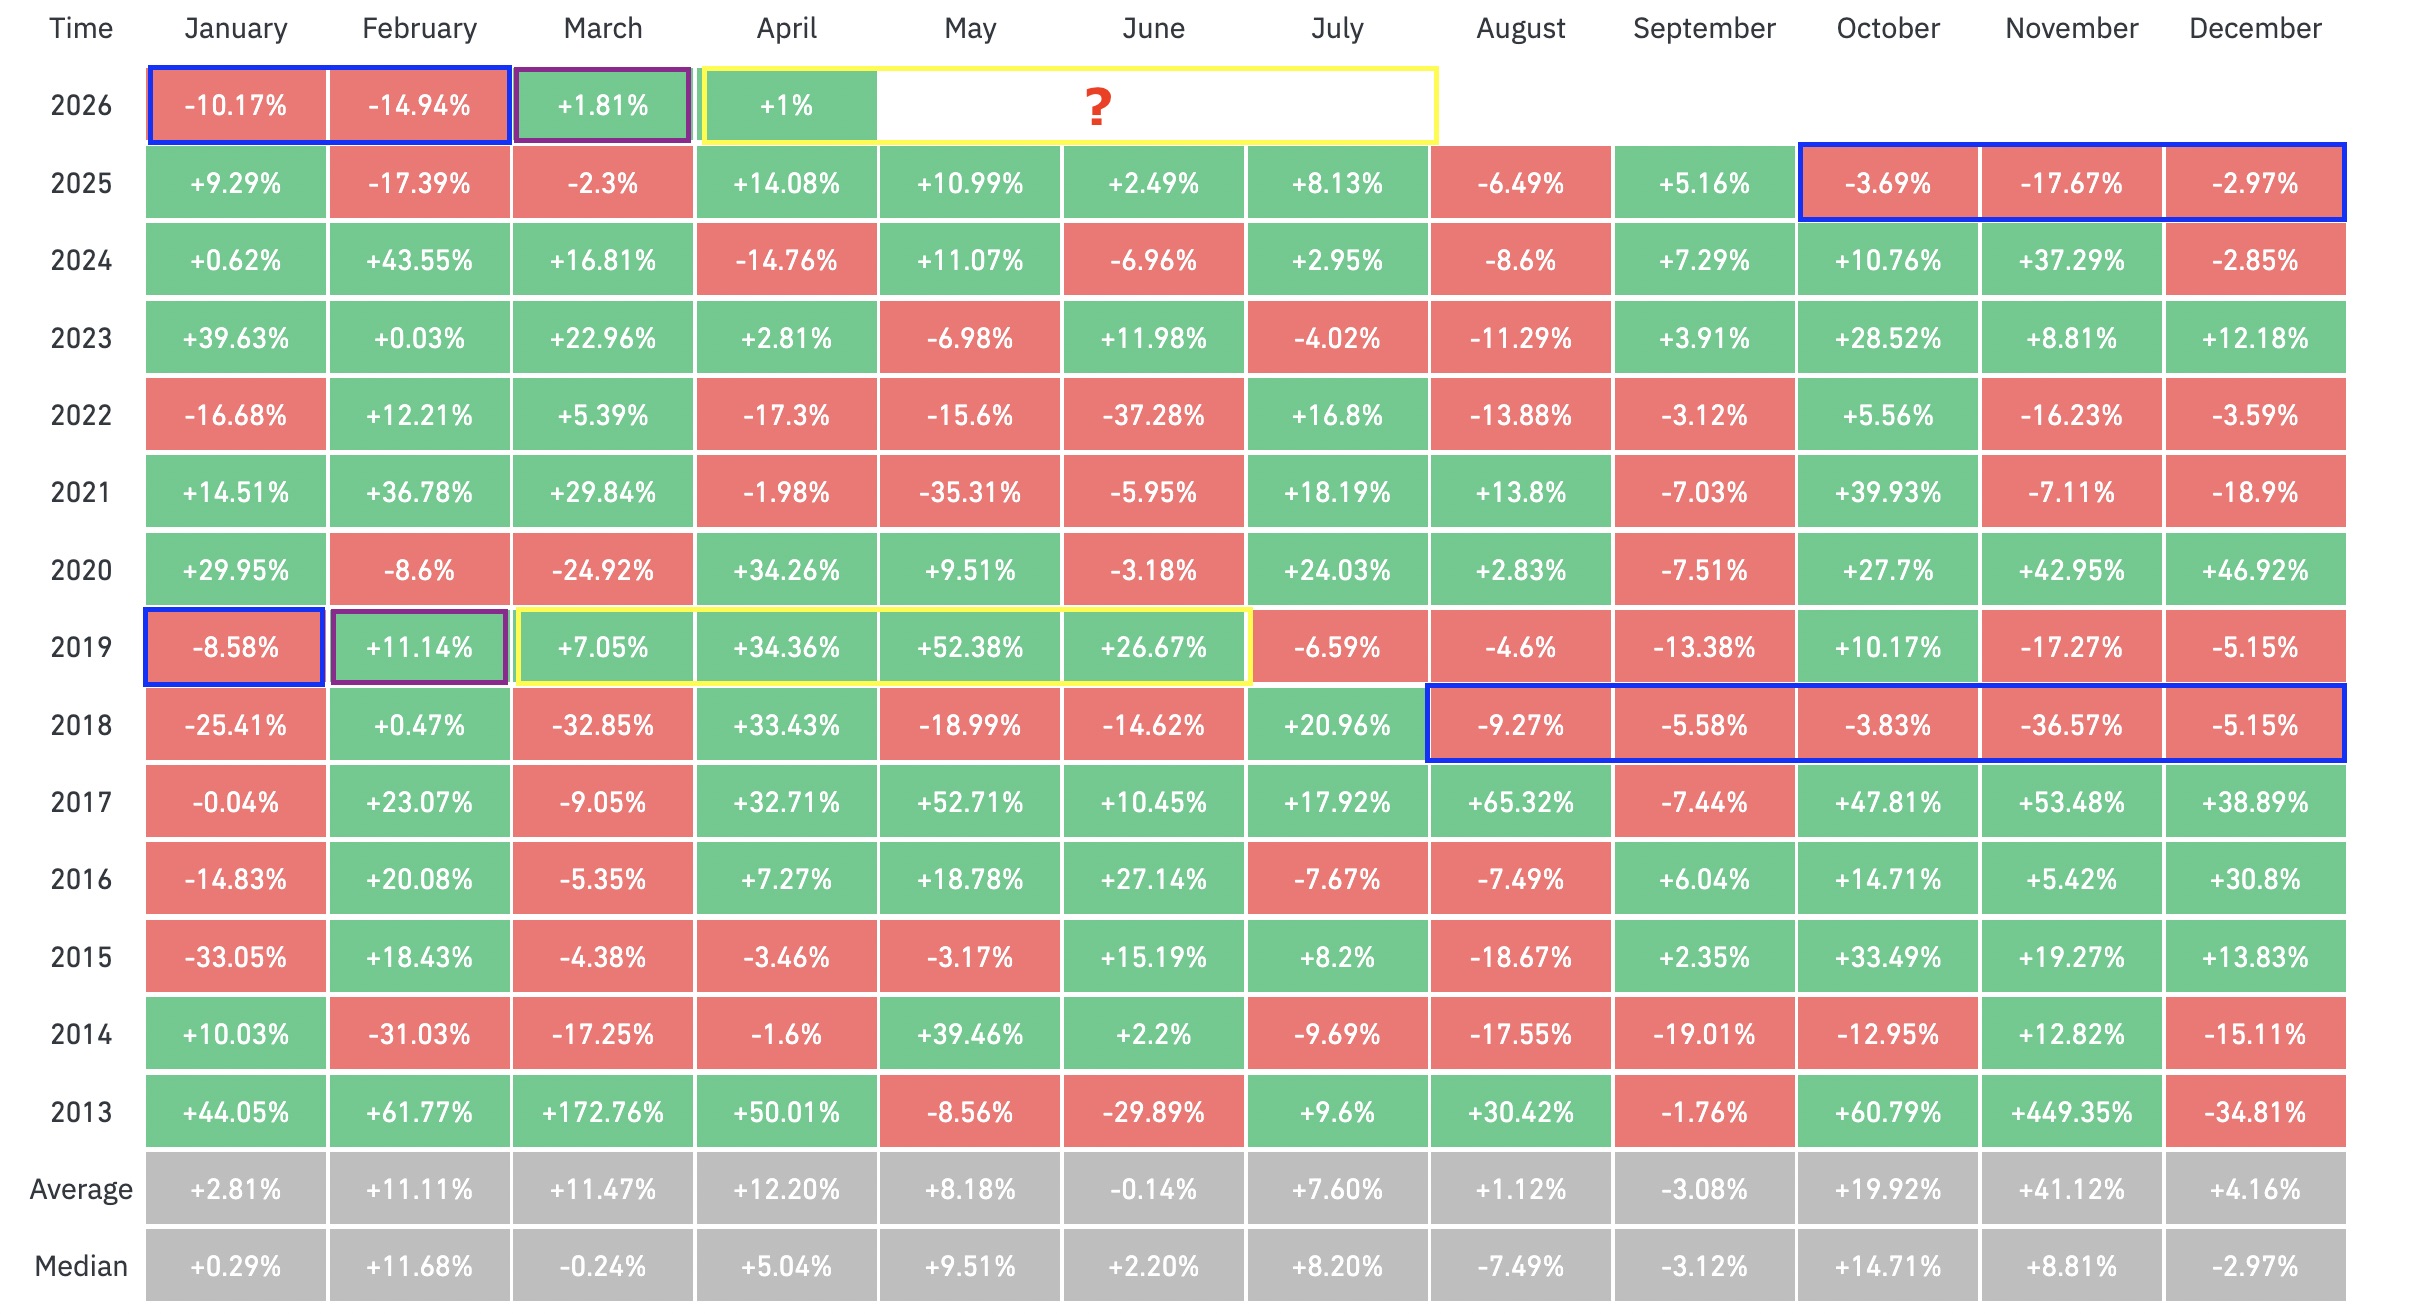
Bitcoin has a well-established tendency for significant price swings in April.
Since 2013, April has been a green month for eight of the past 13 years, with average returns of about 12.2%
However, Bitcoin also tends to move in the opposite direction to March in April, and this is true for nine out of the past 13 years.
In recent years, Bitcoin dropped in April after closing March in green, three out of four times between 2021 and 2024.
Therefore, while the end of past multi-month drawdowns suggests a rebound is due, data demonstrates that BTC price could also slide in April.
Watch these Bitcoin price levels next
Data from TradingView shows BTC price up 2.5% on the day to trade at $68,470 as the $69,000-$70,000 resistance remains in place.
Analysts expect Bitcoin’s range-bound price action to continue for longer, with important price levels to look for in case of a breakout.
These include the $70,000-$72,000 supply zone, coinciding with the 50-day simple moving average (SMA), the 50-day exponential moving average (EMA) and the 1w–1m cohort cost basis.
This is also where investors acquired approximately 650,000 BTC, marking a potential point of sell pressure, according to the cost-basis distribution data from Glassnode.
Breaking above this level could see BTC/USD revisit the $76,000 range high and eventually the $80,000 psychological level.

Zooming out, trader Sheldon Diedericks said Bitcoin could “push into resistance” at $83,000 on the monthly time frame, a key support level from April 2025. The 200-day EMA is also close to this area.

On the downside, the 200-week EMA at $68,300 and the 200-week SMA at $59,400 remain key levels to watch. Below that, the next major level is Bitcoin’s realized price around $54,000.
As Cointelegraph reported, Bitcoin’s bear market bottom could be formed once BTC price drops toward or below its realized price.
This article is produced in accordance with Cointelegraph’s Editorial Policy and is intended for informational purposes only. It does not constitute investment advice or recommendations. All investments and trades carry risk; readers are encouraged to conduct independent research before making any decisions. Cointelegraph makes no guarantees regarding the accuracy or completeness of the information presented, including forward-looking statements, and will not be liable for any loss or damage arising from reliance on this content.
Crypto World
OpenAI Secures Historic $122B Investment Round, Reaching $852B Valuation with Amazon and Nvidia Support

Key Highlights
- OpenAI secured $122 billion in funding, achieving an $852 billion post-money valuation
- Major investors include Amazon, Nvidia, and SoftBank, with continued support from Microsoft
- The company reports $2 billion in monthly revenue and serves 900 million weekly active ChatGPT users
- Development underway for an integrated AI “superapp” merging ChatGPT, Codex, and web browsing capabilities
- Credit facility enhanced to $4.7 billion, remaining untapped at present
OpenAI has successfully completed a monumental $122 billion investment round, establishing a new benchmark as the largest private capital raise in corporate history. This extraordinary financing values the artificial intelligence leader at $852 billion following the transaction, positioning it as the highest-valued privately-held company globally.
The investment was spearheaded by technology and investment heavyweights Amazon, Nvidia, and SoftBank. Microsoft, a longstanding strategic partner, maintained its participation in this latest round. SoftBank shared co-leadership responsibilities with a16z, D.E. Shaw Ventures, MGX, TPG, and T. Rowe Price-advised accounts.
The comprehensive investor consortium features prominent names including BlackRock, Blackstone, Fidelity, Sequoia, Temasek, Coatue, ARK Invest, Thrive Capital, and Insight Partners, alongside numerous other institutional backers.
In an unprecedented move, OpenAI made this funding opportunity accessible to retail investors through banking partnerships, successfully securing over $3 billion from individual participants alone. Additionally, OpenAI will gain exposure through inclusion in multiple ARK Invest exchange-traded funds.
The company reports current monthly revenue of $2 billion. This represents substantial acceleration from the $1 billion quarterly run rate recorded at 2024’s conclusion, demonstrating remarkable revenue expansion in a compressed timeframe.
ChatGPT’s user base has surpassed 900 million weekly active participants, complemented by more than 50 million paid subscription accounts. OpenAI maintains that its platform receives six times the monthly web traffic compared to its closest AI application competitor.
Enterprise clients now contribute over 40% of total revenue streams. According to company projections, enterprise revenue is positioned to match consumer revenue contributions by the conclusion of 2026.
The company’s application programming interfaces handle over 15 billion tokens every minute. Codex, its specialized coding assistant, supports more than 2 million weekly users—a fivefold increase achieved within a mere three-month period.
Vision for an Integrated AI Superapp
OpenAI has announced ambitious plans to construct a comprehensive AI superapp platform that consolidates ChatGPT, Codex, web browsing functionality, and autonomous agent capabilities into a singular, cohesive product offering. This strategic initiative aims to simplify widespread adoption and utilization of its artificial intelligence models.
The organization emphasizes computational infrastructure as a critical strategic priority. Cloud computing partnerships span Microsoft, Oracle, AWS, CoreWeave, and Google Cloud. Semiconductor collaborations encompass Nvidia, AMD, AWS Trainium, Cerebras, alongside proprietary chip development in partnership with Broadcom.
Enhanced Credit Arrangements and Market Position
OpenAI has simultaneously expanded its revolving credit arrangement to approximately $4.7 billion. This facility receives backing from leading financial institutions including JPMorgan Chase, Citi, Goldman Sachs, Morgan Stanley, Wells Fargo, and additional major banks. Notably, the entire facility remains untapped as of March 31.
With an $852 billion valuation, OpenAI commands a worth approximately equivalent to Berkshire Hathaway. The company’s value surpasses the market capitalizations of major corporations including Visa, JPMorgan Chase, and Samsung.
OpenAI has recently introduced GPT-5.4 to the market. The company’s API infrastructure continues expanding, processing billions of tokens per minute across both enterprise and consumer deployment scenarios.

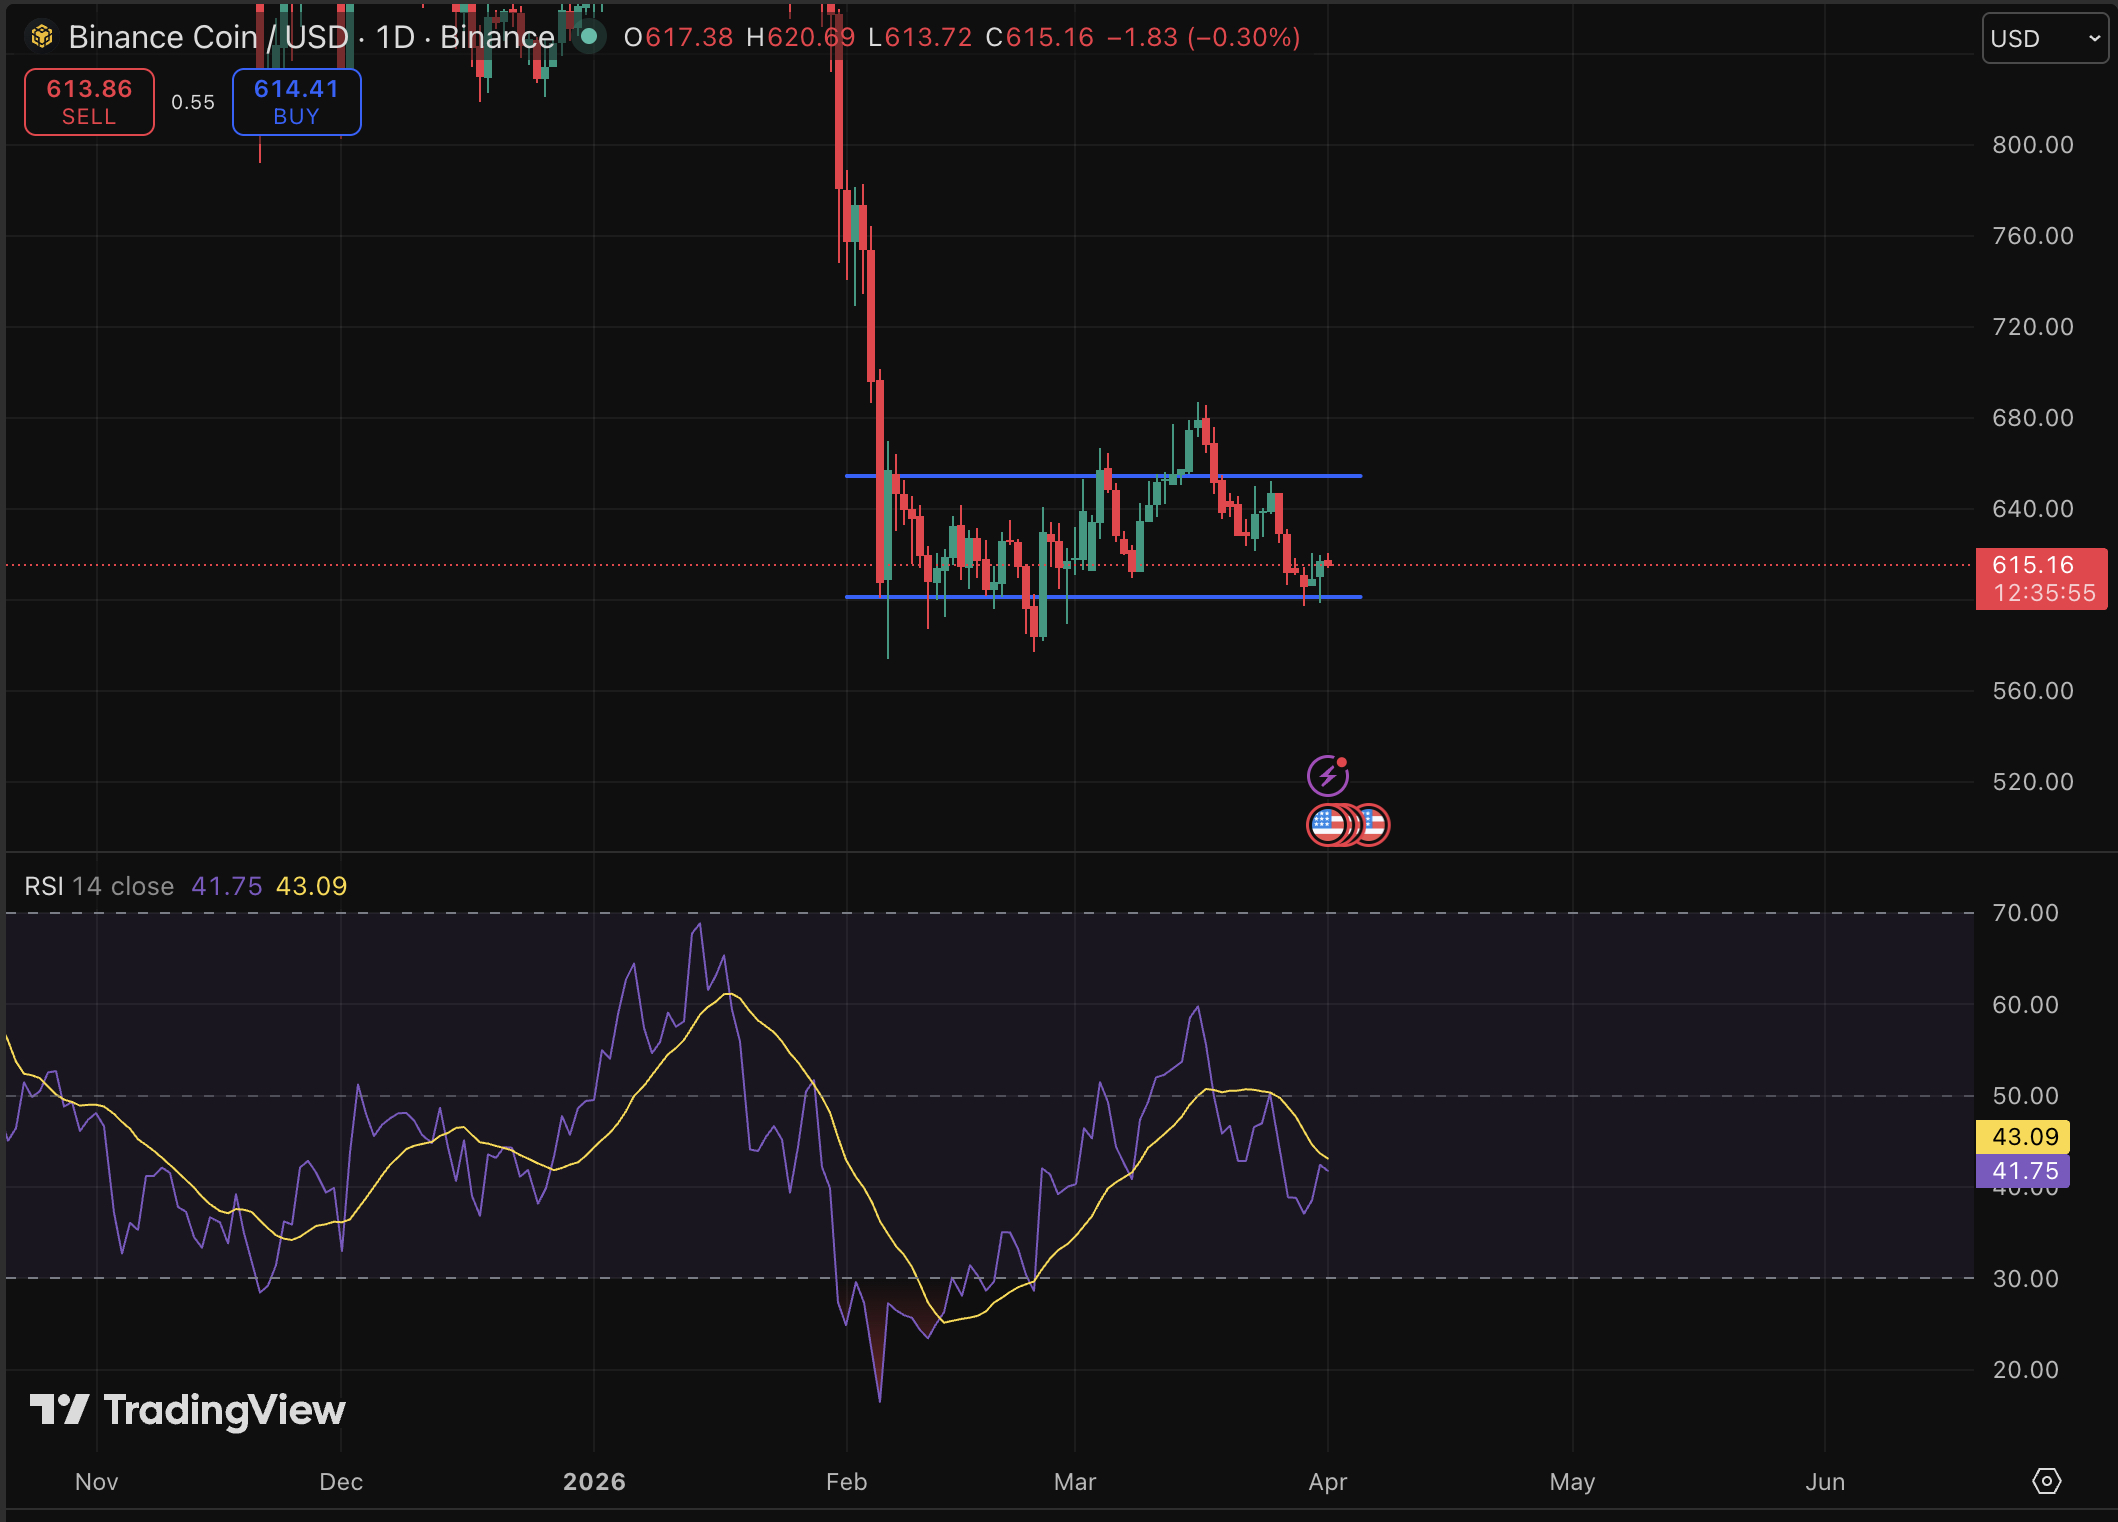
BNB is holding a critical psychological price threshold, trading at $614 after a 1.7% gain in 24 hours, and our prediction since last week is getting bullish. As a catalyst, Binance’s newly announced prediction market feature can add enough utility to the equation.
Binance confirmed Yesterday it is rolling out an integrated prediction market directly inside its self-custody wallet, partnering with third-party providers, including Predict.fun, to let users bet on politics, sports, and crypto events without leaving the app.
— BSCN (@BSCNews) March 31, 2026
 JUST IN: BINANCE WALLET TO LAUNCH PREDICTION MARKET FEATURE
Binance Wallet (@BinanceWallet) is introducing a new prediction market tool. The feature will allow users to bet on future outcomes. Categories include sports, economics, world events, and crypto.
Binance will not… pic.twitter.com/lmMV53hEyX
The feature may also tie into BNB Chain’s yield-generating staking mechanics, potentially creating new organic demand for the token. Regulatory guardrails around prediction markets remain in flux, which adds a layer of uncertainty, but institutional interest in the sector is clearly accelerating, with Coinbase and Crypto.com both expanding into similar territory in recent months.
Discover: The best pre-launch token sales
BNB Price Prediction: Can It Hit $660 This Week?
BNB is consolidating in a narrow band near its lower Bollinger Bands, with RSI sitting at a neutral-to-weak 41-43, showing convergence but not yet confirmation of a reversal.
Key support sits at $600 level, with a secondary floor at $580. On the upside, resistance clusters at $640, $660, and the upper Bollinger Band at $680.
For the price, prediction market utility drives fresh BNB demand; the price can reclaim the $649 SMA and test the $660–$680 resistance zone within days. But a break below $600 support opens the door to the $420 accumulation zone.
On-chain activity at roughly 1 million active addresses and consistent token burns provide a structural floor. Broader altcoin season dynamics will likely determine whether BNB’s next meaningful move is up or down from here. Watch this current level closely; it has held twice in 48 hours, but a third test rarely ends the same way.
Discover: The best crypto to diversify your portfolio with
Bitcoin Hyper Targets Early Mover Upside as BNB Tests Key Levels
BNB is offering a range-bound trade with meaningful upside capped at $680 in the near term. For traders who want asymmetric exposure during this uncertain window, early-stage infrastructure plays are drawing attention, particularly those targeting Bitcoin’s own scaling limitations.
Bitcoin macro conditions remain a dominant force across the entire market, and projects building directly on BTC infrastructure are positioned to capture that gravity.
Bitcoin Hyper ($HYPER) is positioning itself as the first Bitcoin Layer 2 with Solana Virtual Machine (SVM) integration, combining Bitcoin’s security and trust with smart contract performance that exceeds Solana’s own throughput.
The presale has raised more than $32 million at a current token price of just $0.0136, with staking rewards live for early participants. Core features include a Decentralized Canonical Bridge for BTC transfers, sub-second finality, and low-cost transaction execution, targeting the exact bottlenecks (slow speeds, high fees, no programmability) that have historically kept institutional capital off Bitcoin’s base layer.
This article is for informational purposes only and does not constitute financial advice. Cryptocurrencies are highly volatile. Always do your own research before investing.
The post BNB Price Prediction: Can BNB Maintain Momentum With Its New Prediction Market? appeared first on Cryptonews.


The World Foundation sold $65 million in WLD tokens through over-the-counter block trades with four private counterparties at an average price of $0.2719 per token.
Opinion by: Alex Tsepaev, chief strategy officer at B2PRIME Group.
Each generation has its own distinct characteristics, even when it comes to investing. Younger people, for example, show a higher tolerance for risk. More than 64% of Gen Z and 49% of millennials say they are willing to take on more of it.
That appetite naturally includes investing in cryptocurrencies, which is considered one of the riskiest asset classes in modern markets. No surprise, then, that nearly two-thirds of Gen Zs plan to invest in cryptocurrencies like Bitcoin this year. Even more striking is that they are almost four times as likely to own crypto as to own a retirement account.
This might look like pure speculation. These numbers suggest that something more structural is happening.
For Gen Z, crypto is becoming an important part of their portfolios. The question now is whether that bet is mature or premature.
Volatility is the price of admission
Although it is arguable, crypto volatility remains one of the biggest obstacles in investing. Prices can change every millisecond, and trading happens around the clock. This has a significant effect on the final execution price.

The most interesting part here, however, is that Gen Z is fully aware of this. 84% of them acknowledged that cryptocurrencies are risky and volatile, yet continue investing, and participation continues to grow every year. Why?
Gen Z understands that digital assets are a great way to have extra, above-average profits, and volatility is perceived as an entry price. For a generation that has already witnessed two of the biggest economic crises in history, average capital growth in traditional investments can feel too slow or insufficient.

Digital assets also feel native to Gen Z. This is the first generation that has never known a life without the internet, and they are also used to digital wallets and online transactions.
At the same time, their investment behavior is shaped by social media consumption — one in four American Gen Z now gets financial advice from TikTok. Considering that the internet is flooded with so-called “finfluencers,” who help you learnn more about crypto, no surprise that Zoomers tend to invest in it so much.
FOMO and the narrative trap
Beyond risk tolerance, there is another thing that distinguishes Gen Z from previous generations.
It is the fear of missing out (FOMO). This feeling, mostly expressed as the fear of lost profits, is expressed in constant anxiety due to comparing lives with the “perfect” picture on social networks.
FOMO is especially common among Zoomers when it comes to financial matters. In fact, nearly 70% of Gen Z says they feel financial FOMO while scrolling social media. And 50% of Gen Z investors said they have even made an investment driven by this feeling, most often in crypto, in particular, memecoins.
Related: Australia warns of AI, ‘finfluencers’ as Gen Z crypto ownership reaches 23%
Memecoins thrive in this environment. By design, they are made for virality and great coverage in the media and news. The issue is not that they are built on hype, but that they are made to catch the moment and disappear, in most cases. Every memecoin cycle, where it goes up and quickly falls down, strengthens the argument that digital assets are unsafe.
This creates a narrative duality. On one side, crypto is maturing, and institutionals flow in. On the other hand, the industry is still very FOMO-fueled, and this dominates the headlines. And as a result, the loudest crypto stories become more about speculative gains.
Risks that Gen Z underestimate
When Gen Z increasingly invests in crypto, many may be doing so without fully researching the risks. Sometimes they blindly trust TikTok advice without doing their due diligence or reaching out to a financial advisor.
Zoomers mostly feel confident in their decisions. More than 70% of Gen Z saying they are completely sure about their investing behavior. Confidence, however, and especially in crypto, does not mean competence. Younger generations are reportedly more susceptible to the Dunning-Kruger effect. They usually overestimate their knowledge and underestimate risks.
Beyond volatility as a primary risk, Gen Z often neglects the absence of transparency in crypto. Unlike public companies, digital assets have no reporting requirements. A “Wild West” like this, and lack of long-reaching regulation does not bother young crypto enthusiasts. On the contrary, they still trust crypto. They value transparency and direct control a lot. In fact, they should pay more attention to regulation. As it develops, it helps to protect investor rights and turn crypto into a more transparent and trustworthy market.
Investors can also forget that diversification does not simply mean putting 10-20% of your portfolio in crypto. There is the issue of correlation. During periods of systemic stress, crypto has at times moved in line with high-growth equities, weakening its diversification argument. Graphs show that Bitcoin can even correlate with gold, a traditional safe-haven asset.
Or imagine they, for example, choose the wrong coin that is going to fall and put in at least 25%. Without understanding how digital assets work, they risk losing a fourth of their investments.
Still, none of these risks devalues crypto’s role in modern portfolios. On the contrary, crypto might indeed be evolving into a genuine portfolio diversifier.
If that transformation is real, it comes with strings attached.
Opinion by: Alex Tsepaev, chief strategy officer at B2PRIME Group.
This opinion article presents the author’s expert view, and it may not reflect the views of Cointelegraph.com. This content has undergone editorial review to ensure clarity and relevance. Cointelegraph remains committed to transparent reporting and upholding the highest standards of journalism. Readers are encouraged to conduct their own research before taking any actions related to the company.

Introduction
Decentralized finance has unlocked something traditional finance never could: permissionless income generation. No bank approvals, no gatekeepers — just you, your capital, and smart contracts.
But there’s a problem.
Most beginners enter yield farming the same way:
They see 100%+ APY, ape in… and learn about risk the expensive way.
This guide fixes that.
Instead of throwing random strategies at you, we’ll walk through a step-by-step “Yield Farming Ladder” — a structured path from beginner to advanced, designed to help you earn sustainably while understanding the risks.
Why Most Beginners Lose Money in Yield Farming
Before we talk profits, let’s talk reality.
Most beginners lose money because they:
- Chase high APYs without understanding the source
- Ignore risks like impermanent loss
- Trust unaudited or hype-driven protocols
- Overcommit capital too early
Here’s the uncomfortable truth:
High yield isn’t free money — it’s risk in disguise.
If you don’t know where the yield comes from, you are the yield.
Level 1: Training Wheels — Stablecoin Lending
Best for: Absolute beginners
Risk level: Low
Typical returns: 3–8% APY
This is where you start.
You deposit stablecoins (like USDC or USDT) into lending protocols, and borrowers pay interest to use your funds.
Why this works for beginners:
- No exposure to price volatility
- No impermanent loss
- Simple mechanics
What you’re learning:
- How DeFi protocols work
- How yield is generated (real demand vs incentives)
Think of this as your DeFi savings account — except it actually pays.
Level 2: Liquidity Pools — Where Real Yield Begins
Best for: Beginners ready to level up
Risk level: Medium
Typical returns: 5–20% APY
Now you step into liquidity provision (LP).
You deposit token pairs into decentralized exchanges, and earn:
- Trading fees
- Incentives (sometimes)
Example:
Provide ETH + USDC → earn fees every time someone trades that pair.
New concept unlocked: Impermanent Loss
This is the “gotcha.”
If token prices move unevenly, you might earn fees… but still lose compared to holding.
Simple analogy:
You’re running a currency exchange booth. If exchange rates swing wildly, your inventory value changes too.
What you’re learning:
- Market exposure
- Fee-based yield vs incentive-based yield
Level 3: Yield Optimization — Work Smarter
Best for: Intermediate users
Risk level: Medium
Typical returns: Variable (often higher due to compounding)
At this stage, you stop doing everything manually.
You use yield aggregators that:
- Automatically reinvest your rewards
- Optimize across pools
- Save time and gas fees
Why this matters:
Manual farming is like watering plants one by one.
Aggregators?
They install an irrigation system.
What you’re learning:
- Capital efficiency
- Compounding strategies
- Protocol diversification
Level 4: Advanced Strategies — The Danger Zone
Best for: Experienced users only
Risk level: High
Typical returns: 20%–100%+ (with serious risk)
This is where things get spicy — and risky.
Strategies include:
- Leveraged yield farming
- Farming new/high-incentive protocols
- Looping (borrow → farm → repeat)
The trade-off:
Higher returns = higher chance of:
- Liquidation
- Smart contract exploits
- Total loss
Let’s be blunt:
This is where people either multiply their capital… or become a Twitter warning thread.
Proceed with caution.
The Risks You Cannot Ignore
If you skip this section, you’re basically speedrunning losses.
1. Smart Contract Risk
Bugs or exploits can drain funds instantly.
2. Impermanent Loss
LPs can underperform simple holding.
3. Protocol Risk
Not all platforms are audited or trustworthy.
4. Market Volatility
Crypto moves fast. Your yields can vanish just as quickly.
5. Overexposure
Putting everything into one strategy = one point of failure.
The Perfect Beginner Yield Farming Path
Here’s the roadmap that actually works:
Step-by-step progression:
- Start with stablecoin lending
- Move into ETH or major asset exposure
- Try stable liquidity pools
- Explore volatile LPs
- Experiment (carefully) with advanced strategies
The key principle:
Start simple. Scale with understanding — not hype.
Example: A Beginner-Friendly $1,000 Yield Portfolio
Let’s make this practical.
Sample allocation:
- $500 (50%) → Stablecoin lending
- $300 (30%) → Stable LPs
- $200 (20%) → Experimental strategies
Why this works:
- The majority of low-risk yield
- Some exposure to higher returns
- Limited downside if experiments fail
This isn’t about maximizing gains.
It’s about staying in the game long enough to learn.
Final Thoughts
Yield farming isn’t a shortcut to wealth.
It’s a system — one that rewards:
- Patience
- Understanding
- Risk management
The real edge isn’t finding the highest APY.
It’s knowing:
- Which yields are sustainable
- Which risks are worth taking
- When to scale… and when to step back
Because in DeFi, survival is the strategy.
And once you survive long enough?
That’s when the real compounding begins.
REQUEST AN ARTICLE


- Solana (SOL) price consolidates near $80 support amid strong fundamentals.
- Institutional staking and brokerage access boost Solana adoption.
- Key resistance at $87.65, and a breakout could target $97–$107.
Solana’s native token, SOL, has been showing signs of consolidation as it struggles to break through key resistance levels.
Despite a slight bounce today, the price remains confined below the $88 range.
At the same time, traders should closely monitor the altcoin which is currently hovering near the critical support at around $80, which has acted as a short-term floor for buyers.
On the surface, Solana’s technical structure appears cautious, with short-term momentum indicators showing weak buying pressure, but underneath this, Solana’s ecosystem is growing at a remarkable pace.
Solana’s fundamental strength fuels long-term confidence
One of the most compelling aspects of Solana’s recent performance is the surge in institutional and real-world adoption.
The network now hosts more than $2 billion in tokenized real-world assets according to rwa.xyz.
This milestone underscores Solana’s role not just as a blockchain for decentralized applications, but as a platform capable of handling complex financial instruments.
Institutional interest has also taken a significant step forward.
Staking products offering competitive yields have been launched, allowing both retail and institutional investors to earn returns on their SOL holdings.
These developments provide additional utility and financial incentives for participants, reinforcing Solana’s position as more than a speculative asset.
Adding to this, several traditional brokerage platforms including Galaxy now offer custody and trading services for SOL.
This integration reduces barriers for institutional investors and opens the door for mainstream adoption.
With access to regulated platforms, capital inflows could increase steadily, strengthening the network’s financial layer and liquidity.
On-chain activity remains robust as well, and the blockchain continues to see high transaction throughput, and its dominance in tokenized equity markets demonstrates that adoption is moving beyond hype-driven speculation.
Taken together, these factors highlight a token with real-world utility and strong growth potential.
Technical resistance holds back SOL’s price
Short-term market sentiment remains cautious, with recent outflows from Solana-focused ETFs reflecting institutional hesitancy despite the network’s improvements.
While the fundamentals are building, the price is still confined by technical hurdles.
SOL has found immediate resistance near $87.65, with historical data suggesting further caps at $97.56 and $106.95.

On the downside, the support zone at $75.85–$80.00 is critical for near-term stability.
A daily close below these zones could trigger a sharper decline toward $63.72, which has historically acted as a longer-term support.
Solana price outlook
Overall, Solana (SOL) is at a pivotal point where its fundamentals are strong, but the market has yet to fully recognize them.
Price action will likely depend on whether buyers defend support and whether institutional capital begins flowing into the network.
In the short term, traders should closely watch the near-term support zone between $80 and $77.32, since holding this level is crucial to prevent further selling pressure.
In case of a rebound, the immediate resistance is at $87.65, which if cleared could open the door to a rally towards higher targets at $97.56 and $106.95.
Built by Tezos R&D hub Trilitech, the new web app brings tokenized rare earth metals on-chain alongside gold and uranium as AI-driven industrial demand intensifies.
Dr. Ben Goertzel, CEO of the Artificial Superintelligence (ASI) Alliance, told BeInCrypto his team can recreate the quantum attack circuits that Google Quantum AI built but refused to publish. He warned that if his organization can do it, nation-states already can too.
Google’s March 30 whitepaper showed that two working circuits implementing Shor’s algorithm to break 256-bit elliptic curve cryptography could be built with fewer than 500,000 physical qubits. The team chose not to release the code and instead published a zero-knowledge proof. Goertzel told BeInCrypto that decision changes nothing.
“Keeping Capabilities Secret Buys You at Most a Very Short Window”
Google framed its decision to withhold the circuits as responsible disclosure. The blog post called it a deliberate departure from the team’s historical practice of full transparency, motivated by the potential for misuse.
The crypto industry largely debated whether this aligned with its founding principle of “don’t trust, verify.”
Goertzel did not share the concern. He told BeInCrypto the secrecy is functionally irrelevant.
We are confident that we could regenerate the ‘secret circuit’ Google found using our own expertise and reasonable compute, and if we can do it, the Chinese government and other well-resourced actors certainly can too. Keeping capabilities secret buys you at most a very short window.
He added that the ASI Alliance has not withheld any of its own code for safety reasons, though the team has discussed it internally. His default position is openness.
The security benefits of decentralized scrutiny, he argued, outweigh the marginal risk reduction of secrecy when parallel discovery is the norm.
He did leave room for exceptions. If something posed a specific, acute, short-term danger, the team would hold it back.
But Google’s circuit, in his view, does not meet that bar because the knowledge to build it is already widely accessible to capable actors.
The 41% Problem
The Google whitepaper models what it calls an “on-spend attack.” A quantum computer could prepare part of the calculation in advance, then crack a Bitcoin (BTC) transaction in about nine minutes once the public key is exposed.
Since Bitcoin’s average block confirmation takes 10 minutes, the attacker has a roughly 41% probability of finishing first.
The paper also estimates that roughly 6.9 million BTC are already held in wallets whose public keys have been exposed in some form.
That includes about 1.7 million coins from the network’s earliest years, as well as additional funds affected by address reuse and Bitcoin’s Taproot upgrade, which makes public keys visible by default.
Goertzel told BeInCrypto that a 41% attack rate is not a borderline risk. It is a structural failure.
Any attack success rate above single digits is deeply problematic for a store-of-value chain. Once rational actors believe there is a meaningful probability that a transaction can be reversed or an address drained during the confirmation window, the game-theoretic assurances that underpin Bitcoin’s security model collapse. At 41%, you are well past the threshold.
He noted that the hardware to execute such an attack does not yet exist. But the mathematical proof is complete, and Google has set a 2029 deadline for the industry to migrate to post-quantum cryptography (PQC).
Bitcoin currently has no coordinated upgrade roadmap to meet that deadline.
ASI Alliance Says It Was Built for This
While much of the industry debated the implications, Goertzel told BeInCrypto his team saw this coming years ago.
He has previously predicted that human-level artificial general intelligence (AGI) could arrive around 2027 or 2028.
Google’s quantum timeline puts both breakthroughs on a collision course, and Goertzel said the ASI Alliance designed its infrastructure for exactly that convergence.
The convergence of AGI and quantum computing is very real, but framing it as purely a ‘threat’ misses the other half of the picture. At the ASI Alliance we have been designing ASI:Chain from the ground up to be quantum-oriented–not just quantum-resistant but quantum-leveraging…So for us, quantum computing arriving alongside AGI is a feature, not a bug.
ASI:Chain, the layer-1 blockchain under development by the Alliance, uses MeTTa as its smart contract language instead of Solidity.
According to Goertzel, MeTTa includes quantum-type systems, and the team has developed quantum versions of core Hyperon AGI algorithms covering attention allocation, probabilistic logic, and evolutionary learning.
The encryption layer is modular. Quantum-safe cryptographic primitives, including lattice-based and hash-based schemes, can be plugged in without redesigning the chain or requiring a hard fork.
The cost is computational overhead, which Goertzel called a real engineering challenge but not an architectural one.
The Artificial Superintelligence Alliance (FET) was formed through a token merger of SingularityNET, Fetch.ai, Ocean Protocol, and CUDOS.
Ocean Protocol later exited the merger, a move that later triggered legal action amid token theft allegations.
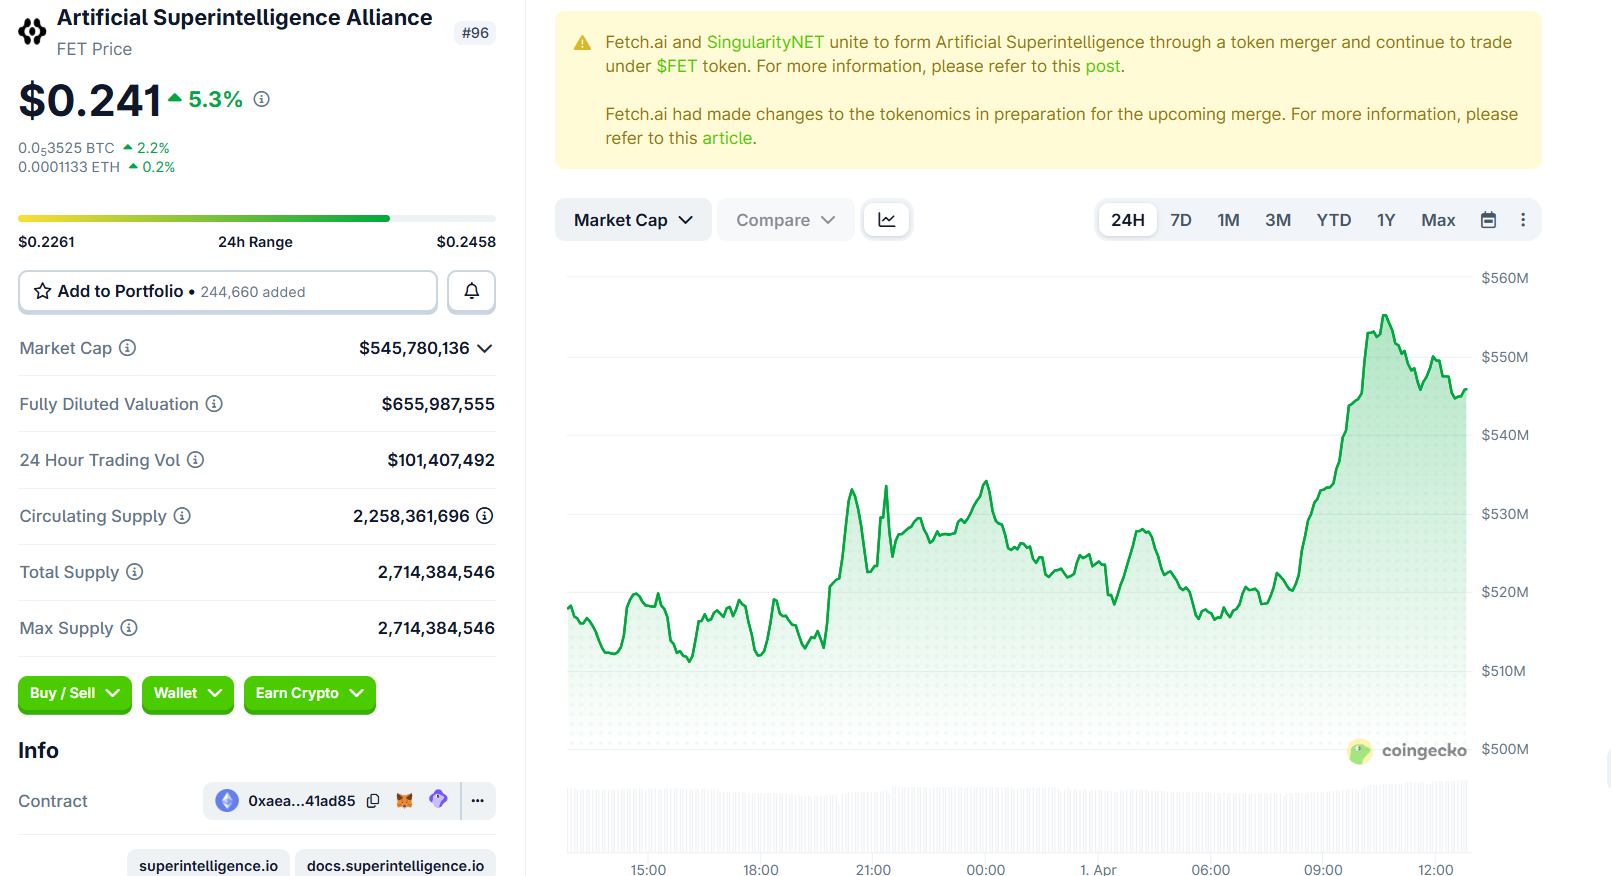
Its token, FET, currently trades at roughly $0.241, up by over 5% in the last 24 hours.
“A Catastrophic Precedent for Digital Property Rights”
Google’s whitepaper flagged roughly 1.7 million BTC in Satoshi-era Pay-to-Public-Key (P2PK) wallets that permanently expose their public keys.
These coins cannot be migrated. Their owners are either gone or unreachable. The paper proposed a “digital salvage” framework that could give governments legal authority to quantum-crack dormant coins.
Goertzel rejected the premise.
On principle, no–giving governments a legal pathway to crack private wallets sets a catastrophic precedent for digital property rights. The entire value proposition of crypto rests on the idea that your keys are your coins. Once you establish that a sufficiently powerful actor can legally seize coins whose owners are absent, you have undermined the foundation.
He acknowledged that those coins will eventually be cracked by someone. The question is whether a legal framework governs the process or it becomes a free-for-all. He leans toward leaving dormant coins untouched as a matter of principle, with the ecosystem pricing in their eventual vulnerability.
Binance co-founder Changpeng Zhao (CZ) offered a different view, suggesting that if Satoshi’s coins do not move within a certain period, the community might consider locking or burning those addresses before hackers can reach them.
He added that identifying all of Satoshi’s addresses without confusing them with early holders would itself be a challenge.
The Race Is Already On
Venture capitalist Chamath Palihapitiya called Google’s paper “quite reasonable” and urged the crypto community to organize a quantum-resistance roadmap within the next few years.
CZ said crypto would survive the quantum era but warned that coordinating upgrades across decentralized networks would spark debates, forks, and potentially new security bugs.
Goertzel’s position is blunter. He told BeInCrypto the projects that survive will be the ones that started engineering for quantum years ago. The ones that start after the first coins get cracked will not make it.
Against this backdrop, his advice for retail holders is practical. Move holdings to addresses using the most recent key formats available.
For Bitcoin, that means native SegWit (bech32) addresses where the public key stays hidden until spending. Avoid reusing addresses. For Ethereum (ETH), the vulnerability is more structural, and individual-level options remain limited.
When asked whether the quantum threat kills the decentralization thesis entirely, Goertzel told BeInCrypto that it does not.
But it raises the stakes enormously. If a centralized actor cracks dormant Bitcoin and captures hundreds of billions in assets, that becomes a massive centralizing force. The thesis, however, was never premised on legacy cryptography lasting forever.
The decentralization thesis survives if decentralized projects out-engineer centralized ones on the quantum transition. That is exactly what we intend to do.
Google’s paper, combined with a separate Caltech and Oratomic study showing Shor’s algorithm can execute at cryptographic scale with 10,000 qubits, suggests the preparation window is shorter than most assumed.
Goertzel claims his team is already on the other side of that window. The rest of the industry is now racing to catch up.
The post ASI Alliance Can Rebuild Google’s Secret Quantum Circuit, CEO Ben Goertzel Says appeared first on BeInCrypto.
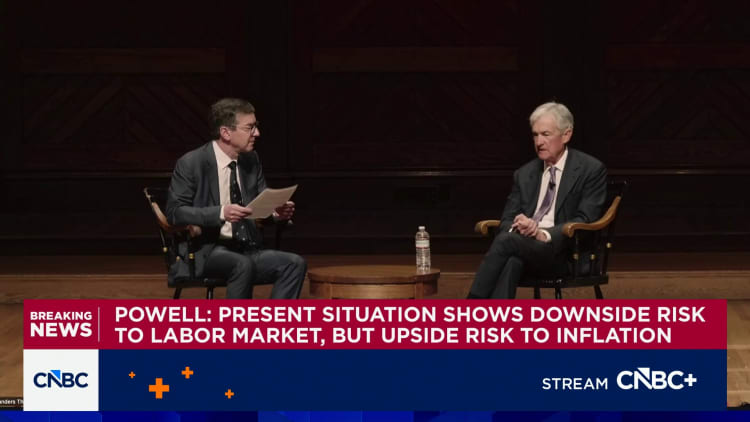

Federal Reserve Chair Jerome Powell, in a wide-ranging talk at Harvard University, said Monday that he sees inflation expectations as grounded despite rising energy prices so the central bank doesn’t need to respond with higher interest rates.
As his term leading the central bank nears an end, Powell avoided questions about the longer-term direction of interest rates or inclinations his designated successor has espoused.
In the near term, he said the proper move is to look beyond the short-term gyrations of the energy market and focus on the Fed’s goals of stable prices and low unemployment.
“Inflation expectations do appear to be well anchored beyond the short term, but nonetheless, it’s something we will eventually maybe face the question of what to do here,” he said during a question-and-answer question with a moderator and students. “We’re not really facing it yet, because we don’t know what the economic effects will be, but we’ll certainly be mindful of that broader context when we make that decision.”
As he has in the past, Powell said he believes the current rate target, in a range between 3.5%-3.75%, is “a good place” for the Fed to sit as it observes events currently playing out, including the Iran war and the impact tariffs are having on prices.
Jerome Powell, chairman of the US Federal Reserve, during a moderated conversation at Harvard University in Cambridge, Massachusetts, US, on Monday, March 30, 2026.
Mel Musto | Bloomberg | Getty Images
The comments appeared to register in financial markets, with traders no longer pricing in a significant chance of a rate hike this year. As recently as Friday morning, markets were looking at a better than 50% probability of a quarter percentage point increase amid expectations the Fed would react to the surge in energy costs. However, odds of a hike by December fell to 2.2% after Powell’s appearance.
Powell said raising rates now could have negative effects on the economy later. He noted that Fed rate moves have a lagged impact on the economy, so tightening here wouldn’t help the inflationary impact of the Iran war.
“By the time the effects of a tightening in monetary policy take effect, the oil price shock is probably long gone, and you’re weighing on the economy at a time when it’s not appropriate. So the tendency is to look through any kind of a supply shock,” he added.
Market-based measures such as breakeven rates in Treasury yields indicate few fears of an inflation spike. Breakevens measure the difference between Treasurys and inflation-indexed securities. The five-year breakeven rate most recently was around 2.56% and trending lower over the past 10 days.
Powell’s term ends in mid-May, and President Donald Trump has nominated former Governor Kevin Warsh as the next chair. However, Warsh’s nomination is being held up in the Senate Banking Committee as U.S. Attorney Jeanine Pirro continues her investigation into renovations at Fed headquarters.
Though a judge threw out a subpoena Pirro’s office issued to Powell, she has appealed the decision. While the case is being adjudicated, Sen. Thom Tillis, R-N.C., has vowed to prevent the nomination from going through.
For his part, Warsh has stated a preference for lower interest rates than the current level. Asked to comment on his successor’s plans, Powell said, “I’m not going to swing at that pitch.”
Regarding private credit, Powell noted rising defaults, investor withdrawals and concerns about wider issues in the $3 trillion sector.
“I’m reluctant to say anything that suggests that we’re dismissive of the risk, but we’re looking for connections to the banking system and things that might result in contagion. We don’t see those right now,” he said. “What we see is a correction going on, and certainly there’ll be people losing money and things like that. But it doesn’t seem to have the makings of a broader systemic event.”

Why Residential Elevators Are Becoming Essential in South Carolina Homes

People Against Genocide once again target Elbit’s insurers

Inaugural Little Andaman Pro 2026 To Kick Off India’s Surfing Season As Asian Games Debut Beckons


-

 News Videos7 days ago
Parliament publishes latest register of MPs’ financial interests
-

 Business6 days ago
Instagram, YouTube Found Responsible for Teen’s Mental Health Struggle in Historic Ruling
-
 Tech6 days ago
Intercom’s new post-trained Fin Apex 1.0 beats GPT-5.4 and Claude Sonnet 4.6 at customer service resolutions
-
 NewsBeat7 days ago
Tesco is selling new Cadbury Dairy Milk bar and people can’t wait to try it
-

 NewsBeat5 days ago
The Story hosts event on Durham’s historic registers
-

 Sports5 days ago
Sweet Sixteen Game Thread: Tide vs Michigan
-
Entertainment2 days ago
Fans slam 'heartbreaking' Barbie Dream Fest convention debacle with 'cardboard cutout' experience
-
 Entertainment4 days ago
Lana Del Rey Celebrates Her Husband’s 51st Birthday In New Post
-
Crypto World1 day ago
Dems press CFTC, ethics board on prediction-market insider trades
-

 Sports21 hours ago
Tallest college basketball player ever, standing at 7-foot-9, entering transfer portal
-
 Fashion7 days ago
How to Style Spring Like WeWoreWhat: Easy Outfit Ideas for 2026
-

 Tech2 days ago
The Pixel 10a doesn’t have a camera bump, and it’s great
-

 Entertainment6 days ago
HBO’s Harry Potter Series Will Definitely Fail For One Big Reason, And It’s Not J.K. Rowling Or Snape
-

 Crypto World2 days ago
U.S. rule change may open trillions in 401(k) funds to crypto
-

 Fashion6 days ago
En Vogue in Brown Leather and Tailored Neutrals by Atelier Savoir, Styled by J Bolin
-

 Tech1 day ago
How to back up your iPhone & iPad to your Mac before something goes wrong
-

 Fashion6 days ago
What Are Your Favorite T-Shirts for the Weekend?
-

 Fashion5 days ago
Weekly News Update, 3.27.26 – Corporette.com
-

 Politics2 days ago
Should Trump Be Scared Strait?
-

 Sports2 days ago
Women’s hockey camp eyes fitness boost, tactics ahead of WC 2026 campaign | Other Sports News
You must be logged in to post a comment Login