

Crypto World
Bitcoin rally continues as Grayscale calls bull market

As Bitcoin price continues to march higher towards $80,000, Grayscale researchers believe the asset has likely already formed a market bottom and is entering the early phase of a new bull cycle.
Summary
- Bitcoin price climbed to a 10-week high above $78,000 after U.S. President Donald Trump extended the Iran ceasefire, easing geopolitical tensions.
- Grayscale Research said on-chain data points to a market bottom, with short-term holders nearing breakeven and sell pressure declining.
- Bitcoin futures open interest rose 5.6% to $60 billion, signaling increased bullish positioning as traders anticipate further upside.
Bitcoin (BTC) price reached a 10-week high above $78,000 on Wednesday as geopolitical tensions eased.
According to data from crypto.news, Bitcoin price rose 4.4% on April 22 to $78,251, after which it stabilized around $78,000 at the time of writing. At its present price, the token is 19% higher than its lowest point last month and 24% above its year-to-date low.
Bitcoin price rallied following Trump’s announcement to extend the ongoing ceasefire with Iran, as the market awaits more substantive talks to bring an end to the eight-week war that began on Feb. 24.
Despite the extension, Trump noted that the U.S. blockade on the Strait of Hormuz and Iranian ports would remain in action until Iran submits a proposal for talks to resolve the conflict permanently.
With Bitcoin trading close to a two-month high, Grayscale Research’s head of research, Zach Pandl, outlined a constructive outlook for the asset. Writing in The Stack, Pandl cited on-chain indicators showing that recent buyers are nearing breakeven following a rebound of over 20% from February lows near $63,000.
The realized price for coins that moved within the past one to three months now sits around $74,000. That shift suggests short-term holders have largely exited loss-making territory, which could ease selling pressure and support a change in sentiment. Pandl views the $65,000 to $70,000 range as a firm base.
While Bitcoin remains below its October 2025 peak, the current recovery mirrors early-stage behavior seen in previous upcycles.
“If Bitcoin price rises further in the coming days, more recent buyers would move into positive PnL, which can be an indicator for marking the first phase of a bull market,” Pandl said.
Data from the Bitcoin derivatives market compiled by CoinGlass seems to show that investors have already started repositioning for further gains. In the past 24 hours, total Bitcoin Futures open interest has risen by 5.6% to $60 billion. This suggests that an increasing number of investors are betting on Bitcoin to climb higher, a sentiment evident with a long/short ratio of 1.02.
Bitcoin price analysis
On the daily chart, Bitcoin price action has formed an ascending parallel channel pattern where it consistently carves out higher highs and higher lows. As long as Bitcoin successfully trades within the boundaries of this channel, the asset would continue to remain in an uptrend, potentially reaching $80,000 next before moving toward its previous record highs.
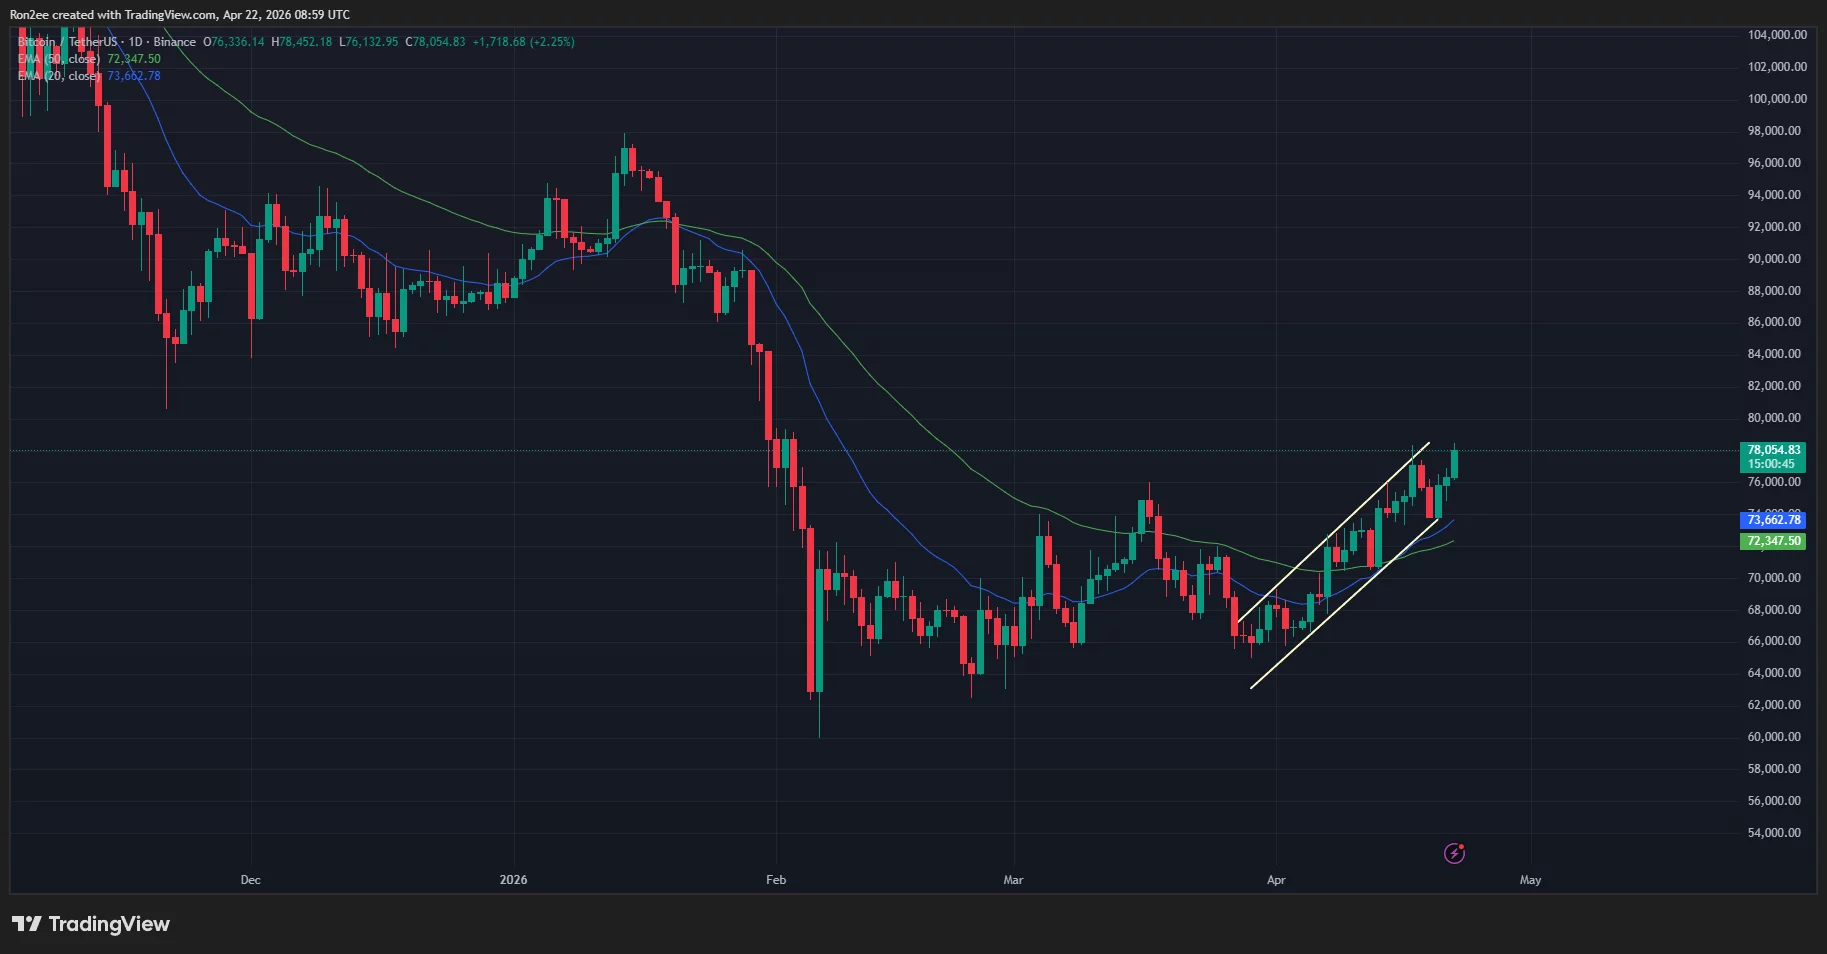
The 20-day EMA has formed a bullish crossover with the 50-day EMA, which means the short-term momentum is now firmly in favor of the buyers. Meanwhile, the daily RSI shows there is still room for further gains before the market becomes overbought, allowing for more growth before experiencing any significant pullback.
Disclosure: This article does not represent investment advice. The content and materials featured on this page are for educational purposes only.


Poland’s Sejm is reviewing four rival crypto bills while the PiS opposition dangles a separate ban proposal, turning MiCA implementation into a high‑stakes regulatory brawl.
Summary
- The Polish Sejm has begun simultaneous review of four competing cryptocurrency regulatory bills, with a second reading vote expected Thursday, after President Karol Nawrocki vetoed related legislation twice.
- The central dispute is over how much power to give financial regulator KNF to freeze accounts and levy fines, with maximum penalties ranging from roughly 20 million zlotys ($5.5 million) in the presidential draft to 25 million zlotys ($6.9 million) in the Ministry of Finance version.
- The opposition Law and Justice party has thrown a wrench into proceedings by submitting a separate bill calling for a complete ban on crypto-related activities in Poland, the only such proposal among major EU member states at a time when MiCA is already in force across the bloc.
Poland’s lower house of parliament, the Sejm, is now reviewing four simultaneous and competing cryptocurrency regulatory bills after Speaker Włodzimierz Czarzasty confirmed the formal review process has begun, according to reporting by The Block. The four proposals come from the government, the presidential office, the Poland 2050 party and the Confederation party, reflecting a fractured political landscape in which no single faction commands enough support to pass a unified crypto framework on its own. A second reading vote is expected as early as Thursday.
Four bills, one parliament, and a ban proposal on the side
The legislative deadlock has roots in executive-legislative conflict. President Karol Nawrocki has already vetoed crypto-related legislation twice, and the current multi-bill review is in part a consequence of those vetoes forcing the Sejm to restart negotiations from scratch. The core technical dispute is narrow but consequential: how much enforcement power the Polish Financial Supervision Authority (KNF) should have over crypto firms, specifically its ability to freeze accounts and impose maximum fines. The presidential draft caps penalties at approximately 20 million zlotys, equivalent to about $5.5 million, while the Ministry of Finance’s version pushes that ceiling to 25 million zlotys, or roughly $6.9 million — a 25% gap that reflects a deeper disagreement about whether Poland’s crypto regulatory posture should prioritize innovation or investor protection.
Into that already complicated debate, the opposition Law and Justice party (PiS) dropped a separate bill on Monday calling for a complete ban on crypto asset-related activities in Poland. PiS had previously withdrawn support for earlier regulatory proposals, and its ban draft will only enter formal review after the four main bills are processed, according to Speaker Czarzasty. The Speaker also used the occasion to raise pointed questions about potential political financing issues in the crypto sector, specifically referencing Polish exchange Zondacrypto and asking whether industry funding had influenced political activities — a line of inquiry that injects a corruption subtext into what had been a relatively technical regulatory debate.
Poland’s crypto bill chaos in a post-MiCA Europe
The Polish parliamentary standoff is unusual within the European Union context. MiCA — the Markets in Crypto-Assets regulation — entered into full force across all 27 EU member states in December 2024, giving exchanges, stablecoin issuers and crypto asset service providers a harmonized licensing framework that national legislatures are supposed to implement rather than override. Poland is therefore not debating whether to regulate crypto under MiCA, which already applies, but rather how aggressively to set national enforcement parameters on top of the EU baseline, a distinction that makes PiS’s outright ban proposal legally problematic as well as politically radical.
For the broader European crypto market, Poland matters more than its size might suggest. The country has one of the largest retail crypto user bases in Central and Eastern Europe, and Zondacrypto — formerly known as BitBay — is one of the continent’s older and better-capitalized domestic exchanges, now operating under a MiCA transitional license. A regulatory outcome that imposes KNF account-freeze powers and $6.9 million penalty ceilings would be broadly workable for established players, while an outright ban, even if constitutionally and EU-law challengeable, would create immediate operational uncertainty. As a crypto.news story on Australia’s capital gains tax overhaul showed, retail-heavy crypto markets are highly sensitive to sudden shifts in the legal and tax treatment of digital assets, and Poland’s Thursday vote — whatever its outcome — will be closely watched by exchanges and compliance teams operating across the EU’s eastern flank.
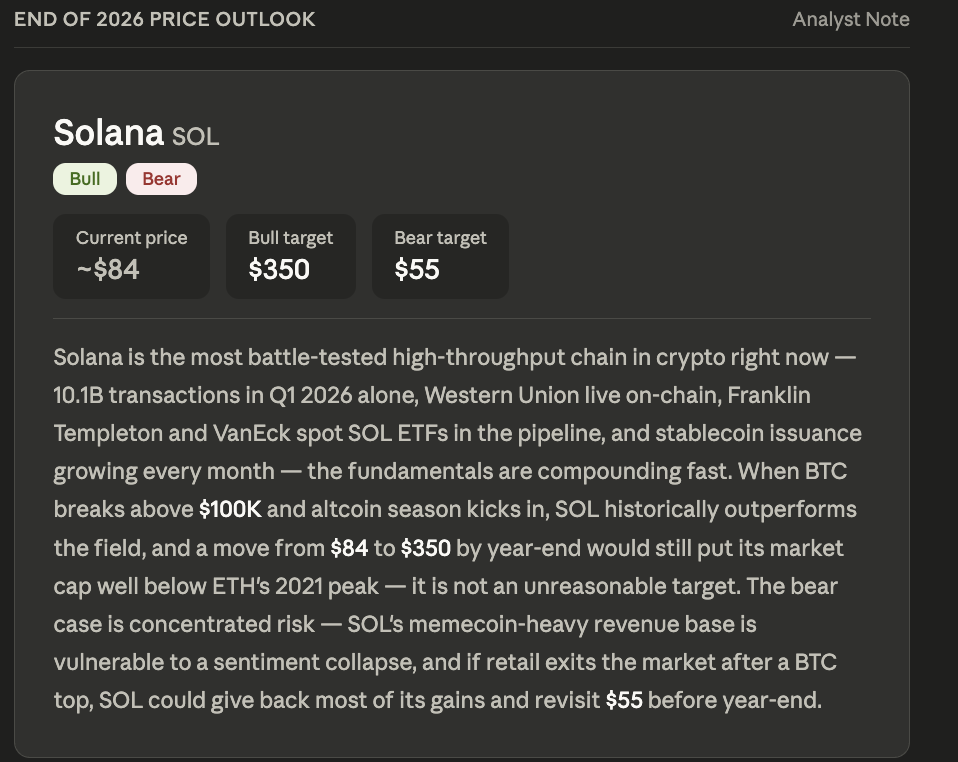
Recently, Solana traded like a chain nobody believes in anymore. Claude AI looked at the fundamentals and disagreed entirely and predicted a higher price.
The target it came back with was $350.
The argument starts with raw throughput data that is hard to argue with. Solana processed 10.1 billion transactions in Q1 2026 alone.
Western Union is live on-chain. Franklin Templeton has a product on the network. Stablecoin issuance is growing every single month.
These are not roadmap promises; they are numbers that are already happening, and Claude AI’s point is that the fundamentals are compounding faster than price is reflecting. The deeper argument is a market structure one: when BTC breaks above $100,000 and altcoin season rotates in, SOL historically outperforms the field by a significant margin.

A move from $84 to $350 by year-end would still leave SOL’s market cap well below ETH’s 2021 peak, meaning the target is not asking for price discovery into uncharted territory; it is asking for a catch-up trade with precedent.
The bear case is the sharpest thing in the entire prediction. Claude identifies SOL’s memecoin-heavy revenue base as a concentrated risk that most bulls are not pricing in.
If retail exits the market after a BTC top and the memecoin economy collapses with it, Solana loses a disproportionate share of its fee revenue and narrative appeal. The AI puts the downside at $55 in that scenario, which, from the current price, is a 42% drawdown.
That is the trade: 4x up or nearly half down, depending entirely on whether this cycle’s retail wave arrives or doesn’t.
Solana Price Prediction: Chart Now Says Something Different, Can it Hit $350 as Claude AI Predicts?
Solana price is trading at $95.72 on the daily, and the chart frames the last 7 months as one of the more violent drawdowns in this cycle.
Price peaked around $255 in November 2025, collapsed to $70 by February 2026, and has been slowly rebuilding ever since.
The recovery has been choppy, but the direction has been consistent: higher lows, gradual compression toward the $100 level that now acts as the defining line for everything.
That $100 zone is the resistance that matters. It has been the ceiling since the February crash, and every rally attempt has stalled right at or just below it.
SOL is pressing into it right now at $95.72, which makes the next few daily closes the most important price action on this chart.
A clean break and hold above $100 flips it from resistance to support and opens the path toward $120 and then $150, which is where the next major supply cluster sits from the December consolidation on the way down.
Support below is $80 to $85, the base that has held through every dip since March, and where buyers have been consistent. Lose that, and $70 comes back into play fast, which is exactly the washout Claude flagged in the bear case.
LiquidChain Could Be The Next Big Winner, According to Claude
Large caps are stuck. BTC, ETH, and XRP are all pinned under resistance, waiting on macro conditions and institutional inflows that have not shown up yet. Until they do, upside stays limited, and moves stay slow.
That’s exactly when capital starts hunting for earlier-stage setups. The kind where upside is not already priced in and does not require billions in new inflows to move the needle.
LiquidChain is targeting that gap directly. The project is building a cross-chain execution layer that connects Bitcoin, Ethereum, and Solana into a single environment, removing the fragmentation that forces users and assets to inefficiently navigate between ecosystems. One deployment, three ecosystems, no friction.
The presale is sitting at $0.01454 with just over $700,000 raised. Early discovery phase, not a fully priced asset.
The tradeoff is honest. Execution, post-launch adoption, and liquidity remain unknowns. That is the nature of early-stage infrastructure. The potential is higher, and so is the risk.
The choice is simple. Large caps offer stability with conditional upside that depends on catalysts outside your control. LiquidChain offers earlier positioning with asymmetric potential and all the execution risk that comes with it.
Explore the LiquidChain Presale
The post Leading AI Claude Predicts the Shocking Price of Solana by the End of 2026 appeared first on Cryptonews.

Global cross-asset marketplace LMAX Group has launched Kiosk, a hosted portal that lets institutional clients deposit digital assets into LMAX Custody and use them as collateral to trade across its FX, metals, derivatives and crypto markets.
The product allows clients to post digital assets as collateral for spot foreign exchange, precious metals, contracts for difference, perpetual futures and digital assets, the company said Tuesday.
Kiosk includes tools for deposits, withdrawals, API credential management, WalletConnect, security controls and treasury management, according to LMAX.
The launch is part of LMAX’s broader push to connect traditional and digital markets by allowing crypto holdings to support trading activity across multiple asset classes.
“Hyper-efficient collateral will be the foundation of modern, converged capital markets,” said David Mercer, CEO at LMAX Group, adding that the new platform offers a compliant way for institutions to “integrate digital assets into their core trading infrastructure.”
The new platform is part of a broader trend to build more onchain collateral assets, following similar initiatives from institutions such as the Depository Trust & Clearing Corporation (DTCC) and Franklin Templeton.

LMAX Digital cryptocurrency platform. Source: Lmaxdigital.com
Institutions are experimenting with onchain collateral
Some of the largest financial institutions are experimenting with tokenized securities and onchain collateral assets.
Earlier in February, investment manager Franklin Templeton announced the launch of an institutional collateral program with crypto exchange Binance, which lets clients use tokenized money market fund (MMF) shares as collateral for trading activity, while the underlying assets remain in regulated custody, Cointelegraph reported.
Franklin Templeton said the model was designed to let institutions earn yield on regulated money market fund holdings while using the same assets to support digital asset trading, without giving up existing custody.
Related: Capital B raises $17.8M to expand its Bitcoin treasury
On May 4, the DTCC announced plans to launch a pilot for trading tokenized securities in July, aiming for the full launch of the service in October, Cointelegraph reported. DTCC said the service will offer tokenized real-world assets with the same investor protections and ownership rights as the assets held in traditional form.
Magazine: Strategy reveals why they would sell BTC, Trump Media posts loss: Hodler’s Digest, May 3 – 9

TLDR
- SparkLend increased its wBTC deposit cap from 3,000 to 30,000, effective May 11, 2026.
- The previous 3,000 wBTC limit was reached shortly after the asset was listed on March 31, 2026.
- SparkLend uses an automated system that raises the cap by 500 wBTC every 12 hours.
- The protocol will take about 27 days to scale the limit fully to 30,000 wBTC.
- SparkLend reported total value locked of approximately $3.55 billion in May 2026.
SparkLend has lifted its Wrapped Bitcoin deposit cap from 3,000 to 30,000 wBTC, effective May 11, 2026. The DeFi lending protocol operates within the MakerDAO ecosystem and confirmed the update after reaching the previous ceiling. The change expands borrowing capacity and increases available liquidity for Bitcoin-backed positions on the platform.
SparkLend and wBTC: Deposit Ceiling Expands Tenfold
SparkLend listed wBTC on March 31, 2026, and users filled the 3,000 wBTC cap within weeks. The protocol was then approved for a tenfold increase to meet sustained demand. The new limit sets the maximum deposit level at 30,000 wBTC.
The platform uses a cap automator to adjust limits in scheduled increments. It increases the ceiling by 500 wBTC every 12 hours. At that pace, the system will require about 27 days to reach the full 30,000 wBTC threshold.
SparkLend confirmed the update took effect on May 11, 2026. The protocol stated that the automated process will continue until it reaches the new cap. The system does not raise the full amount at once but follows programmed intervals.
The protocol reported total value locked of about $3.55 billion in May 2026. Reports showed TVL reached $3.6 billion in April 2026. The figures reflect on-chain data tracked across supported assets.
Bitcoin-Linked Assets Shape Platform Growth
SparkLend also supports cbBTC and LBTC as Bitcoin-linked collateral options. These assets allow users to access decentralized borrowing across different networks. The protocol integrates them to expand liquidity sources tied to Bitcoin.
The expansion of the wBTC cap removes previous access limits for new depositors. Before the change, users could not deposit once the 3,000 wBTC ceiling was reached. The revised structure now permits additional participation over time.
wBTC maintains a 1:1 peg with Bitcoin through custodial backing. The asset depends on reserve transparency and operational integrity. Any disruption in that structure can affect protocols that hold wBTC.
Sharp Bitcoin price declines can trigger loan liquidations tied to wBTC collateral. Liquidations can increase selling pressure on underlying assets. This mechanism remains standard across decentralized lending platforms.
SparkLend stated that support for cbBTC and LBTC spreads exposure across Bitcoin-linked instruments. The protocol continues to operate within MakerDAO’s framework. The cap expansion process remains active as of May 2026.


Osero, a stablecoin yield infrastructure project incubated by Stablewatch and Soter Labs, raised $13.5 million in a round led by the Sky Ecosystem and co-led by Plasma.
The round included angel investors representing USDT0, Maple, Accountable, Four Pillars, RedStone, The Rollup and Kairos Research, according to an announcement.
Stablecoins have grown to more than $300 billion, according to DeFiLlama data. Most yield from the assets backing those stablecoins still goes to issuers like Circle and Tether, leaving holders with no direct return and fintech firms with limited ways to offer stablecoin savings products without managing assets themselves.
Osero is launching three products. Osero Earn which lets wallets, neobanks, custodians and exchanges embed the Sky Savings Rate into their own interfaces. Osero App, which gives users direct access to the rate across chains, and Osero Foundry, which gives asset managers and structured product issuers a way to bring yield products onchain.
Osero Earn is meant to be integrated with roughly 10 lines of code, according to the company. The product routes deposits into the Sky Savings Rate while Osero handles the underlying asset-management, routing and risk infrastructure.
Osero Foundry will provide up to $2.5 billion in allocation capacity for anchor funding, swap liquidity and lending liquidity. Each deployment will go through a Basel III-inspired risk review, Osero said.
The $13.5 million raise will fund capital requirements for Osero’s first Foundry allocations. The capital will be used to underwrite the first cohort of deployments under the risk framework used for the Sky Protocol’s assessment process.
Sky, formerly MakerDAO, has been expanding the balance sheet and distribution network around USDS and sUSDS. Sky received a B- rating from S&P last year, in the first credit rating assigned by the agency to a DeFi protocol.
Sky-backed projects have also pushed into yield-bearing real-world asset products. Obex said in March it was spreading $1 billion across credit, energy and AI assets to expand stablecoin yield.
Plasma, which co-led the round, is building a stablecoin-focused blockchain. Its token sale drew $373 million last year in an oversubscribed sale.


Ethereum’s new ERC‑7730 Clear Signing standard replaces hex gibberish in wallet prompts with human‑readable, auditable transaction summaries to slash phishing and blind signing losses.
Summary
- The Ethereum Foundation’s Clear Signing working group and Ledger co‑designed ERC‑7730, a standard that turns today’s cryptic wallet calldata into plain‑language transaction summaries.
- Clear Signing uses a JSON description format, a public registry tied to contract addresses, and third‑party audits so wallets can show accurate, WYSIWYS intent without changing on‑chain logic.
- The push comes as phishing and approval scams outpace protocol hacks; incidents like the CoW DAO domain hijack and Binance’s 22.9M blocked phishing attempts show why legible prompts are critical.
The Ethereum Foundation’s Clear Signing working group has published a new open standard designed to replace the cryptic, machine-readable hex data that wallets currently display when users are asked to approve a transaction, according to an official Ethereum Foundation blog post. Built on the ERC-7730 specification, Clear Signing standardizes how transaction intent is described, displayed and verified across wallets, aiming to give users a plain-language summary of what will actually happen on-chain before they click approve.
ERC-7730 and the end of unreadable transaction prompts
The problem Clear Signing addresses is one of crypto’s oldest and most exploited UX failures. When a user interacts with a smart contract — whether approving a token spend, listing an NFT, or authorizing a DeFi position — most wallets today display raw calldata or a partial ABI decode that is unreadable to anyone who is not a developer. That gap between what the screen shows and what the transaction actually does is the core mechanic behind a significant portion of phishing attacks, where malicious dApps present a benign-looking interface while the underlying transaction drains a wallet. Ledger, which co-developed ERC-7730 alongside the Ethereum Foundation working group, has described the standard as a direct response to that attack surface, noting that “blind signing” has been one of the top two causes of significant user losses in hardware wallet incidents.
Clear Signing’s architecture has three components. First, a unified JSON-based description format tied to ERC-7730 that dApp developers use to annotate their contracts with human-readable explanations of each function call and parameter. Second, a public registry where those descriptions are stored, versioned and linked to deployed contract addresses so wallets can pull the relevant metadata at signing time. Third, an independent verification and auditing layer where third parties can review and attest to the accuracy of a contract’s descriptions, creating a trust chain between the dApp developer’s intent and what the wallet ultimately displays.
WYSIWYS: what changes for users and what stays the same
The standard is explicitly designed to be non-breaking. Clear Signing does not alter how transactions are structured, broadcast or settled on-chain, meaning existing smart contracts, Layer 2 networks and DeFi protocols require no changes to benefit from it. The improvement is entirely in the wallet presentation layer: instead of showing a raw hex string or a partial parameter dump, a Clear Signing-compatible wallet will display something like “Approve Uniswap to spend up to 500 USDC from your wallet” or “List CryptoPunk #4156 for sale at 40 ETH on OpenSea” — a precise, audited, human-readable description derived from the ERC-7730 registry entry for that contract.
For the broader Ethereum security ecosystem, Clear Signing arrives at a moment when wallet-level phishing and approval scams remain the dominant attack vector for retail users even as protocol-level exploits become harder to execute on mature, audited contracts. A recent crypto.news story on the CoW DAO domain hijacking incident — where attackers redirected users to a phishing site for 4.5 hours and induced them to sign malicious transactions — illustrated precisely the failure mode Clear Signing is designed to mitigate: users who could read what they were signing would have had a much better chance of catching the anomaly before approving the drain. In parallel, a crypto.news story on Ethereum’s Glamsterdam devnet progress detailed how the Foundation is simultaneously advancing execution-layer upgrades and leadership restructuring, with Clear Signing fitting into a broader push to make Ethereum safer and more accessible at every layer of the stack without waiting for protocol-level changes to propagate. As a crypto.news story on AI-enabled crypto fraud noted, Binance’s own security data shows 22.9 million phishing attempts intercepted in Q1 2026 alone — a volume that underscores why making transaction approval legible to ordinary users is no longer a UX nicety but a security imperative.

TLDR
- Ambiq Micro shares soared 30% to reach $59.51 following first-quarter revenue of $25.1 million, representing a 59% year-over-year increase and surpassing the $21.5 million analyst forecast.
- The company’s adjusted loss per share of 25 cents outperformed Wall Street’s consensus projection of a 36-cent loss.
- Edge AI demand fueled growth, with over 80% of shipped units in the quarter executing AI algorithms.
- Second-quarter revenue guidance of $31–$32 million significantly exceeded the $25.7 million analyst consensus.
- AMBQ’s performance contrasted sharply with the broader semiconductor sector, as the iShares Semiconductor ETF dropped 5.8%.
Shares of Ambiq Micro (AMBQ) rocketed 30% higher to $59.51 during Tuesday’s trading session after the Texas-headquartered semiconductor company reported first-quarter financial results that substantially exceeded Wall Street projections across key metrics.
The company recorded first-quarter revenue of $25.1 million, marking a 59% increase compared to the prior-year period. This figure significantly outpaced the $21.5 million analyst consensus. On a per-share basis, the adjusted loss narrowed to 25 cents, representing an improvement from the 38-cent loss posted in the year-ago quarter and beating the Street’s expectation of a 36-cent deficit.
Since making its public debut last July at an initial offering price of $24 per share, AMBQ stock has more than doubled in value.
Chief Executive Officer Fumihide Esaka highlighted the company’s “exceptional momentum” during the first quarter, attributing the performance to “accelerating demand for edge AI capabilities.” The company specializes in chips engineered to execute AI processes locally on devices rather than depending on cloud-based infrastructure.
Ambiq’s semiconductor solutions are deployed across various applications including smart watches, industrial sensors, portable gaming devices, and connected home products. More than 80% of the units the company shipped during the first quarter were equipped to run AI algorithms.
Second-Quarter Outlook Exceeds Projections
Looking ahead to the current quarter, Ambiq projected net sales ranging from $31 million to $32 million. This forecast substantially surpassed Wall Street’s consensus estimate of $25.7 million.
The chipmaker remains unprofitable at current revenue levels. During the earnings conference call, Chief Financial Officer Jeff Winzeler indicated that quarterly revenue would need to reach approximately $47 million for the company to achieve breakeven status.
Winzeler expressed optimism that the company could attain this milestone by mid-2028, with a possibility of reaching it as soon as late 2027.
The company’s SPOT platform — featuring ultra-low-power chip architecture — serves as the foundation for its edge AI push. Management emphasized plans to broaden the technology’s application across additional form factors, customer segments, and market verticals.
Esaka cited “established technology leadership, positive demand trends, and a robust product roadmap” as key factors supporting his confidence in sustained growth momentum.
Outperformance Amid Semiconductor Sector Weakness
Ambiq’s impressive quarterly results provided a stark contrast to the broader semiconductor industry’s performance on Tuesday.
The iShares Semiconductor ETF (SOXX) tumbled 5.8% during the session, marking its steepest single-day decline since October, based on Dow Jones Market Data.
While the majority of chip stocks traded lower, AMBQ defied the sector-wide weakness by a substantial margin.
The company’s first-quarter non-GAAP loss per share of 25 cents compared favorably to the consensus projection of a 36-cent loss. Top-line revenue of $25.1 million exceeded analyst expectations of $21.49 million.
Ambiq’s second-quarter revenue outlook of $31–$32 million signals ongoing sequential expansion as the company progresses toward its profitability objective.
The number Mark Zuckerberg Meta AI predicts on Bitcoin price prediction by end-2026 is not $100,000. It is not $150,000 either.
It is $250,000. And the logic behind it is cleaner than most people expect from a social media company’s AI.
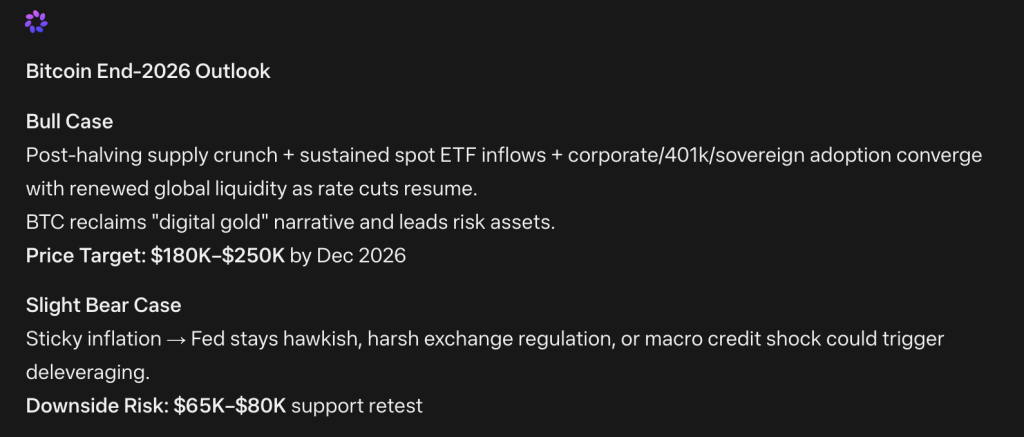
Meta’s model does not rely on a single catalyst. It stacks 4, all moving simultaneously. The post-halving supply crunch is already in effect, reducing new BTC issuance at the exact moment spot ETF inflows are pulling coins off exchanges at scale.
Layer corporate treasury adoption, 401k integration, and sovereign wealth fund positioning on top of that, and you have a demand profile that is structurally different from any previous cycle.

The final piece is macro: rate cuts resuming means global liquidity is expanding again, and Bitcoin has historically front-run liquidity cycles hard.
Meta frames all of this under the digital gold narrative, fully reclaimed, which means BTC is no longer competing with risk assets for capital; it is competing with gold for reserve allocation.
That is a different game entirely, and the AI thinks the trade looks like a $180,000 to $250,000 range when it plays out.
The bear case is tight but credible. Sticky inflation keeping the Fed hawkish longer than expected, a harsh regulatory move on exchanges, or a macro credit shock could trigger forced deleveraging across leveraged positions.
Meta puts the downside retest zone at $65,000 to $80,000 in that scenario, which is actually not that far from where BTC USD price sits right now. The floor is closer to the ceiling than the uncomfortable truth sitting underneath this prediction.

Bitcoin Price Prediction: $250,000 Target, Here Is the Distance the Chart Has to Cover to Hit Meta AI Predicts
BTC USD price is trading at $80,890 on the daily, having clawed back roughly $20,000 from the February low of $61,000 in what is shaping up as one of the steadier recoveries of this cycle.
No blowoff candles, no euphoric gaps. Just a consistent grind of higher lows since the bottom, which is actually the healthiest way to rebuild structure after a crash of that size.
The immediate problem is resistance at $82,000-$84,000. That zone has been tested twice in the past 2 weeks and rejected both times.
It is the remnant of the pre-crash consolidation range from late 2025, and it is where sellers who missed the top are sitting.
A clean break above $84,000, with volume, changes the entire picture and opens the path toward $90,000, then toward the $96,000 to $98,000 area, where the real overhead supply from October and November kicks in.
Support below is $76,000 to $78,000, the launchpad for the current leg, and where buyers have shown up consistently since March. Lose that zone, and the recovery thesis gets complicated fast, putting Meta’s bear-case floor of $65,000 back into a realistic range.
The gap between $80,890 and $250,000 is large. But so was the gap between $61,000 and here, and that closed in 3 months.
Meta Projects That Bitcoin Hyper Could Outperform Bitcoin Next
Some traders rotating between cycles are already looking past large caps entirely.
Bitcoin Hyper is positioning itself for that rotation. The project is building the first Bitcoin Layer 2 with Solana Virtual Machine integration, claiming sub-Solana latency while keeping Bitcoin’s security layer intact.
Fast, low-cost smart contracts on Bitcoin without abandoning its trust model. That is a gap neither Ethereum nor Solana fills directly.
The presale has raised $32.5 million at $0.013679 per token with high APY staking available for early participants.
The risk profile is different here. Higher upside potential, earlier entry, and significantly more execution risk than anything trading on major exchanges. That tradeoff is the whole point.
The post Mark Zuckerberg New META AI Predicts the Price of Bitcoin by The End of 2026 appeared first on Cryptonews.
Crypto World
Bhutan’s Gelephu Mindfulness City unveils fast-track licensing for global finance and crypto firms

Gelephu Mindfulness City (GMC), Bhutan’s Special Administrative Region for economic development, has introduced an accelerated licensing pathway for companies already regulated in leading global financial centres, including Singapore, Abu Dhabi Global Market, and Hong Kong.
Announced on 12 May, the initiative is designed to allow qualified firms to move from application to full operational readiness in a significantly shorter timeframe by combining expedited regulatory review with immediate access to banking infrastructure.
GMC said the new framework enables firms to incorporate, receive regulatory approval, open a corporate bank account, and begin operations through a single, coordinated process, removing delays often associated with entering new markets.
Accelerated licensing pathway for established firms
Under the new framework, companies that already hold licences in established financial centres such as Singapore, ADGM, and Hong Kong will be eligible for accelerated review, reflecting their existing regulatory standing.
GMC said the approach is intended to reduce duplication, maintain high standards, and help credible firms expand internationally with greater speed and certainty.
“GMC is designed to remove friction from the system. If a company has already demonstrated credibility in leading jurisdictions, we recognize that – and enable them to move faster,” said Jigdrel Singay, Board Member and Digital Assets & Fintech Lead, Gelephu Mindfulness City.
This accelerated pathway, combined with immediate access to banking, fundamentally changes the setup experience. Companies don’t just get approved – they get operational. Our goal is to create a trusted platform for digital assets and financial innovation, where regulation, infrastructure, and execution are aligned from the outset.
GMC said the integrated setup differs from most jurisdictions, where licensing and banking are typically separate and sequential processes, often resulting in months of delay even after regulatory approval.
Banking access integrated through DK Bank
As part of the framework, companies establishing a licence in GMC are guaranteed a corporate bank account with DK Bank, which GMC said removes one of the most common barriers to becoming operational.
The bank said it is designed to support globally active financial and digital asset companies from day one, offering multi-currency accounts across nine major currencies — USD, GBP, EUR, AUD, JPY, SGD, INR, HKD, and BTN — to support international operations.
DK Bank also offers digital asset financial services, including BTC-backed lending and asset swap capabilities, as well as integrated on- and off-ramps for digital assets.
GMC companies will also receive preferential banking terms, including fully waived banking fees for at least the first six months and discounted pricing thereafter.
“In most financial centres, getting licensed is only half the battle – getting a bank account is where companies get stuck,” said Yu Dong Zheng, CEO, DK Bank.
We’ve removed that bottleneck. At DK Bank, companies setting up in GMC can operate from day one, with banking built into the process. Our ambition is simple: to be the most Web3- and fintech-friendly bank in the world.
Tax incentives and institutional framework
GMC said the accelerated pathway is supported by a broader tax and regulatory framework designed to support real business activity, capital formation, and long-term investment.
The city highlighted targeted incentives for priority sectors, including 0% corporate tax depending on company investment levels, a territorial tax system aligned with Singapore and Hong Kong, and no capital gains, dividend, or inheritance tax.
Foreign talent tax exemptions will remain in place through 2030, while double taxation agreements are already in place and expanding, including with Singapore.
Beyond tax, GMC said it offers institutional infrastructure including Variable Capital Company (VCC) structures based on Singapore models, an International Dispute Resolution Centre (IDRC), common law frameworks inspired by Singapore with ADGM regulatory principles, and streamlined company and family office setup processes.
Industry participants also endorsed the initiative.
“The licensing process in GMC reflects a forward-thinking approach to digital assets, one that balances innovation with responsibility. As a custodian, we value jurisdictions that regulate and genuinely understand the infrastructure and risks behind this industry,” said Ian Loh, CEO, Ceffu.
We see this not just as a license, but as a partnership in shaping the future of digital finance.
John Ge, Co-Founder & CEO of BIT, added: “What differentiates GMC is the intentional design of the ecosystem and the alignment of regulation, banking, and operational readiness from day one.
The accelerated review process is both fast and pragmatic, with the GFSO demonstrating a clear openness to engage constructively while upholding high standards. This materially reduces execution risk for firms entering a new market.

Key takeaways
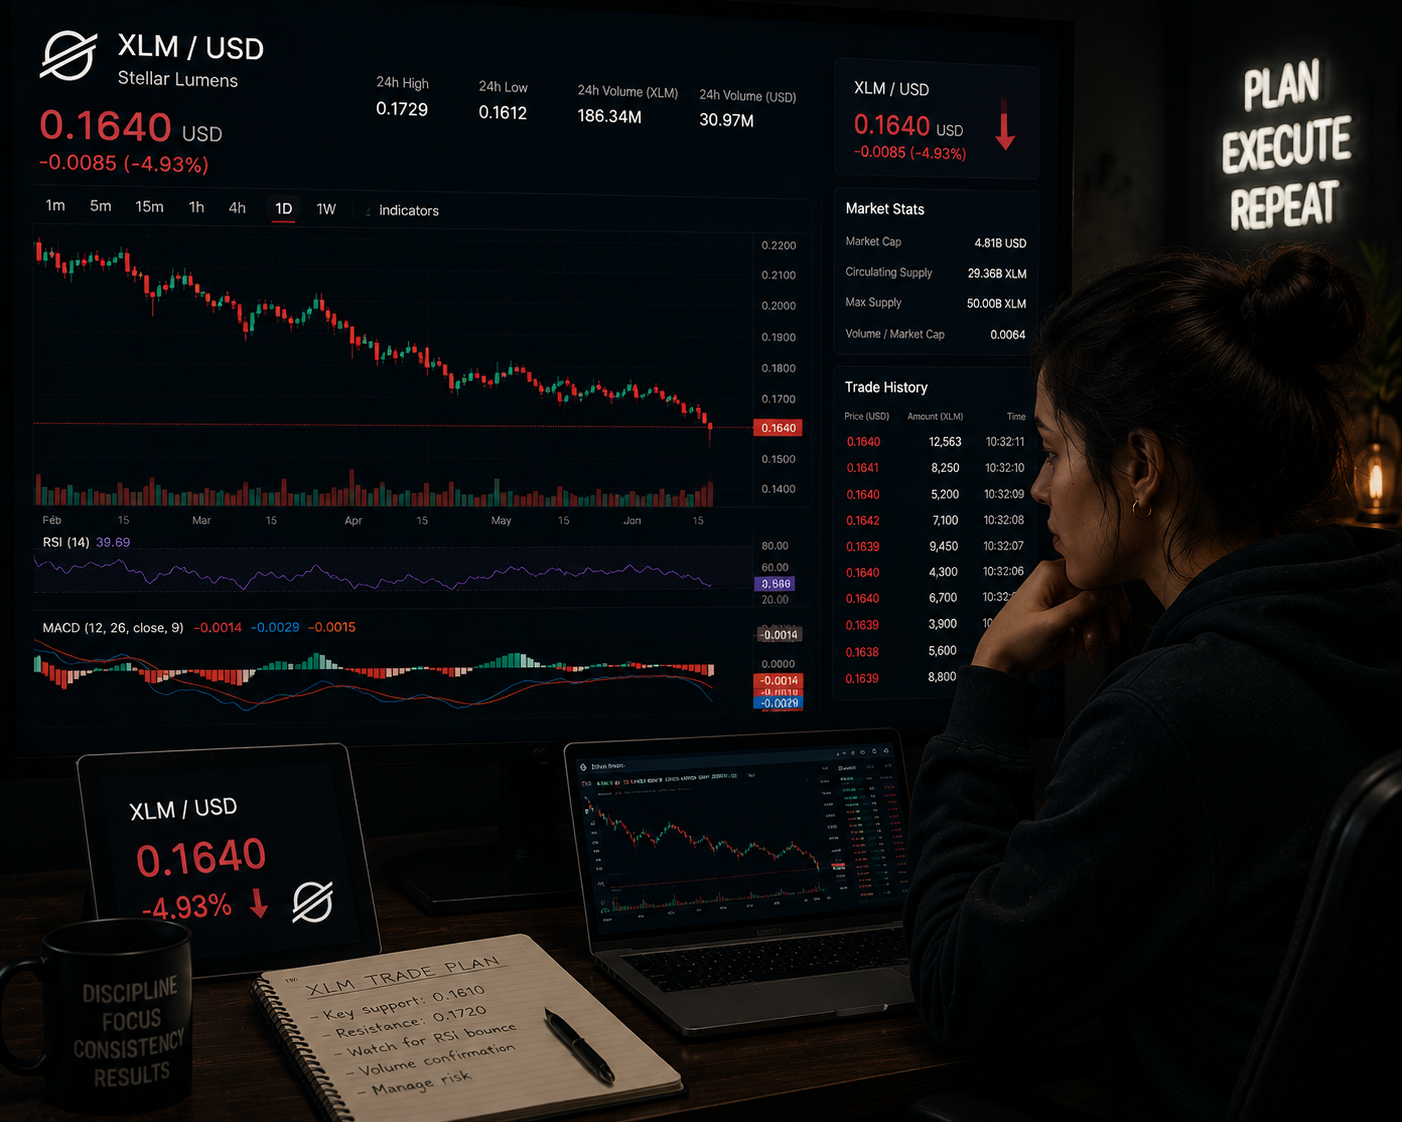
- Stellar continues consolidating between its 50-day and 100-day EMAs.
- CryptoQuant data suggests a neutral-to-bullish outlook for XLM.
On-chain and derivatives data support a mild bullish outlook
Stellar traded cautiously on Tuesday, but improving on-chain activity and derivatives positioning continued to support expectations for a potential upside breakout in both altcoins.
According to CryptoQuant summary data, Stellar reflects buy-side dominance with largely neutral market conditions, pointing to a mild bullish bias despite the lack of a decisive breakout.
CoinGlass data shows the OI-weighted funding rates for XLM flipped positive on Friday and remained positive on Tuesday at 0.0030%, respectively. Positive funding rates indicate that long-position holders are paying shorts, reflecting growing bullish positioning among traders.
Stellar technical outlook: Consolidation continues between key EMAs
The XLM/USD 4-hour chart is bearish and efficient as it is currently trading at $0.164 per coin. It is currently trading between major moving averages as traders await a clearer directional move.
XLM continues to hold above its 50-day EMA near $0.165 but remains below the 100-day EMA at $0.174 and the 200-day EMA around $0.204. Broader descending trendline resistance also continues to cap upside attempts.
Momentum indicators nevertheless show early signs of improvement. The RSI sits near 57, slightly above the neutral midpoint. The MACD line remains marginally above zero, suggesting mild bullish momentum.
If the rally resumes, the bulls would encounter resistance at key levels, including the 100-day EMA at $0.174, the 23.6% Fibonacci retracement at $0.201, and the 200-day EMA just above $0.204.

However, if the bearish trend persists, immediate support would be seen at the 50-day EMA at $0.165. A daily candle close below this level would expose the major support at $0.136.
As long as XLM maintains support above the 50-day EMA, the current consolidation structure could support a gradual recovery attempt. However, a breakdown below $0.136 would likely reopen the broader bearish trend.

FCC walks back router update ban before it bricked America’s network security

Poland debates four crypto bills at once as ban proposal complicates vote

The Gross Way Singers Handle Needing To Pee While Performing
Manchester United reach agreement with Casemiro over contract clause amid transfer speculation

US brings back mandatory military draft registration

Steven Gerrard disagrees with Gary Neville over ‘shock’ Chelsea and Arsenal claim | Football

Jahvillani – MONEY-POWER-RESPECT | Official Music Video

XRP Ripple Believe IT or NOT, XRP USE CASE ONLY FLARE Delivers, SBI LEADS with XRP CANTON SOLANA ETH

$30,000 XRP BUYBACK WON’T HAPPEN! – DTCC IS JUST ONE XRP SWITCH – BRAD SAYS IT ALL CONNECTS TO XRP!
-
 Crypto World4 days ago
HarrisX Poll Found 52% of Registered Voters Support the CLARITY Act
-

 Fashion4 days ago
Weekend Open Thread: Marianne Dress
-

 Crypto World5 days ago
Upbit adds B3 Korean won pair as Base token gains Korea access
-
 NewsBeat5 days ago
NCP car park operator enters administration putting 340 UK sites at risk of closure
-

 Fashion24 hours ago
Coffee Break: Travel Steam Iron
-

 Fashion2 days ago
What to Know Before Buying a Curling Wand or Curling Iron
-

 Tech2 days ago
Auto Enthusiast Carves Functional Two-Stroke Engine from Solid Metal
-

 Politics19 hours ago
What to expect when you’re expecting a budget
-

 Politics3 days ago
Politics Home Article | Starmer Enters The Danger Zone
-
 Business3 days ago
Ignore market noise, India’s long-term story intact, say D-Street bulls Ramesh Damani and Sunil Singhania
-

 Tech1 day ago
GM Agrees To Pay $12.75 Million To Settle California Lawsuit Over Misuse Of Customers’ Driving Data
-

 Crypto World6 days ago
BlackRock CEO Larry Fink Discusses a New Asset Class
-

 Entertainment6 days ago
Sarah Paulson Called Out For Met Gala ‘Hypocrisy’
-

 Entertainment5 days ago
General Hospital: Ric & Ava Bombshell – Ric’s Massive Secret Exposed!
-
 Sports6 days ago
NBA playoff winners and losers: Austin Reaves is not loving Lakers vs. Thunder matchup, but Chet Holmgren is
-

 Entertainment6 days ago
Bold and Beautiful Early Spoilers May 11-15: Steffy Revolted & Liam Overjoyed!
-

 Politics5 days ago
Simon Cowell Says He Was ‘Horrible’ To Susan Boyle During BGT Audition
-

 Crypto World6 days ago
Robinhood says Wall Street is building onchain
-

 Sports5 days ago
UEFA Champions League final schedule, teams, venue, live time and streaming | Football News
-

 Tech7 days ago
Apple and Samsung are dominating smartphone sales so thoroughly that only one other company makes the top 10
You must be logged in to post a comment Login