

Crypto World
Bitcoin shows record weekly oversold as selling pressure eases


Bitcoin has hit its most extreme weekly oversold level on record as selling slows.
Summary
- Research firm K33 says bitcoin is in its deepest weekly oversold zone ever.
- The move follows months of selling from long-term holders and institutions, though that pressure is now easing.
- Bitcoin (BTC) reclaimed $71,000 with roughly 7% daily gains as derivatives metrics show cautious but stabilizing positioning.
Bitcoin (BTC) has entered the most extreme weekly oversold zone in its history, according to a new report from research firm K33, even as early signs suggest that sustained sell pressure from long-term holders and institutions is finally starting to ease.
The firm notes that over the past several months, systematic selling from older wallets and ETF-related flows pushed prices lower and kept sentiment muted, despite ongoing interest in spot products. Now, with bitcoin back above $70,000 and net outflows slowing, K33 argues that the market is moving into a phase where forced or programmatic selling is less dominant, allowing spot demand to have a clearer impact on price. At the same time, derivatives indicators point to a market that is still cautious rather than euphoric, with traders paying for downside protection even as spot rebounds.
K33’s oversold signal is rooted in longer-term momentum and breadth metrics, rather than short-term intraday swings, highlighting how extended the prior drawdown had become relative to previous cycles. The report emphasizes that similar readings in past years often preceded medium-term recovery phases, though the timing and strength of those rebounds varied depending on macro conditions and liquidity. In this cycle, the backdrop includes U.S. spot bitcoin ETFs that continue to attract steady, if uneven, inflows, as well as growing interest from corporates and fintech platforms like Coinbase that are integrating digital assets more deeply into their product stacks. For now, the firm characterizes bitcoin’s current state as one of “exhausted sellers” rather than a fully confirmed trend reversal.
Derivatives still signal caution
Despite the oversold reading and price recovery, K33 stresses that derivatives markets are not yet signaling a return to aggressive risk-on behavior. Funding rates on major perpetual futures have normalized from previous extremes and sit near neutral, suggesting that leveraged longs are no longer crowding in at any price, but are also not completely absent. Open interest has climbed from local lows in a more measured fashion, indicating that new positions are being added without the kind of unchecked leverage build-up that often precedes sharp liquidations. Options markets, meanwhile, show persistent demand for puts and elevated implied volatility around key macro and policy dates, reflecting ongoing concern about downside scenarios.
For traders and asset managers, the combination of record weekly oversold conditions and still-cautious derivatives positioning creates an environment where upside follow-through is possible, but not guaranteed. Short-covering rallies can be powerful in this type of setup if spot demand continues and ETF flows stay positive, yet any renewed wave of macro stress or regulatory headlines could quickly reignite selling. Institutional desks focused on structured products and basis trades may see opportunities to re-enter yield strategies as spreads normalize, while long-only investors weigh whether current levels offer an attractive entry point in light of K33’s historical analogs. The key test in the coming weeks will be whether bitcoin can hold above reclaimed support zones while leverage remains contained, confirming that the market has transitioned from forced selling into a more sustainable, accumulation-driven phase.


Cardano price has rebounded alongside the broader crypto market, rising about 5% in the past 24 hours. The move has helped the token recover nearly 10% from its March 4 low, offering short-term relief after weeks of weakness. However, the rebound does not fully resolve the structural risks surrounding the asset.
A weakening technical structure, rising on-chain coin movement, and an imbalance in derivatives positioning all point to the same possibility: the current rebound may still face downside pressure. Understanding that risk begins with the chart structure itself.
Hidden Bearish Divergence Emerges as Coin Movement Surges
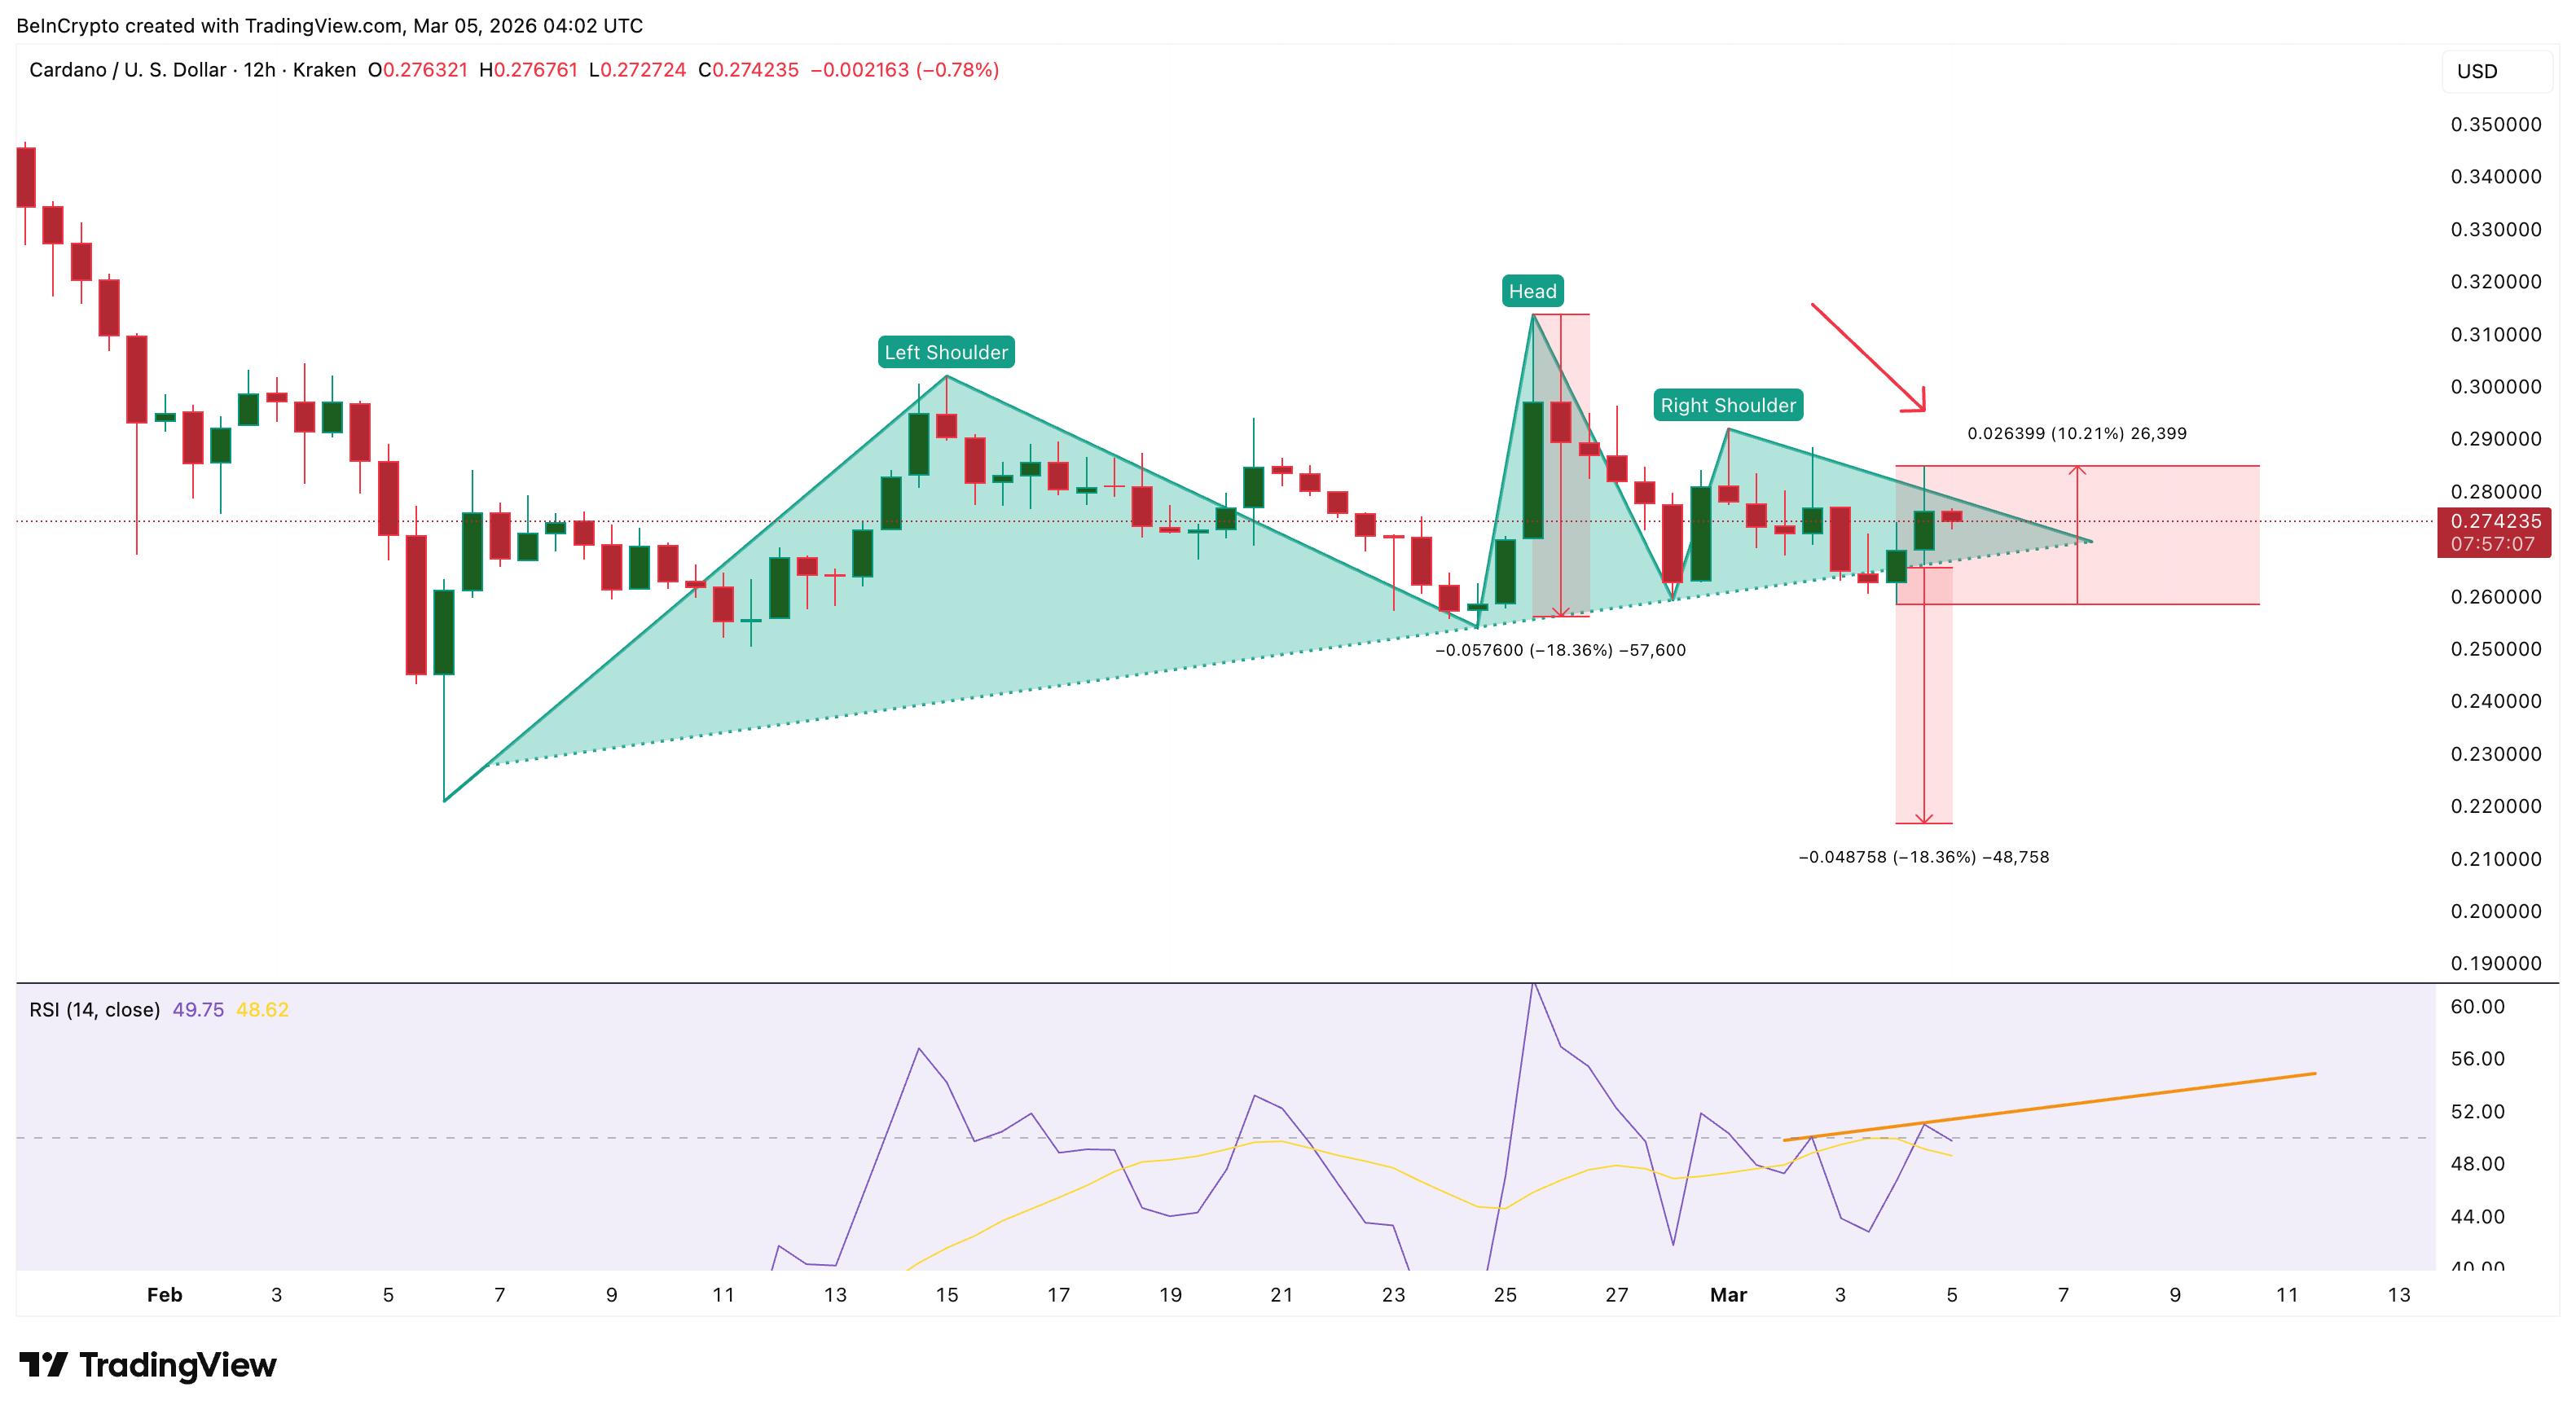
Cardano’s price structure on the 12-hour chart is currently forming a head-and-shoulders pattern, a formation commonly associated with potential trend reversals. The pattern began developing in early February, with the left shoulder, head, and right shoulder now clearly visible. The neckline support of this structure sits near $0.26.
On March 4, Cardano briefly attempted to break below this neckline. The broader crypto market rally, however, pushed the price higher, allowing ADA to rebound roughly 10% from its recent low. Yet the technical picture still carries risk.
Between March 2 and March 4, Cardano formed two lower highs, while the Relative Strength Index (RSI) printed a higher high during the same period.
Want more token insights like this? Sign up for Editor Harsh Notariya’s Daily Crypto Newsletter here.
The RSI is a momentum indicator that measures the strength of price movements by comparing recent gains and losses. When price makes lower highs while RSI makes higher highs during a downtrend, it forms hidden bearish divergence. This pattern typically signals trend continuation, suggesting sellers remain active despite temporary rallies.
On-chain data reinforces this concern. The Spent Coins Age Band, a metric that tracks how many previously held coins move across the network, shows a sudden surge in distribution-linked activity.
On March 3, approximately 93 million ADA moved on-chain. By March 5, that figure had climbed over 143 million ADA, marking a 54% increase in coin movement.
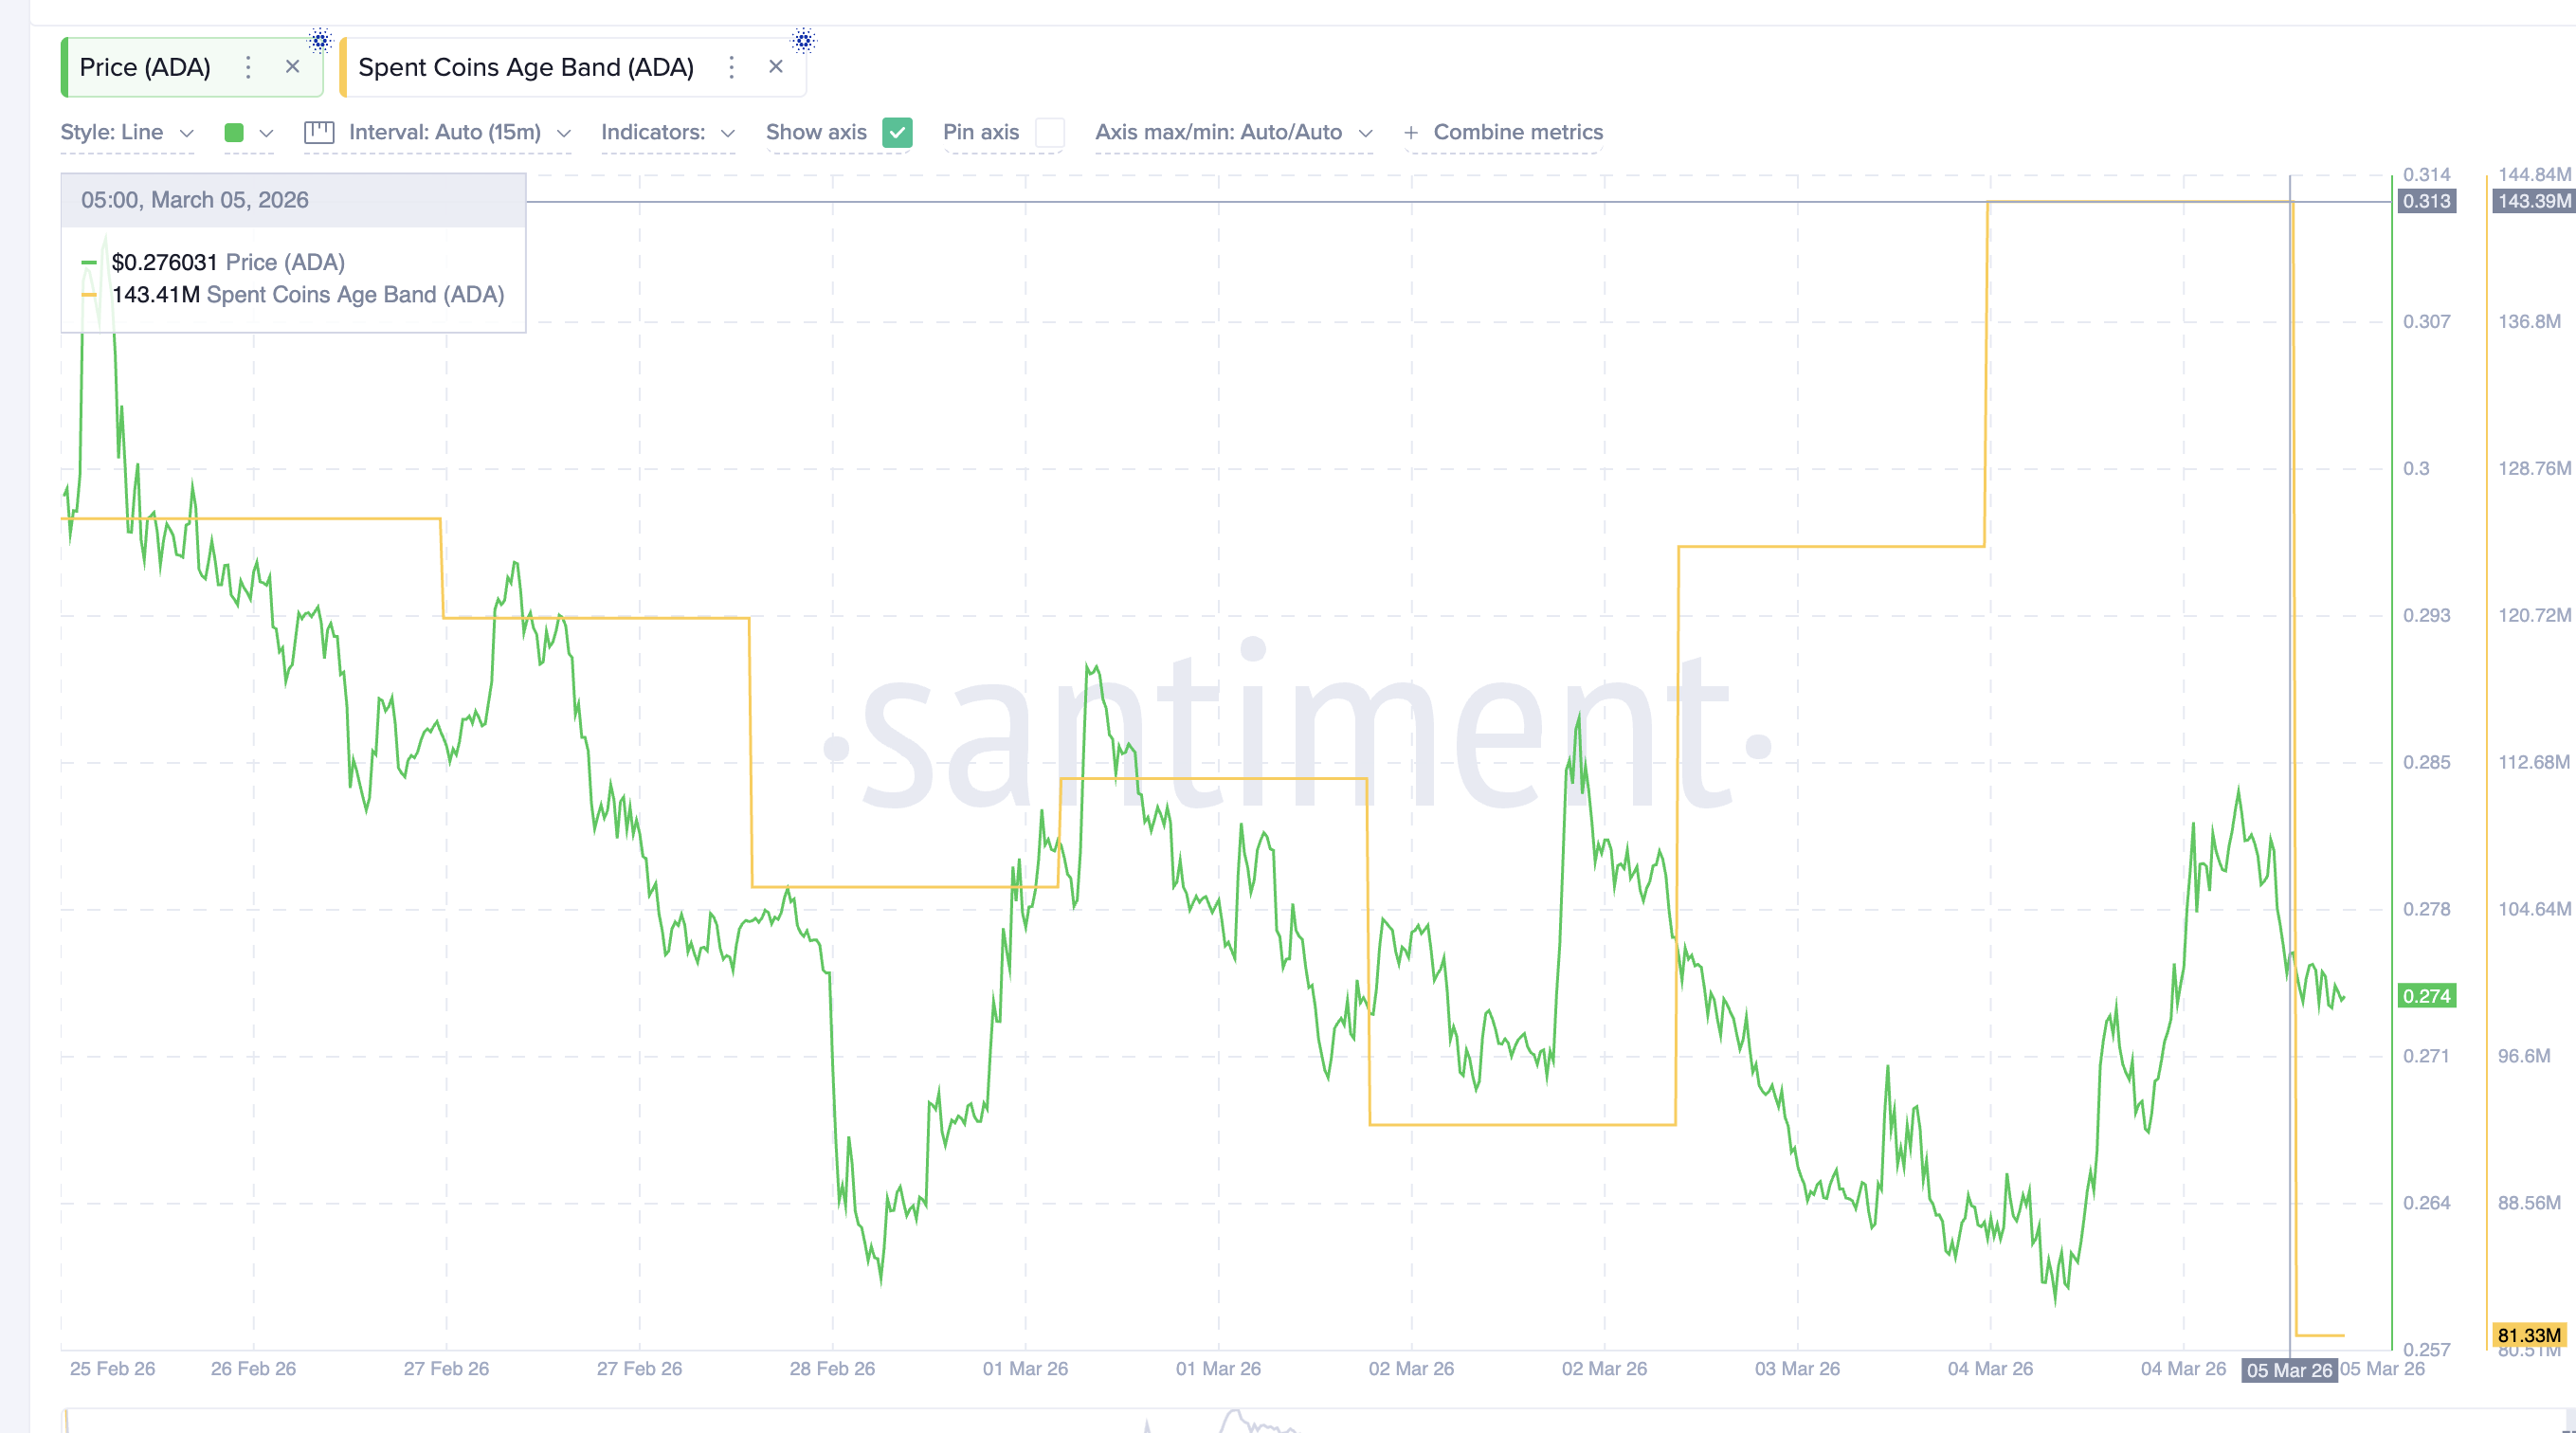
Although the metric has since dropped to almost 81 million ADA, the spike suggests that many holders moved coins during the recent rebound, potentially preparing to sell. This rising distribution pressure leads to the next key risk area: leveraged traders.
Rising Long Leverage Adds Liquidation Risk as Spot Demand Weakens
While on-chain activity hints at potential ADA selling, derivatives markets reveal a second vulnerability.
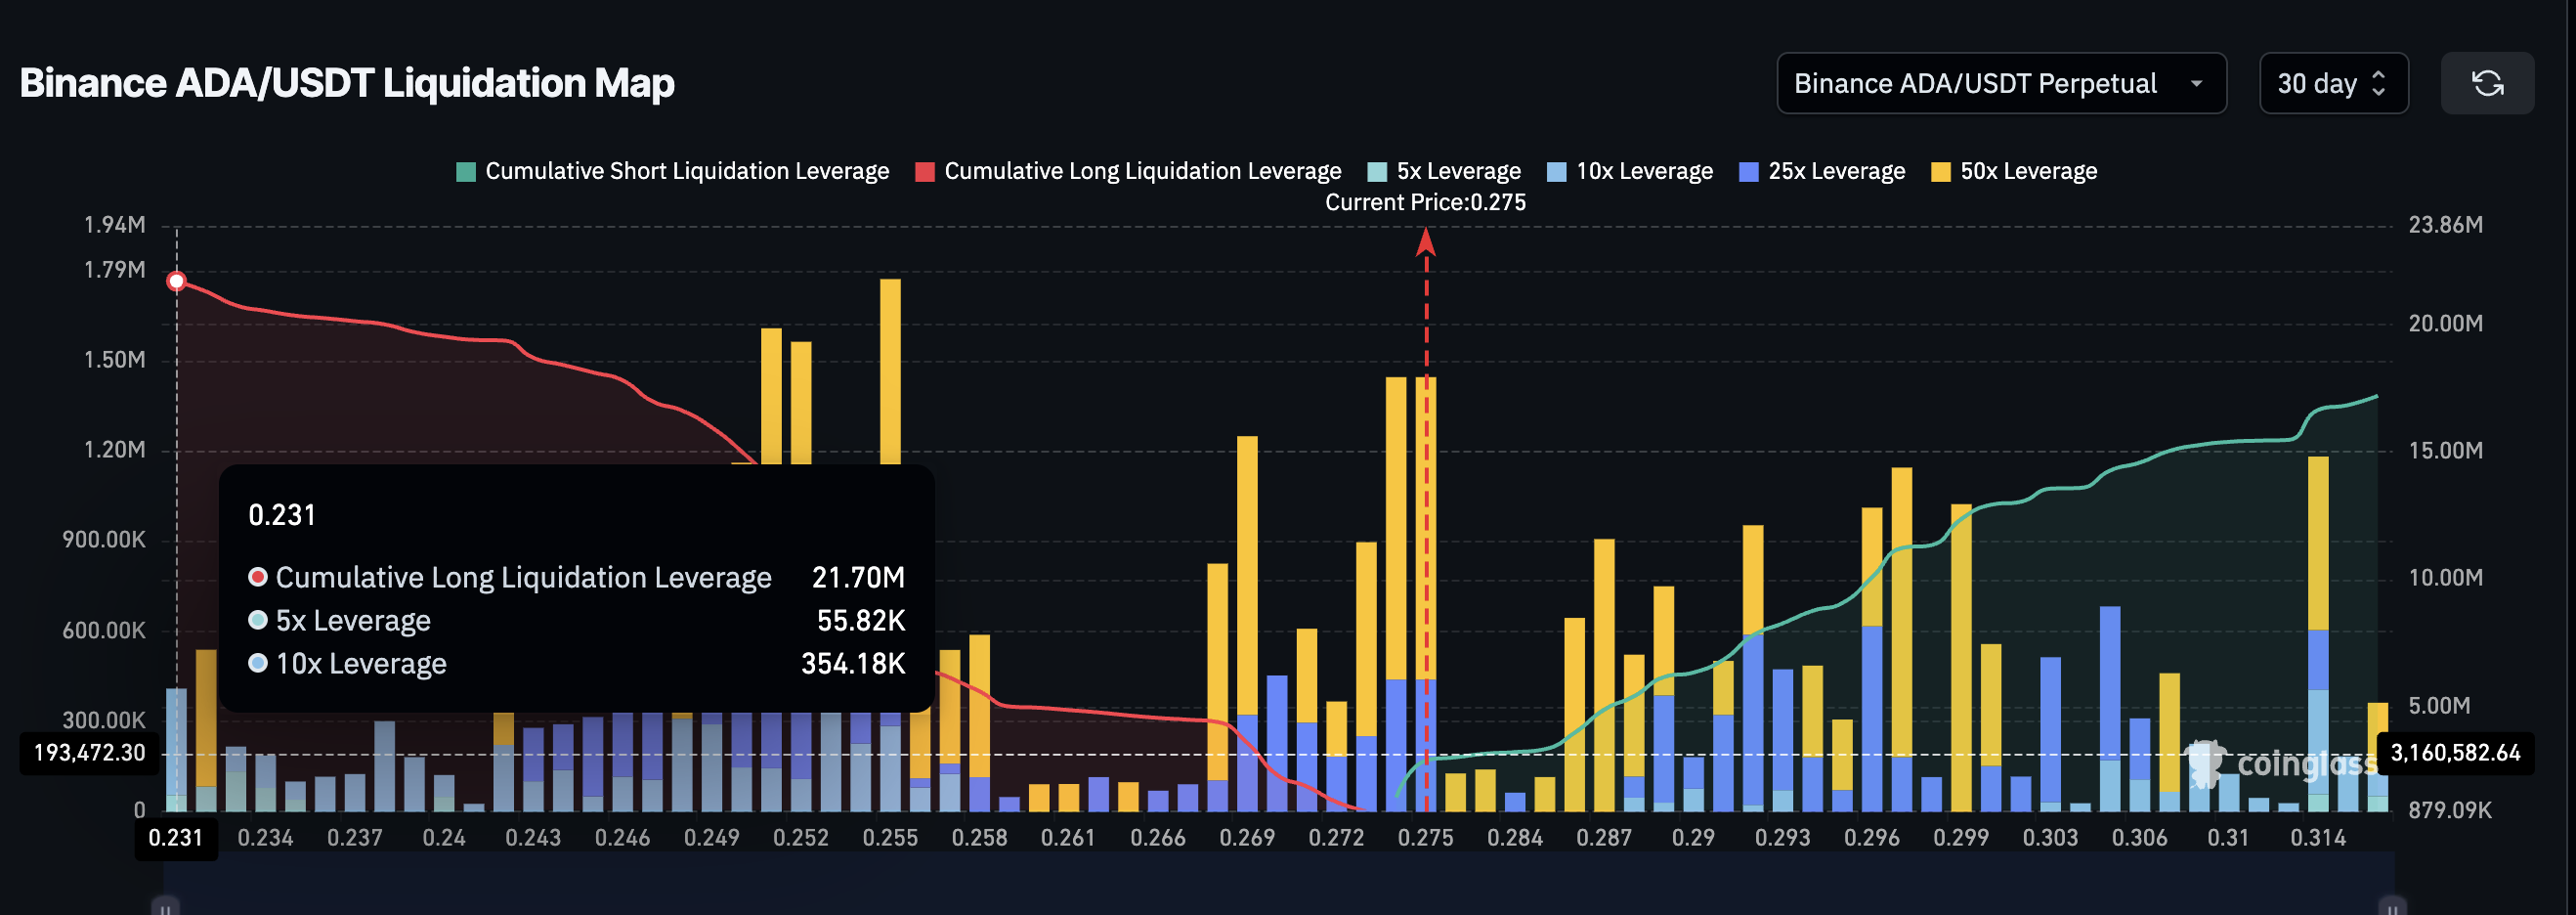
According to the Binance ADA/USDT liquidation map, leveraged traders currently hold significantly more long exposure than short exposure.
30-Day Data shows:
- Long liquidation leverage: about $22 million
- Short liquidation leverage: roughly $17 million
This means long positions outweigh short positions by around 26%. While the long bias is not heavy, it still invokes caution.
When the market holds a long exposure amid a bearish technical structure, downside volatility can increase. If prices begin to fall, these long positions may be forced to close, triggering liquidations that accelerate the decline. Normally, strong spot market demand helps absorb this type of pressure.
However, whale activity suggests that such support is currently limited.
Wallet data shows that most major holder cohorts have not significantly increased their balances in recent days.
Addresses holding:
- 100 million to 1 billion ADA
- More than 1 billion ADA
have largely kept their balances unchanged.
Only the 10 million to 100 million ADA cohort has shown modest accumulation, increasing holdings from 16.67 billion ADA to 16.69 billion ADA. Slightly above $5 million in worth.
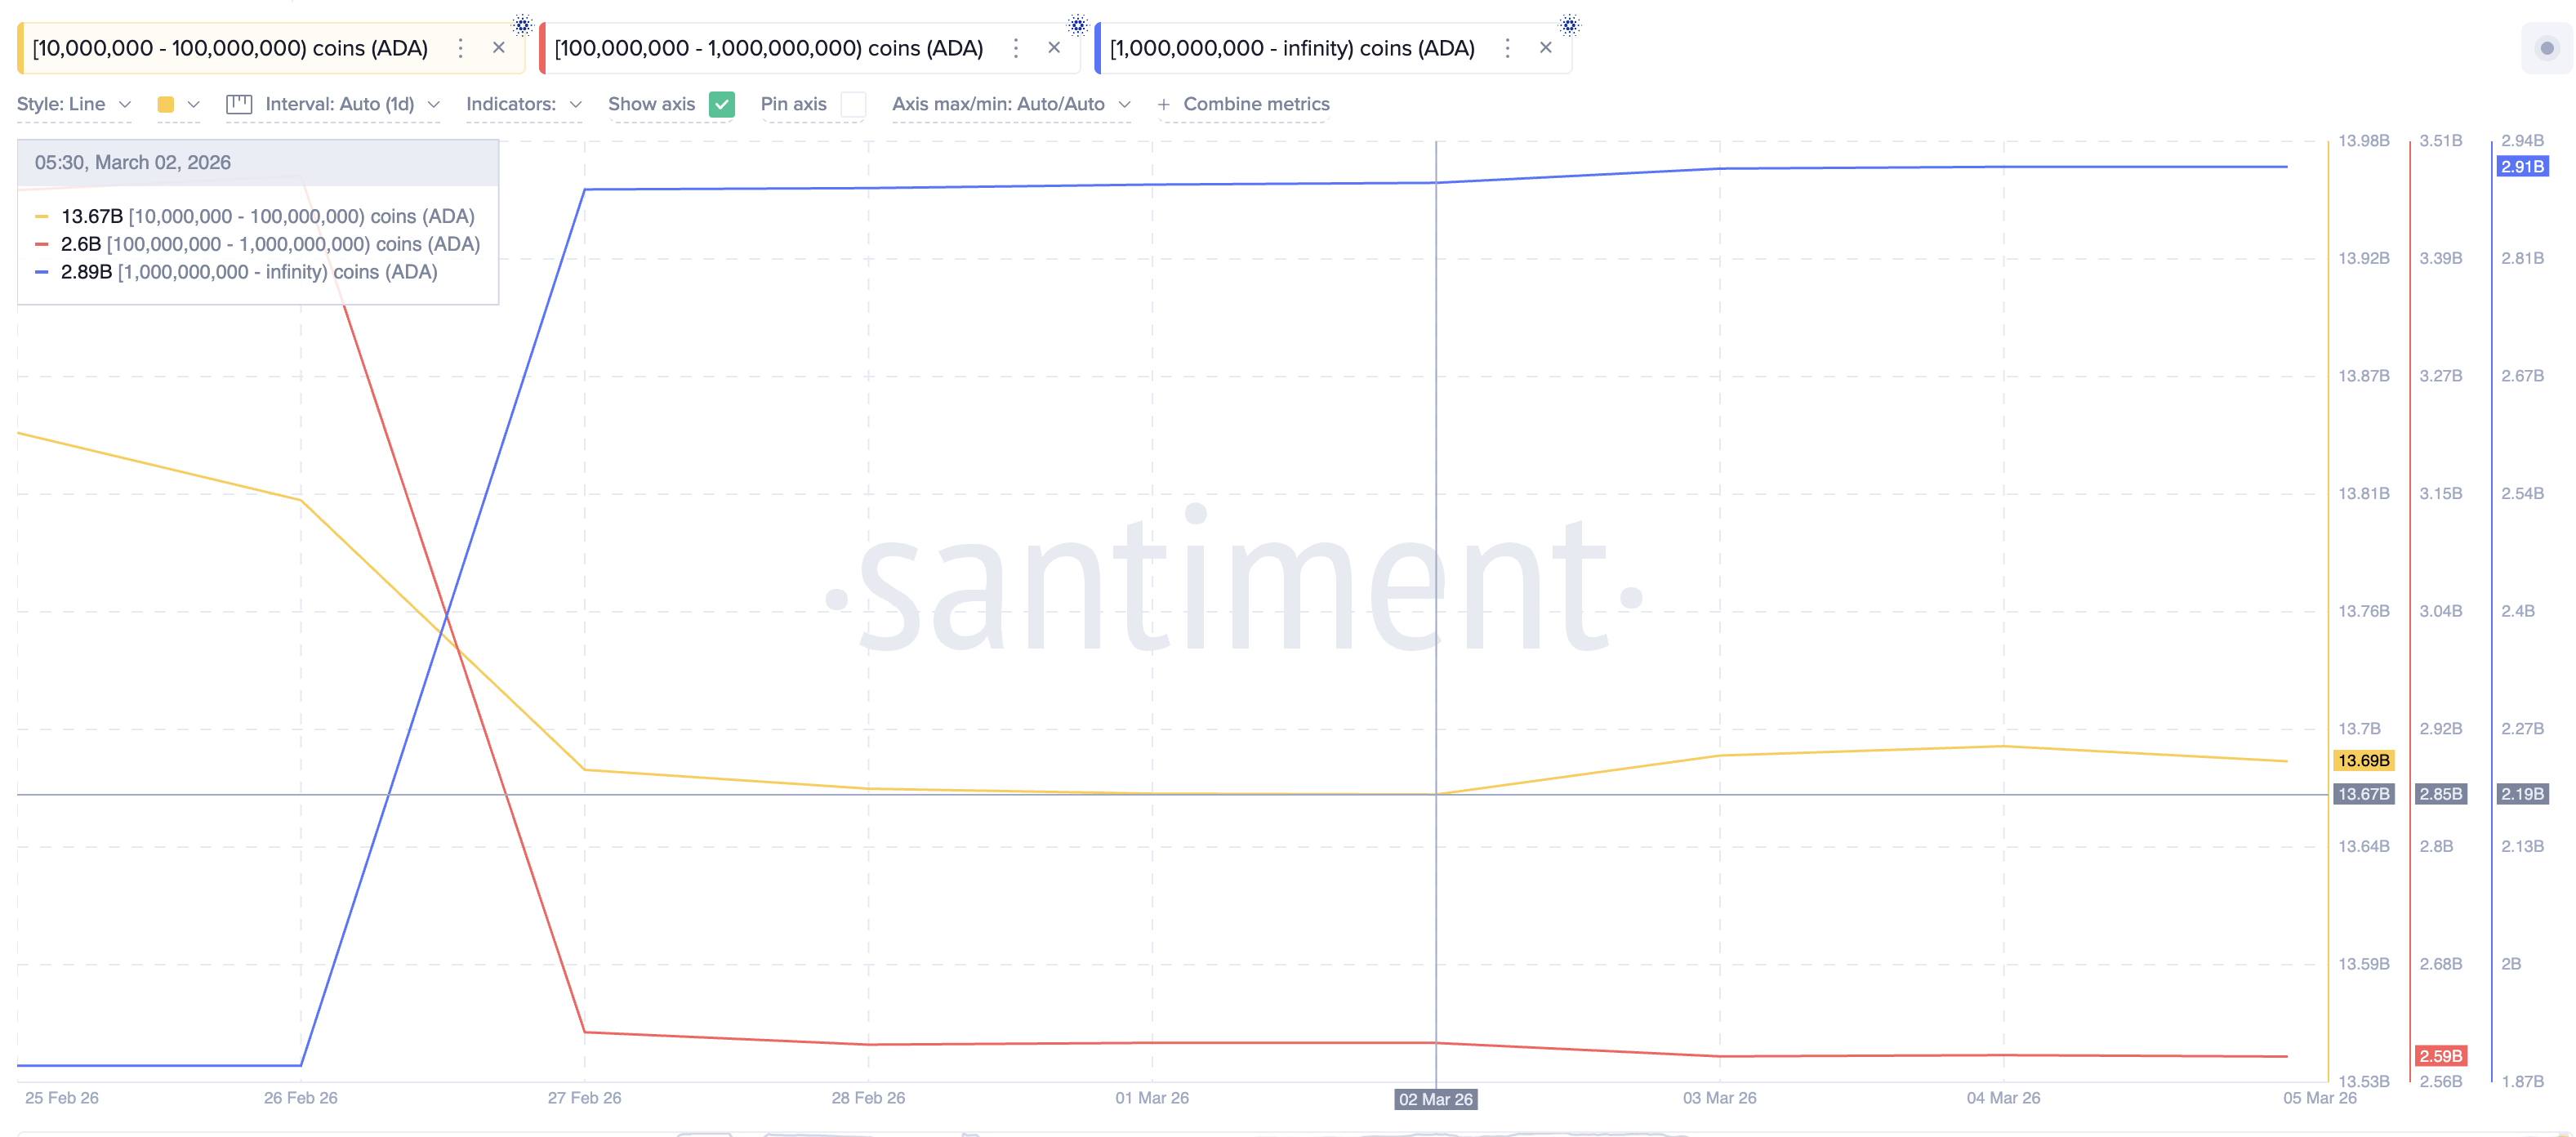
This increase is relatively small and does not signal strong new buying demand. With whales largely inactive and coin movement rising, the market may lack the spot demand needed to stabilize the price if selling pressure increases. This dynamic makes Cardano’s key price levels particularly important.
Cardano Price Faces Critical Test Between $0.28 and $0.25
Cardano is currently trading near $0.27, placing it close to the neckline support of the head-and-shoulders structure. Several levels now determine the next directional move.
The first resistance sits near $0.28. This level has repeatedly rejected price attempts since late February. A 12-hour candle close above $0.28 would signal that buyers are regaining control.
If momentum strengthens further, the next resistance lies near $0.29, where the right shoulder of the pattern formed. A stronger breakout above $0.31 would invalidate the bearish structure entirely. Crossing this level would push the price above the head of the pattern and could signal a broader trend reversal.
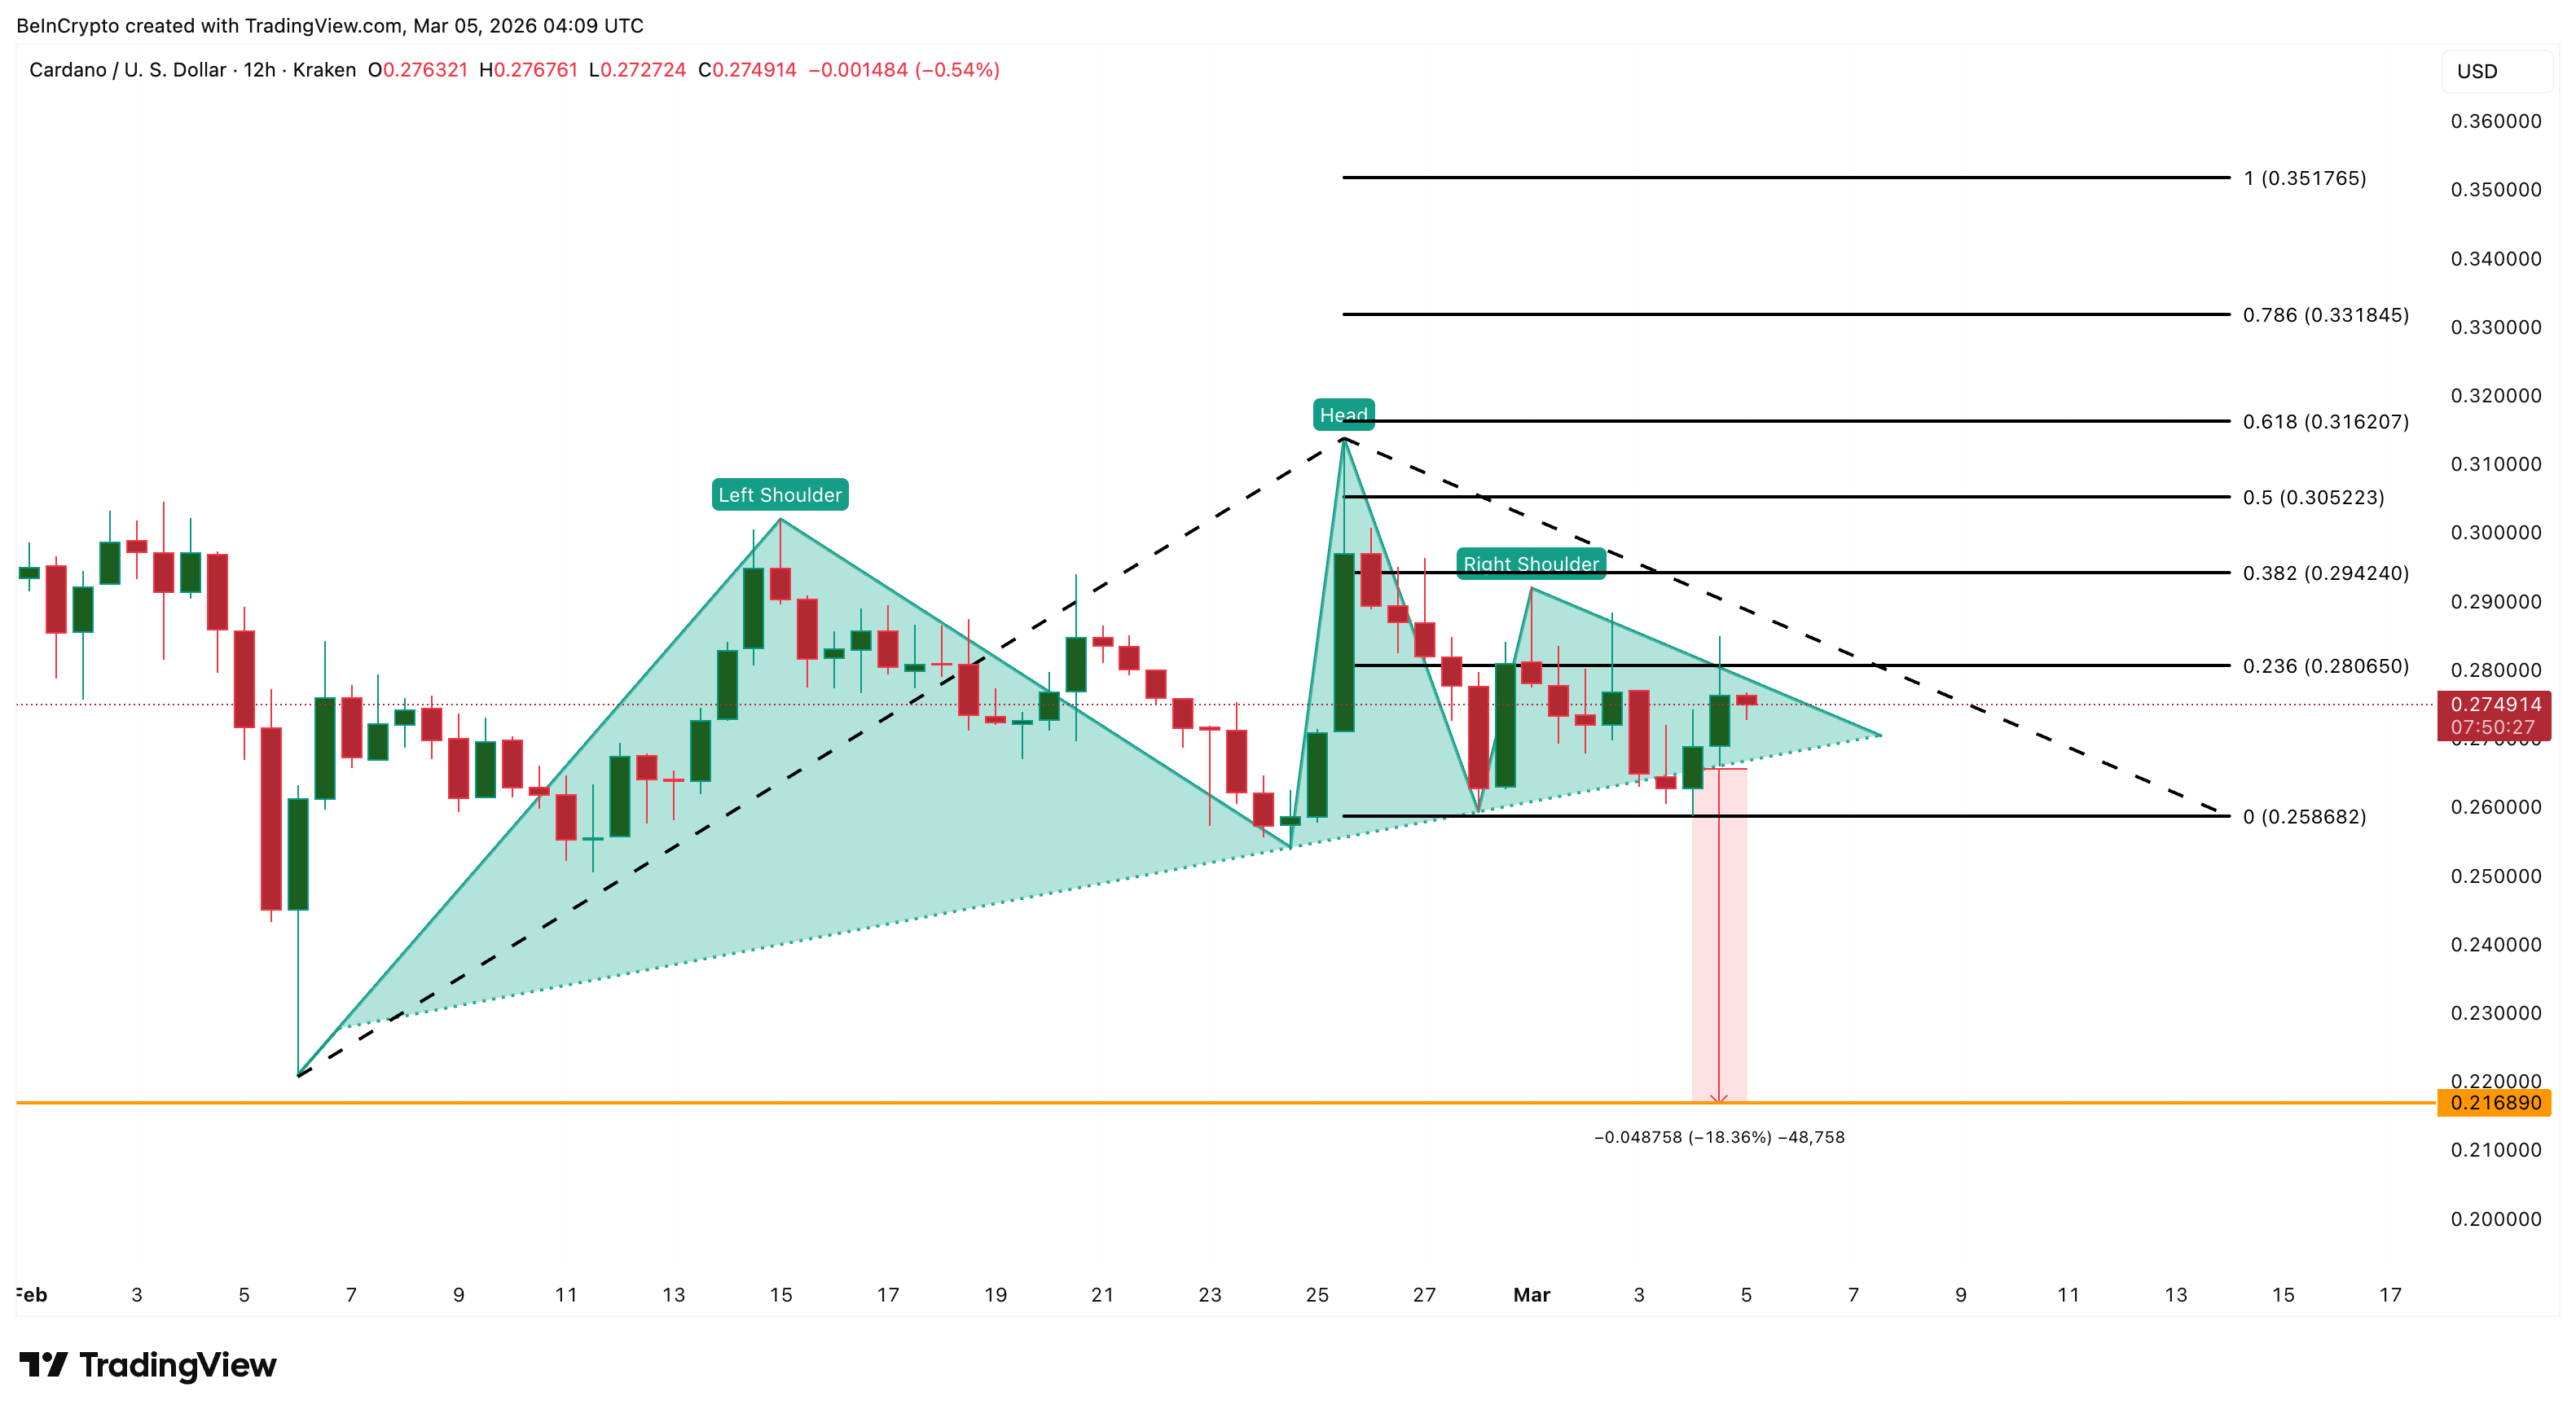
However, downside risk remains if support fails. A drop below $0.25 would confirm a breakdown of the head-and-shoulders pattern. In that scenario, Cardano could fall toward $0.21, representing a potential 18% decline from the neckline.
For now, Cardano’s 10% rebound has delayed the breakdown, but the combination of hidden bearish divergence, rising coin movement, and heavy long leverage suggests the market may still face a critical test in the days ahead. Only a 12-hour candle close above $0.28 can negate the threats for now.


The latest cryptocurrency rally could still have significant momentum, according to analyst Owen Lau, who said the market’s recent surge is supported by improving policy developments and stronger institutional participation.
Summary
- Analyst Owen Lau said the current crypto rally “has legs,” suggesting the market could sustain momentum.
- Pro-crypto policy developments in Washington are helping improve sentiment.
- Growing institutional participation and ETF flows are reinforcing the rally.
Bitcoin surge may extend as policy tailwinds grow: Owen Lau
Owen Lau, a financial technology and crypto analyst, said the current rally “has legs,” pointing to a combination of regulatory progress in the United States and growing integration between traditional finance and digital assets.
Bitcoin and the broader crypto market have staged a strong rebound in recent days, with the leading cryptocurrency climbing above the $73,000 level and driving gains across altcoins. The rally follows renewed inflows into spot Bitcoin exchange-traded funds and a wave of short liquidations that helped accelerate price momentum.
According to Lau, a key factor supporting the rally is the shifting policy landscape in Washington. Recent discussions around crypto market structure legislation and stablecoin regulation have raised expectations that the United States could soon provide clearer rules for the industry.
Improved regulatory clarity has long been viewed as a catalyst for institutional adoption, as major financial firms often require clearer compliance frameworks before expanding exposure to digital assets.
Owen Lau also highlighted the growing involvement of traditional financial institutions in the crypto ecosystem, ranging from asset managers offering spot Bitcoin ETFs to banks exploring digital asset services. These developments, he said, are gradually embedding cryptocurrencies into mainstream financial markets.
Institutional demand has already been visible through sustained ETF inflows, which have become one of the most significant drivers of Bitcoin price movements over the past year.
While volatility remains a defining feature of the crypto market, Lau suggested that the combination of regulatory progress, institutional demand and expanding market infrastructure could support continued upside.
If these trends persist, analysts say the current rally could represent more than just a short-term rebound, potentially marking the early stages of a broader market recovery.
Crypto World
Ethereum price prediction: $2,500 in focus as OI spike amid Vitalik’s calls for scaling


- Ethereum rally above $2,100 follows a sharp spike in open interest.
- A break above the resistance at $2,175 could open the path toward $2,500.
- Large ETH withdrawals from exchanges point to tightening supply.
Ethereum has climbed above the $2,100 after a strong daily rally that pushed the asset higher amid renewed interest in derivatives markets.
The move follows a period of consolidation that had kept the price trapped near the $2,000 level for several sessions.
The surge has now placed the $2,500 region firmly on the radar of short-term traders.
At the same time, comments from Vitalik Buterin about the future direction of the network have sparked fresh discussion across the ecosystem.
Open interest spike signals renewed trader activity
One of the strongest signals behind the recent price jump is the sharp rise in derivatives market activity.
Open interest (OI) in Ethereum futures has climbed significantly in recent weeks as traders increase their exposure to the asset.
The open interest reflects the total number of active futures contracts and often rises when new money enters the market.
The latest spike indicates that traders are positioning for larger price swings in the coming sessions.
Besides the increase in open interest, short liquidations also played a key role in the rally that pushed Ethereum above $2,100.
When bearish traders are forced to close positions, they must buy back the asset, which can quickly accelerate upward momentum.
This chain reaction tends to create sudden bursts of volatility that drive prices higher within a short time frame.
However, derivatives data still shows mixed sentiment among traders, with funding rates shifting between positive and negative levels, suggesting that the market remains divided on the next direction.
Ethereum supply tightens as investors withdraw coins
Another factor supporting the recent recovery is a notable decline in the amount of Ethereum held on centralised exchanges.
According to data obtained from CryptoQuant, Large amounts of ETH have been moved away from trading platforms over the past month.

These withdrawals from crypto exchanges often indicate that investors intend to hold their assets for a longer period rather than sell them immediately.
When coins leave exchanges, the amount available for instant trading becomes smaller.
This shift can create tighter supply conditions, especially if demand begins to increase at the same time.
On-chain data also shows that large investors have continued to accumulate Ethereum during recent market weakness.
This trend suggests that some market participants view current prices as attractive entry levels.
Such accumulation can help stabilise the market during periods of volatility.
Ethereum technical analysis place $2,500 in focus
From a technical perspective, Ethereum’s price is currently trading between key support and resistance zones.
The $2,023 region has emerged as an important short-term support level based on recent price movements.
A break below that zone could expose the market to further downside toward the $1,901 support area.
On the upside, the $2,175 level has repeatedly acted as immediate resistance.
A sustained move above this barrier could open the door for a rally toward the next resistance near $2,396.
If buying pressure remains strong, the market may then shift its focus toward the $2,525 region.
This level sits close to the psychological $2,500 mark that many traders are watching.
A decisive breakout above this area would signal a stronger bullish trend forming in the short term.
Vitalik Buterin says, “Ethereum needs to scale”
Beyond the price charts, discussion around Ethereum’s long-term direction has intensified following recent comments from Vitalik Buterin.
The Ethereum co-founder has emphasised the importance of developing what he described as “sanctuary” technology within the ecosystem.
This concept centres on strengthening decentralisation and ensuring that Ethereum remains a secure and neutral platform.
Buterin also highlighted concerns that some scaling solutions are drifting away from Ethereum’s core security model.
His remarks have sparked debate about how the network should evolve as demand continues to grow.
Some observers believe these discussions could influence how developers approach future upgrades and scaling strategies.
Threat researchers at Google say they have uncovered a new exploit kit targeting Apple iPhone users, aimed at stealing crypto wallet seed phrases.
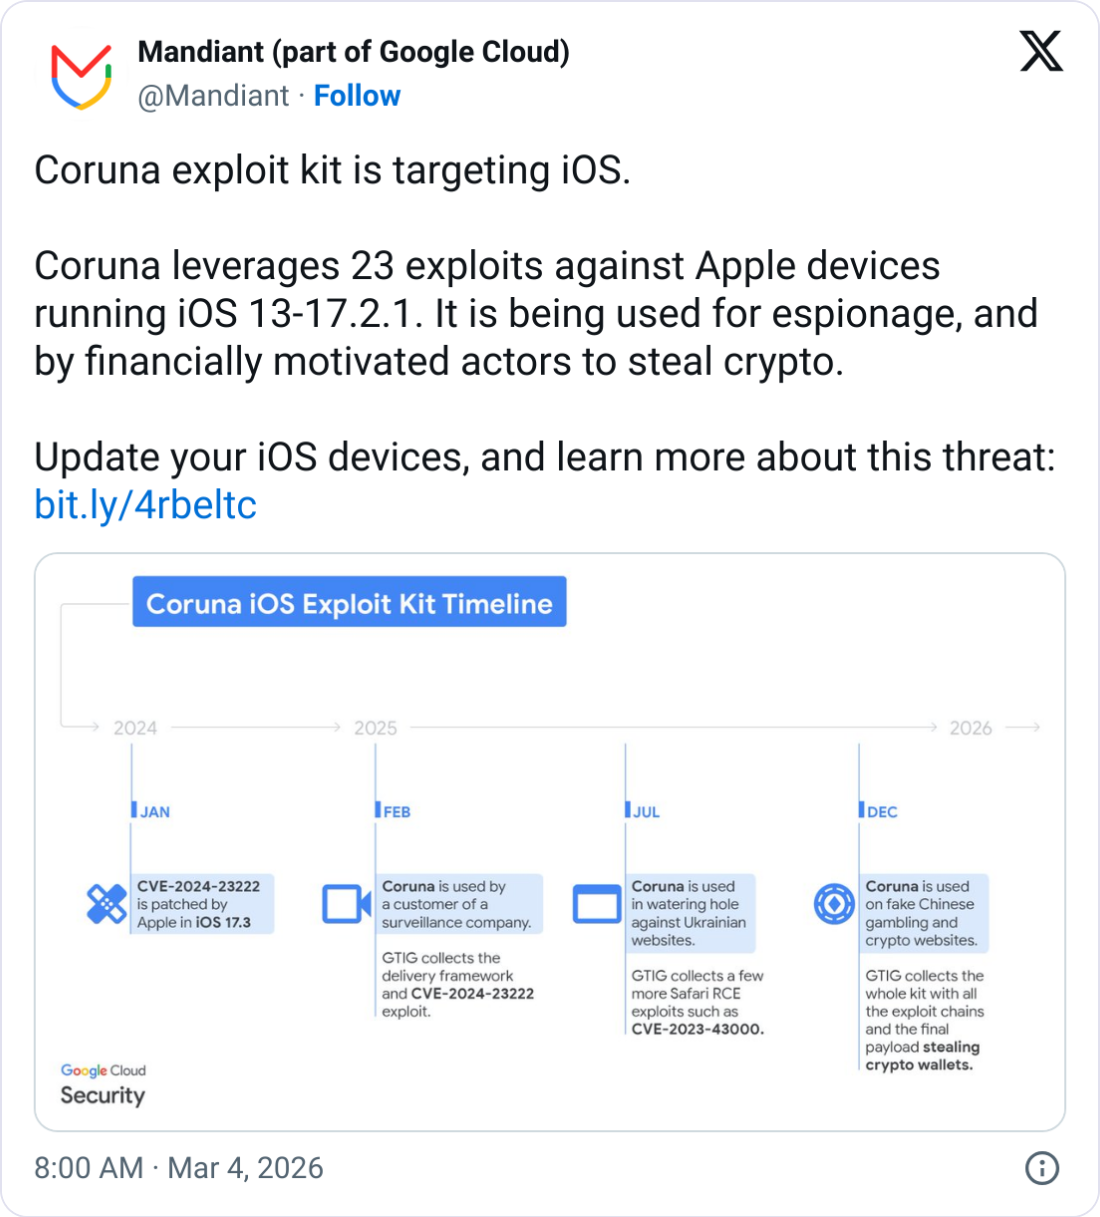
The kit, named “Coruna” by its developers, targets iPhones running iOS versions 13.0 up to 17.2.1. It has “five full iOS exploit chains and a total of 23 exploits,” including ones that were previously unknown to the public, the Google Threat Intelligence Group (GTIG) said in a report on Wednesday.
The group said it first discovered the kit in February 2025 and has since tracked its use by a suspected Russian espionage group against Ukrainians, and later on fake Chinese crypto websites that aim to steal crypto.
GTIG said the kit doesn’t work with the latest version of iOS and urged iPhone users to update their devices to the latest software version. If that isn’t possible, users should put the phone in “Lockdown Mode,” which Apple says can counter sophisticated attacks.
Kit targets crypto via fake websites
GTIG said it came across parts of an iOS exploit in February 2025 in which a customer of a surveillance company used JavaScript to fingerprint the device to deliver the appropriate exploit.
Later that year, it found the same JavaScript framework hidden on multiple compromised Ukrainian websites that was “only delivered to selected iPhone users from a specific geolocation.”

GTIG said it then found the same framework in December “on a very large set of fake Chinese websites mostly related to finance,” including one that spoofed the crypto exchange WEEX.
When a user accesses the websites with an iOS device, the framework delivers the exploit kit and hunts for financial information, including analyzing texts containing seed phrases and keywords such as “backup phrase” or “bank account.”
Related: ‘ClickFix’ hackers pose as VCs, hijack QuickLens in latest crypto attacks
The kit also seeks out popular crypto apps, including Uniswap and MetaMask, to extract crypto or sensitive information.
Coruna’s US intelligence origins debated
GTIG did not name the customer of the surveillance company from which the exploit kit is said to have originated, but the mobile security company iVerify told WIRED it could have been built or bought by the US government.
“It’s highly sophisticated, took millions of dollars to develop, and it bears the hallmarks of other modules that have been publicly attributed to the US government,” iVerify co-founder Rocky Cole told WIRED.
“This is the first example we’ve seen of very likely US government tools — based on what the code is telling us — spinning out of control and being used by both our adversaries and cybercriminal groups.”
However, Kaspersky’s principal security researcher told The Register that the cybersecurity company saw “no evidence of actual code reuse in the published reports to support attributing Coruna to the same authors.”
Magazine: Meet the onchain crypto detectives fighting crime better than the cops

Crypto-related equities surged on Wednesday as pro-crypto commentary from Washington and expectations of a clearer regulatory path bolstered risk appetite. Bitcoin (CRYPTO: BTC) led the upward move, rising more than seven percent in the past 24 hours to the mid-72,000s, while Ether (CRYPTO: ETH) joined the rally with an about eight percent gain. Publicly traded names tied to crypto wealth and infrastructure posted standout moves: MicroStrategy (EXCHANGE: MSTR) shares jumped north of 10%, Coinbase (EXCHANGE: COIN) climbed over 14%, Hut 8 Mining (EXCHANGE: HUT) advanced about 13.89%, and American Bitcoin Corp (EXCHANGE: ABTC) rose roughly 11.65%.
Dominick John, an analyst at Zeus Research, told Cointelegraph that the rally appears linked to the prospect of clearer rules on the horizon. “Crypto equities are rallying as regulatory risk is being fundamentally redefined. With the executive branch championing a clear digital asset framework, coupled with robust spot ETF inflows and the potential passage of the Clarity Act,” he said. “The trend will persist as regulatory clarity strengthens and institutional flows accelerate. With policy risk receding and product demand expanding, crypto equities have room to reprice higher in the medium term.”
“Crypto equities are rallying as regulatory risk is being fundamentally redefined. With the executive branch championing a clear digital asset framework, coupled with robust spot ETF inflows and the potential passage of the Clarity Act,” he said.
Key takeaways
- Regulatory clarity expectations are lifting crypto equities as policymakers signal a more defined digital asset framework and as spot ETF activity strengthens.
- Major crypto-adjacent stocks posted material gains: MicroStrategy (EXCHANGE: MSTR) rose more than 10%, Coinbase (EXCHANGE: COIN) gained over 14%, Hut 8 Mining (EXCHANGE: HUT) advanced 13.89%, and American Bitcoin Corp (EXCHANGE: ABTC) climbed 11.65%.
- Regulatory moves advanced on multiple fronts: the CFTC filed for a regulatory review of prediction markets, while the SEC filed a pending application centered on Federal Securities Laws as they relate to crypto transactions.
- Political signals from the White House and supporters of crypto policy, including calls for market-structure legislation, contributed to the swing in sentiment.
- There is a caveat: the rally could cool if regulatory progress stalls or if Bitcoin retreats, underscoring the sensitivity of crypto equities to policy momentum and macro moves.
Tickers mentioned: $BTC, $ETH, $COIN, $MSTR, $HUT, $ABTC
Sentiment: Bullish
Price impact: Positive. A broad uptick in both the crypto market and related equities points to constructive liquidity and policy optimism gripping the sector.
Trading idea (Not Financial Advice): Hold. If regulatory momentum sustains and BTC maintains elevated levels, the bounce could extend; but a delay or reversal in policy progress would raise the risk of a pullback.
Market context: The move aligns with a broader risk-on tilt in crypto markets as investors price in regulatory clarity, potential ETF inflows, and evolving political support for crypto-friendly legislation, all of which can influence both spot prices and equity exposures tied to digital assets.
Why it matters
The current trajectory matters because it underscores how policy clarity can translate into tangible capital flows for both tokens and crypto-linked equities. As Washington signals a more explicit approach to digital assets, institutional interest tends to rise, creating demand not only for spot exposure but also for products and services that leverage the crypto ecosystem. The rally in MicroStrategy’s shares reflects the market’s perception that corporate treasury strategies that hoard Bitcoin may continue to benefit from price strength and demand for governance-friendly structures around holdings.
Similarly, Coinbase and other listed companies demonstrate how crypto maturity is intersecting with traditional markets. A sustained uptick in prices for BTC and ETH can lift trading activity, mining economics, and service demand for custody, lending, and staking products. The broader takeaway is that policy momentum—if it persists—could act as a catalyst for both price appreciation and the expansion of crypto-focused financial products. The prospect of a clear framework reduces policy risk, enabling more reliable forecasting for investors and incumbents alike.
Yet the landscape remains nuanced. The same catalysts driving optimism—clearer regulation, ETF flows, and favorable political rhetoric—can invert if regulatory conversations stall or if macro momentum shifts. Traders highlighted by Swyftx’s Pav Hundal warned that even a temporary setback in policy or a pullback in Bitcoin could reprice equities quickly, given the leverage that many crypto-related businesses carry and the sensitivity of their earnings to asset prices. The market’s reaction in the near term will likely hinge on the speed and specificity of policy milestones, not merely on aspirational statements from leadership.
What to watch next
- Regulatory milestones: Monitor any progress on the Clarity Act or related crypto policy bills, and timing around potential votes or committee actions.
- ETF inflows: Track fresh data on spot ETF demand and related products that could channel more fiat liquidity into the crypto ecosystem.
- Federal Securities Laws: Observe developments in the SEC’s pending application and the GRCs around crypto transactions, as described in the agency’s filings.
- Bitcoin price dynamics: Watch whether BTC can sustain levels in the low-to-mid 70,000s and how this influences risk appetite in related equities.
- Political signals: Keep an eye on White House communications and legislative activity around crypto-market structures, as these can amplify or dampen sentiment shifts.
Sources & verification
- U.S. Commodity Futures Trading Commission: regulatory review filing for prediction markets (https://www.reginfo.gov/public/do/eoDetails?rrid=1294517).
- U.S. Securities and Exchange Commission: pending filing on Federal Securities Laws and crypto governance (https://www.reginfo.gov/public/do/eoDetails?rrid=1217012).
- Bitcoin price data and market movement cited by CoinGecko (https://www.coingecko.com/en/coins/bitcoin) and Ethereum price data (https://www.coingecko.com/en/coins/ethereum).
- Company price references and tickers via Google Finance pages for MSTR, COIN, HUT, and ABTC.
- Related coverage and quotes, including comments from Dominick John of Zeus Research and Swyftx analyst Pav Hundal, as reported in Cointelegraph.
Market reaction and key details
What the announcement changes
Bitcoin (CRYPTO: BTC) breached notable intraday gains as traders chased the prospect of regulatory clarity and new product avenues. The day’s rotation into equities tied to crypto assets reflects a broader rehearsal for institutional participation, with investors looking for policy breadcrumbs and potential structural protections that could sustain longer-term demand. The initial impulse from Washington, coupled with ongoing regulatory reviews, appears to be shaping a cautious, but increasingly confident, risk environment for digital assets and the companies that hold or facilitate them. The tone of policy discourse matters as much as the price action, because credibility around a defined framework can unlock capital that has previously stayed on the sidelines for fear of regulatory ambiguity.
Why it matters (conclusion)
In sum, the current episode illustrates a market sensitive to the narrative of clarity. If regulators deliver a robust, well-communicated framework, crypto equities could reprice higher over the medium term as institutional players expand their exposure. Conversely, any disappointment or a stall in policy momentum could extinguish the current enthusiasm, given the leverage and sensitivity of crypto-related earnings to asset prices. For traders and investors, the immediate imperative is to watch policy milestones and price stability in the underlying assets, as those variables are the most direct catalysts for sustained momentum or a renewed pullback.
Sources & verification
- Official regulatory filings from the CFTC and SEC cited in the article (see links above).
- Crypto price data and market movements from CoinGecko (BTC and ETH) and Google Finance (MSTR, COIN, HUT, ABTC).
- Analysts and industry commentary referenced, including Dominick John of Zeus Research and Pav Hundal of Swyftx, as cited in the piece.
Crypto-related stocks surged on Wednesday as recent pro-crypto commentary from the US presidential campaign pushed Bitcoin and the broader crypto market higher.
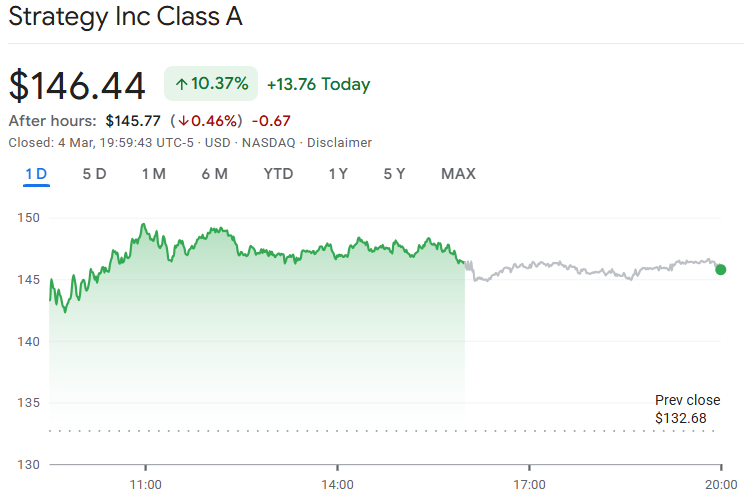
Alongside a rise in the cryptocurrency market, the Bitcoin (BTC) treasury company Strategy spiked by more than 10%. Crypto exchange Coinbase registered a more than 14% gain, while miners Hut 8 clocked 13.89% and American Bitcoin Corp rose 11.65%.
Dominick John, an analyst at Zeus Research, told Cointelegraph the promise of clearer regulations on the near horizon could be one of the factors fueling the rally.

“Crypto equities are rallying as regulatory risk is being fundamentally redefined. With the executive branch championing a clear digital asset framework, coupled with robust spot ETF inflows and the potential passage of the Clarity Act,” he said.
“The trend will persist as regulatory clarity strengthens and institutional flows accelerate. With policy risk receding and product demand expanding, crypto equities have room to reprice higher in the medium term.”
Wall Street’s main regulators have advanced plans to oversee the industry, with the Commodity Futures Trading Commission filing a regulatory review for prediction markets and the US Securities and Exchange Commission filing a pending application on Tuesday on Federal Securities Laws and how they govern some crypto and transactions.
Trump’s statements helped buoy crypto
Pav Hundal, the lead analyst at Australian crypto platform Swyftx, told Cointelegraph that US President Donald Trump’s recent swipe at the banks and his push for the Senate’s crypto market structure bill to pass could also be playing a factor.
During a press conference at the White House, Trump also reiterated that in “crypto, we want to be dominant; we want to be dominant in everything we do,” Fox 2 Detroit reported on Wednesday.
“The market is putting a policy premium in the tape right now, and it is inflating crypto stocks,” Hundal said.
“We’ve got a double whammy of Trump pushing Congress on legislation and picking a fight with US banks for dragging their heels over the CLARITY Act. Coinbase is basically the cleanest large-cap expression of that in US equities,” he added.
Rally could still cool on bad news
The wider crypto market has also experienced a spike. Bitcoin has jumped over 7.6% in the last 24 hours to trade at $72,866, according to CoinGecko, while Ether (ETH) is up more than 8.3%, trading at $2,132.
However, Hundal cautioned that if the expected regulatory progress stalls or Bitcoin drops, the stock rally could halt and retreat as well.
Related: Trump sends pro-Bitcoin Fed chair nomination to the Senate
“Crypto stocks are obviously rallying on the expectation of political progress, and there is no reason that couldn’t continue. But things change quickly with this White House. If we see this regulatory debate go stale, or hit a wall, or Bitcoin is hit, it’s not hard to imagine a correction,” he said.
“Coinbase is pricing policy optionality, miners are pricing operating leverage on the leading asset by market capitalization in the sector. It works while BTC holds up, and can still unwind fast if this momentum hits a snag.”
Magazine: Would Bitcoin really be at $200K if not for Jane Street? Trade Secrets


Zerohash, a blockchain infrastructure provider, has applied for a National Trust Bank Charter with the Office of the Comptroller of the Currency (OCC), joining a growing list of crypto firms seeking federal licensing.
Stephen Gardner, the Chief Legal and Compliance Officer at Zerohash, noted that applying for a charter was a logical progression for the company.
Why it matters:
- A national bank trust charter allows an institution to operate as a trust bank nationwide.
- It enables fiduciary activities, asset custody, and settlement services. However, institutions with this charter cannot take deposits or issue loans, and are not covered by FDIC insurance.
- Growing OCC approvals for crypto firms signal a structural shift toward federally regulated digital asset infrastructure.
The details:
- If approved, the charter would allow Zerohash to further expand its range of services within a federal framework.
- Several digital asset firms have taken similar steps, with some already securing conditional approvals.
- Crypto.com received conditional OCC approval in late February. Ripple, Circle, Paxos, and Fidelity secured similar approvals in 2025.
- In addition, BitGo received full OCC approval in December 2025.
- World Liberty Financial‘s subsidiary filed its application in January 2026 to establish World Liberty Trust Company, National Association.
The big picture:
- Traditional banking groups have pushed back against the OCC’s issuance of trust charters to crypto firms.
- The American Bankers Association raises concerns that broadening the trust charter, especially for entities not involved in traditional fiduciary activities, could blur the lines of what it means to be a bank and open the door to potential regulatory arbitrage.

TLDR:
- Stablecoin volume hit $30T last year, forming the blueprint Armstrong cites for tokenized equity growth.
- Over $200B in tokenized assets now live on-chain, with Ethereum holding more than 60% of that total.
- Tokenized equities could unlock 24/7 trading, fractional shares, and smart contract-based governance rules.
- Goldman Sachs CEO David Solomon confirmed tokenized equities are a major area of active strategic focus.
Wall Street attention toward tokenized equities is gaining momentum as major financial and crypto leaders discuss the concept publicly.
Goldman Sachs CEO David Solomon recently raised the topic during a discussion with Coinbase CEO Brian Armstrong.
The conversation focused on how blockchain technology could reshape global access to stock markets. The exchange also highlighted how stablecoins previously followed a similar adoption path.
Tokenized Equities Gain Attention From Goldman Sachs and Coinbase
Solomon asked Armstrong how tokenized equities could evolve within crypto markets. The discussion appeared in a video shared by Etherealize on the social platform X.
Armstrong compared the idea to early skepticism surrounding stablecoins. Many questioned the need for digital dollars when traditional digital payments already existed.
He noted that stablecoins eventually filled a gap for people without access to dollar bank accounts. Residents in high inflation economies often seek dollar exposure.
Countries such as Turkey, Argentina, and Nigeria illustrate that demand. Dollar-pegged crypto assets allow users to transact globally without traditional banking barriers.
Armstrong also referenced data showing strong stablecoin activity. Roughly $30 trillion in stablecoin payment volume occurred during the past year.
He said the same demand drivers could appear in tokenized equities. Crypto infrastructure could reduce friction in global securities trading.
Crypto Markets Push Tokenized Stocks and Global Asset Access
Armstrong outlined a simple model for tokenized equities. A traditional custodian would hold company shares while issuing equivalent tokens on-chain.
That structure could allow global investors to trade stocks without brokerage restrictions. Many people worldwide cannot easily access U.S. equity markets.
The model also introduces continuous trading. Blockchain markets operate around the clock, unlike traditional stock exchanges.
Fractional ownership could expand access further. Investors could buy small portions of companies such as Tesla or Nvidia.
Crypto markets already use perpetual futures and other derivatives. Armstrong said similar instruments could eventually extend to tokenized securities.
Smart contracts also allow programmable governance. Companies could restrict voting rights for short term shareholders through on-chain rules.
The conversation also referenced a broader tokenization trend across financial markets. Institutions now tokenize assets including Treasuries, private credit, and real estate.
Ethereum currently dominates that infrastructure. More than 60 percent of tokenized assets reside on the Ethereum network, according to Etherealize.
Those holdings exceed $200 billion in value. Institutional participants often use Ethereum because of its established compliance infrastructure.


Quant-driven trading firm TDX Strategies is pitching clients a bullish bitcoin trade with an interesting financing twist that helps offset the cost of the bet while reshaping the position’s risk profile.
The Hong Kong–based firm suggested a “bullish risk reversal” strategy on Wednesday, which involves selling a put option (insurance against a downtrend) and using the premium earned to buy bullish call options – essentially funding bullish bets with income from put writing.
This way, the trader effectively pays little or nothing upfront while remaining exposed to a bitcoin rally.
It reflects a broader shift toward more sophisticated, options‑driven positioning, as traders look to stretch their capital further and fine‑tune their risk instead of just piling into spot or straightforward bullish leveraged bets.
A call option is a contract that lets the buyer bet the price of an asset will rise above a specific level, called the strike price, by a certain date. If the price climbs above that strike, the buyer can profit; if it doesn’t, they usually just lose the small fee they paid for the option. It’s analogous to buying a lottery ticket.
A put option does the opposite. It lets the buyer set up protection against a potential drop in the asset below a specific strike price by a certain date. If it does, the put buyer stands to gain; if it doesn’t, the entity stands to lose the initial premium paid. It’s akin to buying insurance.
TDX’s suggested play combines the two in such a way that the trader becomes the seller of out‑of‑the‑money (OTM) puts (insurance) and collects the premium on one leg, then redeploys it to buy an OTM call on the other leg.
The result is a low‑cost bullish structure compared with simply buying a call outright. An out‑of‑the‑money (OTM) call is an option whose strike price is above the current market price of Bitcoin, while an OTM put is one whose strike price is below the current market price.
“The anticipated confirmation of Mojtaba Khamenei as Supreme Leader introduces an added element of risk of immediate retaliatory escalation, however, we view any headline-driven market jitters as a tactical entry point,” TDX said in a market note.
“We are looking to capitalize on temporary weakness to build upside exposure in March and April [expiry], favoring bullish risk reversals (funding OTM calls by selling OTM puts),” TDX added.
The strategy is not without risk. By selling out‑of‑the‑money puts, the trader is obligated to buy Bitcoin at the strike price if the market crashes below that level, which means he ends up acquiring the asset at a price higher than its prevailing market value.
At the same time, while the calls offer upside participation, their high strike prices mean they may expire worthless if the rally falls short of expectations. In effect, the trader trades a lower upfront cost for a more asymmetric payoff: limited upside above the call strike and meaningful downside exposure below the put strike.
The position, therefore, requires close monitoring and may not be suitable for new investors or those with limited capital and a weak grasp of options dynamics.


Bitcoin finally got through the door.
The largest cryptocurrency broke above $72,000 on Thursday, its highest level since before the Feb. 5 crash and the first clean move above the $70,000 ceiling that had rejected it three times in the past month.
It was trading at $72,180 in Asian afternoon hours on Thursday, up 5.9% over the past 24 hours and 5.4% on the week, as a combination of easing war anxiety, strong ETF flows, and a broader equity rebound pulled risk appetite back into the market.
The rally was broad. Ether climbed 7.5% to $2,114, reclaiming $2,000 with conviction for the first time since late February. Dogecoin surged 7.5% to $0.095. Solana added 5.3% to $89.91. XRP rose 4.2% to $1.41 and BNB gained 3% to $650. WhiteBIT Coin jumped 5.6%. The only notable laggard was Tron, up just 1.4%.
The trigger was a shift in global risk sentiment. Asian equities rallied for the first time since the Iran war broke out, with South Korea’s benchmark surging 11% after its biggest drop on record in the previous session.
Wall Street had led the way after economic data eased inflation concerns, though the recovery looked tentative with U.S. and European futures edging lower Thursday morning.
The conflict itself remains unresolved, however. Tehran is still targeting Israel and Gulf states. U.S. and Israeli forces continued striking Iran, including sinking an Iranian warship in international waters. Defense Secretary Pete Hegseth said operations could last “six, could be eight, could be three” weeks. Trump said “we’re doing very well on the war front” and that the U.S. has “great support.”
But markets have moved past the initial shock and into pricing mode. The Strait of Hormuz situation appears to be stabilizing with U.S. tanker escorts underway. Oil pared its early-week spike.
And the worst-case scenario of an uncontrolled regional escalation looks less likely with each day that passes without a dramatic widening of the conflict.

China’s Next Move: Financial War To Crush the Dollar | Alasdair Macleod
Call 999 if you see woman missing for more than a week as police ‘concerned’

Stem, Inc. (STEM) Q4 2025 Earnings Call Transcript


-

 Politics6 days ago
ITV enters Gaza with IDF amid ongoing genocide
-

 Politics2 days ago
Alan Cumming Brands Baftas Ceremony A ‘Triggering S**tshow’
-

 Fashion6 days ago
Weekend Open Thread: Iris Top
-

 Tech4 days ago
Unihertz’s Titan 2 Elite Arrives Just as Physical Keyboards Refuse to Fade Away
-
Sports5 days ago
The Vikings Need a Duck
-
 NewsBeat5 days ago
Dubai flights cancelled as Brit told airspace closed ’10 minutes after boarding’
-

 NewsBeat4 days ago
‘Significant’ damage to boarded-up Horden house after fire
-
 NewsBeat5 days ago
The empty pub on busy Cambridge road that has been boarded up for years
-

 NewsBeat4 days ago
Abusive parents will now be treated like sex offenders and placed on a ‘child cruelty register’ | News UK
-

 Entertainment3 days ago
Baby Gear Guide: Strollers, Car Seats
-
 Tech6 days ago
NASA Reveals Identity of Astronaut Who Suffered Medical Incident Aboard ISS
-

 Business6 days ago
Only 4% of women globally reside in countries that offer almost complete legal equality
-
Politics4 days ago
FIFA hypocrisy after Israel murder over 400 Palestinian footballers
-
 NewsBeat4 days ago
Emirates confirms when flights will resume amid Dubai airport chaos
-

 NewsBeat3 days ago
Is it acceptable to comment on the appearance of strangers in public? Readers discuss
-

 Crypto World6 days ago
From Crypto Treasury to RWA: ETHZilla Retreats and Relaunches as Forum Markets on Nasdaq
-

 Tech4 days ago
Viral ad shows aged Musk, Altman, and Bezos using jobless humans to power AI
-

 Business7 days ago
World Economic Forum boss Borge Brende quits after review of Jeffrey Epstein links
-

 Video7 days ago
Xii English top Selected mcq “Money Madness” Board Exam 2026, #chseodisha #hksir #mychseclass
-

 Video3 days ago
How to Build Finance Dashboards With AI in Minutes