
Crypto World
Bitcoin Suffers Yet Another Double-Digit Slide
The landscape around Ethereum is even worse, with the red streak going for six months.
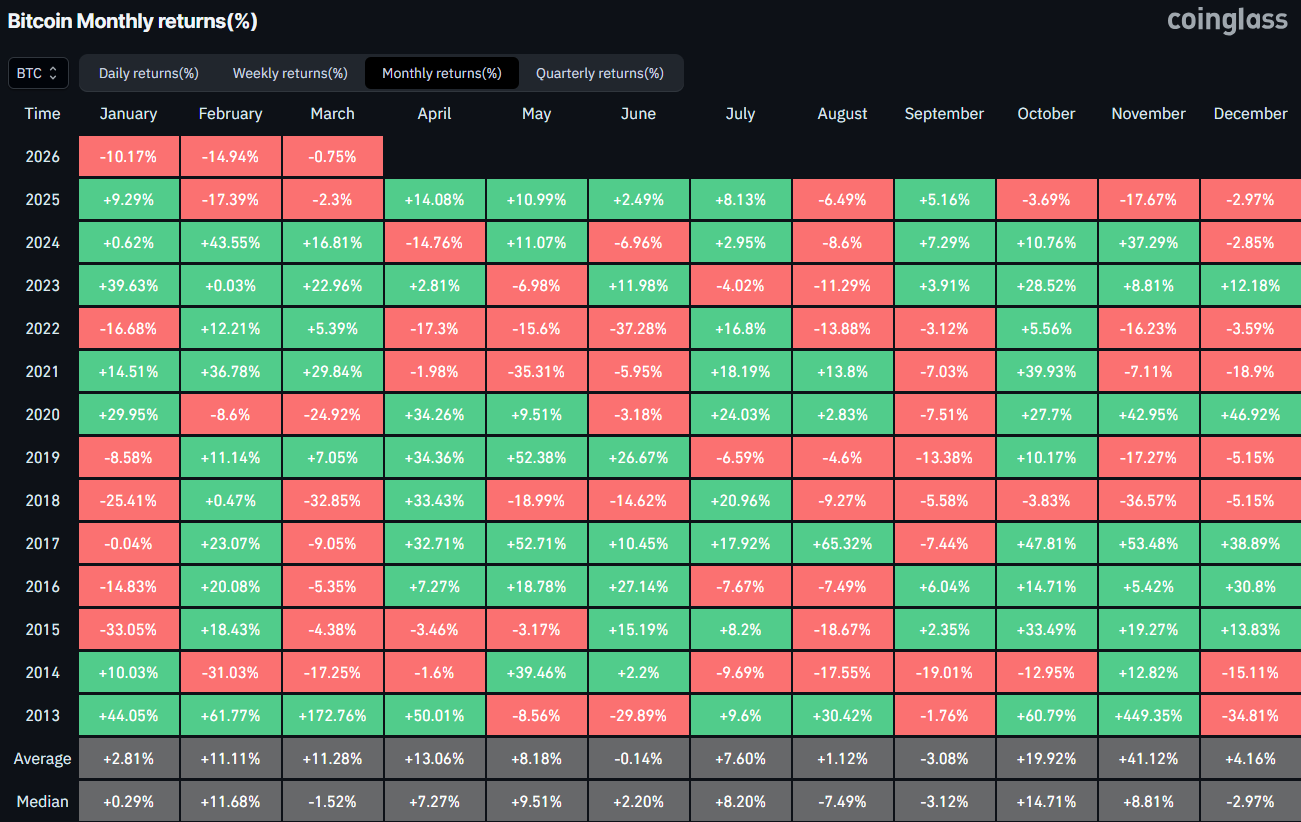
The positive start to 2026 was quickly erased, and bitcoin began to lose value rapidly, reaching new local lows of $60,000 in early February.
Although it recovered some ground since those 15-month lows, it still ended the month in the red with a painful double-digit decline. This made it five in a row.
February Deep in Red As Well
It was almost impossible to imagine the current situation in early October. At the time, bitcoin’s price was riding high, charting fresh peaks at over $126,000, and the community was anticipating even more records during the so-called ‘Uptober.’ The reality, though, was far different and brutal.
On October 10, the cryptocurrency market experienced its worst single-day liquidation event, with more than $19 billion wrecked as prices tumbled. As many analysts claimed after that pivotal day, something in the market’s structure broke, and it was never the same.
Bitcoin started to chart frequent losses and dumped to a five-digit price territory by the end of the year. It ended 2025 in the red, making it the first post-halving year to do so. January began on the right foot, but the rejection at $98,000 resulted in another nosedive. Thus, January saw losses of just over 10%.
Another massive crash occurred in early February, pushing bitcoin south to its lowest level since October 2024 at $60,000. Although it rebounded and finished February at around $65,000-$66,000, it still ended the month with a 15% decline. This made it the fifth consecutive month in the red for the first time since 2018.

Ethereum Goes a Step Further
Data from Cryptorank shows that the landscape around the world’s largest altcoin is even more painful. ETH has been in the red for six months in a row. Moreover, it has been in the green only three out of the past 15 months.
You may also like:
January and February were quite violent, with a 17.7% decline during the first month of the year and a whopping 19.6% drop in the second. This is the worst monthly streak for ETH since 2018, when it was in the red for seven consecutive months.
ETH is currently fighting to stay above $2,000 after dipping below that level on numerous occasions in the past month.

Binance Free $600 (CryptoPotato Exclusive): Use this link to register a new account and receive $600 exclusive welcome offer on Binance (full details).
LIMITED OFFER for CryptoPotato readers at Bybit: Use this link to register and open a $500 FREE position on any coin!

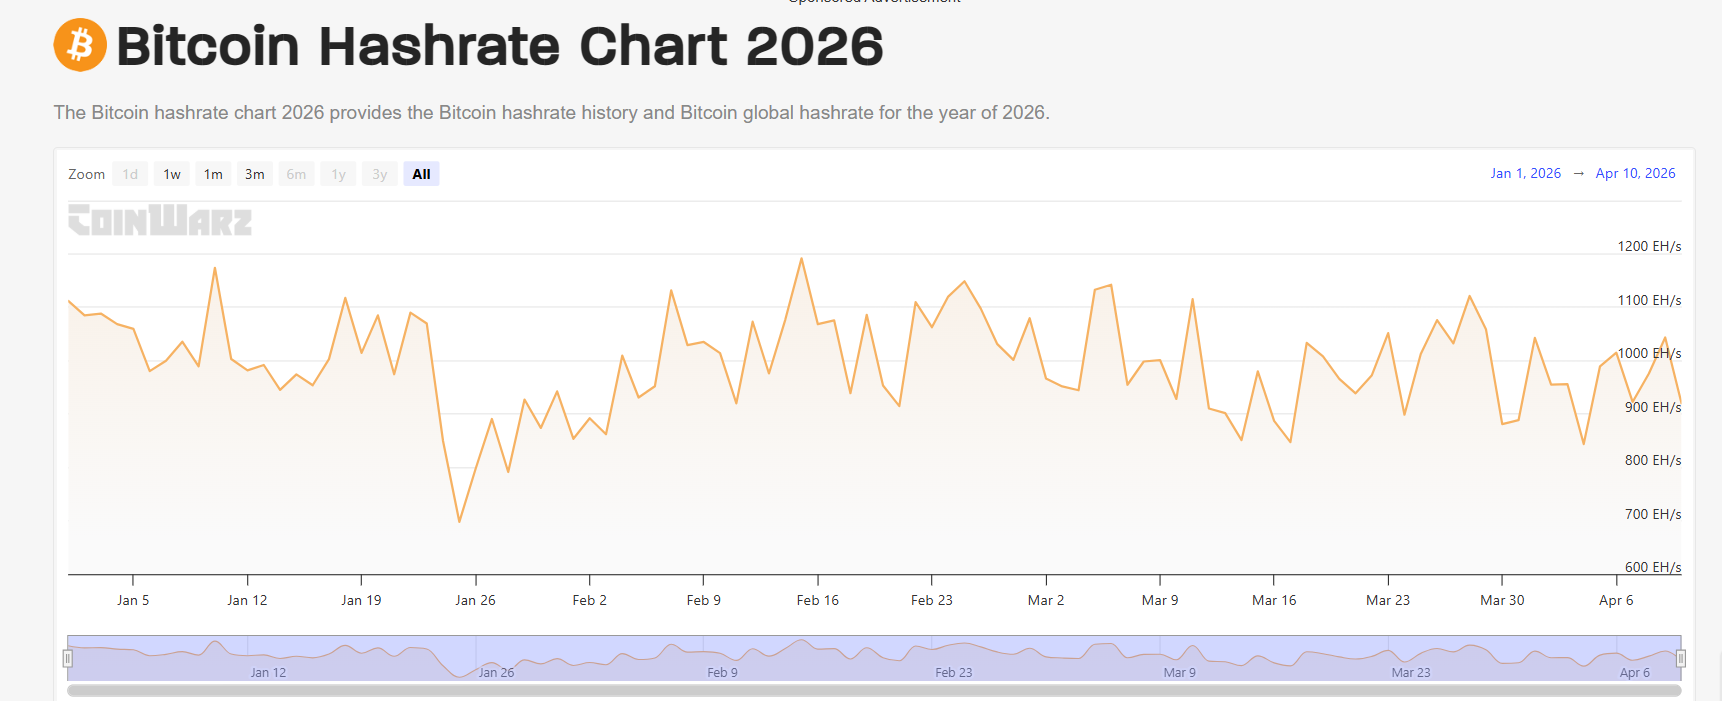
Bitcoin’s fifth halving is roughly two years away, and the mining sector is heading into it with far less margin for error than in 2024, as higher costs, tighter energy markets and clearer regulation reshape the industry.
At the last halving in April 2024, Bitcoin (BTC) traded at around $63,000 as rewards fell from 6.25 BTC to 3.125 BTC per block, according to Coingecko. In April 2028, at the next halving, miners face higher input costs for half the new coins, as rewards drop to 1.5625 BTC. That looks tougher in a world of record hashrate, higher energy prices and more selective capital.
Energy security has also become a strategic concern after geopolitical shocks jolted fuel and power markets, while regulators from Washington to Europe move from ad-hoc guidance to formal regimes for custody and licensed institutional platforms.
Those pressures are forcing miners to behave less like pure Bitcoin proxies and more like energy and infrastructure companies, monetizing reserves, cutting costs and rethinking capital allocation ahead of the April 2028 Halving.
The shift is also changing how investors assess the sector, with capital increasingly flowing toward operators that can secure long-term power and build infrastructure that extends beyond mining alone.
Balance sheets show tougher pre-halving cycle
Miners are already adjusting. MARA Holdings sold more than 15,000 Bitcoin in March to reduce leverage, Riot Platforms sold over 3,700 BTC in the first quarter, Cango sold 2,000 BTC to pay down Bitcoin-backed debt, and Bitdeer said its Bitcoin holdings had fallen to zero as of Feb. 20.

Behind those sales is a broader reset in how miners think about hardware, power and capital. The 2028 halving arrives in “an environment that looks almost nothing like 2024,” Juliet Ye, head of communications at Cango, told Cointelegraph.
She pointed to a widening efficiency gap that is “forcing real decisions around fleet upgrades” and a shift toward long-term energy contracts across multiple regions rather than chasing cheaper tariffs.
“There is less room in the middle now,” she said. “Operators with scale and diversification will be fine. Those without will find the next halving very difficult.”
GoMining struck a similar note. CEO Mark Zalan told Cointelegraph that “capital discipline now matters more than hashrate maximalism” and that new deployments now have to clear tougher return thresholds.
Related: Mining companies move deeper into AI, HPC as MARA may sell Bitcoin
From a mining pool’s perspective, some of the underlying dynamics remain familiar even as the pressure grows. “There is actually very little fundamental difference between this mining cycle and previous ones,” Alejandro de la Torre, co-founder and CEO of Stratum V2 pool DMND, told Cointelegraph. “The same dynamics repeat.”
He expects mining hotspots to reach their peak, then realign, as “no region keeps dominance for long,” opening the door for more decentralization as mid-size miners expand into new energy partnerships.
Related: Genius Group liquidates Bitcoin treasury to pay $8.5M of debt
Business models shift beyond pure block rewards
The economics around the next halving are also shifting away from pure block rewards, which is a “thinner business than it used to be,” Zalan said. He predicted stronger operators will look closer to power and data center businesses, and earn additional revenue through curtailment, grid services and heat reuse.
Cango is already building toward that model. “The facilities that will matter in five years are the ones that can do more than one thing,” Ye said, using mining to fill capacity while positioning sites to toggle between AI workloads and hashpower.

Regulation, once viewed mainly as an overhang, is increasingly part of the investment case. Zalan pointed to more specific rules on custody and banking access in the United States, alongside the European Union’s Markets in Crypto Assets (MiCA) regime and new exchange-traded funds (ETFs), derivatives and settlement rails out of Hong Kong, arguing “capital moves faster when those rules are clear and usable.”
Zalan said that backdrop is shaping both how miners finance themselves and how institutions position for the next issuance cut. He said he does not believe the market has “fully priced the next halving,” arguing that scarcity will meet a “much stronger ecosystem around Bitcoin by the time 2028 arrives.”
Ye sees investors already re-rating miners that lock in high-performance compute contracts, with those operators trading at “more than double the revenue multiple of pure-play miners,” while de la Torre believes supporting large established operators is “no longer the only logical path.”
If the 2024 cycle rewarded miners that rode Bitcoin’s price strength, the run into 2028 may favor operators that can manage debt, lock in power and build infrastructure that earns beyond block subsidies.
Magazine: AI agents will kill the web as we know it: Animoca’s Yat Siu


Jurrien Timmer, director of global macro at Fidelity Investments, characterizes the current market environment as “another wild ride,” where each week seems to deliver headlines stranger than the last.
Yet despite the volatility, his overarching message is that conditions are not nearly as dire as they might appear, and he remains relatively constructive on the outlook for markets.
Timmer argues that markets, broadly speaking, are “pricing in some form of resolution” to the current geopolitical tensions, particularly around Iran, “sooner rather than later,” he told CoinDesk in an interview.
Oil ‘backwardation’
While crude prices surged above $100 a barrel, the futures curve remains in backwardation, with contracts further out trading roughly $40 below the front month. That structure signals that markets view the current supply disruption as a short-term bottleneck rather than a prolonged crisis, according to Timmer.
Elsewhere, market behavior reinforces this cautiously optimistic view. The S&P 500, which at one point was down about 9%, has recovered to a drawdown closer to 1%.
Credit spreads remain contained, suggesting that systemic stress is limited. Even in traditionally defensive assets, the signals are nuanced. Gold and bonds, which are typically less correlated, have been moving together more closely, a dynamic Timmer attributes in part to global capital flows.
Countries facing constraints in moving energy through the Strait of Hormuz, he notes, may be raising liquidity by selling highly liquid assets such as gold and U.S. Treasuries, creating unusual correlations.
The crypto market got a much-needed lift Tuesday after U.S. President Donald Trump announced a two-week ceasefire with Iran. Oil prices plunged more than 17% on the news and equity markets also gained. WTI has since bounced back to trade around $100.
Bitcoin’s $65,000 support
Bitcoin adds another layer to this shifting landscape, behaving more like gold, while gold has, at times, traded with characteristics more akin to BTC.
When bitcoin reached $126,000 last October, fast-moving capital rotated out of crypto and into gold, a shift visible in exchange-traded fund (ETF) flows. Now, however, with bitcoin already down 50–60% from its peak, Timmer sees fewer “paper hands” left in the market.
Selling pressure has largely been absorbed, while gold, after a strong run, appears more vulnerable to a pullback. Despite this, he remains bullish on both assets. Bitcoin, in particular, looks technically interesting to him, with the $65,000 level acting as solid support.
He sees the potential for a base to form, though he emphasizes that a catalyst will be needed to drive the next leg higher.
The world’s largest cryptocurrency was trading in the low $70,000s at the time of publication.
‘Priced for success’
Timmer believes equities are effectively priced for success, with only single-digit drawdowns despite significant geopolitical uncertainty. A key reason, he argues, is the strength of corporate earnings.
Importantly, Timmer points out that the broader backdrop before the Iran conflict was already constructive. The U.S. Supreme Court’s rollback of tariffs had improved the policy environment, and fears of an AI-driven market bubble had not materialized. In fact, he sees investor skepticism, particularly toward AI and software valuations, as a healthy sign. In a true bubble, investors stop asking hard questions; today, they are doing the opposite. That scrutiny, in his view, has helped prevent the market from overshooting.
Still, the situation in the Middle East remains fluid, and the range of possible outcomes is wide. A worst-case scenario, in which Iran escalates by targeting energy infrastructure across the Gulf, could be highly destabilizing. With roughly 20% of global oil supply passing through the Strait of Hormuz, a prolonged disruption could lead to a stagflationary shock, combining elevated inflation with weaker growth.
Timmer nevertheless believes markets have developed a more measured response to geopolitical shocks. After a series of “false alarms,” including last year’s tariff-related selloff, which saw the S&P 500 drop 21% from its highs, investors are less prone to panic. There is now a “show-me” attitude, where weak hands are less easily shaken out.
This backdrop remains constructive, Timmer argues, supported by what he describes as a strong mid-cycle economic expansion. However, he highlights several risks that investors should actively manage.
One is concentration risk, particularly in the so-called “Magnificent Seven” technology stocks. Interest rate risk is another key concern. The 10-year Treasury yield is approaching 4.5% and could move toward 5%, a development that has occurred even amid geopolitical uncertainty. Rising yields, rather than falling, are an important signal that investors should monitor closely.
The real risk
Ultimately, Timmer frames periods of volatility not just as challenges but as opportunities. He encourages investors to act as providers of liquidity rather than takers. Those who panic during turbulent periods become price takers, while disciplined investors with long-term perspectives can step in as price makers. At Fidelity, he notes, this means leaning into volatility, providing liquidity, and rebalancing portfolios when others are retreating.
While acknowledging that geopolitical events are inherently unpredictable, Timmer emphasizes that remaining on the sidelines out of fear is not a viable strategy. Instead, a well-diversified portfolio, combined with a willingness to engage during periods of stress, can offer the best path forward.
Read more: Oil shock, Iran war risk keep crypto investors on sidelines: Grayscale

The Narrative of Questions around Investment
Xu said that Zhao frequently revisits the tale of selling property to amass Bitcoin, but there are important details that remain vague.
He also doubted whether this property belonged to Zhao or how it was initially financed.
Zhao had previously clarified that he sold an apartment at an approximate price of 900,000 and used the money to purchase Bitcoin at an average price of 600.
Therefore, Xu’s statements question the accuracy of the account but introduce a new challenge to the chronology.
The Conflict over Personal Life
The conflict spread beyond investment claims, with Xu mentioning Zhao’s personal life, including his divorce.
Xu proposed that Zhao might have provided biased information as he crafted a social identity for his financial choices.
Zhao replied by confirming that he had divorced and that he would not disclose legal documents to respect privacy.
He further insisted that his public pronouncements remain valid despite the criticism.
The Escalation and Legal Bet
The situation grew tense when Zhao made a 1-billion-dollar bet to prove his words about the divorce.
Moreover, he even volunteered to undergo legal verification should Xu agree to participate in the bet.
Xu did not accept the strategy and said that such a publicly declared bet was not befitting the leaders of controlled firms.
Therefore, he cast doubt on how such activities would be perceived by regulators of a high-profile exchange executive.
The Wider Context and Ongoing Dispute
The dispute is part of a wider struggle that can be traced back to earlier conflicts over business transactions and accusations.
In addition, Zhao has addressed past allegations in his book and refuted them, citing critics.
Moreover, both individuals continue to clash in the media, and the conflict remains ongoing in the crypto industry.
Therefore, the scenario underscores the ongoing conflict between major exchange executives as competition rises.

Key Points
- Diplomatic negotiations between Washington and Tehran concluded after 21 hours without agreement in Pakistan
- Nuclear weapons development remained the central sticking point, according to Vice President JD Vance
- President Trump directed immediate naval blockade operations in the Strait of Hormuz
- Approximately 20% of worldwide petroleum and LNG shipments transit through the strategic waterway
- Energy commodity prices anticipated to surge when trading begins Monday
Diplomatic efforts between Washington and Tehran concluded without resolution on Sunday in Islamabad, Pakistan, as 21 hours of intensive negotiations failed to produce a breakthrough on fundamental disagreements.
The American negotiating team, headed by Vice President JD Vance, cited Iran’s unwillingness to halt its nuclear weapons development as the primary obstacle to reaching an accord.
“Our non-negotiable requirements have been communicated with absolute clarity, and they have declined to meet our conditions,” Vance stated to journalists in Islamabad during the early hours of Sunday.
Tehran’s diplomatic representatives characterized the outcome differently, with Foreign Ministry spokesman Esmail Baghaei noting that complex international disputes require multiple rounds of engagement. He emphasized that “diplomatic channels remain open” for continued dialogue.
The negotiating agenda encompassed three critical issues: governance of the Strait of Hormuz passage, extending the temporary ceasefire agreement, and implementing a graduated sanctions reduction framework. Iranian semi-official news outlets characterized American proposals as “unreasonable.”
Since hostilities between the United States and Israel commenced in late February, Iran has effectively halted maritime transit through the Strait of Hormuz. This critical chokepoint facilitates roughly one-fifth of global oil and liquefied natural gas transportation worldwide.
On Sunday, two unladen oil tankers attempted passage through the strait but reversed course precisely when the diplomatic talks concluded.
Presidential Order for Naval Interdiction
Following the diplomatic breakdown, President Trump announced via Truth Social that U.S. naval forces would commence blockade operations in the Strait of Hormuz without delay.
“Effective immediately, the United States Navy will begin the process of blockading any and all ships trying to enter or leave the Strait of Hormuz,” Trump wrote.
Trump additionally declared that American naval vessels would detain any ship operating in international waters that had submitted payment to Iranian authorities. “No vessel paying an illegitimate fee will receive safe passage through these waters,” he stated.
The President characterized the diplomatic session as productive overall, noting that “most points were agreed,” while acknowledging the insurmountable divide concerning Iran’s nuclear ambitions.
Energy Markets Prepare for Volatility
Market observers predict substantial increases in petroleum and natural gas valuations when trading commences Monday. Nick Twidale, chief market analyst at AT Global Markets in Sydney, noted growing optimism last week preceding the negotiations.
“This could set us back to levels that we were trading at prior to the ceasefire announcement,” Twidale said. “I would think we will see oil open higher alongside the dollar.”
The recently established two-week ceasefire now appears increasingly unstable. Pakistani officials, who facilitated the discussions, described them as “constructive” and pledged ongoing mediation support.
Casualties from the conflict have exceeded 5,600 across Iran, Lebanon, and surrounding territories. U.S. Central Command reports thirteen American military personnel have been killed.
Israeli Prime Minister Benjamin Netanyahu advocated for the removal of enriched nuclear materials from Iranian facilities regardless of whether diplomatic agreements materialize.


Key Highlights
- Micron’s Q2 fiscal 2026 quarterly sales surged nearly 200% compared to the prior year, with records set in all divisions
- AMD delivered $10.3 billion in Q4 2025 sales, marking a 34% jump year-over-year alongside a 57% non-GAAP gross margin
- TSMC forecasts approximately 30% revenue expansion in 2026 when measured in U.S. dollars
- Despite strong AI exposure, these three companies maintain more modest price-to-earnings multiples than leading AI chipmakers
- TSMC anticipates its AI accelerator division will expand at a compound annual rate in the mid-40 percent range through 2029
Three semiconductor powerhouses—Micron, AMD, and Taiwan Semiconductor Manufacturing—are riding the artificial intelligence wave with impressive momentum. Yet despite robust financial performance and accelerating growth trajectories, market analysts suggest these stocks may be undervalued relative to their sector peers.
The ongoing buildout of AI infrastructure has created surging demand across the semiconductor supply chain, from specialized memory modules to cutting-edge processors and advanced fabrication services. While these companies occupy distinct positions within this ecosystem, they share a compelling characteristic: substantial revenue acceleration without the elevated valuation multiples commanded by other AI-focused names.
Micron: Transforming from Commodity Memory to Critical AI Component
Micron has undergone a remarkable repositioning in investor perception, evolving from a cyclical commodity producer into an essential AI infrastructure provider.
During the company’s fiscal second quarter of 2026, revenues expanded almost threefold versus the same period twelve months prior. The semiconductor manufacturer achieved unprecedented performance levels across its entire product portfolio, including DRAM, NAND flash, high-bandwidth memory, and all operating segments.
Profitability metrics showed equally dramatic improvement. The company’s fiscal third-quarter outlook alone is projected to surpass total annual revenue figures from any fiscal year ending through 2024.
Artificial intelligence servers demand massive quantities of specialized high-bandwidth memory, and Micron has positioned itself as a primary supplier for this critical component. Company leadership indicated that robust demand coupled with constrained supply conditions will likely persist well into 2027.
The manufacturer is also negotiating extended, multi-year supply agreements with major customers, potentially transforming the business model toward greater predictability and reducing the historical boom-bust patterns that characterized the memory industry.
Despite these fundamental improvements, Micron continues trading at a valuation discount compared to AI chip designers, even as memory has become indispensable to the AI computing architecture.
AMD: Impressive Performance in Nvidia’s Shadow
AMD announced record quarterly sales of $10.3 billion for Q4 2025, representing a 34% year-over-year increase. The company achieved a non-GAAP gross margin of 57%.
Advanced Micro Devices, Inc., AMD
Chief Executive Lisa Su characterized 2025 as a transformational year and emphasized that the company began 2026 with substantial forward momentum. She highlighted the EPYC processor family and expanding data center AI operations as primary growth engines.
AMD is constructing a comprehensive AI ecosystem that encompasses data center graphics processors, server central processing units, and strategic system-level collaborations.
Market participants frequently position AMD as a direct competitor to Nvidia and sometimes dismiss it as the inferior alternative. However, AMD’s investment thesis doesn’t require outperforming Nvidia entirely. The company simply needs to capture increasing market share within a rapidly expanding addressable market while maintaining healthy profit margins.
If AMD sustains its AI accelerator growth trajectory while preserving margin discipline, several analysts believe current valuations may prove significantly discounted when viewed retrospectively.
TSMC: The Essential Manufacturing Infrastructure Powering AI Innovation
TSMC produces the sophisticated semiconductor chips that power much of today’s AI economy. The foundry giant projects 2026 revenues will expand by nearly 30% when denominated in U.S. currency.
Taiwan Semiconductor Manufacturing Company Limited, TSM
AI accelerator production represented a high-teens percentage of total 2025 revenue. Management forecasts this segment will grow at a compound annual growth rate in the mid-40 percent range during the five-year period beginning in 2024.
TSMC’s strategic position differs fundamentally from Micron or AMD. The company maintains diversification across products and customers rather than depending on any single offering or client relationship. As long as demand for leading-edge semiconductor manufacturing remains robust, TSMC occupies an irreplaceable position within the global supply chain.
The manufacturer operates production facilities throughout Taiwan, Japan, and the United States, with additional American expansion projects currently in development.
Final Thoughts
Micron, AMD, and TSMC have all delivered compelling financial results in their latest reporting periods. Each company maintains substantial exposure to AI hardware demand while demonstrating expanding revenues and improving profitability. The sustainability of these growth trends will largely depend on whether AI infrastructure investment maintains its current pace throughout the remainder of 2026 and beyond.

Key Takeaways
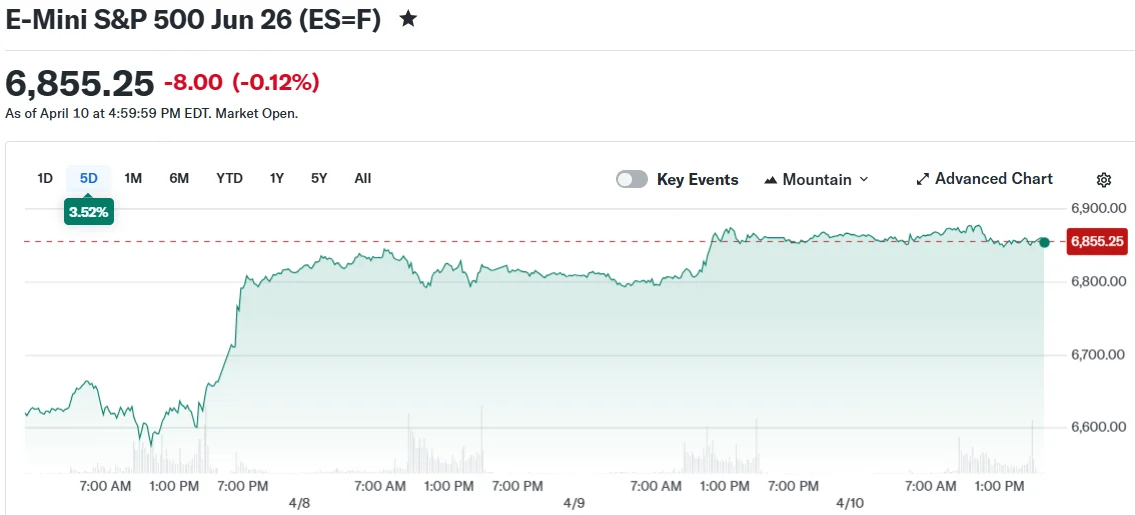
- Major indices secured back-to-back weekly gains: S&P 500 advanced 3.5%, Dow Jones climbed 3%, Nasdaq jumped 4.7%
- Financial sector heavyweights including JPMorgan, Goldman Sachs, and Bank of America release quarterly results this week
- Consumer prices posted their steepest monthly jump in nearly two years during March, primarily fueled by energy costs
- WTI crude trading around $98 per barrel, though forward contracts point to potential decline toward $85 by summer
- Technology sector shows dramatic split: software names plunge 30% while chip manufacturers soar over 20% year-to-date
Equity markets concluded their second straight positive week as Wall Street shifts focus toward quarterly corporate reports. The benchmark S&P 500 index rose 3.5%, while the Dow Jones Industrial Average added 3% and the tech-heavy Nasdaq Composite surged 4.7% over the five-day period. Despite remaining in negative territory for 2026, all three major gauges now sit less than 1% away from returning to breakeven.
The coming days feature a packed calendar of corporate announcements. Goldman Sachs kicks things off Monday. JPMorgan Chase, Citigroup, and Wells Fargo deliver their numbers Tuesday. Bank of America and Morgan Stanley are scheduled for Wednesday, while Netflix and Taiwan Semiconductor round out the week with Thursday releases.
Investors remain attentive to international developments as well. Diplomatic negotiations between the United States and Iran conducted in Pakistan throughout the weekend concluded without breakthrough, as Tehran declined commitments regarding nuclear weapons development, Vice President JD Vance disclosed Saturday evening.
Crude Oil Remains Central Market Driver
Since hostilities between the United States and Iran commenced, petroleum prices have emerged as the primary metric capturing trader attention. West Texas Intermediate crude finished Friday’s session near $98 per barrel, representing a significant jump from approximately $68 before conflict erupted.
Yet forward contracts for July settlement are pricing oil substantially lower around $85. Evercore ISI’s Julian Emanuel suggested that WTI settling in the “low-to-mid $80s” range would sufficiently eliminate downward pressure on equities.
The temporary 14-day truce involving the United States, Israel, and Iran provided market participants with renewed confidence during the previous week. The sustainability of this ceasefire will largely determine petroleum pricing and, consequently, broader equity market trajectory.
Friday’s inflation data revealed consumer prices climbed 0.9% during March, marking the steepest one-month advance since June 2022. Economic analysts attributed the bulk of this surge to energy-related increases stemming from geopolitical tensions.
The University of Michigan’s consumer sentiment gauge dropped to an all-time low in April, though researchers noted 98% of survey responses were gathered prior to the ceasefire announcement.
Diverging Fortunes Within Technology Sector
The performance gap among technology stocks has expanded dramatically. The iShares Software Sector ETF tumbled more than 7% during the past week and now shows a 30% decline year-to-date.
Salesforce represents the category’s weakest performer, sliding over 35% in 2026. AppLovin, Intuit, and ServiceNow have each retreated more than 40%. Microsoft, Palantir, and Oracle have all declined more than 25%.
Chip manufacturers present a contrasting picture. The VanEck Semiconductor ETF has gained over 20% during the current year. Intel, Applied Materials, Lam Research, and Marvell Technologies have each surged more than 50%.
ASML unveils results Wednesday, followed by Taiwan Semiconductor on Thursday. Taiwan Semiconductor’s preliminary March revenue figures released last week indicated robust ongoing demand for artificial intelligence processors.
Netflix also joins the reporting schedule Thursday, capping an action-packed week for corporate earnings.


Oil futures surged on Hyperliquid after President Donald Trump ordered a naval blockade of the Strait of Hormuz, a major global supply chokepoint. The move came after Iran refused to give up its nuclear ambitions during peace talks in Islamabad earlier in the day.
Perpetual futures tied to WTI crude oil jumped to $96.40, up 7% on the day, extending early gains. Brent futures rose 6% to $96.
Notably, WTI futures registered $1.53 billion in trading volume, making it the third-most-traded instrument on the platform behind BTC and ETH. The data highlights growing investor preference for price discovery on decentralized blockchain platforms, especially when traditional markets are closed.
This blockade news couldn’t have come at a worse time, as mid-April marks a critical period for the oil market, when the large-scale drawdown of strategic petroleum reserves coordinated by the International Energy Agency begins to approach its limit.
Those emergency releases, initiated after the war broke out on Feb. 28, have been offsetting a supply shortfall of roughly 4.5 to 5 million barrels per day caused by disrupted flows through the Strait of Hormuz, but as these buffers run down in the coming weeks, that gap risks widening sharply to roughly 10 to 11 million barrels per day if normal supply is not restored.
If this scenario materializes, it would amount to “a supply shock without precedent in the modern oil market,” the House of Saud recently said. The IEA’s Chief, Fatih Birol, warned last week that the oil supply shock could be worse in April than in March.
The impact on markets would likely be immediate, with oil benchmarks gapping higher on Monday amid tighter supply expectations, equities facing renewed risk-off pressure amid inflation concerns, and volatility rising across both traditional and crypto markets as traders reassess global growth assumptions.
Bitcoin, which is considered a leading indicator for risk assets by some traders, is already under pressure. As of writing, it changed hands near $71,000, down nearly 3% on the day, according to CoinDesk data.

Crypto prices are under further pressure during U.S. morning hours on Sunday after President Trump announced a blockade of the Strait of Hormuz.
“Effective immediately, the United States Navy … will begin the process of blockading any and all ships trying to enter, or leave, the Strait of Hormuz,” said the president in a social media post.
The president’s move came hours after Vice President J.D. Vance late Saturday announced that U.S. and Iranian negotiators had failed to agree to an extended ceasefire after long weekend meetings in Pakistan.
Trading above $73,000 for most of Saturday, bitcoin quickly pulled back to the $71,500 area following the Vance comments. In the minutes since President Trump announced the blockade, BTC has slid further to $70,900, now lower by 2.5% over the past 24 hours.


The largest traders have a problem: how to keep their activity quiet enough to not influence market prices or reveal any long-term strategies.
In traditional markets like equities, they’ve had that ability for decades through so-called dark pools and off-exchange venues. Even as far back as January 2025, more than half of all U.S. equities trading took place off public exchanges, according to Bloomberg data.
Crypto has never had an equivalent, and the absence is increasingly difficult to ignore. Every trade on Hyperliquid, every order on a decentralized exchange, is visible to anyone paying attention, and companies like DeFiLlama and Arkham exist to collect and present that data in a digestible way.
The crypto market, which prides itself on disrupting traditional finance, has replicated one of TradFi’s most persistent structural problems: If you’re big enough to move markets, everyone can see you coming. As a result, firms providing liquidity on public decentralized exchanges say their strategies get reverse-engineered quickly
“On Hyperliquid, one of the top market makers told us they have to rotate their trading strategies every three weeks because they get copied,” Denis Dariotis, co-founder of GoQuant, a crypto trading infrastructure firm backed by GSR, said in an interview. “That’s the alpha problem.”
There are other consequences, too. Market makers — the firms providing the liquidity that keeps crypto markets functioning — operate in full public view, and the industry has developed a habit of making them the villain whenever something goes wrong. Recent scrutiny of Jane Street‘s involvement in the Terra/Luna collapse is only the latest example. A large firm’s onchain activity gets traced, a narrative forms and the company spends weeks managing a PR crisis over trades that, on a traditional venue, would have been entirely unremarkable.
GoQuant’s answer is GoDark, a decentralized exchange (DEX) set to start up on Solana in May. That platform uses zero-knowledge proofs to conceal trade details not just from other market participants, but also from the node operators running the order book. The ambition is radical: a matching engine where nobody in the system can see what they’re matching.
The immediate question is whether that’s technically achievable at any useful speed. Zero-knowledge proofs are computationally expensive, and the architecture adds latency that privacy-agnostic systems don’t have to absorb. Internal testing puts order matching at 25 to 50 milliseconds — Dariotis frames this as fast relative to most decentralized exchanges, where execution often runs into the hundreds of milliseconds, and he’s right. But it’s also an order of magnitude slower than what’s available to firms co-located with a centralized exchange. For retail traders that gap probably doesn’t matter. For the market makers GoDark is banking on to provide liquidity, it might.
Which brings up the harder problem. A private exchange with no volume is just a dark room. GoDark’s plan to seed liquidity mirrors what Hyperliquid did with its HLP vault — users deposit funds, the funds get deployed as market-making liquidity, participants take a cut of fees and first access to liquidations.
It worked for Hyperliquid. But it has not worked for most of the DEXes that have tried to replicate the model since, which have generally seen volume collapse once the incentive period ends.
Then there is the regulatory question, which the team has so far avoided having to answer directly. Traditional dark pools are private in the narrow sense that they conceal pre-trade order information, but they operate under post-trade reporting requirements and regulatory oversight.
GoDark’s privacy is more absolute by design, it’s structurally incapable of producing a full audit trail. The inclusion of automated OFAC screening is a gesture toward compliance, but it is unlikely to satisfy regulators who have spent the past three years pushing crypto toward more transparency, not less. How that tension resolves — and whether it limits institutional participation to jurisdictions with lighter oversight — remains to be seen.
GoDark is separate from GoQuant’s existing institutional product of the same name, a spot DEX built with Copper and GSR that enters production next month and targets a different, narrower client base. The May launch is the retail-facing version.
Banks and corporates across Europe are moving beyond exploration and are now actively selecting infrastructure partners to support stablecoin adoption, according to Lamine Brahimi, co-founder and managing partner at crypto custody technology provider Taurus.
Brahimi told Cointelegraph that eighteen months ago, most conversations were still educational, focused on understanding stablecoins and their risks. Today, firms with board-level approval are preparing to go live. He said the introduction of Markets in Crypto-Assets Regulation (MiCA) has accelerated that transition by replacing fragmented national rules with a single regulatory regime.
“In the past twelve months alone some of Europe’s most stringent financial institutions are all arriving at the same conclusion, digital assets, including stablecoins, belong inside the existing banking stack, not beside it,” he said.

Corporate treasury teams are driving much of the demand. Initially focused on payments and settlement, companies are looking to use stablecoins to move funds faster, reduce costs and operate outside traditional banking hours, Brahimi said.
Related: Bank of France calls for tougher MiCA limits on stablecoin payments
Demand drives stablecoin adoption in Europe
Brahimi said adoption is increasingly driven by practical needs rather than long-term strategy. “Once clients start asking for better settlement, more flexibility, or more efficient cross-border movement of value, the conversation becomes much more immediate and much more practical,” he added.
On Thursday, ClearBank Europe announced that it has become the first Dutch credit institution to secure approval under MiCA to operate as a crypto asset service provider. A consortium of major European banks, including ING, UniCredit, CaixaBank and BBVA, is also developing Qivalis, a MiCA-compliant euro stablecoin initiative designed to enable regulated onchain payments and settlement across Europe.
European banks are also moving ahead with stablecoin initiatives. Societe Generale has positioned its stablecoins around cross-border payments, onchain settlement, FX and cash management, while Oddo BHF has launched a MiCA-compliant euro stablecoin. Meanwhile, a consortium of banks, including ING, UniCredit and BNP Paribas is preparing a Swiss-franc stablecoin for the second half of 2026.

Konstantin Vasilenko, co-founder and chief business development officer at Paybis, said the platform has seen rising demand for compatible stablecoins in Europe. Between October 2025 and March 2026, USDC (USDC) volume on Paybis in the EU climbed about 109%, while its share of total stablecoin activity increased from roughly 13% to 32%.
Vasilenko added that in the EU, Paybis stablecoin buy volume remained roughly five to six times higher than sell volume between October 2025 and March 2026. He also noted that average stablecoin transaction sizes were about 15% to 35% larger than typical Bitcoin (BTC) or Ether (ETH) trades. “That usually points to working capital, settlement use and more deliberate business flows,” he said.
Related: Hong Kong grants first stablecoin licenses to Anchorpoint and HSBC
Stablecoin volumes could reach $1.5 quadrillion by 2035
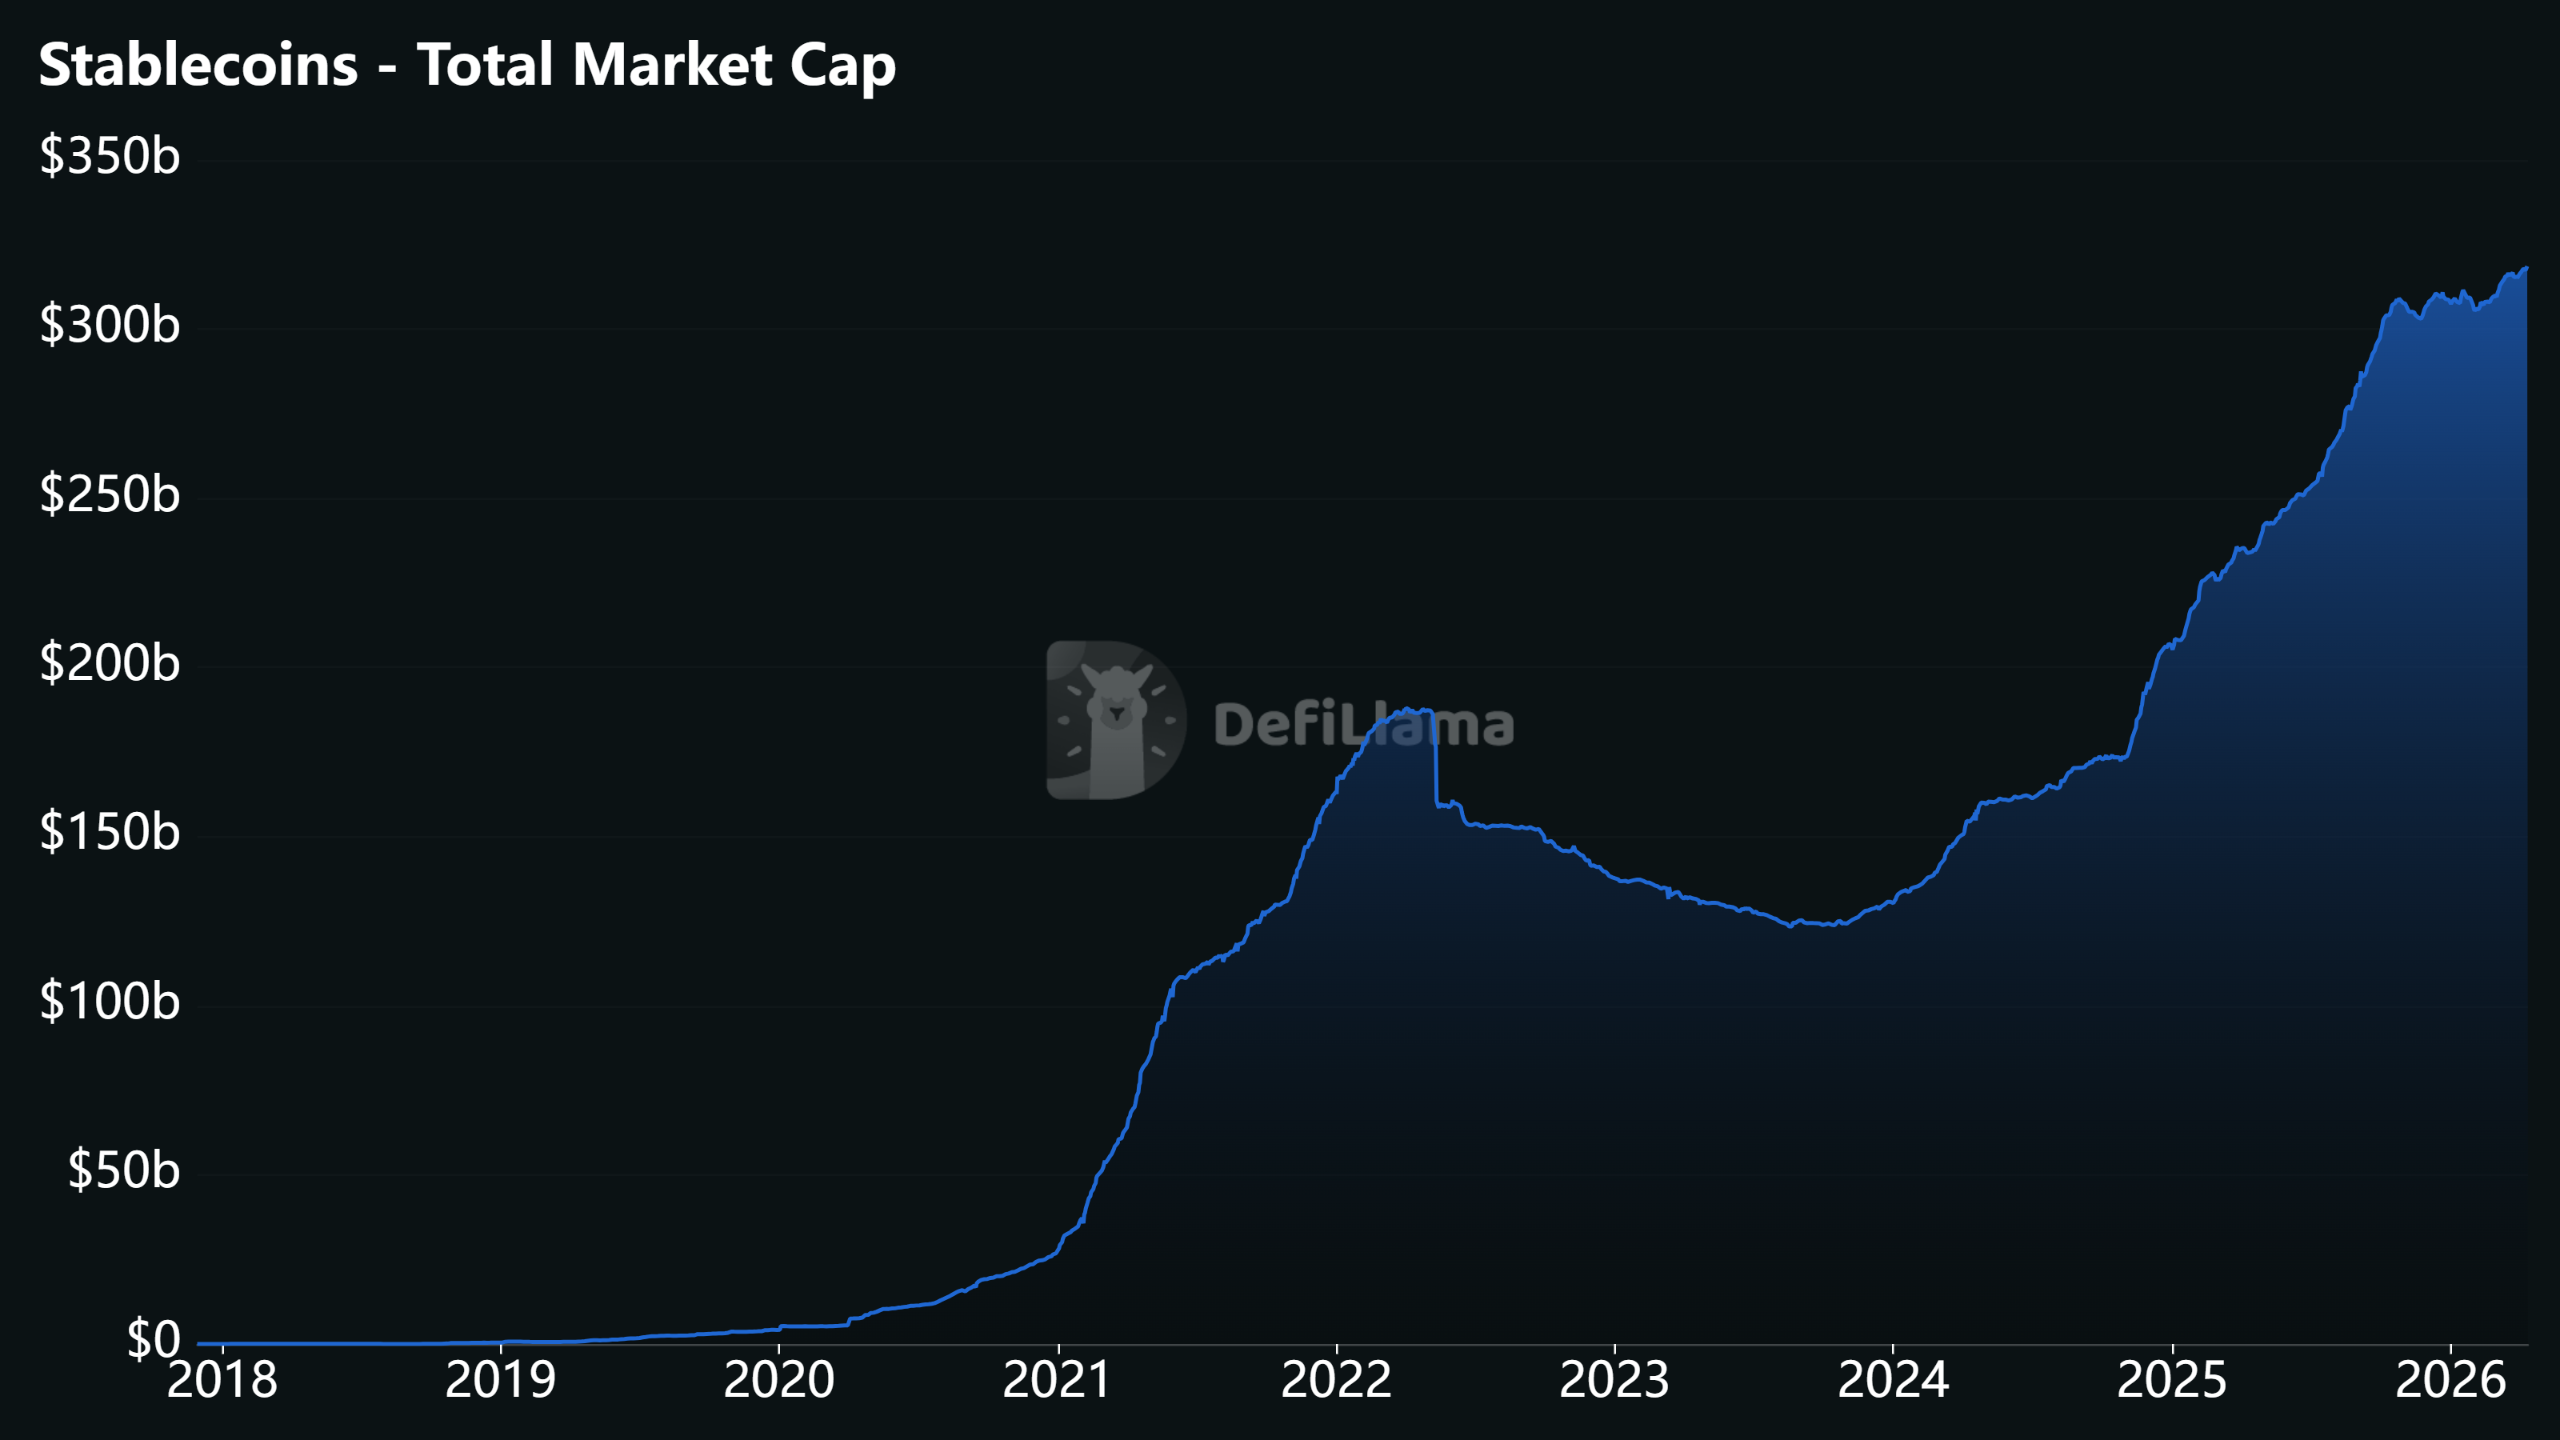
A new report from Chainalysis projects that stablecoin transaction volumes could grow dramatically over the next decade, reaching as high as $719 trillion by 2035 under organic growth scenarios, up from about $28 trillion in 2025.
In a more aggressive scenario, volumes could climb to $1.5 quadrillion if stablecoins become a dominant payment infrastructure and wealth transfer from baby boomers to younger, more crypto-native generations accelerates adoption.
Will Harborne, CEO of stablecoin infrastructure provider Rhino.fi, said that stablecoins will become increasingly important for corporate treasury, cross-border settlement, and FX between euro and dollar stablecoins over the next few years.
“I think every business will eventually start accepting and using stablecoins in some form, and the companies that prepare early will be in the best position when that shift becomes mainstream,” he said.
Magazine: How crypto laws changed in 2025 — and how they’ll change in 2026

UK bases are ‘invaluable’ to US military

Martinez, De Ligt, Dorgu – Man United injury latest and return dates after Michael Carrick boost

Amphion Argon7LX at AXPONA 2026 Proves Finland Still Builds Speakers That Shame the Rest of Us (Quietly, of Course)

Why Israel is blocking foreign journalists from entering

Bitcoin: We’re Entering The Most Dangerous Phase

Alan Cumming Brands Baftas Ceremony A ‘Triggering S**tshow’

Emotional Blackmail Disguised as Financial Support #estrangementawareness

bitcoin explained in hindi – bitcoin account kaise banaye | bitcoin kaise kharide aur beche | zebpay

Stephen Miller Faces $3.8B Financial Allegation Debate in US | PakCan News
-

 Business7 days ago
Three Gulf funds agree to back Paramount’s $81 billion takeover of Warner, WSJ reports
-

 Politics2 days ago
US brings back mandatory military draft registration
-

 Fashion2 days ago
Weekend Open Thread: Veronica Beard
-

 Tech5 days ago
How Long Can You Drive With Expired Registration? What Florida Law Says
-

 Fashion6 days ago
Massimo Dutti Offers Inspiration for Your Summer Mood Board
-
 Sports2 days ago
Man United discover Nico Schlotterbeck transfer fee as defender reaches Dortmund agreement
-

 Crypto World3 days ago
Canary Capital Files SEC Registration for PEPE ETF
-

 Fashion5 days ago
Let’s Discuss: DEI in 2026
-

 Business2 days ago
Tesla Model Y Tops China Auto Sales in March 2026 With 39,827 Registrations, Beating Cheaper EVs and Gas Cars
-

 Crypto World4 days ago
Bitcoin recovers as US and Iran Agree a Ceasefire Deal
-

 Politics2 days ago
Malcolm In The Middle OG Turned Down ‘Buckets Of Money’ To Appear In Reboot
-

 Business2 days ago
OpenAI Halts Stargate UK Data Centre Project Over Energy Costs and Copyright Row
-

 Business23 hours ago
Ireland Fuel Protests Enter Day 5 as Blockades Spark Shortages and Government Prepares Support Package
-

 Tech6 days ago
Italian court says Netflix must refund customers up to $576 over price hikes
-

 Tech6 days ago
Gamer Restores the Original PlayStation Portal From Two Decades Ago
-

 Tech6 days ago
Haier is betting big that your next TV purchase will be one of these
-

 Tech6 days ago
The Xiaomi 17 Ultra has some impressive add-ons that make snapping photos really fun
-

 Tech6 days ago
Samsung just gave up on its own Messages app
-

 Politics2 days ago
LBC Presenter Mocks Trump Over Iran War Failures
-

 Tech6 days ago
Save $130 on the Samsung Galaxy Watch 8 Classic: rotating bezel, sleep coaching, and running coach for $369
You must be logged in to post a comment Login