
Crypto World
Bitcoin’s 22% rally now needs real demand to outlast Treasury liquidity boost



Bitcoin’s latest breakout may have started with a shift in U.S. Treasury-market liquidity, but analysts say its staying power will depend on whether ETF inflows and spot demand can replace the initial macro boost.
Summary
- Bitcoin’s recent 22% rally initially carried a macro signature as the Treasury’s expanded long-term bond buybacks pushed yields lower and revived debasement concerns.
- Sygnum CIO Fabian Dori said falling BTC-denominated open interest and contained funding suggest short covering helped fuel the breakout rather than leveraged longs alone.
- U.S. spot Bitcoin ETFs drew $1.92 billion during the breakout week, while continued inflows suggest crypto-native demand is beginning to support the move.
- DWF Labs’ Martin Lee said ETF flows, futures basis and Bitcoin’s pre-breakout range will show whether the rally has a durable structural bid ahead of Sept. 9.
- Both analysts said broader liquidity conditions, rather than the Fed’s policy rate alone, will be crucial as markets assess Warsh’s Jackson Hole message.
Bitcoin surged roughly 22% during its breakout week as long-term Treasury yields fell and the dollar weakened following the U.S. Treasury’s decision to expand buybacks of longer-dated government debt. The move also triggered a major short squeeze, while demand for U.S. spot Bitcoin exchange-traded funds accelerated.
The Treasury said on Aug. 19 that it would at least double the maximum size of liquidity-support buybacks for 10-to-20-year and 20-to-30-year nominal Treasuries, raising them from $2 billion to at least $4 billion per operation. The larger operations are scheduled to begin Sept. 9 and continue through the current refunding quarter.
Fabian Dori, chief investment officer at FINMA-regulated digital asset bank Sygnum, told crypto.news that Bitcoin’s behavior alongside other markets suggests the first stage of the rally had a strong macro component.
“The clearest tell is the combination of cross-asset behavior and crypto-market plumbing.”
Dori said Treasury’s announcement temporarily pushed long-term yields lower while weakening the dollar and lifting both gold and Bitcoin. In his view, those moves were consistent with investors seeking hard assets amid renewed concerns about currency debasement rather than a rally driven exclusively by crypto-specific demand.
Martin Lee, Market Insights Lead at DWF Labs, pointed to a similar divergence across markets. AI and technology assets remained under pressure while gold and Bitcoin ETFs attracted capital as debasement concerns returned, he told crypto.news.
As crypto.news reported earlier, U.S. spot Bitcoin ETFs received about $1.92 billion during the breakout week, their largest weekly inflow in 10 months.
At the same time, the price surge forced traders positioned for further weakness out of the market. Lee said a record $2.7 billion in crypto short positions were liquidated as Bitcoin cleared its previous trading range, meaning part of the apparent spot demand reflected traders buying Bitcoin to cover bearish positions.
Bitcoin rally shows signs of both macro and crypto demand
Derivatives data provides another clue about the nature of the breakout.
Dori noted that Bitcoin-denominated open interest fell during the rally while funding rates remained contained. Bitcoin futures open interest recently declined to roughly 587,584 BTC, its lowest level in nearly five months, from around 645,760 BTC on Aug. 14.
Rather than showing traders aggressively piling into leveraged long positions, Dori said the combination points toward forced short covering playing an important role.
Still, he does not view the entire rally as a macro trade.
“So the right interpretation is probably mixed.”
Dori said the first impulse saw Bitcoin behave more like gold, as lower long-term yields, a weaker dollar, and debasement concerns drove demand. A second, crypto-specific impulse came from ETF inflows alongside regulatory developments in Washington, including the SEC’s Regulation Crypto proposal and renewed White House pressure for progress on the CLARITY Act.
ETF flows provide some evidence that demand has continued beyond the initial Treasury shock. U.S. spot Bitcoin ETFs recorded eight consecutive sessions of inflows through Wednesday, attracting about $2.8 billion over the streak.
The continued inflows matter because the initial reaction in the bond market has already weakened. BNY Markets said the decline in the term premium following the Treasury announcement had largely retraced, with long-term yields returning close to levels seen before the Aug. 19 announcement.
Bitcoin has therefore reached a point where crypto-specific buying may need to carry more of the rally if the original rate impulse continues to fade.
Sept. 9 becomes the next liquidity test
The larger Treasury buybacks do not begin until Sept. 9, raising the question of how much of their expected impact markets have already priced in.
Dori said markets normally react when such policies are announced rather than waiting for the operations themselves to begin. More important than the immediate size of the purchases, in his view, was the signal that the Treasury is willing to intervene when longer-term borrowing costs become excessively high.
Whether that support lasts will depend on what happens after the announcement’s effect fades.
Dori said rising long-end yields would suggest that the buybacks are failing to provide the expected support, while a rebuilding of the Treasury General Account could withdraw liquidity. Rapid increases in funding rates and open interest would also indicate that leverage, rather than underlying demand, had begun driving Bitcoin higher.
Weakening ETF flows or tighter dollar funding conditions would remove another source of marginal demand.
Lee similarly argued that anticipation alone cannot sustain the rally indefinitely.
“A rally on anticipation is only as durable as the flow that follows it.”
He identified ETF flows, futures basis and funding, and Bitcoin’s previous trading range as three key indicators to watch before Sept. 9.
A week of negative ETF creations while Bitcoin holds near current levels could indicate that the anticipation trade is unwinding, Lee said. He added that the three-month futures basis moved back above the 10-year Treasury yield during the rally; a reversal below that level would suggest the cash-and-carry bid had failed to persist.
The more bearish combination would be Bitcoin closing back inside its pre-breakout range while ETF flows turn negative, which Lee said would indicate that leverage drove much of the move without a durable structural bid emerging.
Liquidity increasingly extends beyond Fed rates
Both analysts also argue that investors looking only at the Federal Reserve’s policy rate may miss important forces influencing crypto prices.
Dori said Treasury cash management, particularly changes in the Treasury General Account and the mix of issuance and buybacks, has recently become an important marginal driver of liquidity. The term premium then transmits changes at the long end of the Treasury curve into risk assets.
Other channels include bank balance-sheet capacity, private credit creation, stablecoin growth and global dollar funding conditions, while the Federal Reserve’s balance sheet remains important over a longer horizon.
Lee similarly ranks dollar funding conditions and real yields ahead of the policy rate for short-term crypto market behavior, followed by the term premium. Treasury cash balances and reserve dynamics influence the liquidity underneath those markets, while issuance matters partly through its effect on longer-term yields.
For Lee, Bitcoin’s reaction to the Treasury buyback announcement showed how quickly a change at the long end of the yield curve can affect crypto even without a change in the Fed’s policy-rate outlook.
Warsh faces Bitcoin market focused on more than rates
The liquidity debate now shifts toward Federal Reserve Chair Kevin Warsh’s first Jackson Hole keynote on Friday.
The latest inflation data gives the Fed a complicated backdrop. The Bureau of Economic Analysis reported that headline Personal Consumption Expenditures inflation rose 0.2% in July and 3.7% from a year earlier. Core PCE increased 0.2% for the month and 3.3% annually.
Real consumer spending was nearly unchanged during July, while the personal saving rate stood at 3%.
Dori said Warsh could affect short-term rate expectations by explaining how the Fed views current inflation pressures, including those connected with oil markets. Treasury is attempting to influence the longer end of the curve through its buyback program, while the Fed has more direct control over short-term rates.
“If both were to get aligned, that would be a powerful support for risk assets.”
However, Dori said a simple change in expectations for the September Federal Open Market Committee meeting may not be enough to materially alter institutional crypto positioning.
Instead, investors should watch for any signal that changes the broader liquidity outlook, such as greater tolerance for oil-driven inflation, a different balance between inflation risks and economic growth, or comments capable of repricing the Treasury term premium.
Lee said institutions should remain defensive if inflation, bond yields and the Fed’s policy outlook provide conflicting signals. Bitcoin’s reaction alongside gold could offer another clue about how investors are treating the asset.
If Bitcoin rises with gold while long-duration bonds sell off, Lee said it would strengthen the case that investors are treating BTC as a hedge against fiscal and currency concerns. If Bitcoin instead falls alongside gold, its rate sensitivity would remain dominant, and institutions would have greater reason to reduce exposure.
For both analysts, the next stage of Bitcoin’s rally therefore depends less on any single inflation reading or September rate decision than on whether the liquidity conditions behind the breakout persist. It will also follow whether sustained ETF and spot demand can take over as the initial Treasury-driven impulse fades.

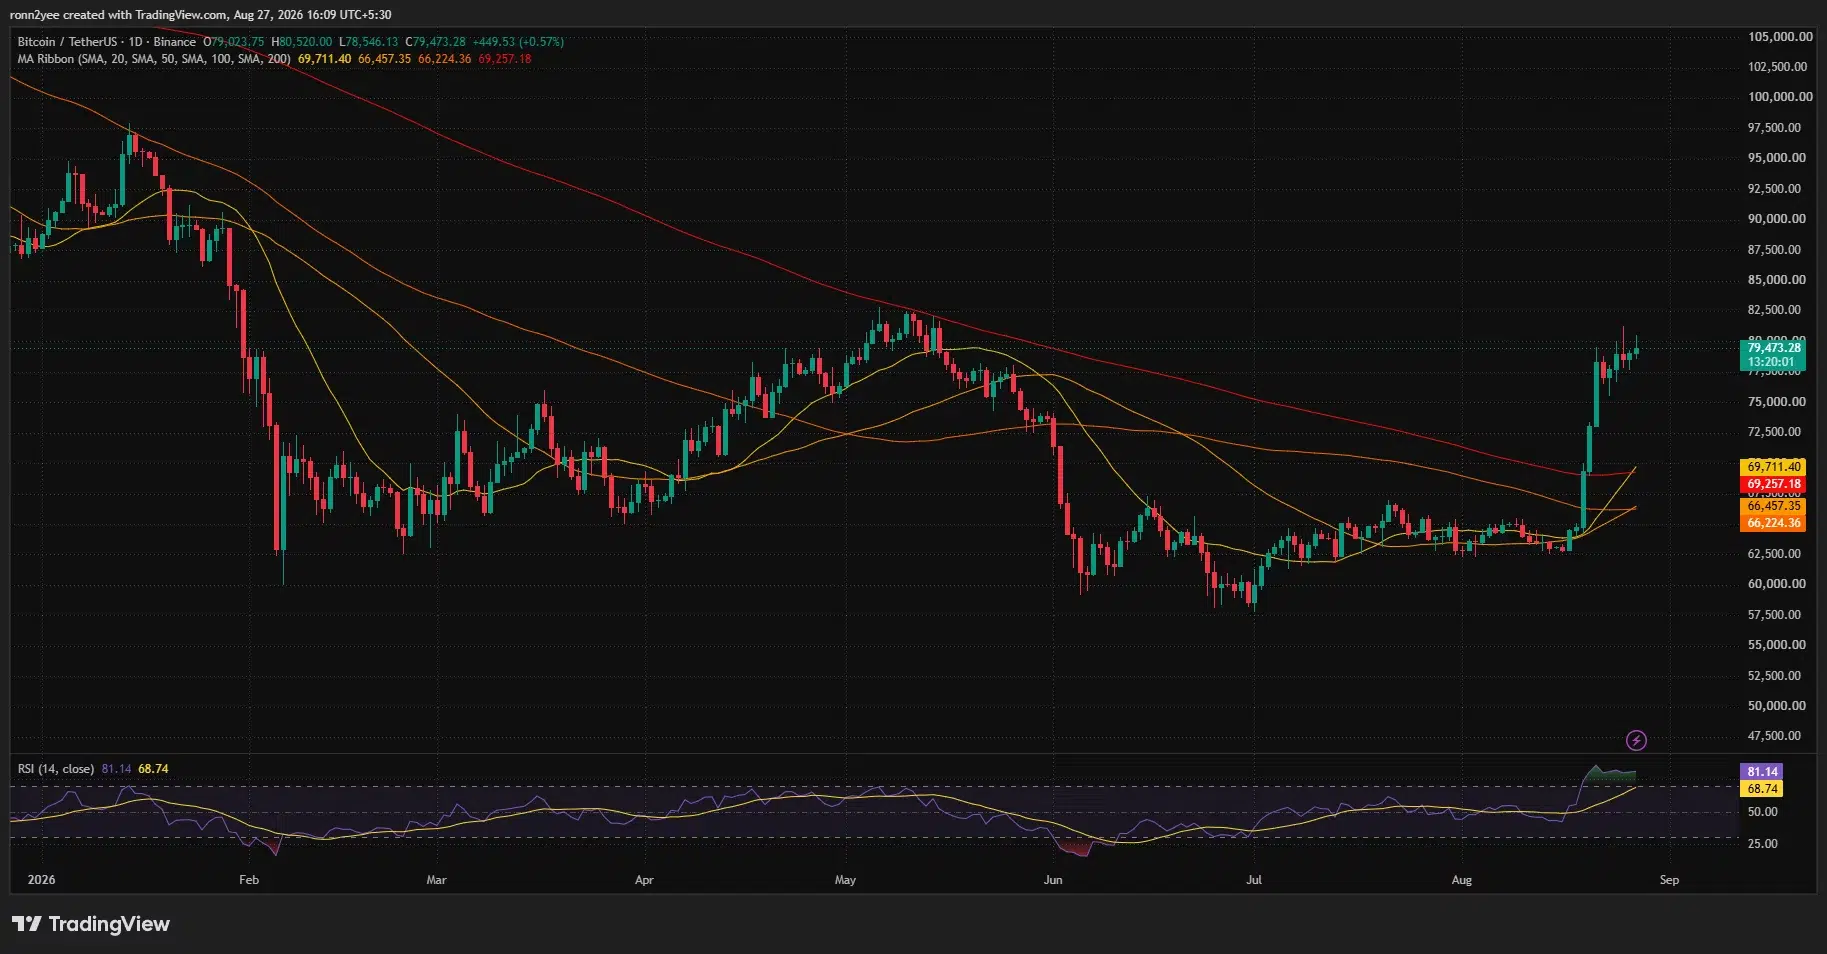
Bitcoin price held near $79,500 on Aug. 27 after a rapid breakout from the $63,000 area, with ETF demand and U.S. policy developments supporting the rally even as technical indicators warned that momentum may be stretched.
Summary
- Bitcoin price traded near $79,500 after gaining roughly 25% from its mid-August consolidation range.
- Daily RSI reached 81.14, placing BTC firmly in overbought territory.
- The 4-hour Supertrend remained bullish while MACD showed fading short-term momentum.
- Liquidation clusters near $81,000 and $77,500 could shape Bitcoin’s next move.
Bitcoin price holds above its breakout zone
According to data from crypto.news, Bitcoin (BTC) price was trading at approximately $79,473 at the time of writing. The price reached an intraday high of $80,520 after opening near $79,024.
BTC has gained roughly 25% since breaking out of a narrow range near $63,000 on Aug. 19. The advance took the asset above $80,000 before sellers blocked attempts to extend the rally through the $81,000–$82,000 region.
The daily chart shows Bitcoin trading above its four tracked simple moving averages. The 20-day SMA stood at $69,711, while the 200-day SMA was near $69,257. The 50-day and 100-day averages were positioned at $66,457 and $66,224, respectively.
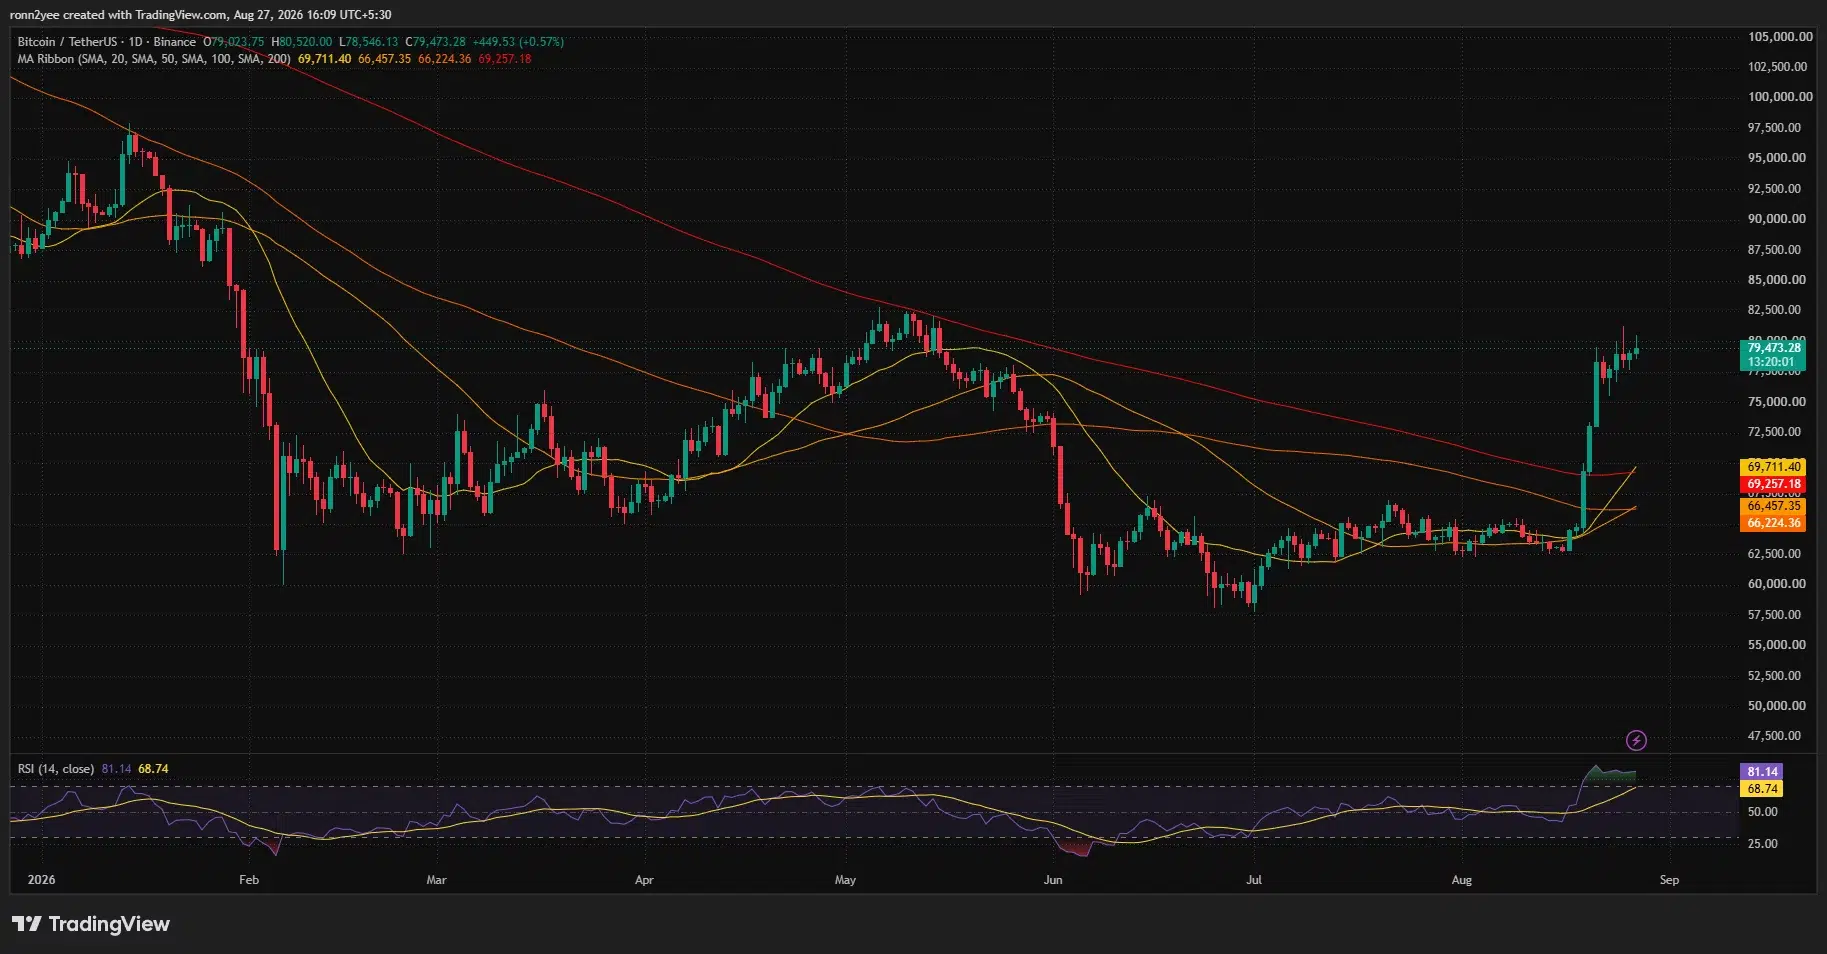
Trading above all four averages supports the broader recovery, but the moving averages have not yet produced a confirmed bullish golden cross. The 20-day average remains only slightly above the 200-day line, leaving traders to watch whether the separation expands or reverses.
The daily relative strength index reached 81.14, well above the conventional overbought threshold of 70. Such a reading shows strong buying momentum but also raises the possibility of profit-taking after the steep advance.
Treasury buybacks and ETF inflows supported Bitcoin
Bitcoin’s breakout followed an Aug. 19 announcement from the U.S. Treasury that it would at least double the maximum size of long-end liquidity-support buybacks.
The department said operations involving nominal securities in the 10-to-20-year and 20-to-30-year sectors would increase from a maximum of $2 billion to at least $4 billion per operation. The larger operations will begin on Sept. 9 and continue through Nov. 4. The Treasury described the change as support for liquidity in longer-dated government debt markets.
The announcement improved market expectations around Treasury-market liquidity, although it did not represent an immediate injection of funds because the expanded operations have not yet started. Bitcoin’s reaction also coincided with renewed demand through U.S. investment products and improving expectations for crypto legislation.
U.S.-listed spot Bitcoin exchange-traded funds attracted approximately $1.92 billion in the week through Aug. 21, according to SoSoValue data. BlackRock’s IBIT accounted for about $1.33 billion of those inflows.
The ETF group recorded its strongest week since October 2025, but the funds remained roughly $2.91 billion in net outflows for 2026. The combination suggests institutional demand returned sharply during the breakout without fully reversing the weakness seen earlier in the year.
Political expectations also contributed to sentiment after President Donald Trump renewed calls for Congress to advance crypto market-structure legislation. The proposed CLARITY Act remains subject to congressional action, meaning its effect on sentiment does not amount to final regulatory certainty.
Bitcoin momentum cools on the 4-hour chart
The 4-hour chart shows that Bitcoin’s trend remains bullish despite weakening momentum.
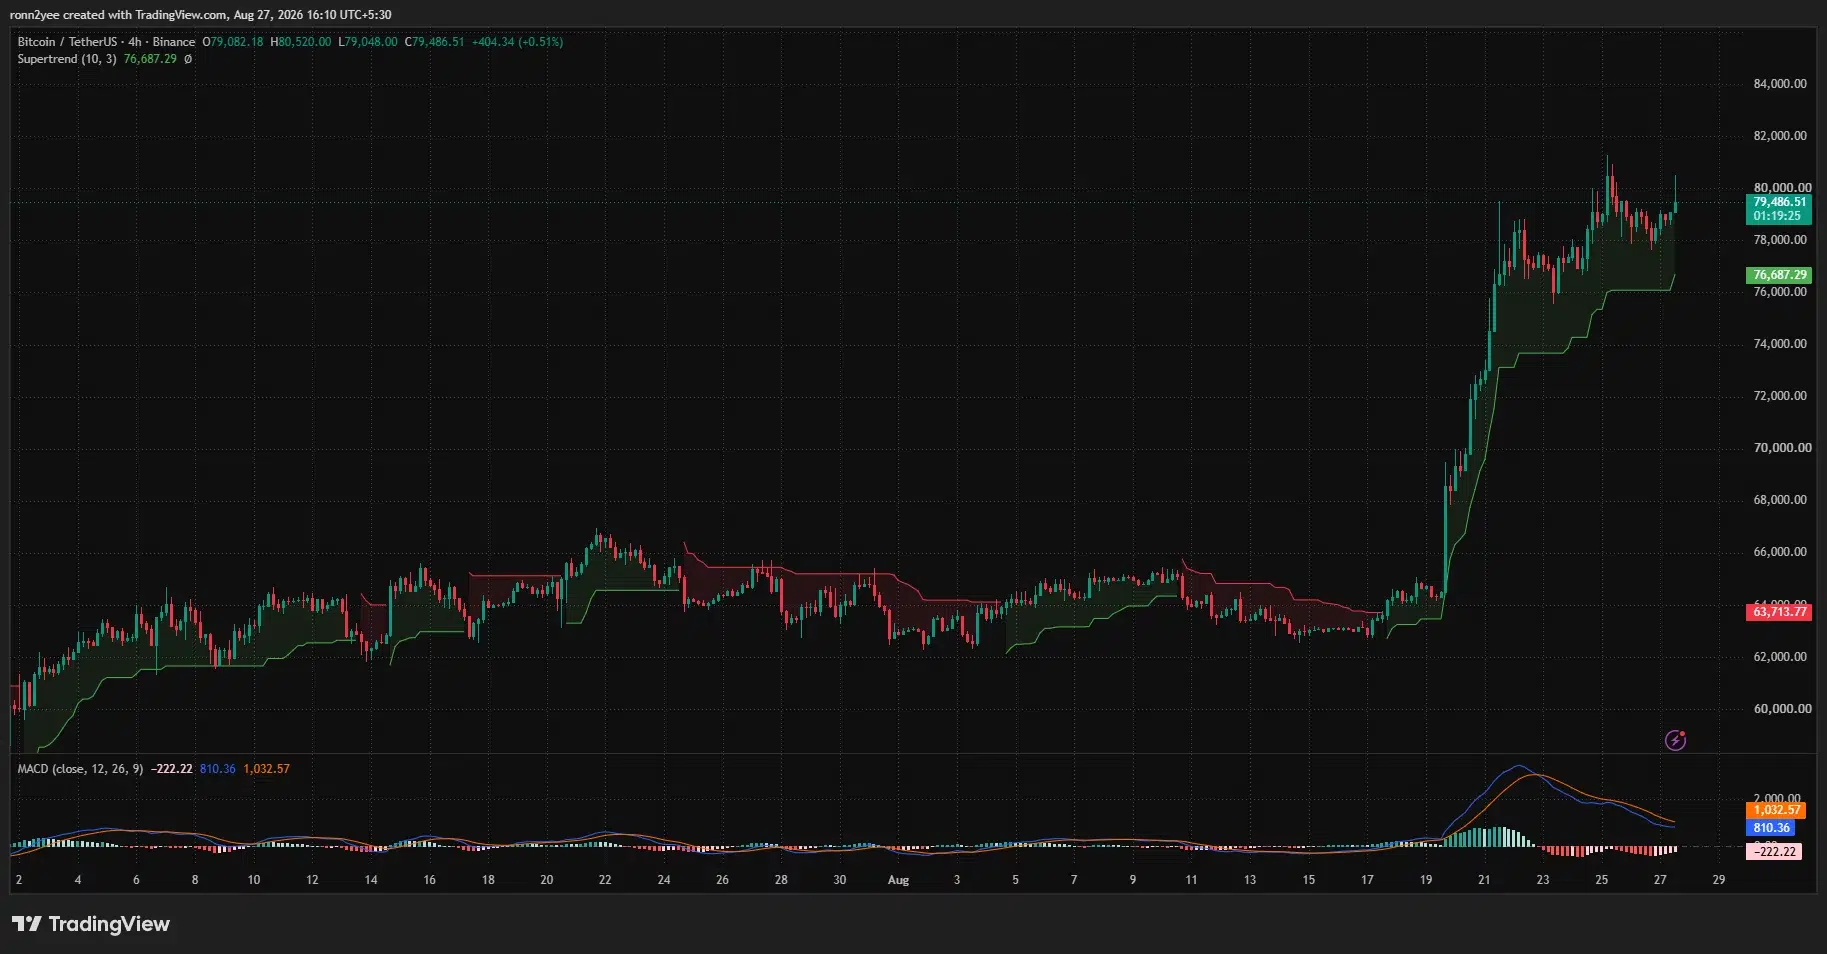
BTC was trading above the Supertrend indicator, which had moved up to $76,687. Holding above that level would preserve the sequence of higher lows established after the breakout.
The moving average convergence divergence indicator presented a more cautious picture. The MACD line stood near 810, below the signal line at approximately 1,033, while the histogram remained negative at minus 222.
The bearish MACD crossover suggests the rally has lost some short-term force since Bitcoin tested $81,000. However, the negative histogram bars were beginning to contract on the chart, indicating that downside momentum may also be easing.
Price action has formed a short consolidation between approximately $78,000 and $80,000. A close above $80,500 would allow buyers to challenge the recent high around $81,200, followed by the May peak near $82,800.
A weekly close above the 365-day moving average near $83,000 would provide a stronger long-term confirmation. Until then, Bitcoin remains below a resistance area that previously rejected price advances.
Liquidity concentrates around $81K and $77.5K
The one-week CoinGlass liquidation heatmap shows leveraged positions building on both sides of Bitcoin’s current price.
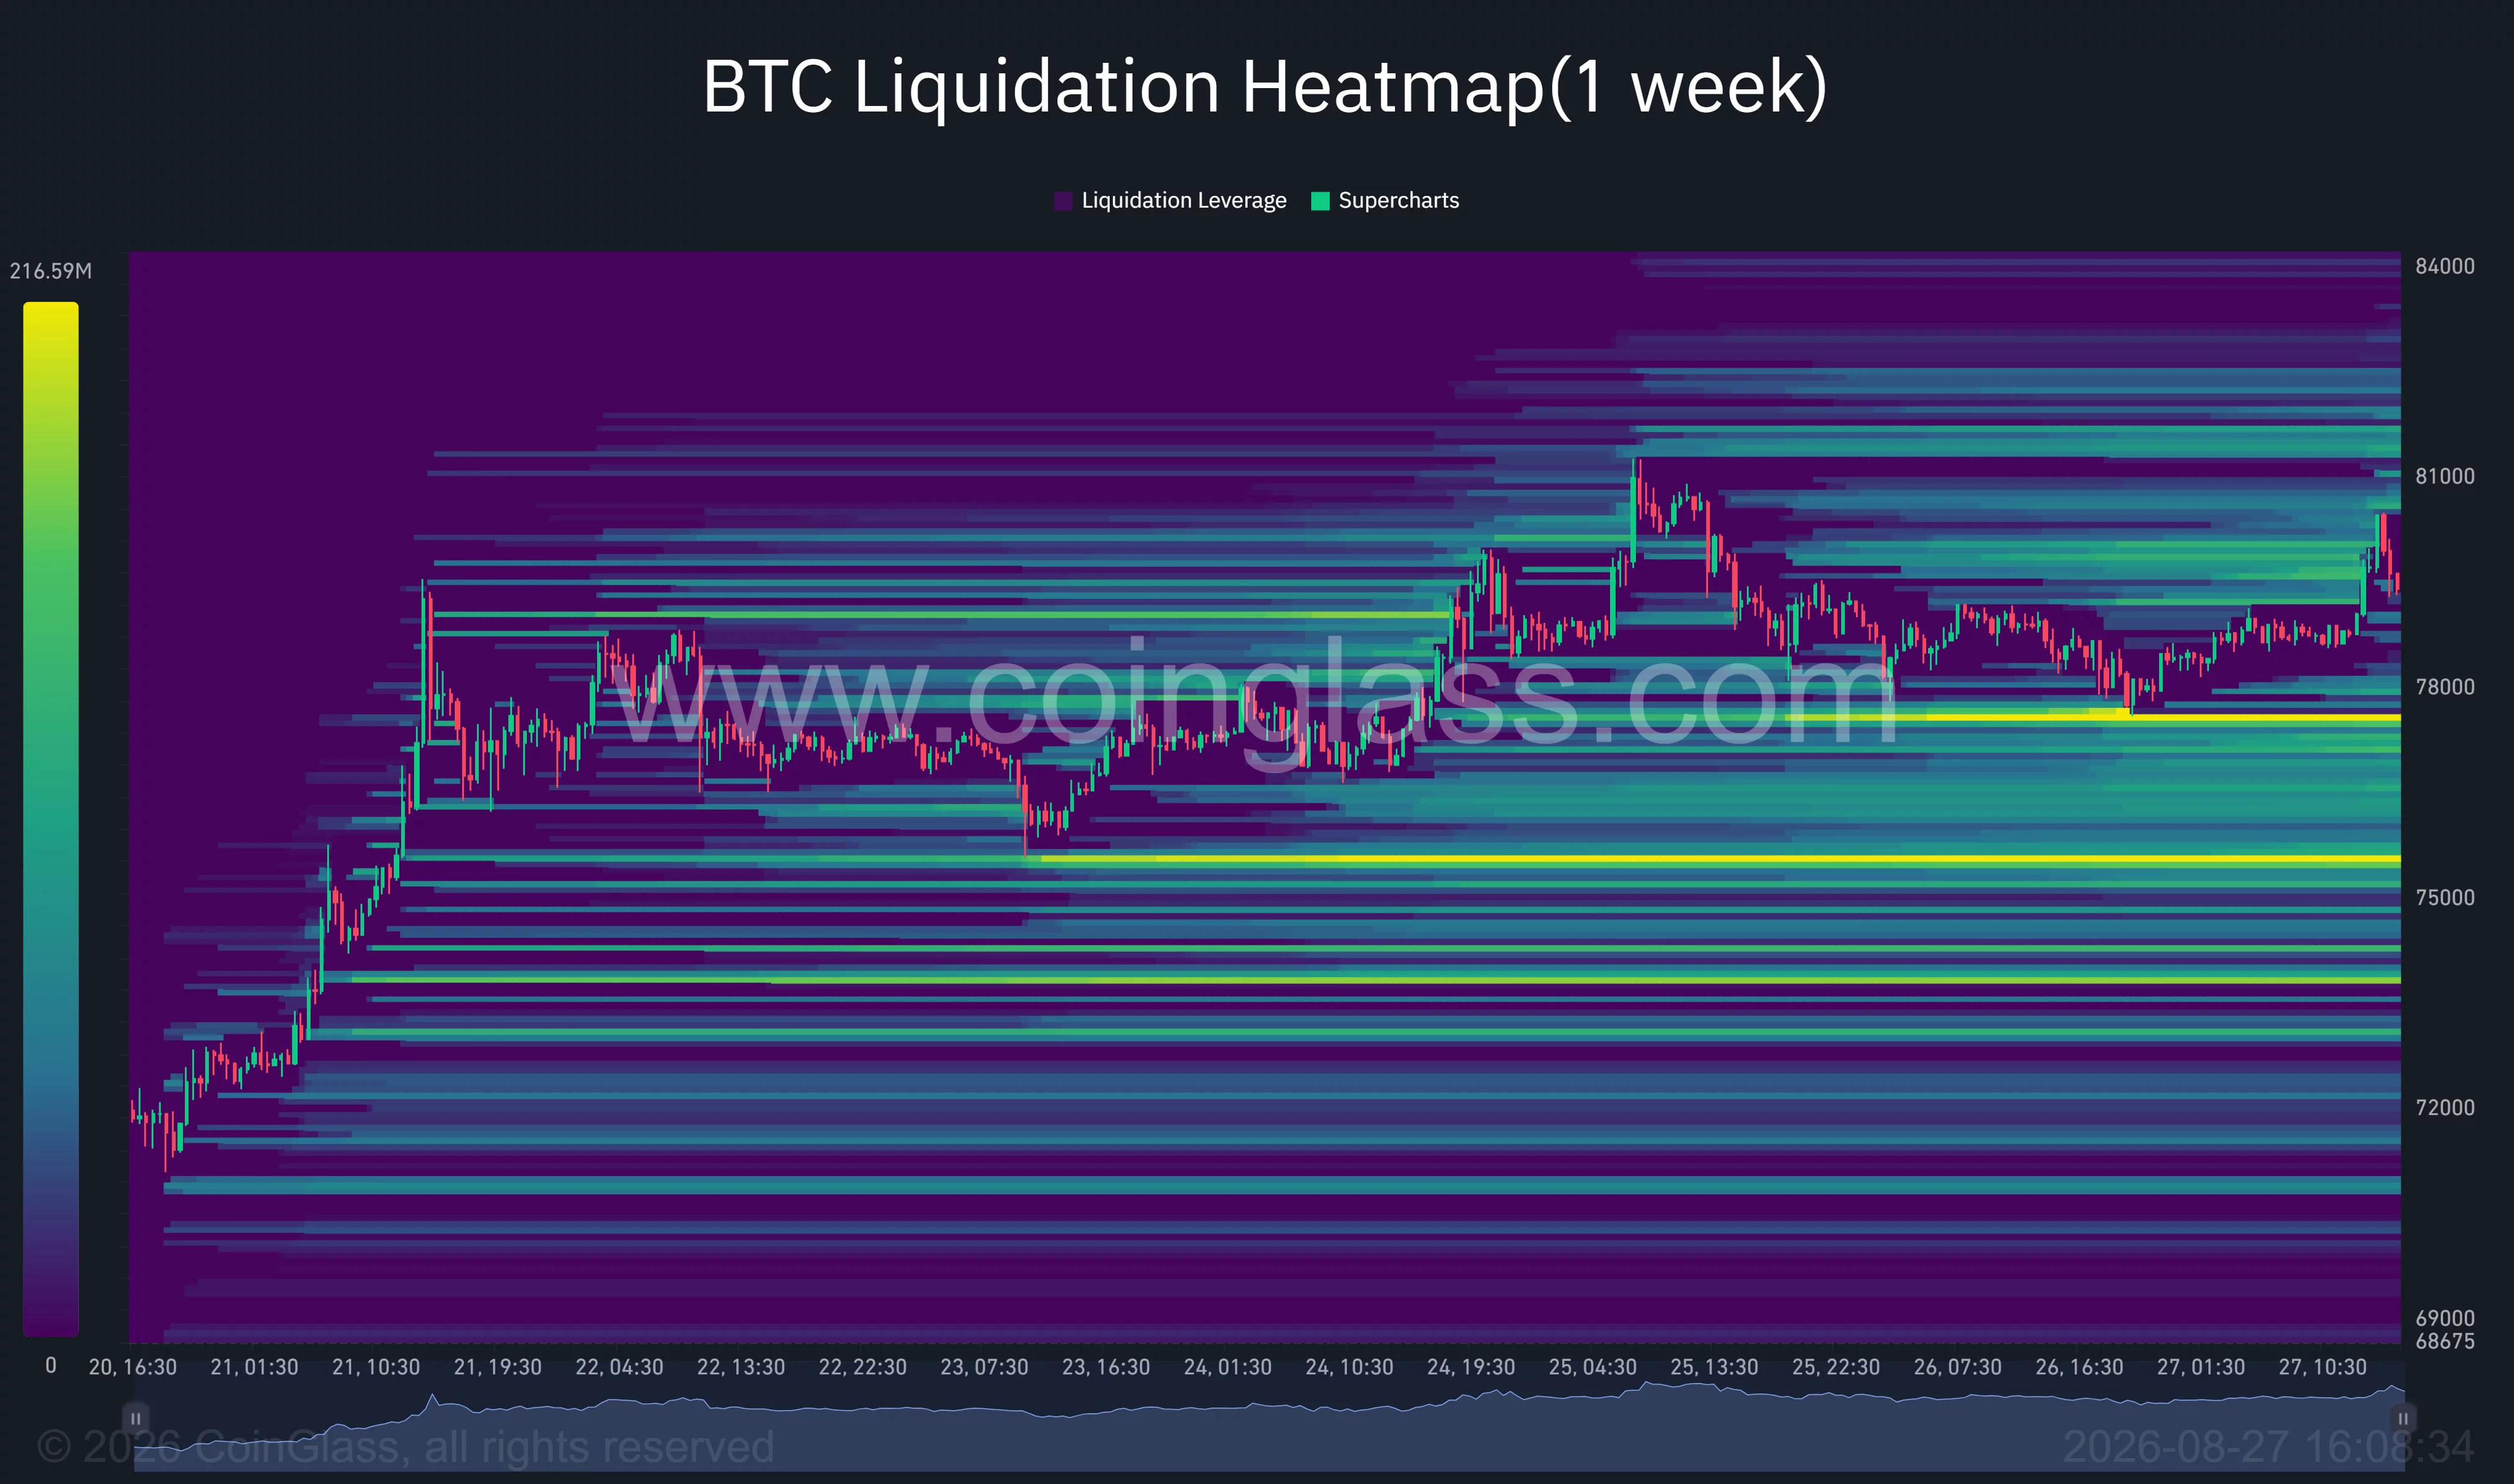
The nearest major concentration above the market sits around $80,000–$81,000. A clean break through that zone could force short sellers to close positions, potentially adding momentum toward liquidity near $81,500 and $84,000.
The strongest nearby downside cluster appears around $77,300–$77,700. Further liquidity is visible close to $75,500, making the two areas possible targets if Bitcoin loses its current range.
On-chain analyst Einstein BTC identified $75,900 as the newest short-term holder cost basis. According to the analyst, Bitcoin was trading only about 3.4% above that level, making it an important dividing line for the short-term structure.
The chart provides nearer support at $76,687 through the 4-hour Supertrend. A fall below that indicator would increase the probability of a move toward the $75,900 cost basis and the heatmap’s $75,500 liquidity cluster.
Another market commentator, Crypto with Haris, argued that repeated rejection below $82,000 could expose $74,000 and eventually $67,000. The forecast represents a bearish scenario rather than a confirmed outcome, with Bitcoin still holding above its immediate technical supports.
Bitcoin faces an overbought test near $80K
Bitcoin’s next move depends on whether buyers can absorb selling near $80,000 while defending the $77,500–$76,700 support area.
A daily close above $81,200 would weaken the immediate bearish case and open a path toward $82,800 and the 365-day average near $83,000. Liquidations above the market could accelerate such a move.
Failure to clear resistance, combined with an RSI above 80 and a bearish 4-hour MACD crossover, would leave Bitcoin vulnerable to a cooling period. The first test would sit near $77,500, followed by the Supertrend at $76,687 and the short-term holder cost basis around $75,900.
The larger trend remains constructive while BTC trades above its major daily moving averages. However, the overbought RSI and concentrated leverage on both sides of the market suggest the next breakout could produce another sharp move rather than a gradual change in direction.
Disclosure: This article does not represent investment advice. The content and materials featured on this page are for educational purposes only.
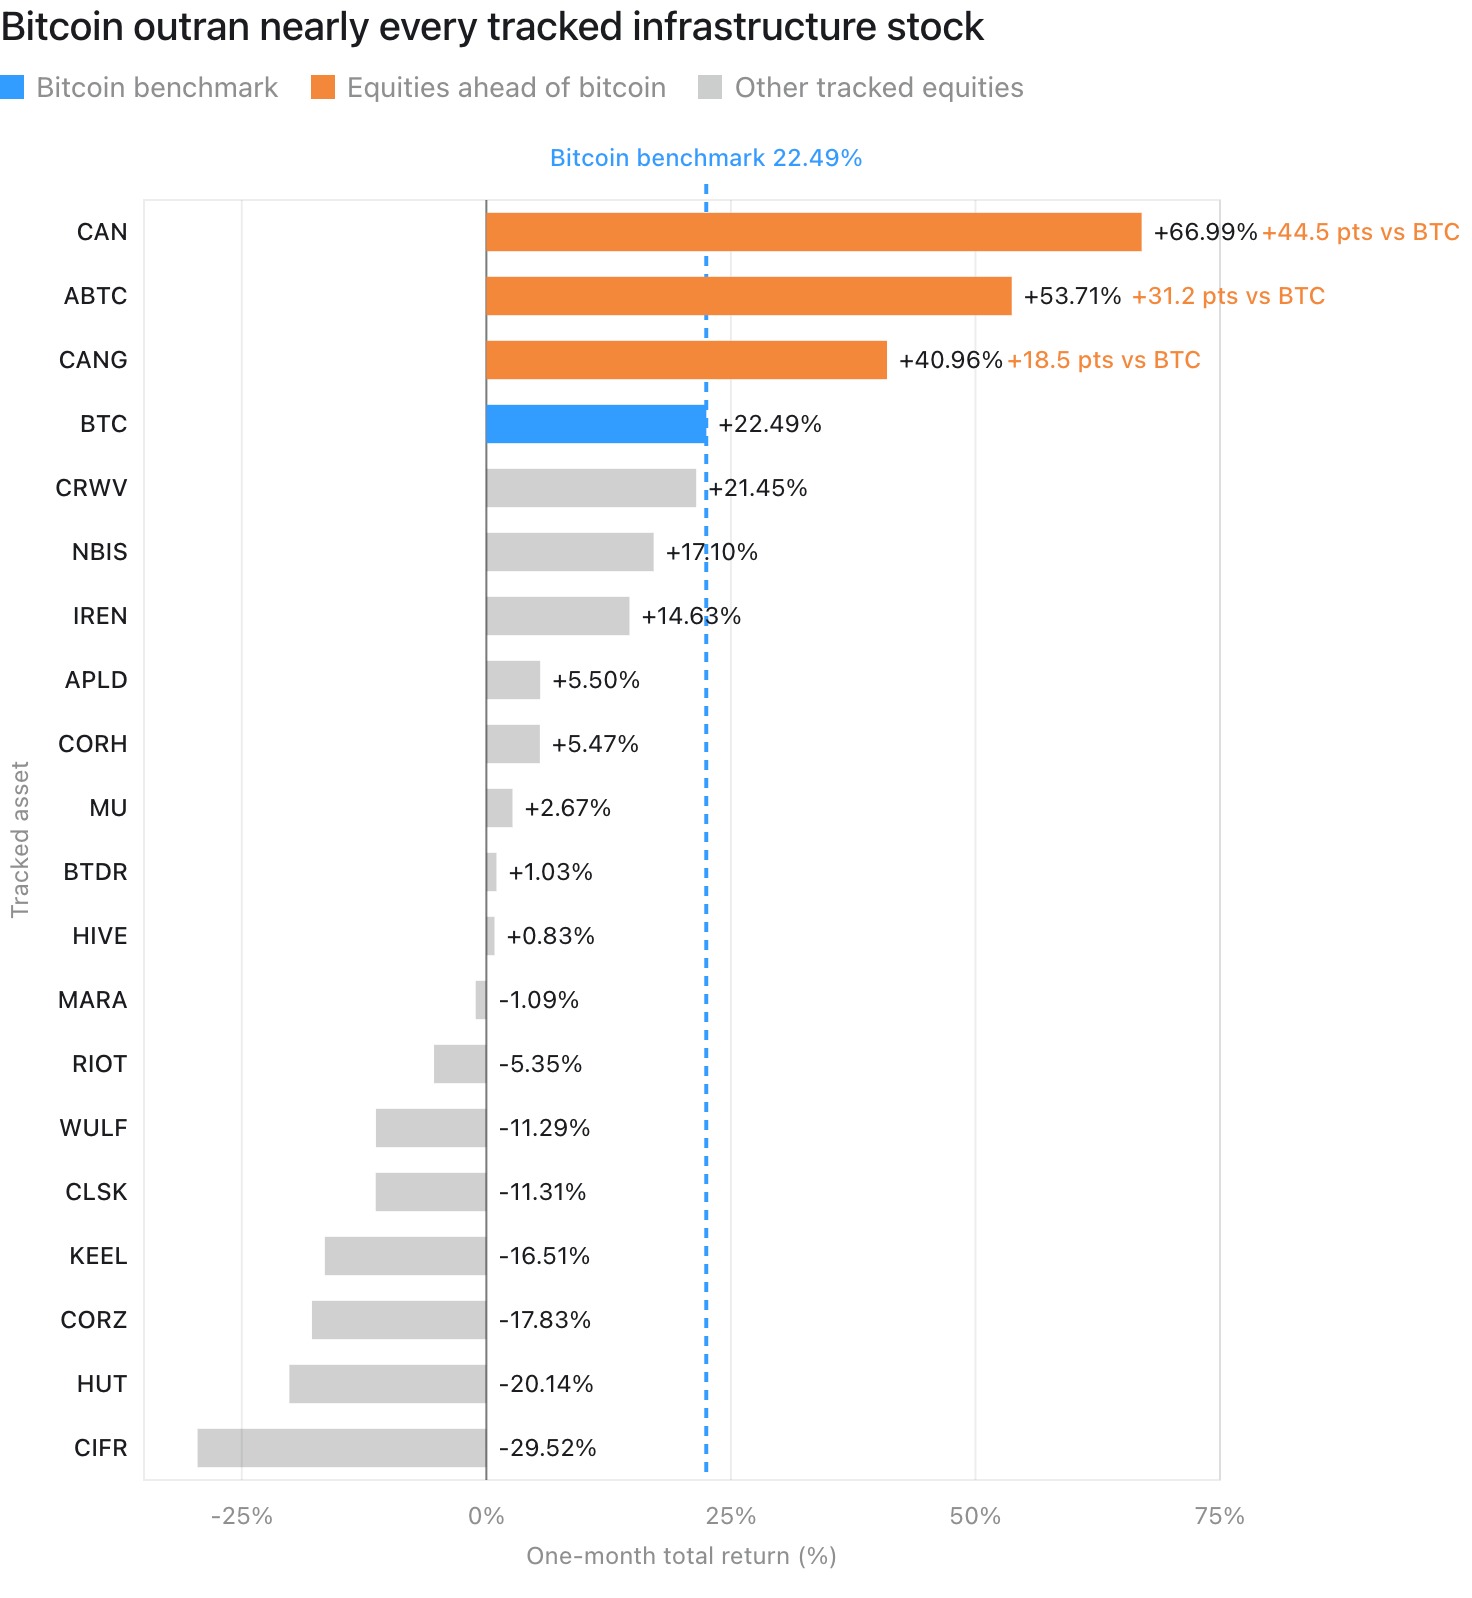
Bitcoin’s August rally has revived some of the mining sector’s most beaten-down stocks, reversing a trend that has favored miners pivoting toward artificial intelligence and high-performance computing and suggesting investors may once again be rewarding direct exposure to Bitcoin.
In its latest Miner Weekly newsletter, BlocksBridge Consulting reported that Bitcoin’s (BTC) roughly 23% rally over the past week outpaced most AI-linked infrastructure stocks.
Three beaten-down Bitcoin mining companies — Canaan, American Bitcoin and Cango — gained between 41% and 67%. By comparison, CoreWeave rose about 21%, Nebius gained 17% and IREN advanced 15%, while some miners with heavier exposure to AI and HPC were flat or declined.
Blocksbridge pointed to three catalysts behind Bitcoin’s rally. The first was the US Treasury Department’s Aug. 19 announcement that it would at least double the size of its liquidity-support buybacks for longer-dated Treasury securities.
The second was renewed regulatory optimism following a White House meeting with crypto executives, where US President Donald Trump urged Congress to pass a “fair version” of the CLARITY Act, a stalled crypto market structure bill.
The third was a sharp short squeeze following Bitcoin’s breakout, with more than $1.6 billion in crypto positions liquidated over 24 hours.
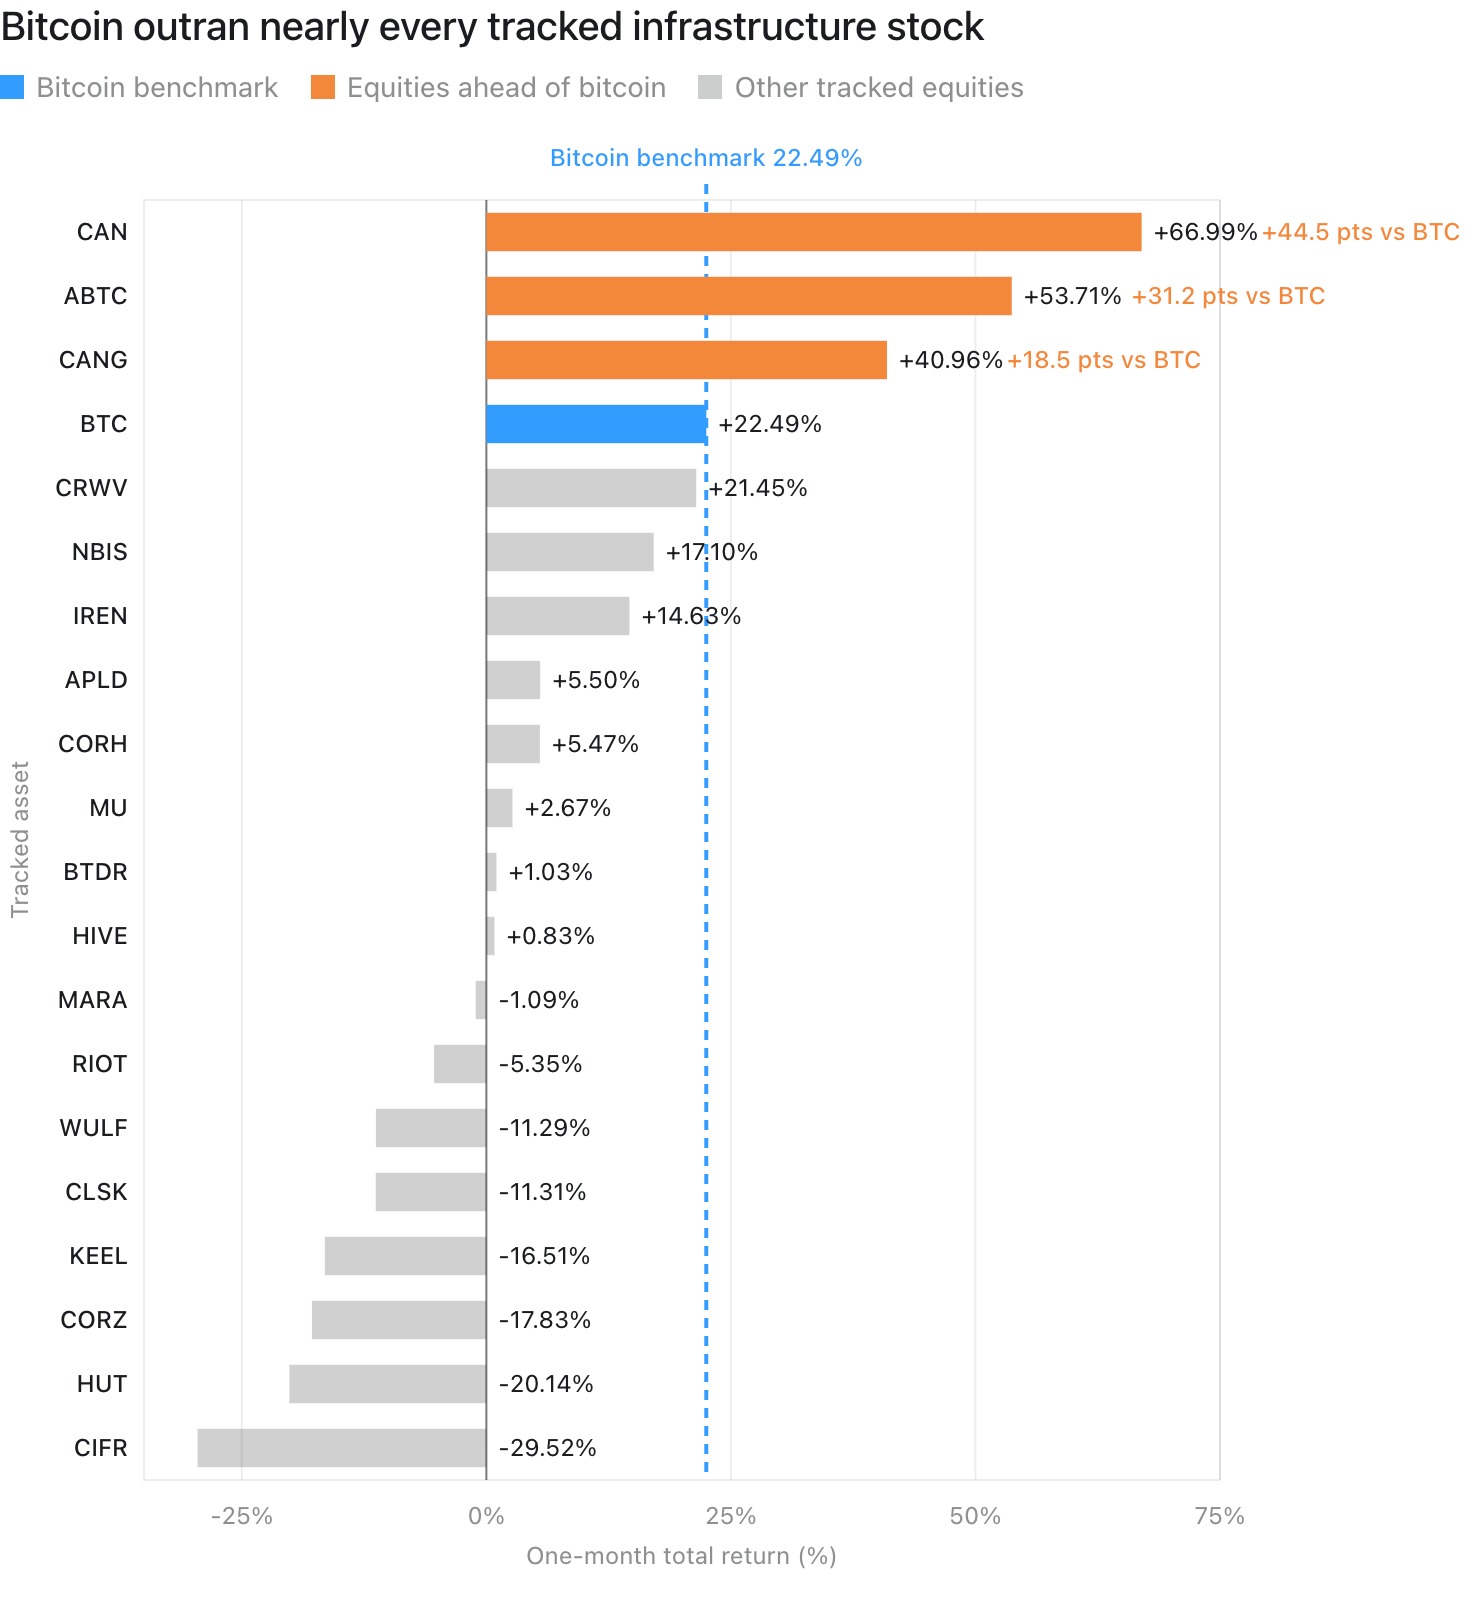
Bitcoin mining-focused stocks outperformed companies that pivoted toward AI and HPC. Source: Miner Weekly
Related: Strategy’s $66B Bitcoin machine hinges on capital markets, not BTC price: Report
BTC price still drives miners despite AI pivot
BlocksBridge’s findings echoed earlier Cointelegraph reporting that Bitcoin’s rally had lifted crypto-related stocks, including Bitcoin miners. The gains underscore how strongly Bitcoin’s price can still influence mining stocks, even as many miners have increasingly shifted their focus toward AI and HPC infrastructure in recent years.
Separate recent BlocksBridge analysis found that publicly traded Bitcoin miners have invested roughly $15 in AI data centers for every $1 in AI-related revenue generated. Nine public miners generated $341.2 million in AI and HPC revenue so far in 2026, compared with $5.11 billion in capital expenditures on the technology.
Related: Bitcoin breaks above 200-day moving average for first time since November


Disclosure: This article does not represent investment advice. The content and materials featured on this page are for educational purposes only.
FTmining offers cloud mining services aimed at users seeking crypto mining access without costly hardware, energy bills, or maintenance.
Ever been fascinated by cryptocurrency mining, only to be deterred by the high cost of hardware, staggering electricity bills, and complex technical maintenance?
Ever dreamt of having a “passive income” stream that keeps money flowing into an account even while sleeping, going on vacation, or focus on a day job?
Now, this is no longer just a dream! With its game-changing model, the FTmining cloud mining platform is taking the cryptocurrency world by storm, enabling ordinary people to easily join the crypto gold rush and achieve astonishing daily earnings of up to $6,666!
What is cloud mining? Say goodbye to all the hassles of mining!
Simply put, cloud mining is like renting a portion of the computing power from a professional mining facility located elsewhere. Users don’t need to buy expensive mining hardware, put up with fan noise and heat dissipation issues, or worry about skyrocketing electricity bills.
- No need to buy mining hardware: Save thousands, or even tens of thousands, of dollars in initial investment.
- No equipment maintenance: A professional technical team ensures high-efficiency operation 24/7.
- No electricity bills: All operating costs are included in the hash rate contract.
- No technical expertise required: Purchase hash rate with a single click and reap the rewards, a truly barrier-free experience.
Why choose FTmining?
Industry-leading hash rate returns: By partnering directly with top-tier global mining facilities, FTmining ensures users receive the most efficient and stable mining yields. Our intelligent algorithms automatically select the most profitable coins to mine, ensuring users get maximum value from every unit of computing power.
Ultimate Transparency and Security: All mining data and earnings are clearly recorded on the blockchain and publicly verifiable, ensuring complete transparency. Funds and personal information are safeguarded by bank-grade encryption technology.
Flexible Investment Options: Whether someone is a newcomer looking to dip their toes in or a seasoned investor seeking large-scale asset allocation, FTmining offers a range of hashing power contracts, from entry-level to premium, to meet everyone’s specific needs.
Novice Contract: $15 investment, $0.75 daily return
Basic Hashrate Contract: $800 investment, $10.56 daily return
Stable Hashrate Contract: $8,000 investment, $144 daily return
Super Hashrate Contract: $140,000 investment, $2,800 daily return
Click here to view more contract details on the official website.
Stable daily returns with instant withdrawals: Mining earnings are automatically calculated and credited to a user’s platform account every day. Withdrawals are supported for various mainstream cryptocurrencies; the process is quick and simple, ensuring excellent liquidity for funds.
Start the wealth-building journey in just three simple steps
- Register an account: Visit the official FTmining website and sign up quickly using an email. Receive a $15 bonus.
- Select and purchase a hashrate contract: Choose the cloud mining package that best fits a particular budget and goals.
- Enjoy daily returns: Once purchased, users can immediately start viewing and withdrawing their mining profits from their personal account!
Opportunities wait for no one! The cryptocurrency market is on the verge of a new bull run; now is the perfect time to invest in cloud mining and seize the chance to build wealth.
Click to register with FTmining and start the journey toward earning $6,666 in passive income every day!
For more information, visit the official website, and download the mobile app.
Disclosure: This content is provided by a third party. Neither crypto.news nor the author of this article endorses any product mentioned on this page. Users should conduct their own research before taking any action related to the company.


Crypto World
Trump ratchets up rhetoric against Beijing as U.S.-China officials meet for Xi’s Washington visit
Chinese and U.S. flags flutter near The Bund, before U.S. trade delegation meet their Chinese counterparts for talks in Shanghai, China July 30, 2019.
Aly Song | Reuters
BEIJING — As the U.S. ramped up pressure this week on China with secondary Iran sanctions, the world’s two largest economies have still managed to stay focused on ways to cooperate.
It’s a sign of the balancing act on both sides, even as White House rhetoric has remained tough.
U.S. President Donald Trump signaled to reporters Thursday local time he could be sanctioning Chinese banks. “I don’t have to announce everything,” he said, according to a Fox News stream of the event.
Those comments followed a meeting between U.S. and Chinese officials in Beijing on Wednesday, according to official announcements.
U.S. Ambassador to China David Perdue said in a social media post that he met with China’s Foreign Minister Wang Yi and three other Chinese officials to discuss President Xi Jinping’s upcoming state visit to Washington.
China’s readout also noted Perdue’s comment on “preparing well for the next stage of important high-level interactions,” according to a CNBC translation of Chinese.
Trump on Thursday even mentioned Xi was coming in a few weeks.

U.S. Treasury Secretary Scott Bessent on Monday had warned that if Chinese banks “are part of the ecosystem that turns Iranian oil into money, into repression, they will be targeted.” It was part of Trump’s “economic D-Day” announcements against Iran.
Other than Bessent’s comments, there few details on specific actions, said Jodie Wen, postdoctoral fellow at the Center for International Security and Strategy (CISS), Tsinghua University. It’s more of a warning, she said.
Wen added that the Trump-Xi summit in May marked a shift toward controlled competition, rather than the Biden administration’s “strategic adversary” view on China.
Moderate response
China’s official response to U.S. secondary Iran sanctions has also been muted so far.
Beijing responded by saying it would “take all necessary measures” to protect itself, but did not elaborate on possible actions. When asked about communication with the U.S. on Iran, a foreign ministry spokesperson said there was no information to share.
However, the spokesperson said the two countries were in talks about a Trump-Xi meeting.
Beijing will “note the lack of groundwork that was laid ahead of Bessent’s ‘D-Day’ announcement. And they will conclude that this is largely performative,” Ryan Hass, director of the China center and Chair in Taiwan studies at Brookings, said in a social media post. Hass advised the Obama administration as director for China, Taiwan and Mongolia for the National Security Council.
“Sec. Bessent already basically gave away the game when he responded to a question by asking, ‘Why would I want to blow up the global financial system?’ Beijing will interpret this as signaling that the US is not going to go after major Chinese financial institutions,” Hass said.
He expects the U.S.-China trade truce to remain intact because the “alternative is worse for both sides.”
Beijing can also comply with U.S. sanctions and its own interests at the same time.
The Asian country has built a legal mechanism that essentially tells Chinese companies their foreign bankers must comply with U.S. rules, but inside China, Beijing’s law takes precedence, said Han Shen Lin, China managing director for The Asia Group and a former executive at Wells Fargo Bank in China.
— CNBC’s Anniek Bao contributed to this report.


US financial services giant Charles Schwab plans to add Solana (SOL), Avalanche (AVAX) and Chainlink (LINK) to its crypto trading platform in the coming months, expanding its direct cryptocurrency offering beyond Bitcoin (BTC) and Ether (ETH).
Schwab Crypto began rolling out to retail clients in May, initially offering direct Bitcoin and Ether trading alongside traditional investments through Schwab’s website, mobile app and thinkorswim platform.
The brokerage said it planned to add more cryptocurrencies and digital assets over time, though it did not specify which assets it is considering or provide a timeline beyond the three newly announced tokens.
Schwab charges 75 basis points, or 0.75%, on the dollar value of each crypto trade. The service is available in all US states except New York and Louisiana and is not offered in US territories or internationally.
The Schwab Crypto accounts are offered through Charles Schwab Premier Bank, with affiliated brokerage Charles Schwab & Co. performing certain operational functions on the bank’s behalf.
Related: Morgan Stanley takes on crypto trading rivals with E*Trade pilot
Schwab expands into prediction markets
Schwab’s crypto expansion comes as the financial services firm moves into other new trading products. In June, The Wall Street Journal reported that Schwab plans to offer prediction contracts tied to the S&P 500 index through a partnership with Cboe Global Markets.
The contracts would allow clients to wager on whether the S&P 500 will close above or below a specified level, with the product reportedly expected to launch within months. Unlike platforms such as Kalshi and Polymarket, Schwab’s planned offering would initially be limited to index outcomes.
As of July 31, Schwab held $13.04 trillion in client assets across 39.9 million active brokerage accounts, according to the company. Schwab reported record second-quarter net revenue of $7.1 billion and net income of $2.8 billion.
Magazine: SHRINCS BIP published: Quantum-secure Bitcoin comes with a catch
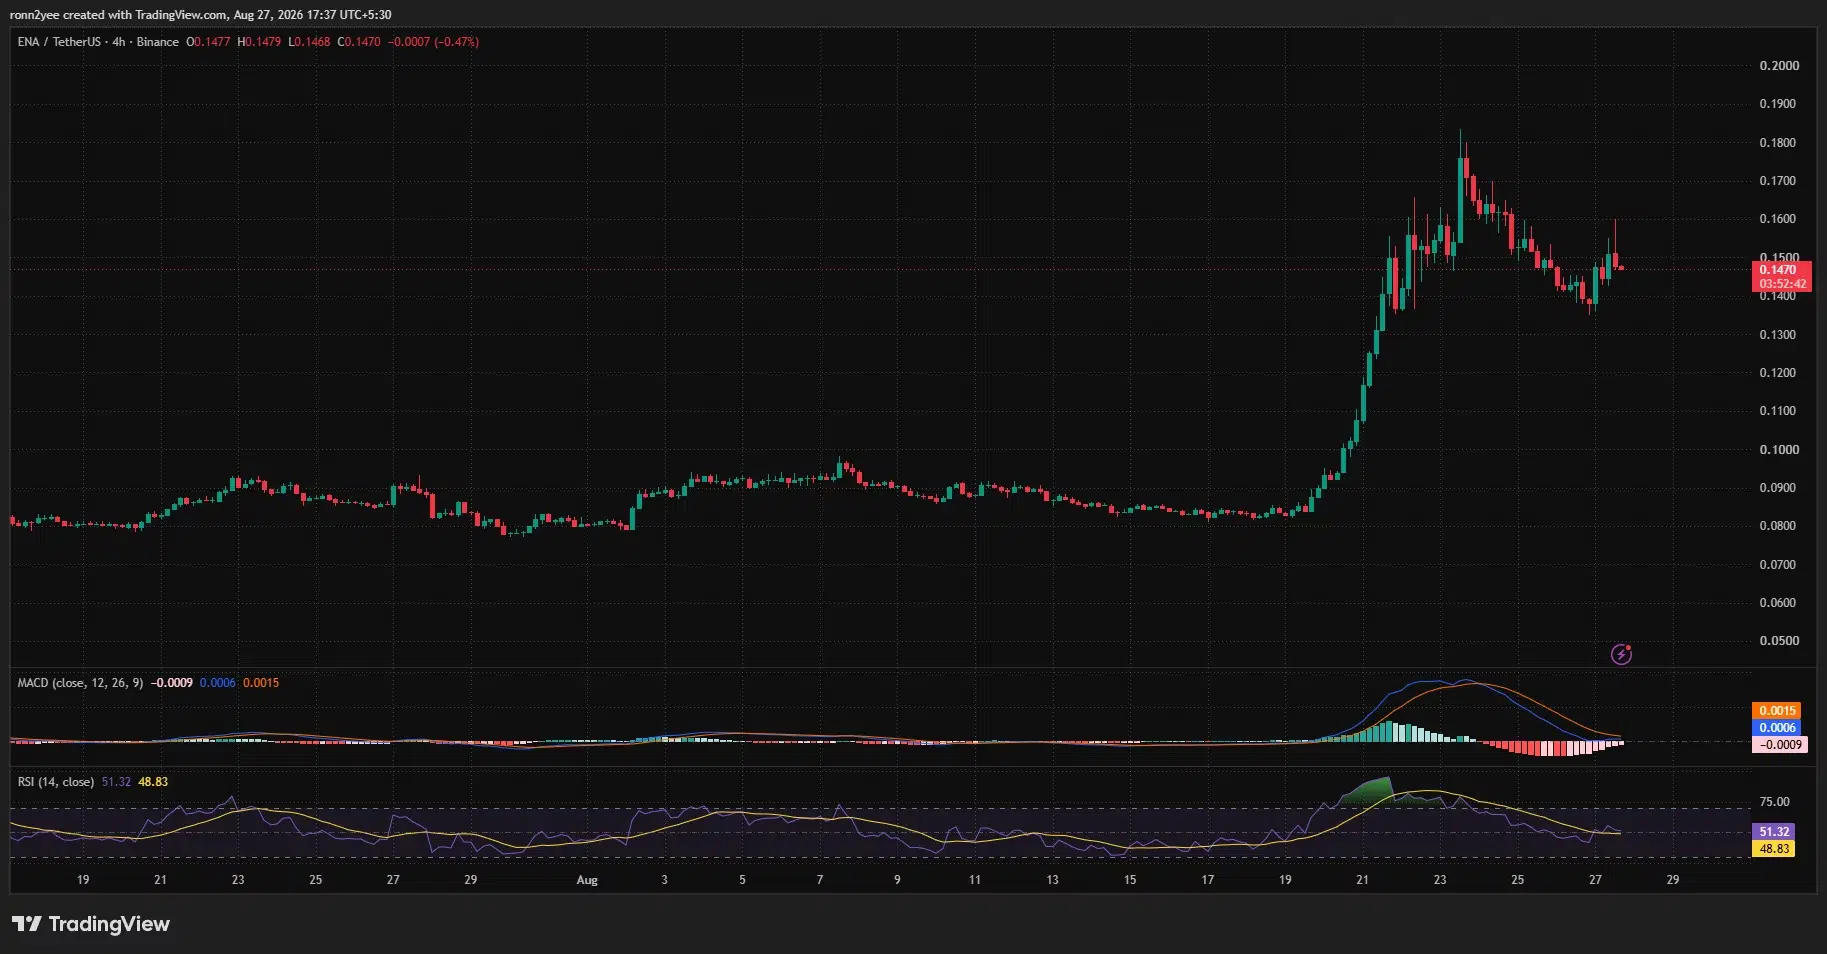
Ethena’s ENA traded near $0.147 on Aug. 27, retaining a weekly gain of about 25% after its sharp breakout met resistance near $0.180.
Summary
- ENA price remains about 25% above its Aug. 21 opening price of $0.11717.
- Price has corrected about 18% from the Aug. 23 weekly high of $0.18023.
- The daily Supertrend remains bullish, with dynamic support near $0.1202.
- Liquidation clusters around $0.150 and $0.161 could shape ENA’s next move.
ENA price retreats after reaching $0.180
Ethena (ENA) price was trading near $0.147 at the time of writing, up about 25% from its Aug. 21 opening price of $0.11717. The token reached an intraday high of $0.18023 on Aug. 23 before sellers took control.
The move from the weekly opening level to the peak amounted to nearly 54%. ENA has since fallen about 18% from that high, showing that traders took profits after the fast advance.
The daily chart shows that buyers attempted another recovery on Aug. 27. ENA reached $0.160 during the session but failed to hold the move, returning to the $0.147 area. Its daily range extended from $0.1424 to $0.160, reflecting continued volatility after the initial breakout.
ENA nevertheless remains well above the range that contained its price through most of July and early August. The token traded mainly between $0.075 and $0.095 before breaking higher around Aug. 20.
That advance lifted ENA through the $0.10 and $0.12 levels in quick succession. Price then accelerated toward $0.18 before entering its current pullback.
FalconX lending facility supports Ethena rally
The main catalyst behind ENA’s weekly advance was Ethena’s reported partnership with FalconX to establish a $1 billion secured warehouse lending facility.
Under the arrangement, reserve assets backing Ethena’s USDe synthetic dollar can be used in overcollateralized loans to institutional borrowers. The facility could broaden how Ethena deploys its reserves and create another source of revenue for the protocol.
Trading activity rose sharply following the announcement. ENA’s daily trading volume reportedly climbed above $1.04 billion, representing an increase of about 319% as traders responded to the institutional lending development.
The rebound occurred even as conditions became less supportive for altcoins. Bitcoin dominance rose to about 59.8%, while the Altcoin Season Index dropped from 51 to 33, pointing to a broader rotation toward Bitcoin and other large-cap assets.
ENA’s correction from $0.180 also followed an unusually steep advance. Its relative strength index reportedly reached 88 during the initial rally, placing the token deep in overbought territory and raising the probability of profit-taking.
Token concentration adds another risk. The 100 largest ENA wallets reportedly control roughly 90% of the circulating supply, meaning decisions by a relatively small group of holders may have an outsized effect on short-term price action.
ENA technicals show momentum stabilizing
The 4-hour chart suggests that ENA’s pullback is losing some force, although bullish momentum has not fully returned.
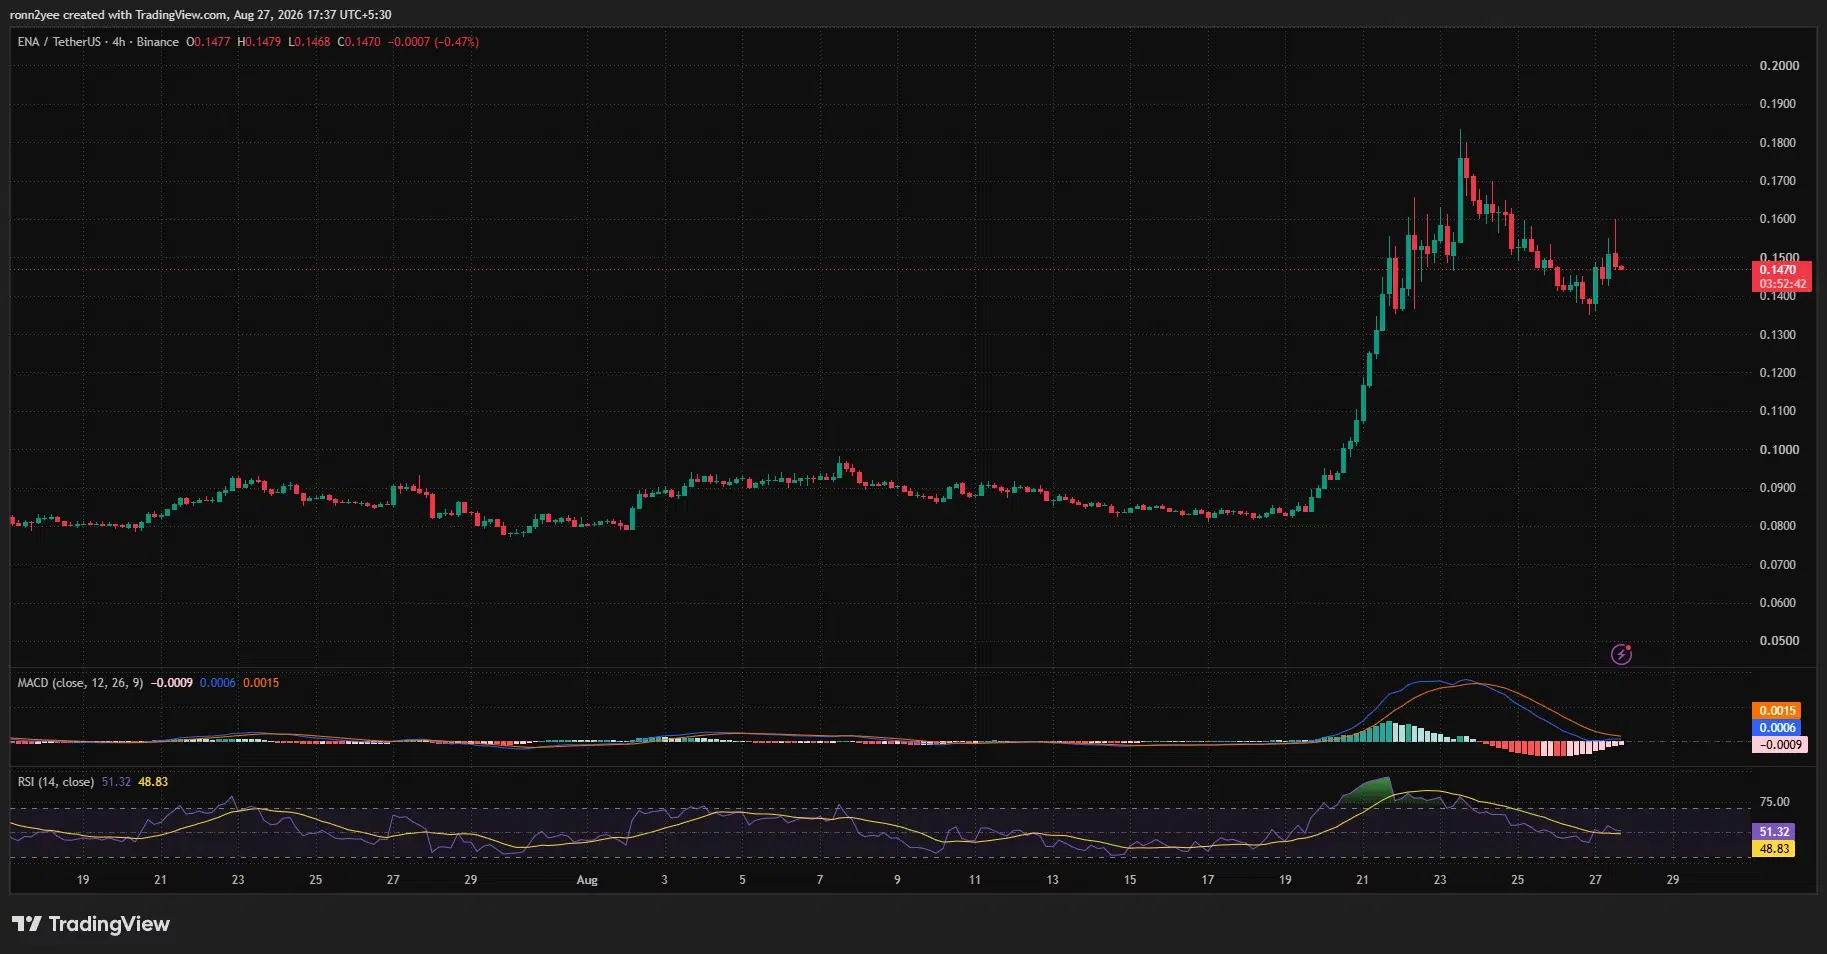
The 4-hour relative strength index stood at 51.32, slightly above its signal average of 48.83. A reading near 50 indicates balanced momentum rather than overbought or oversold conditions.
ENA’s moving average convergence divergence remained bearish. The MACD line was at 0.0006, below the signal line at 0.0015, while the histogram registered minus 0.0009.
However, the red histogram bars have become smaller. The contraction indicates that bearish momentum is weakening, even though the MACD has not yet completed a bullish crossover.
Price has also started to form a possible short-term base between $0.140 and $0.147. Buyers defended the area after the token briefly approached $0.138, but repeated failures around $0.150 show that sellers remain active above the current price.
On the daily chart, ENA remains above its Supertrend support at approximately $0.1202. The indicator shifted bullish during the breakout and will continue to support the broader recovery thesis while price stays above that level.
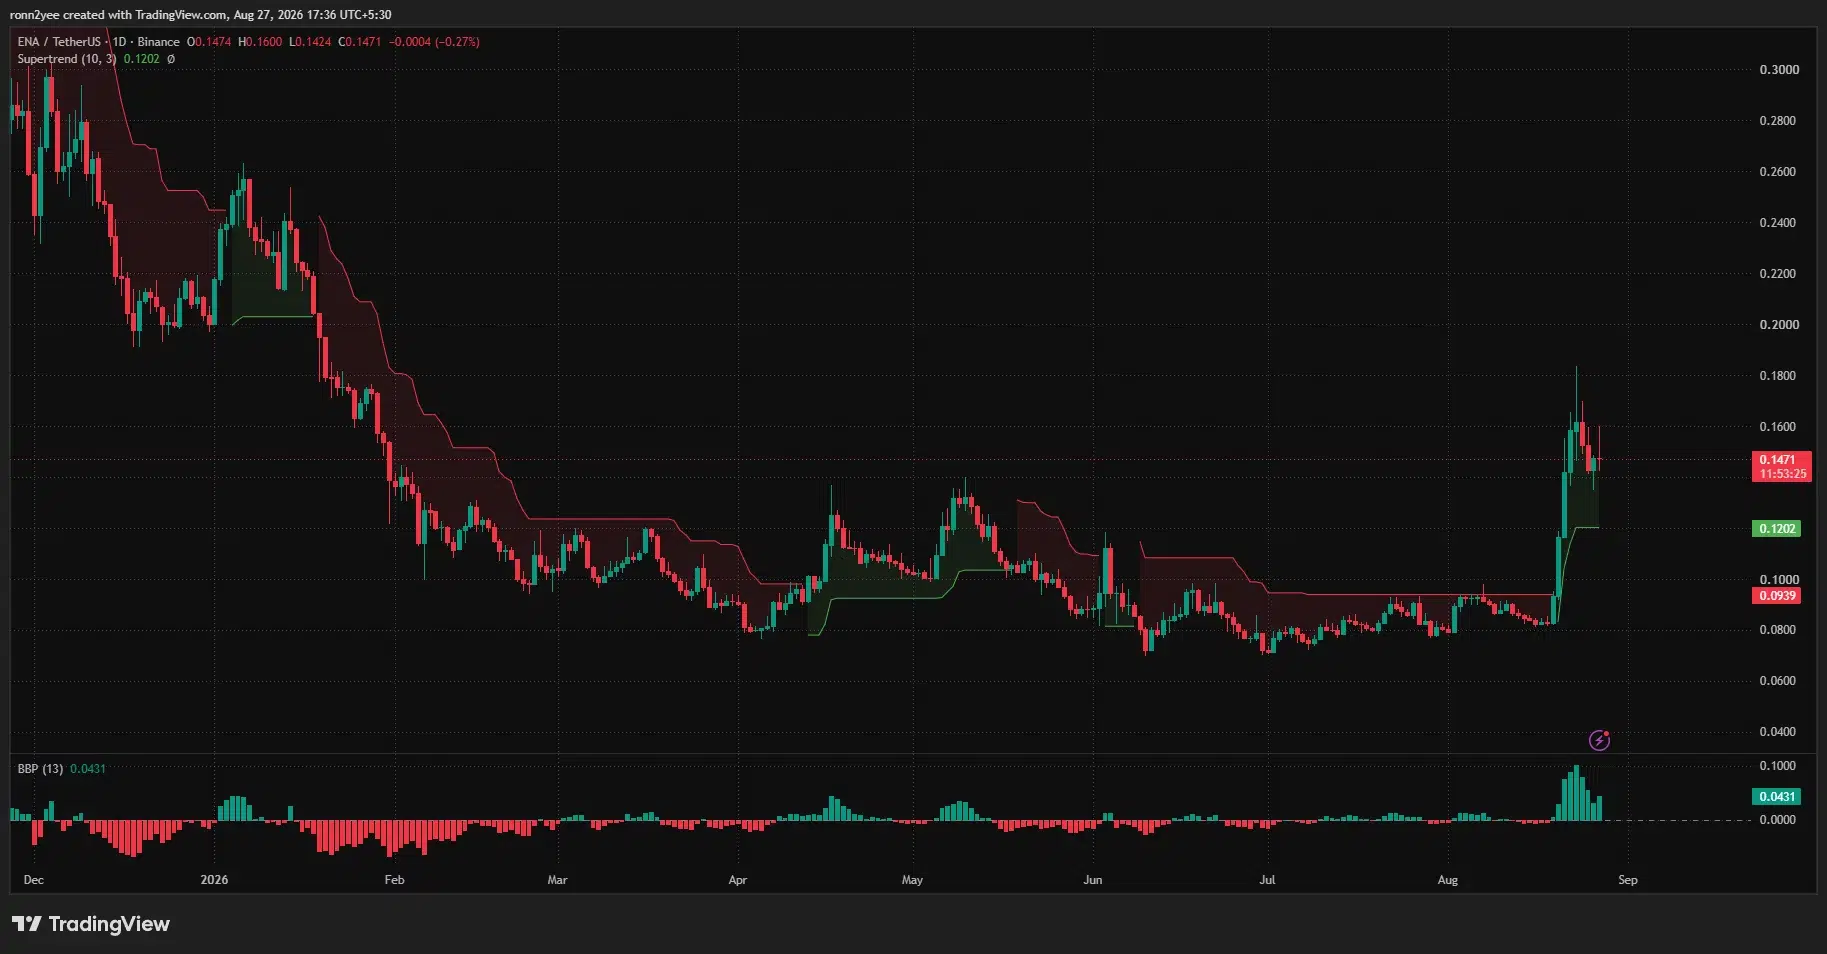
The Bull Bear Power indicator remained positive at 0.0431. Its bars have declined from their recent peak, however, showing that buyers retain the broader advantage but have lost some of the strength seen during the initial surge.
Liquidation map puts $0.150 in focus
CoinGlass’ three-day liquidation heatmap shows a nearby concentration of leveraged positions around $0.150. ENA was trading just below that level at the end of the chart, making it the first area likely to influence short-term direction.
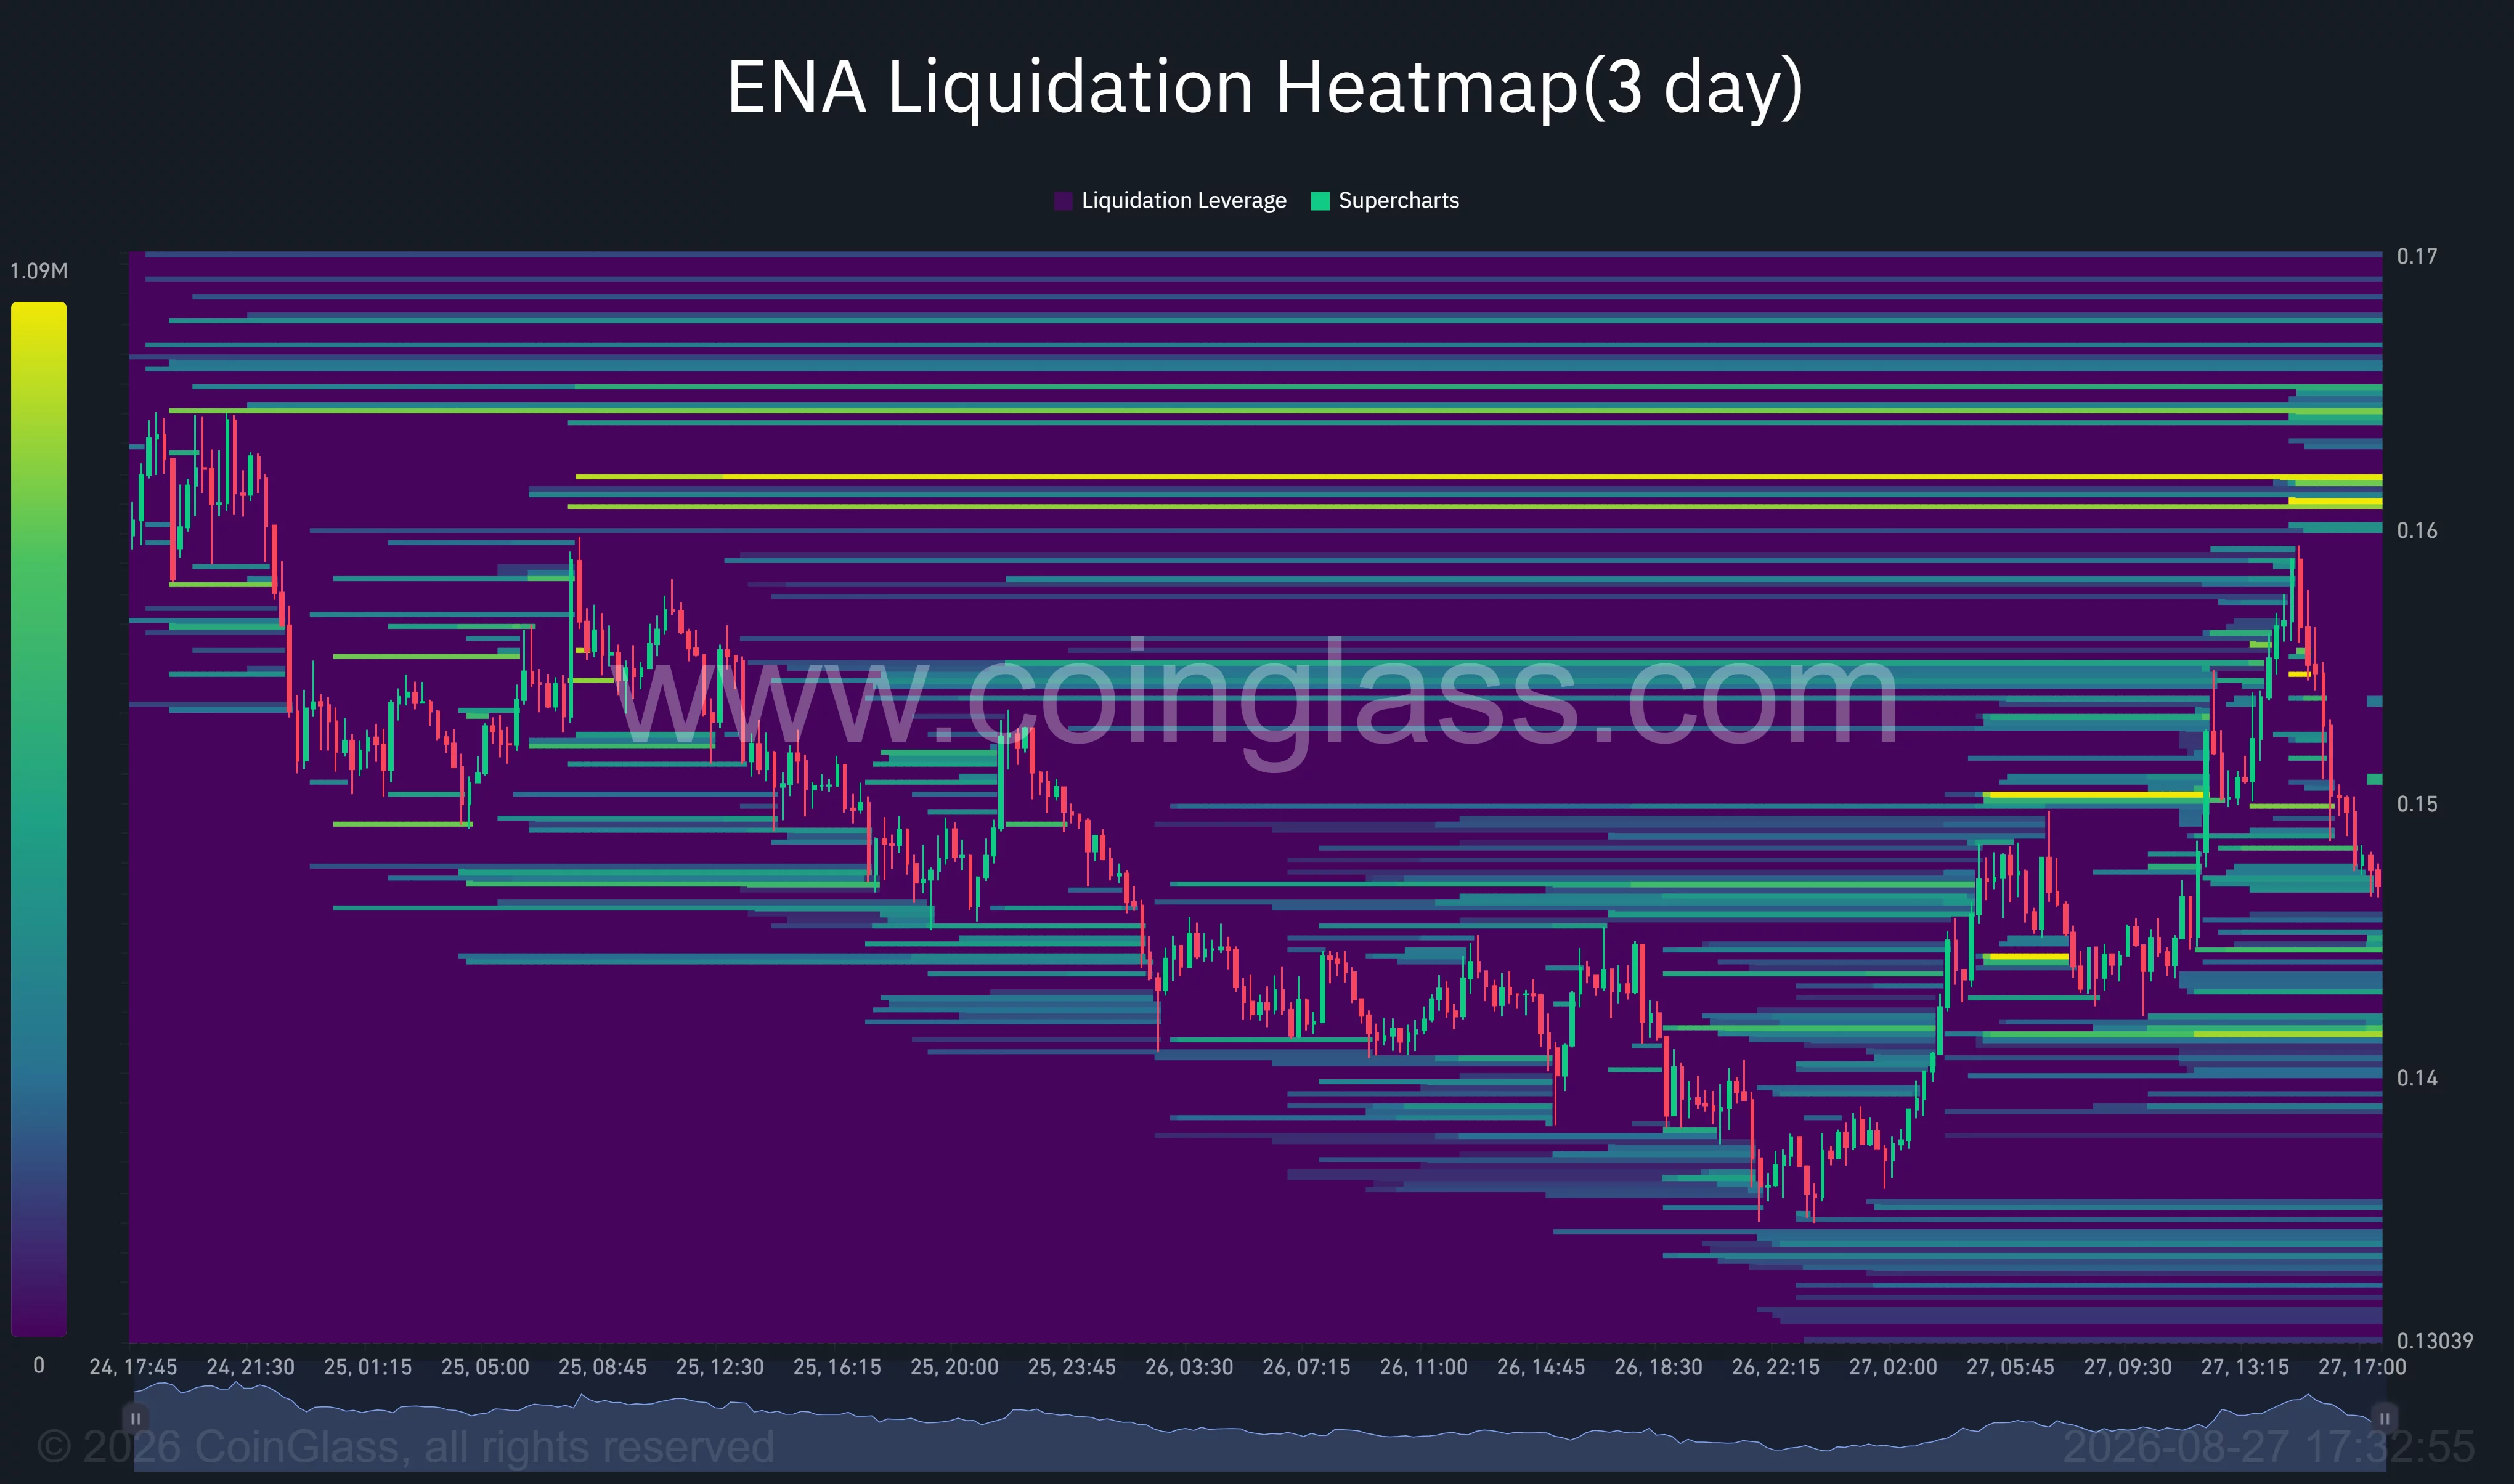
A move above $0.150 could expose smaller liquidity bands between $0.153 and $0.158. The most prominent overhead cluster sits around $0.161 to $0.162, where the heatmap displays one of its brightest bands.
Price may be drawn toward that zone if ENA reclaims $0.150 with sustained buying. Clearing $0.162 would then open the way for a retest of $0.170, followed by the weekly high near $0.180.
The downside contains visible liquidity around $0.143 to $0.141. A loss of that region would weaken the developing 4-hour base and could push ENA toward $0.138.
Below that level, the daily Supertrend near $0.1202 becomes the main structural support. The previously cited 200-day exponential moving average near $0.1268 provides an additional area to monitor during a deeper correction.
ENA must therefore hold the $0.138–$0.140 region and reclaim $0.150 to strengthen its recovery attempt. Failure to defend the range would increase the risk that the breakout continues retracing toward $0.128–$0.120.
US traders considering ENA also face the usual risks attached to volatile, concentrated governance tokens. The FalconX facility may expand Ethena’s institutional activity, but ENA’s next price move will depend on whether demand can absorb profit-taking and the liquidity positioned above $0.150.
Disclosure: This article does not represent investment advice. The content and materials featured on this page are for educational purposes only.


Truflation has called for the Federal Reserve to cut interest rates after its July forecast came within 0.01 percentage point of the official monthly headline PCE reading and matched the other three published figures.
Summary
- Headline PCE rose 0.2% monthly and remained at 3.7% annually in July.
- Truflation forecast the published readings five days before the BEA released its report.
- Oliver Rust said weaker spending, lower gasoline prices, and mixed labor data support a rate cut.
- Fed officials remain concerned about inflation as services, wages, and tariffs keep pressure on prices.
The U.S. Bureau of Economic Analysis reported on Aug. 26 that the PCE Price Index rose 0.2% month over month in July, reversing a 0.1% decline recorded in June. Annual headline inflation remained unchanged at 3.7%.
Core PCE, which excludes food and energy, also increased by 0.2% on a monthly basis and held at 3.3% from a year earlier. The Federal Reserve uses PCE as its preferred measure of inflation and has set a long-term inflation target of 2%.
Five days before the government release, Truflation estimated that headline PCE would increase 0.19% monthly and stay at 3.7% annually. Its forecast placed monthly core PCE at 0.2% and the annual reading at 3.3%.
The 0.19% headline estimate rounds to the 0.2% figure published by the BEA, although the two figures were not identical before rounding. Truflation matched the remaining three figures at the precision used in the official release.
Truflation has called the data a turning point
Speaking directly to crypto.news after the PCE release, Truflation Head of Data Oliver Rust said softer household demand, mixed employment data and falling gasoline prices have created a case for lower borrowing costs.
“Truflation is of the opinion that we have reached a turning point that needs the Fed to cut rates. We are seeing a softening in demand, i.e., spending.”
Official data offered some support for the demand side of Rust’s argument. The BEA said inflation-adjusted personal consumption expenditures were almost unchanged in July, down from a 0.4% increase in June.
Current-dollar spending rose by $36.3 billion as an $86.2 billion increase in services was partly offset by a $49.9 billion decline in goods. Personal income increased 0.4%, while disposable personal income gained 0.5%.
Households saved $712 billion during the month, leaving the personal savings rate at 3%. Truflation’s report said declining excess savings and increased reliance on credit could reduce consumer demand during the second half of 2026.
Retail sales also fell 0.6% in July, according to the report, ending an eight-month run without a monthly decline. Truflation attributed the drop to fading support from tax refunds, higher energy expenses, and more cautious discretionary purchases.
Rust said the labor market continues to show a “low-hire, low-fire environment.” Truflation’s report placed unemployment at 4.1% and said labor-force participation had fallen to 61.4% after nearly 1.4 million people left the workforce during 2026.
TruPCE maps live prices to BEA categories
Asked how the company makes its data comparable with the government index, Rust said Truflation assigns its price information to the BEA’s PCE category definitions and then applies the agency’s category weights.
The resulting measure, called TruPCE, is designed to track the government index while offering earlier guidance. Rust said Truflation’s data leads the BEA measure by an average of approximately 30 days.
Truflation says its indexes use more than 15 million product prices from over 30 data partners and sources. The company publishes its readings daily, while the BEA releases PCE figures monthly and can revise previous estimates as more information becomes available.
July represented only the fourth PCE forecast Truflation has published, according to Rust. He said the company also matched the previous month’s result and missed the April and May readings by 0.1 percentage point each.
The limited sample means the supplied figures do not provide a 12-month average forecasting error or a full comparison with economists’ estimates. Market consensus had placed July annual headline PCE at 3.6%, while forecasts for core inflation matched the eventual 3.3% reading.
In July, crypto.news reported PCE cooling from 4.1% in May to 3.7% in June as Bitcoin approached $65,000. July’s new reading left the annual rate at the same level rather than extending the decline.
Services and food kept inflation elevated
Housing carried the largest weight in Truflation’s July model, while gasoline created the strongest downward pressure, Rust said. Services and groceries produced the largest upward contributions.
Truflation’s underlying data showed gasoline and other energy goods falling 3.36% from June, although the category remained 23.6% higher than a year earlier. Clothing and footwear declined 0.7% monthly but increased 4.24% annually.
Food services and accommodation prices rose 1.21% during July and 3.61% over the year. The report attributed the monthly increase to summer travel, hotel demand, and restaurants passing higher labor and operating expenses to customers.
Transportation services climbed 1.13% monthly and 12.25% annually, led by airfares and public transportation costs, according to Truflation. Grocery prices increased 1.09% from June, with beef, coffee, and internationally traded food commodities adding pressure.
Wage growth presents another risk to Rust’s rate-cut argument. Truflation estimates that annual pay growth has remained between 4% and 4.5% since the middle of 2025, a rate the company says can sustain inflation in labor-intensive services.
Tariffs, oil prices, and electricity demand could also prevent a steady decline. The report said repeated tariff changes involving China, Canada, Mexico, and the European Union were becoming more visible in apparel and vehicle prices.
Utility prices rose 0.98% monthly and 7.64% annually in Truflation’s data, reaching their highest rates since mid-2024. The company linked some of the pressure to rising electricity use and infrastructure needs associated with artificial intelligence.
Fed officials have remained cautious about cuts
Rust’s call for lower rates stands apart from the current debate inside the Federal Reserve. Kansas City Fed President Jeffrey Schmid said on Aug. 27 that the existing 3.5%–3.75% policy range did not appear restrictive enough to return inflation to 2%, according to Reuters.
Chicago Fed President Austan Goolsbee also described persistent inflation as concerning, although he said rates could fall over time if the data showed prices moving back toward the central bank’s target.
Truflation’s Aug. 21 report had taken a less aggressive position than Rust’s post-release comments. The document projected that the Fed would leave rates unchanged in September and avoid another increase during the rest of 2026, rather than forecasting an immediate cut.
Bitcoin showed little initial reaction to the PCE release, trading around $78,353 approximately 36 minutes after the figures arrived, compared with a pre-release range of roughly $78,500 to $79,000. The 10-year Treasury yield moved about one basis point higher to 4.65%.
Earlier in the week, a Bitcoin catalyst report identified July PCE and Federal Reserve Chair Kevin Warsh’s Jackson Hole appearance as the main U.S. macro events facing crypto traders. Warsh is scheduled to deliver his keynote on Aug. 28 as markets seek guidance on the next interest-rate decision.



Mark Zuckerberg called Yann LeCun one Sunday last November. Word had gotten out that LeCun, who built Meta’s Fundamental AI Research (FAIR) lab, was leaving to start his own venture. Zuckerberg urged him to stay. Good luck raising the money and good luck building a product the market would believe, LeCun recalls him saying. The following month, LeCun unveiled Advanced Machine Intelligence Labs. By March, it had raised $1.03 billion in seed funding—one of the largest rounds in history.
Much of the tech industry has converged on the idea that scaling large language models will eventually produce human-level intelligence. But LeCun, one of the field’s pioneers, believes they are chasing a dead end. Advanced Machine Intelligence is pursuing a fundamentally different approach to training, aiming instead to give AI an intuitive understanding of physical reality. So-called “world models,” he believes, will eventually make AI far more capable in areas like robotics, self-driving cars, and medicine.
LeCun was never one to follow the crowd. When he championed neural networks in the 1980s, the research community dismissed the idea for decades before it eventually became the foundation of the current AI boom, earning him a Turing Award in 2018. Being a contrarian takes a pinch of “confidence,” he says, and an ability to step back. “You just need to lift your nose from the trench you’re digging, and look around.”

“He got taste” – Fans delighted as ENHYPEN’s Sunoo adds Jennie’s Less Than a Lover to his song recommendations

Marvell Technology, Inc. (MRVL) Q2 2027 Earnings Call Transcript

Bitcoin price eyes $83K after clearing 200-day SMA





-

 Fashion6 days ago
Weekend Open Thread: Madewell – Corporette.com
-

 Crypto World2 days ago
SpaceX stock could rise 75% to $240, JPMorgan says
-

 Business5 days ago
Musk’s Tesla, SpaceX Confirm $16.8 Billion ‘Terafab’ Chip Plant as World’s Largest Building in Texas
-

 Crypto World6 days ago
anatomy of crypto’s biggest liquidation event since 2021
-

 Crypto World3 days ago
A $30 Billion AI Fund Implodes, Now the SEC Is Investigating Wall Street’s Role
-

 Politics6 days ago
6 months on, Irish renters crushed by effects of government housing bill
-
 Crypto World2 days ago
Did Trump Just Move SpaceX Stock With One Truth Social Post?
-

 Business5 days ago
Mystery AI Model ‘Ox Alpha’ Draws Developers With Free Access as Chinese Lab Origins Remain Debated
-
 NewsBeat6 days ago
The ‘Lucky Dip Gang’ causing carnage for clicks: After five thugs were killed speeding in the wrong direction on a motorway, GUY ADAMS investigates a sick new trend… and why police aren’t even allowed to pursue them
-
 Crypto World6 days ago
Nvidia Stock Suffers Longest Losing Streak Since 2022: Will Q2 Earnings End It?
-

 Business3 days ago
Moderna CEO warns China is pouring state money into mRNA technology
-

 Business3 days ago
NVIDIA Stock Drops Nearly 2 Percent to $210 on Seventh Losing Day Ahead of Critical AI Earnings
-

 Crypto World2 days ago
Warsh Jackson Hole keynote puts financial innovation first
-

 Tech6 days ago
Unitree’s New Superman Robot Claims to Outjump and Outrun Every Human, Usain Bolt Included
-

 Sports5 days ago
Deshaun Watson fires back at Browns fans after being booed: ‘It’s a disrespectful thing’
-
 Crypto World5 days ago
Google Gemini AI Predicts Ethereum Could Become the Trade Retail Misses in 2026
-

 Business7 days ago
UK firms in critical financial distress rise 9% to 53,756
-

 Tech6 days ago
Faster chip in a familiar form factor
-

 Business6 days ago
Will Tesla Stock Be Higher or Lower a Year From Now? Here’s What Wall Street Analysts Are Saying
-

 Business4 days ago
Tesla Recalls Nearly 3 Million Cars in China Over Hidden Door Handles Linked to Multiple Deaths Amid New Ban
You must be logged in to post a comment Login