
Crypto World
Bitcoin’s Next Move May Hinge on U.S. Credit and Debt Conditions

Bitcoin (CRYPTO: BTC) dipped below $73,000 on Tuesday as a confluence of tightening credit conditions and elevated debt costs test market nerves. The macro backdrop shows a paradox: credit spreads remain compressed even as debt levels and borrowing costs stay elevated, a dynamic some analysts say could define BTC’s trajectory over the coming months. In this environment, an intriguing pattern emerges: the gap between credit pricing and actual credit-market stress has become a potential predictor for Bitcoin’s next move, echoing how similar dislocations played out in prior cycles.
Key takeaways
- The ICE BofA US Corporate Option-Adjusted Spread is at 0.75, its lowest level since 1998.
- US debt stands at about $38.5 trillion, while the 10-year Treasury yield is hovering near 4.28%.
- Bitcoin whale inflows to exchanges have risen, but on-chain profit-taking is easing despite the higher turnover on centralized venues.
- Historical cycles show BTC often forms a local bottom several months after credit spreads widen, a pattern that could repeat if liquidity tightens further.
- Analysts have signaled that a renewed accumulation phase could unfold in the months ahead, potentially after a period of market stress becomes more visible.
Market context: The current setup places Bitcoin at a crossroads where tight credit conditions and escalating debt costs contrast with a risk-off tilt in broader markets. The macro backdrop remains complex: while spreads compress, signaling relatively contained credit risk by some measures, the debt burden and the path of yields continue to constrain liquidity and appetite for risk assets, including BTC. This divergence—cheap-ish credit against a backdrop of financial strain—has historically preceded pronounced price moves for Bitcoin, underscoring why market participants are watching the bond and credit markets as a leading indicator for crypto trajectories. For reference, the data point often cited is the ICE BofA Corporate OAS, which has been moving in a way that ties into Bitcoin’s price rhythms during stress episodes.
In previous cycles—2018, 2020 and 2022—Bitcoin tended to bottom after credit spreads began to widen, with the delay ranging roughly three to six months. The suggestion of a lag between financial-market stress and crypto-price bottoms has resurfaced as traders parse the current dislocation. Some analysts have argued that if liquidity tightens further and spreads rise, Bitcoin could enter another phase of accumulation before broader market stress becomes fully evident. For instance, commentary from Alphractal founder Joao Wedson highlighted the potential for an accumulation phase if liquidity conditions deteriorate and credit spreads widen in the months ahead, a scenario that could set the stage for a multi-month consolidation before fresh directional moves. Argued.
Bitcoin whale activity and on-chain dynamics
Over the past few days, on-chain data show a spat of activity that peers at broad selling pressure yet also hints at longer-term fatigue among holders. Analysts have observed intensified transfers of BTC from large wallets to centralized exchanges, including a notable spike when wallets holding more than 1,000 BTC deposited roughly 5,000 BTC on a single day—an amount that mirrors a similar spike seen in December. The pattern of inflows from high-value wallets has raised questions about near-term selling pressure, especially amid a broader market lull.
In parallel, a broader cohort—holders in the six- to twelve-month age category—also moved 5,000 BTC to exchanges, marking the largest inflow from this segment since early 2024. Yet despite these near-term inflows, a counterpoint is evident: long-term holder behavior appears less aggressive, with spending output profit ratio (SOPR) sliding toward 1, its lowest reading in a year as BTC tested a year-to-date low near $73,900.
The tension between supply-side selling signals and longer-term holder exhaustion is a focal point for traders trying to gauge whether price weakness will endure or consolidate into a base. SOPR’s retreat toward equilibrium suggests fatigue among sellers in the longer horizon, a sign that a more durable bottom might require additional macro catalysts or clearer liquidity signals. The data, including real-time movement patterns and on-chain profitability metrics, remains a key input for analysts weighing the likelihood of a new accumulation window amid ongoing macro stress.
In the broader lens, the trend of exchange inflows paired with mixed on-chain signals mirrors what happened in prior cycles: weakness in price often coincides with attempts at price discovery amid shifting risk sentiment. The bond market’s stress indicators—how spreads widen or compress—tend to precede or align with crypto-market inflection points in ways that traders have tracked for years. As yields remain elevated and debt continues to accrue, the path of least resistance for Bitcoin may hinge on whether liquidity tightens enough to widen credit spreads, thereby unlocking a new phase of accumulation that could endure into the latter half of the year.
Looking ahead, investors will be watching two intertwined channels: the projected movements in credit-spread dynamics, and the cash-flow environment that governs risk appetite more broadly. If spreads begin a sustained widening trend, and liquidity tightens toward the 1.5%–2% range in coming weeks and months, BTC could see more pronounced bottom-building dynamics. Conversely, if credit conditions stay contained while yields drift higher, the downside might be tempered, and the market could pivot toward a range-bound phase that emphasizes accumulation rather than rapid sell-offs. The narrative remains contingent on macro developments, but the structural data—ranging from the debt mountain to the nuanced behavior of large BTC holders—provides a framework for parsing the next leg of the BTC story.
Why it matters
The observed disconnect between credit pricing and underlying market stress matters because it feeds into a broader risk-management framework for crypto investors. When traditional markets signal rising caution through widening stress or tighter liquidity, crypto assets can behave as a leveraged proxy—at times drawing demand from hedging flows, at other times succumbing to capitulation. The current data set—debt totals, yield levels, and evolving on-chain activity—offers a lens into how Bitcoin might respond as macro signals evolve. For users and builders in the ecosystem, the takeaway is to monitor liquidity proxies alongside price action, recognizing that a sustained shift in credit conditions could precede meaningful regime changes for BTC and related assets.
At the same time, the data remind market participants that crypto markets are not isolated from macro forces. Central bank policy expectations, debt dynamics, and financial-market stress indicators continue to weave a complex tapestry that shapes capital allocation. Understanding these interconnections can help traders anticipate whether the coming months will favor accumulation, consolidation, or renewed volatility as global liquidity conditions adapt to shifting fiscal and monetary landscapes.
What to watch next
- Watch credit-spread movements toward the 1.5%–2% range through April, which could precede renewed BTC downside or a gradual bottoming process.
- Monitor the trajectory of US debt and the 10-year yield, especially any sustained retreats or surprises that could alter liquidity dynamics.
- Track on-chain SOPR levels and exchange-inflow patterns, especially among holders in the six- to twelve-month window, for signs of seller exhaustion or renewed demand.
- Look for a potential accumulation window after July 2026, as suggested by macro-cycle analyses that link credit stress to longer-term price basins.
Sources & verification
- ICE BofA US Corporate Option-Adjusted Spread data and related macro signals (BAMLC0A0CM) from the Federal Reserve’s data repository.
- U.S. debt levels and the 10-year Treasury yield data points reflecting the January-end totals and current yields.
- CryptoQuant insights on whale and holder activity and SOPR trends used to interpret near-term market dynamics.
- Analyst commentary on liquidity and bond-market stress scenarios that inform Bitcoin’s potential accumulation phase.
Market reaction and macro signals shaping BTC trajectory
Bitcoin (CRYPTO: BTC) has moved to test new support near the lower end of its recent range as macro indicators paint a mixed picture for risk assets. The corporate credit market continues to offer a strange juxtaposition: spreads are tight on the surface, yet the debt landscape remains heavy, and yields persist in a tight corridor. This bifurcation creates a testing ground for BTC, where a failure to sustain prices could reflect broader risk-off dynamics, while a stabilization or rebound could indicate the onset of an accumulation period as liquidity conditions slowly improve, or at least stop deteriorating.
Historical context provides a framework for interpretation. In past cycles, periods of widening credit stress often preceded a trough in BTC prices by a few months, followed by a phase of quiet accumulation as investors waited for clearer macro direction. The present discussion centers on whether current signals will produce a similar pattern or whether a new regime will emerge where BTC acts more as a hedge against macro risk rather than a tradable risk-on asset. The ongoing debate among market observers highlights a spectrum of possible outcomes, with some arguing that the next leg could hinge on how the bond market absorbs liquidity stress, while others point to on-chain signals that may foretell a more durable bottom forming in the months ahead.
The conversation also touches upon practical implications for market participants. If liquidity tightens and spreads widen, Bitcoin could see renewed volatility as traders reposition portfolios to weather the stress. If, on the other hand, the stress signals abate and the price finds support, the market could shift toward gradual accumulation—a phase that has historically offered a quieter backdrop for long-term investors to build positions. The data and commentary from industry analysts keep bridging macro indicators with on-chain realities, providing a nuanced view of the evolving crypto-market landscape.


TLDR:
- Wallet 0x524, linked to Ondo Finance, transferred nearly 20M ONDO tokens across two separate destination wallets.
- Whale wallets 0x807 and 0x61d moved 2.84M ONDO from Coinbase Hot Wallet to Custody, signaling long-term holding intent.
- Wallet 0xFC9, flagged as a long-time associate wallet, received 4.9M ONDO tokens in a potential sell-off move.
- Ondo Finance crossed $800M in tokenized stock TVL, yet growing project success may increase VC and team profit-taking pressure.
ONDO token activity has attracted attention after a wallet linked to Ondo Finance moved nearly 20 million tokens.
On-chain data captures two outgoing transfers to separate destination addresses. At the same time, two whale investors moved a combined 2.84 million tokens off Coinbase Hot Wallet to Coinbase Custody.
These events come as Ondo Finance crossed $800 million in tokenized stock total value locked, marking a notable project milestone.
Large Transfers From Project-Linked Wallet Raise Sell-Off Concerns
Wallet 0x524, connected to Ondo Finance, transferred approximately 15 million ONDO tokens to multi-sig wallet 0x611.
That movement carried an estimated value of $3.95 million at the time of the transfer. The multi-sig structure of the destination wallet generally points to a more controlled custody setup.
Shortly after, 4.9 million ONDO tokens, worth around $1.29 million, moved to wallet 0xFC9. On-chain analyst Nazoku flagged this transfer on social media, describing 0xFC9 as a long-time associate wallet. The analyst noted the transfer to that wallet could be connected to a potential sell-off.
Together, both outflows account for nearly 20 million tokens leaving wallet 0x524 within a short period. Transfers of this size from project-affiliated wallets often draw quick attention from traders and market watchers.
Such movements are frequently interpreted as potential signs of incoming sell pressure. Such moves by core-affiliated wallets are hard to ignore when they happen close together.
This kind of activity can weigh on token sentiment, regardless of project fundamentals. Whether wallet 0xFC9 proceeds with a sell-off has not yet been confirmed. Market participants are closely watching both wallets for any further movement.
Whale Accumulation and $800M TVL Reflect Long-Term Market Confidence
On the other hand, two whale wallets moved 2.84 million ONDO tokens from Coinbase Hot Wallet to Coinbase Custody.
Moving assets to Custody is widely viewed as a long-term holding signal rather than short-term trading. Nazoku flagged this activity alongside the outflow report.
Whale 0x807 acquired 1.7 million tokens valued at around $458,000. Whale 0x61d withdrew 1.14 million tokens worth approximately $314,400 in the same period.
Both whales reportedly plan to hold their positions unless the token price gains at least 50%. This approach is common among investors who hold a high-conviction view on an asset.
Ondo Finance also reported that its tokenized stock TVL has crossed the $800 million mark. The project works within the real-world asset sector, an area that has drawn steady institutional interest. This figure reflects growing on-chain demand for tokenized financial instruments.
However, a growing TVL can also give venture capital backers and team members more reason to realize profits. As Nazoku pointed out, this creates a persistent selling force on ONDO that offsets positive project news.
The on-chain picture remains mixed, with profit-taking and accumulation happening side by side.


The online gambling market has shifted quickly over the past few years. What was once dominated by a handful of big-name operators is now a crowded space where players actively search for alternatives that better fit how they want to play. FanDuel remains one of the most recognized names in the industry, but search data and player forum activity suggest that a growing number of users are looking beyond established brands. Among the platforms drawing attention is ZunaBet, a crypto-first casino and sportsbook that launched in 2026 with a feature set designed to appeal to a different kind of player.
FanDuel: The Established Name
FanDuel built its reputation through daily fantasy sports before expanding into sports betting and online casino gaming. It operates legally in multiple US states and holds licenses from well-known regulatory bodies. The platform offers a solid sportsbook, a reasonable selection of casino games, and regular promotions tied to major sporting events.
For many players, FanDuel is a safe and familiar choice. It processes payments through traditional methods like bank transfers, credit cards, and PayPal. Its mobile app is polished, and its brand recognition is high thanks to years of advertising spend and partnerships with major sports leagues.
That said, FanDuel’s strengths also reflect its limitations. Its casino game library, while decent, is smaller than what some competitors now offer. Its loyalty and rewards structure is fairly standard. And its reliance on traditional payment rails means players deal with processing times and fees that have become a growing point of frustration, especially among younger users who are comfortable with cryptocurrency.
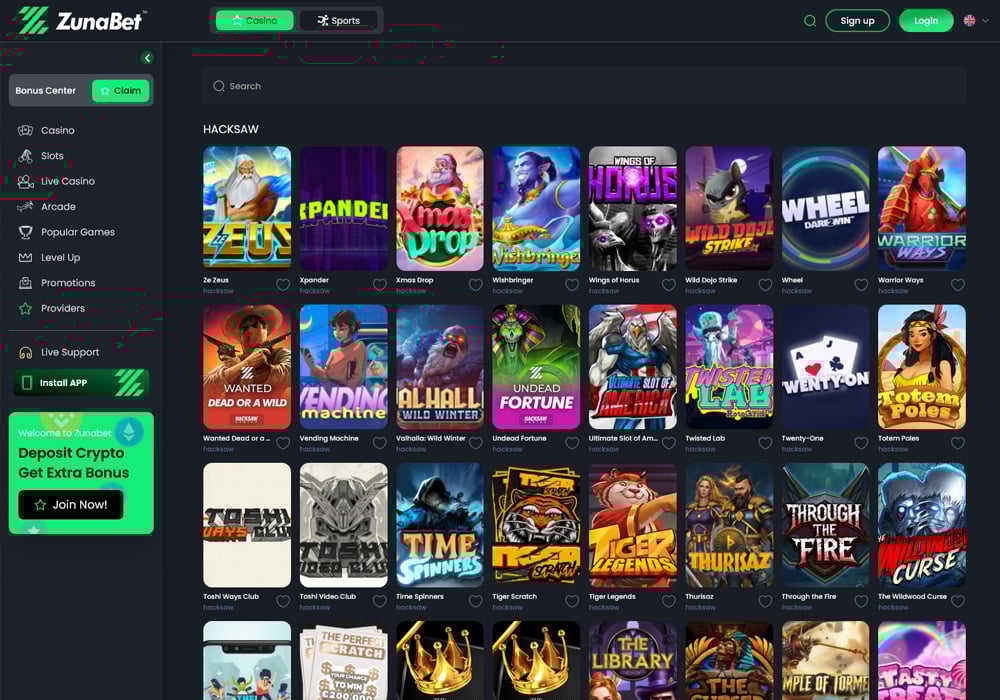
ZunaBet: The New Challenger
ZunaBet launched in 2026 and has quickly positioned itself as one of the more ambitious new entries in the crypto casino space. It is owned by Strathvale Group Ltd and operates under an Anjouan gaming license. The team behind the platform has over 20 years of combined experience in the gambling industry, which shows in the scale of its launch.
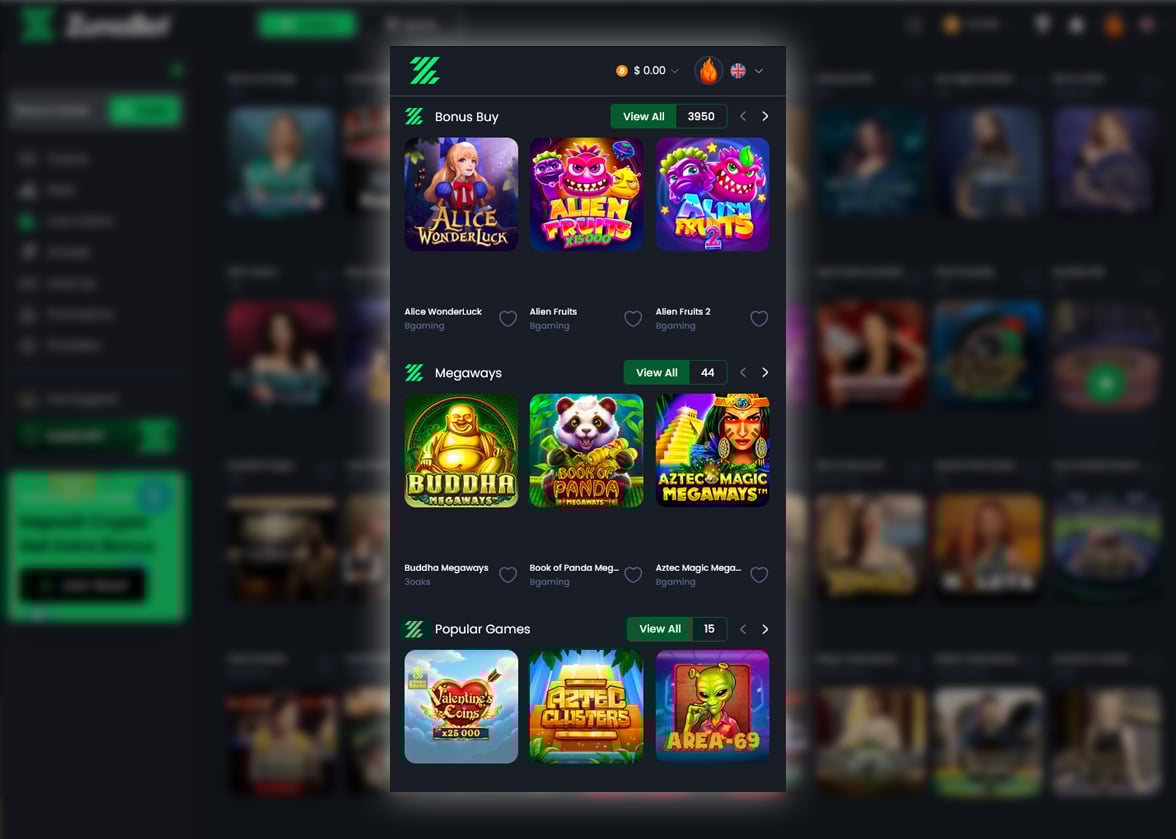
The numbers are hard to ignore. ZunaBet offers over 11,294 games from 63 providers, including well-known names like Pragmatic Play, Hacksaw Gaming, Evolution, Yggdrasil, and BGaming. That puts its library among the largest in the crypto-focused market. The game selection covers slots, RNG table games, and live dealer tables, giving players a full casino experience without needing to visit multiple platforms.
Beyond the casino, ZunaBet runs a full sportsbook covering football, basketball, tennis, NHL, esports titles like CS2, Dota 2, League of Legends, and Valorant, plus virtual sports and combat sports. This makes it a genuine hybrid platform rather than a casino with a sportsbook bolted on as an afterthought.
The platform supports over 20 cryptocurrencies including Bitcoin, Ethereum, USDT across multiple chains, Solana, Dogecoin, Cardano, and XRP. It charges no platform processing fees and emphasizes fast withdrawals, which directly addresses one of the most common complaints players have about traditional operators.
ZunaBet also offers dedicated apps for iOS, Android, Windows, and MacOS, along with 24/7 live chat support. Its interface uses a dark theme with fast loading speeds and responsive design, built on modern HTML5 technology.
Crypto vs Traditional Platforms
The divide between crypto and traditional gambling platforms is becoming one of the defining trends in the industry. Traditional platforms like FanDuel rely on bank transfers, cards, and e-wallets. These methods work, but they come with processing delays, fees, and identity verification steps that some players find cumbersome.
Crypto platforms like ZunaBet take a different approach. Transactions settle faster because they run on blockchain networks rather than through banks. There are no platform processing fees, and the range of supported currencies gives players flexibility that traditional operators simply do not match. For players who already hold cryptocurrency, this removes friction from the deposit and withdrawal process entirely.
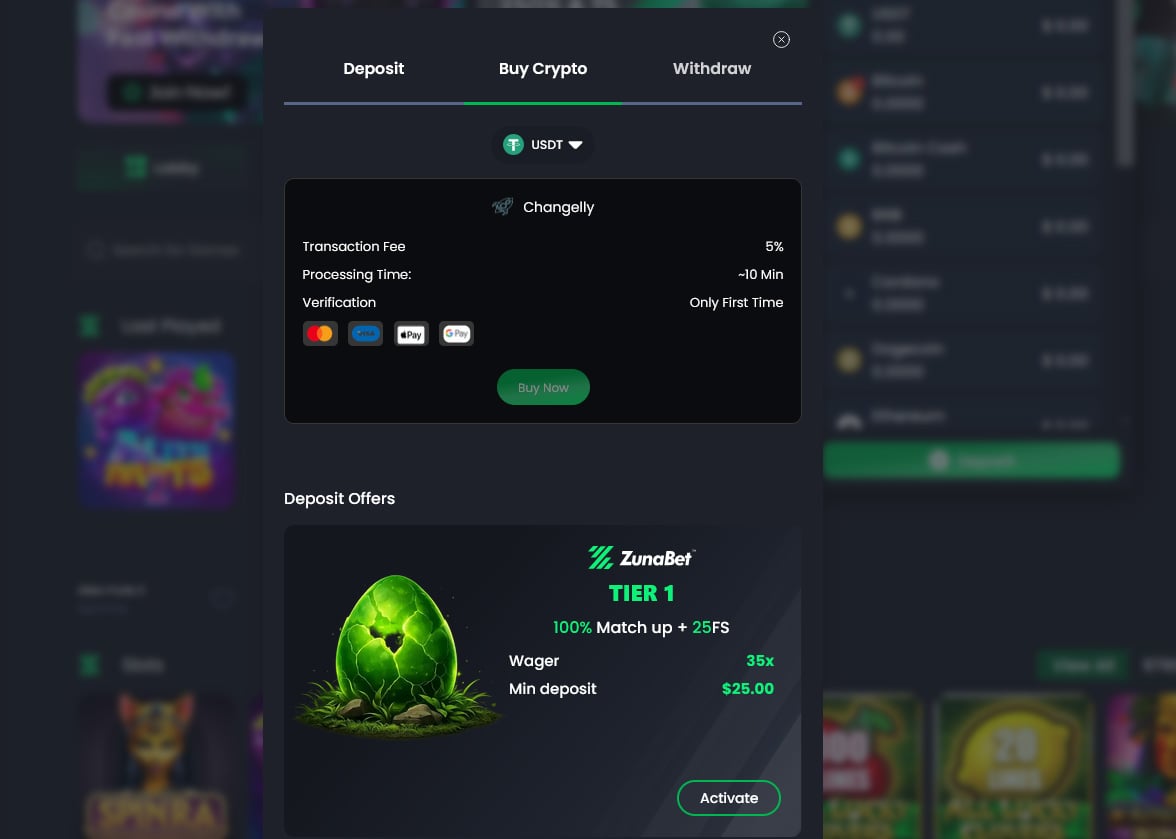
This matters more than it might seem on the surface. A player who wins on a Friday night at a traditional casino might wait several business days for a withdrawal to clear. On a crypto platform, that same withdrawal can process in minutes. For a growing segment of the market, that speed and simplicity is not just a nice feature. It is the baseline expectation.
The broader trend is clear. As cryptocurrency adoption continues to grow globally, platforms built around crypto from the ground up have a structural advantage over those trying to add it as an afterthought. ZunaBet was designed as a crypto-first platform from day one, and that shows in how deeply cryptocurrency support is integrated into every part of the experience.
Loyalty Programs: Standard Points vs Gamified Progression
Loyalty programs are another area where the gap between old and new approaches is widening. Most traditional operators, including FanDuel, use point-based systems where players earn rewards through wagering volume. These programs work, but they tend to feel generic and do little to create genuine engagement beyond the transactions themselves.
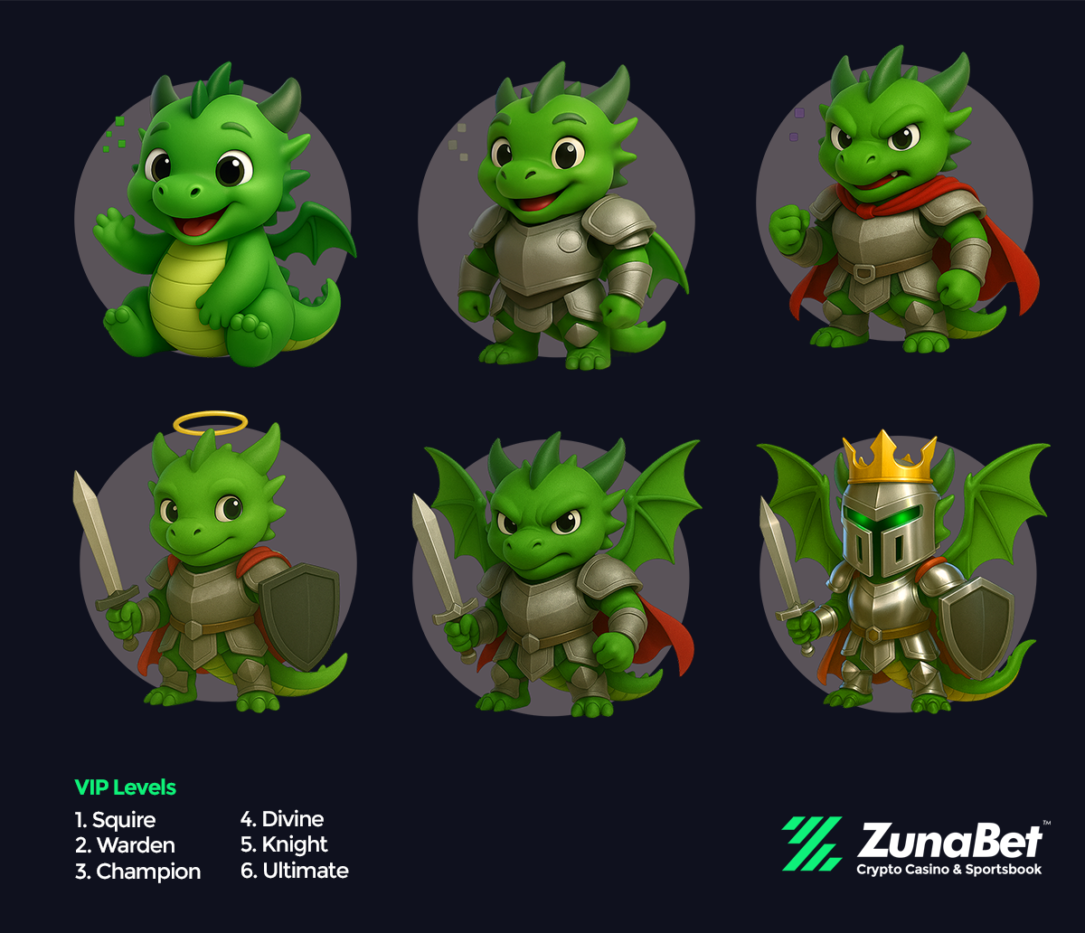
ZunaBet has taken a different route with its dragon evolution loyalty system. The program has six tiers — Squire, Warden, Champion, Divine, Knight, and Ultimate — each tied to a mascot called Zuno that evolves as players progress. Rakeback starts at 1% and scales up to 20% at the highest tier. Benefits include tier-based free spins up to 1,000, VIP club access, and double wheel spins.
The gamified structure is a deliberate design choice. It borrows from the progression systems that players are already familiar with from video games, making the loyalty experience feel like part of the entertainment rather than a separate accounting exercise. For players who grew up with gaming, this approach feels natural in a way that traditional point systems do not.
A Platform Built for What Comes Next
The rising search interest in FanDuel alternatives reflects a broader shift in what players want. The established operators built their businesses around traditional payment methods, standard loyalty programs, and regulated US markets. They do those things well. But the market is not standing still.
ZunaBet represents a different model. It combines a massive game library, a full sportsbook with esports coverage, crypto-native payments, and a loyalty system that feels more like a game than a rewards card. It is built for players who expect speed, variety, and an experience that matches how they interact with technology everywhere else in their lives.
None of this means FanDuel is going away. It remains a strong platform with clear advantages in regulated US markets. But for the growing number of players who want something different, something faster, and something that feels like it was built for them rather than adapted from an older model, platforms like ZunaBet are where the energy is right now.
The online gambling industry has always moved toward whatever gives players more choice, more speed, and more reasons to stay engaged. Right now, that momentum is pointing toward crypto-first platforms with bigger libraries and smarter loyalty systems. ZunaBet is at the front of that wave, and the search data suggests players are paying attention.
Disclaimer: This is a Press Release provided by a third party who is responsible for the content. Please conduct your own research before taking any action based on the content.


TRON founder Justin Sun met Kyrgyz President Sadyr Japarov on April 18 in a formal diplomatic session focused on blockchain development and virtual asset expansion in Central Asia.
The meeting follows a February 2026 video conference between Sun and Farkhat Iminov, head of Kyrgyzstan’s National Council for Virtual Assets and Blockchain Technologies.
TRON Eyes KGST Stablecoin Integration
Discussions centered on scaling the KGST stablecoin, a 1:1 Kyrgyz som-backed digital asset already live on BNB Chain and listed on Binance since December 2025.
Sun proposed integrating KGST with TRON’s high-throughput infrastructure to enable local currency trading on crypto exchanges without converting to US dollars first.
Sun suggested Kyrgyzstan could become a full blockchain center within two years by building on scalable networks like TRON.
President Japarov highlighted the rapid growth of the country’s virtual asset sector, which now includes more than 200 registered crypto exchanges and 11 industrial mining companies.
CZ Paved the Way
The engagement mirrors an earlier, deeper push by Changpeng Zhao (CZ), founder and former CEO of the Binance exchange.
In May 2025, CZ was appointed as a presidential adviser on digital assets. He helped launch KGST on BNB Chain and guided the country’s plans for a national crypto reserve.
By courting both Binance and TRON, Kyrgyzstan appears to be hedging its blockchain strategy. Binance provides exchange access and global liquidity, while TRON offers low-fee, high-speed infrastructure suited for stablecoin transactions and cross-border payments.
The pattern of blockchain founders meeting heads of state continues to accelerate as emerging markets shift from regulation to active sovereign adoption.
The post Kyrgyzstan Courts TRON After Binance as Justin Sun Meets President Japarov appeared first on BeInCrypto.

The crypto casino market has exploded in size, but for individual operators, cutting through the noise has become one of the biggest challenges in the business. With hundreds of Bitcoin casinos, Ethereum gambling platforms and multi-currency crypto gaming sites now competing for the same players, simply having a good product is no longer enough. Operators need media coverage on the publications their audience actually trusts.
Kooc Media, a PR distribution agency specialising in the crypto, fintech, technology and iGaming sectors, has built a service specifically for this problem. The agency combines its own network of established news websites with major newswire distribution to give crypto casino operators guaranteed media placements across high-authority publications — with articles typically going live the same day.
“Crypto casinos are competing in one of the fastest-moving spaces in online entertainment,” said Michelle De Gouveia, spokesperson for Kooc Media. “The operators who get consistent coverage on respected sites are the ones players remember. The ones who stay invisible get left behind.”
A Marketing Blind Spot for Crypto Casinos
Crypto casinos sit in an awkward overlap between two industries that both face significant advertising restrictions. On the cryptocurrency side, major platforms like Google and Meta have spent years imposing and adjusting restrictions on crypto-related advertising. On the gambling side, regulators across the UK, Europe and multiple US states continue to tighten rules around how operators can promote their services.
For a crypto casino that falls under both categories, the paid advertising landscape is particularly difficult to navigate. Even operators willing to spend heavily on paid campaigns often find their options limited by platform policies, jurisdiction-specific rules or outright bans on gambling and crypto advertising.
This is why PR has become such a critical channel for the crypto casino sector. Articles published on respected news sites operate outside the restrictions that affect paid advertising. They carry editorial weight that a banner ad or sponsored social post cannot replicate. And unlike paid campaigns that stop delivering the moment the budget runs out, a well-placed article continues to rank in search engines and drive traffic for months or years after publication.
The difficulty has always been finding a PR agency that understands both sides of the crypto casino equation. Most gambling PR firms do not know how to talk about blockchain technology, smart contracts or tokenomics. Most crypto PR firms have little experience with responsible gambling messaging or the regulatory sensitivities of the gaming industry. Kooc Media’s experience across both crypto PR and gambling PR puts it in a rare position to serve operators who need both.
Placements on Real Sites With Real Audiences
What separates Kooc Media from most PR providers is its owned media network. The company operates several well-known online news brands including Blockonomi, CoinCentral, MoneyCheck, Parameter, Beanstalk and Computing. These are not newly created sites built for link placement. They are established publications with years of content, built-up domain authority, organic traffic and engaged readerships across the crypto, finance and technology sectors.
When a crypto casino books a placement through Kooc Media, the article appears on one or more of these sites. There is no uncertainty about whether the piece will be published. There is no waiting for an editor at an external publication to decide whether the story is worth covering. The placement is confirmed before the campaign begins, and in most cases the article is live within hours.
For crypto casino operators, this reliability changes how they plan their marketing. A platform launching a new provably fair game, adding support for a new cryptocurrency, or entering a new market can time their PR coverage precisely to coincide with the announcement. There is no risk of the story going live too late or not at all.
Kooc Media also distributes press releases through major newswire networks, extending coverage well beyond its own sites. Depending on the package, articles can appear on major business and finance outlets including Business Insider, Bloomberg, Benzinga, MarketWatch, USA Today and Dow Jones feeds. For crypto casinos trying to reach mainstream audiences, attract investors or build credibility beyond the core crypto gambling community, this mainstream distribution is a powerful addition to the niche placements on Kooc Media’s own network.
Full reporting is included with every campaign. Operators receive live links to every published article so they can track exactly where their coverage appeared and share it with stakeholders.
Packages Designed Around How Crypto Casinos Operate
Kooc Media has structured its crypto casino PR offering around the real-world situations operators face, rather than offering a generic one-size-fits-all package.
New crypto casinos preparing to launch need visibility fast. The priority is getting the brand in front of as many potential players as possible across crypto news sites, gambling publications and mainstream finance outlets within a tight window around the launch date. Kooc Media’s launch packages are designed for exactly this scenario, delivering concentrated coverage that gives a new platform immediate credibility and name recognition from day one.
Crypto casinos that are already up and running have different requirements. For established operators, the focus shifts to maintaining a steady drumbeat of media coverage that supports ongoing player acquisition, strengthens search engine rankings and keeps the brand visible in a market where new competitors appear constantly. Kooc Media’s recurring monthly packages provide regular placements that operators can budget for and plan around.
Operators with specific campaign needs can work with Kooc Media to build custom plans. A crypto casino launching a native token might need coverage that emphasises the tokenomics and utility of the coin alongside the gaming platform. An operator adding new blockchain integrations might want articles focused on the technical capabilities and player benefits of those additions. A platform expanding into new geographic markets might need coverage targeted at publications popular in those regions. Kooc Media builds campaigns around whatever the operator needs rather than forcing them into a predefined template.
“Every crypto casino has a different angle,” said De Gouveia. “Some want to lead with their technology. Others want to focus on their game selection or their community. We build campaigns around what makes each operator different, because that is what readers and players actually care about.”
Professional Content for a Specialist Audience
The crypto casino audience is knowledgeable and sceptical. Players who gamble with Bitcoin or Ethereum tend to be more technically aware than the average online casino customer. They understand blockchain technology. They know what provably fair means. They can spot generic marketing language immediately and they do not respond well to it.
This makes content quality especially important for crypto casino PR. Press releases and articles need to be technically accurate, specific about the platform’s features and written in a way that respects the audience’s intelligence. At the same time, the content needs to handle gambling-related messaging responsibly and avoid claims that could create regulatory problems.

Kooc Media’s managed PR creation service handles all of this. The agency’s editorial team writes, edits and reviews every piece of content before publication. Operators provide the key details and Kooc Media produces finished articles that meet both the editorial standards of target publications and the expectations of the crypto gambling audience. The team has direct experience writing about blockchain technology, cryptocurrency payments, decentralised gaming and iGaming regulation, so the content is credible on both fronts.
For crypto casino operators without an in-house marketing or communications team, this managed service removes one of the biggest barriers to running an effective PR strategy. There is no need to hire specialist writers or manage external contractors. Kooc Media handles the content side entirely.
Building Long-Term Search Visibility
For crypto casinos, one of the most valuable outcomes of consistent PR coverage is improved search engine performance. Search engines give significant weight to content published on high-authority domains. Each article placed through Kooc Media’s network creates an indexed page that can rank for search terms like Bitcoin casino, crypto gambling, Ethereum casino, provably fair slots, blockchain betting and cryptocurrency sportsbook.
A single placement provides some benefit. But the real value comes from consistency. An operator with a steady stream of articles published across Blockonomi, MoneyCheck, CoinCentral, Benzinga and other established sites builds a digital footprint that compounds over time. Each new article reinforces the operator’s presence in search results and makes it harder for competitors to displace them.
Players researching crypto casinos before signing up will encounter the brand across multiple trusted sources. That repeated exposure builds familiarity and trust in a way that no single ad or social media post can match. For an industry where trust is everything — players are depositing real cryptocurrency — this kind of earned credibility is worth more than almost any other marketing investment.
About Kooc Media
Kooc Media was founded in 2017 as a specialist PR distribution agency for the crypto, fintech, technology and iGaming industries. The company operates its own network of in-house news websites and a large partner distribution network, delivering guaranteed media coverage across high-authority publications. Services include press release writing, sponsored articles, newswire distribution, homepage placements and full campaign reporting. Kooc Media works with clients across the crypto, fintech and gambling sectors, from new projects to established platforms.
Kooc Media’s Crypto Casino packages are available now through the company’s website at https://kooc.co.uk.
TLDR:
- TAO cryptocurrency hit its first halving in December 2025, cutting daily emissions from 7,200 to 3,600 tokens.
- Grayscale allocated 43% of its AI Fund to TAO, making it the single largest position in the fund.
- Bittensor’s 128 competing subnets auto-prune weak projects, mirroring the S&P 500’s survivorship mechanism.
- Venice.ai, with over one million paying users, trained its flagship model on Bittensor’s Subnet 4.
TAO cryptocurrency is drawing serious attention from analysts who argue it combines the strongest features of Bitcoin, the S&P 500, and Nvidia into one asset.
Currently trading at $250 with a $2.7 billion market cap, TAO operates on the Bittensor network. The network runs 128 competing AI subnets, with a fixed supply cap of 21 million tokens. Institutional interest is growing, with multiple ETF applications now pending before the SEC.
TAO Cryptocurrency’s Scarcity Model and Automated Subnet Competition
TAO crypto mirrors Bitcoin’s supply structure through a hard cap of 21 million tokens. The network’s first halving occurred in December 2025, cutting daily emissions from 7,200 to 3,600 TAO. Around 67% of circulating supply remains locked, leaving a liquid float of just 3 million TAO.
Analyst Andy ττ argued on X that Bitcoin’s decade following its first halving produced a 1,311x return on a pure scarcity thesis alone.
He noted that TAO carries the same scarcity DNA but adds subnet-level revenue and usage on top. That combination did not exist in Bitcoin’s early structure.
The Bittensor network’s 128 subnets compete directly for emissions. Weaker subnets lose their allocation, while stronger ones attract more stake and grow.
This mirrors the S&P 500’s mechanism, where underperforming companies exit the index automatically over time.
Andy ττ described the structure as “a self-optimizing index of decentralized AI companies.” Stake-based voting determines which subnets survive, making the process market-driven rather than committee-driven. No comparable financial structure has existed before in traditional or digital markets.
Institutional Adoption and Real-World Usage Already Building Around TAO
Grayscale’s AI Fund recently allocated 43% of its holdings to TAO cryptocurrency, making it the fund’s single largest position.
Both Grayscale and Bitwise have ETF applications pending with the SEC. Corporate treasury firm xTAO is actively accumulating, and Yuma has staked $691 million into the network.
Venice.ai, co-founded by Erik Voorhees, now counts over one million paying users. The platform trained its flagship model on Bittensor’s Subnet 4 via Targon Compute.
Macrocosmos, operating on Subnet 9, is targeting a 70-billion-parameter distributed training run, which would be a world first.
The TAO Institute launched in April 2026, introducing a Subnet Risk Index for institutional allocators. Jensen Huang of Nvidia has publicly endorsed decentralized training, a concept central to Bittensor’s model. These developments point to infrastructure maturing around TAO rather than speculative positioning alone.
Andy ττ also noted that increased network usage reduces sell pressure on TAO cryptocurrency over time. Greater competition recycles more TAO, while higher usage lowers net issuance. Combined with the halving schedule, this creates a feedback loop between growth and reduced supply pressure.
TLDR:
- ARB maintains a bullish structure despite cooling momentum, holding above the critical $0.125 support zone.
- RSI and MACD indicators signal short-term weakness, pointing to consolidation rather than a full trend reversal.
- Altcoin market cap retreats from $195B highs, testing key support levels near the $182B–$184B range.
- Market conditions suggest a range-bound phase as traders wait for confirmation of the next breakout direction.
Altcoins recorded steady momentum over the past week as broader market conditions remained supportive. Bitcoin held strength, while volatility stayed low.
Market data shows a cooling phase emerging, with key indicators pointing toward consolidation rather than a clear reversal.
ARB Price Action Signals Cooling Momentum After Rally
On the ARB/USDT 4-hour chart, price action confirms a shift from consolidation into an uptrend. The asset climbed from around $0.095 to near $0.135 before facing resistance. At the time of observation, ARB traded near $0.128, showing minor gains during the session.
Crypto analyst Michaël van de Poppe addressed this trend in a recent tweet. He linked altcoin momentum to low volatility and strong Bitcoin performance. He also noted that a pullback, if it occurs, could present a buy-the-dip setup for ARB.
The structure still reflects higher highs and higher lows, which supports a bullish trend. However, recent rejection near the $0.135 zone slowed upward movement. Price has since entered a narrow range, indicating reduced momentum.
Key levels remain in focus. Immediate resistance sits between $0.130 and $0.135, while stronger resistance appears near $0.140. On the downside, support holds around $0.125, with deeper levels near $0.120 and $0.110.
Momentum indicators show a shift in pace. The Relative Strength Index moved down from overbought levels and now sits near neutral territory. This suggests easing buying pressure without clear bearish divergence.
Meanwhile, the MACD indicator shows a bearish crossover with a slightly negative histogram. This points to short-term selling pressure, though not strong enough to confirm a reversal. The setup aligns more with a pause following rapid gains.
Van de Poppe stated that a deeper correction remains unlikely. He added that any pullback could form a buy-the-dip pattern. His projection places a potential continuation toward the $0.16 level if support holds.
Altcoin Market Cap Pulls Back After Sharp Expansion
The broader altcoin market, excluding the top ten assets, followed a similar pattern. Market capitalization reached approximately $195 billion before retreating to near $185 billion. This move reflects a short-term correction after rapid expansion.
Earlier phases showed a clear transition. The market declined through mid-March, followed by a consolidation range into early April. That phase formed a base between $169 billion and $178 billion.
A breakout occurred in mid-April, with strong upward candles pushing valuation higher. The move showed limited pullbacks, signaling aggressive capital inflows during that period. However, the rally lost pace near recent highs.
Current price action shows rejection near the $195 billion level. The pullback has brought the market toward a support zone between $182 billion and $184 billion. This level now acts as a key area for stability.
If the market holds above $180 billion, structure remains intact. A rebound could lead to another test of the $190 billion region. On the other hand, a breakdown below support may shift focus toward $178 billion.
Short-term behavior suggests consolidation may follow. A range between $180 billion and $190 billion appears likely while indicators reset. This aligns with the cooling trend seen in individual altcoins.
The recent rally points to increased activity outside major cryptocurrencies. However, the sharp rejection indicates that rapid gains triggered profit-taking. The market now seeks balance after the strong move.
Overall, both ARB and the broader altcoin market show similar patterns. Strong upward trends remain in place, yet momentum has slowed. Current conditions favor consolidation as traders assess the next direction.
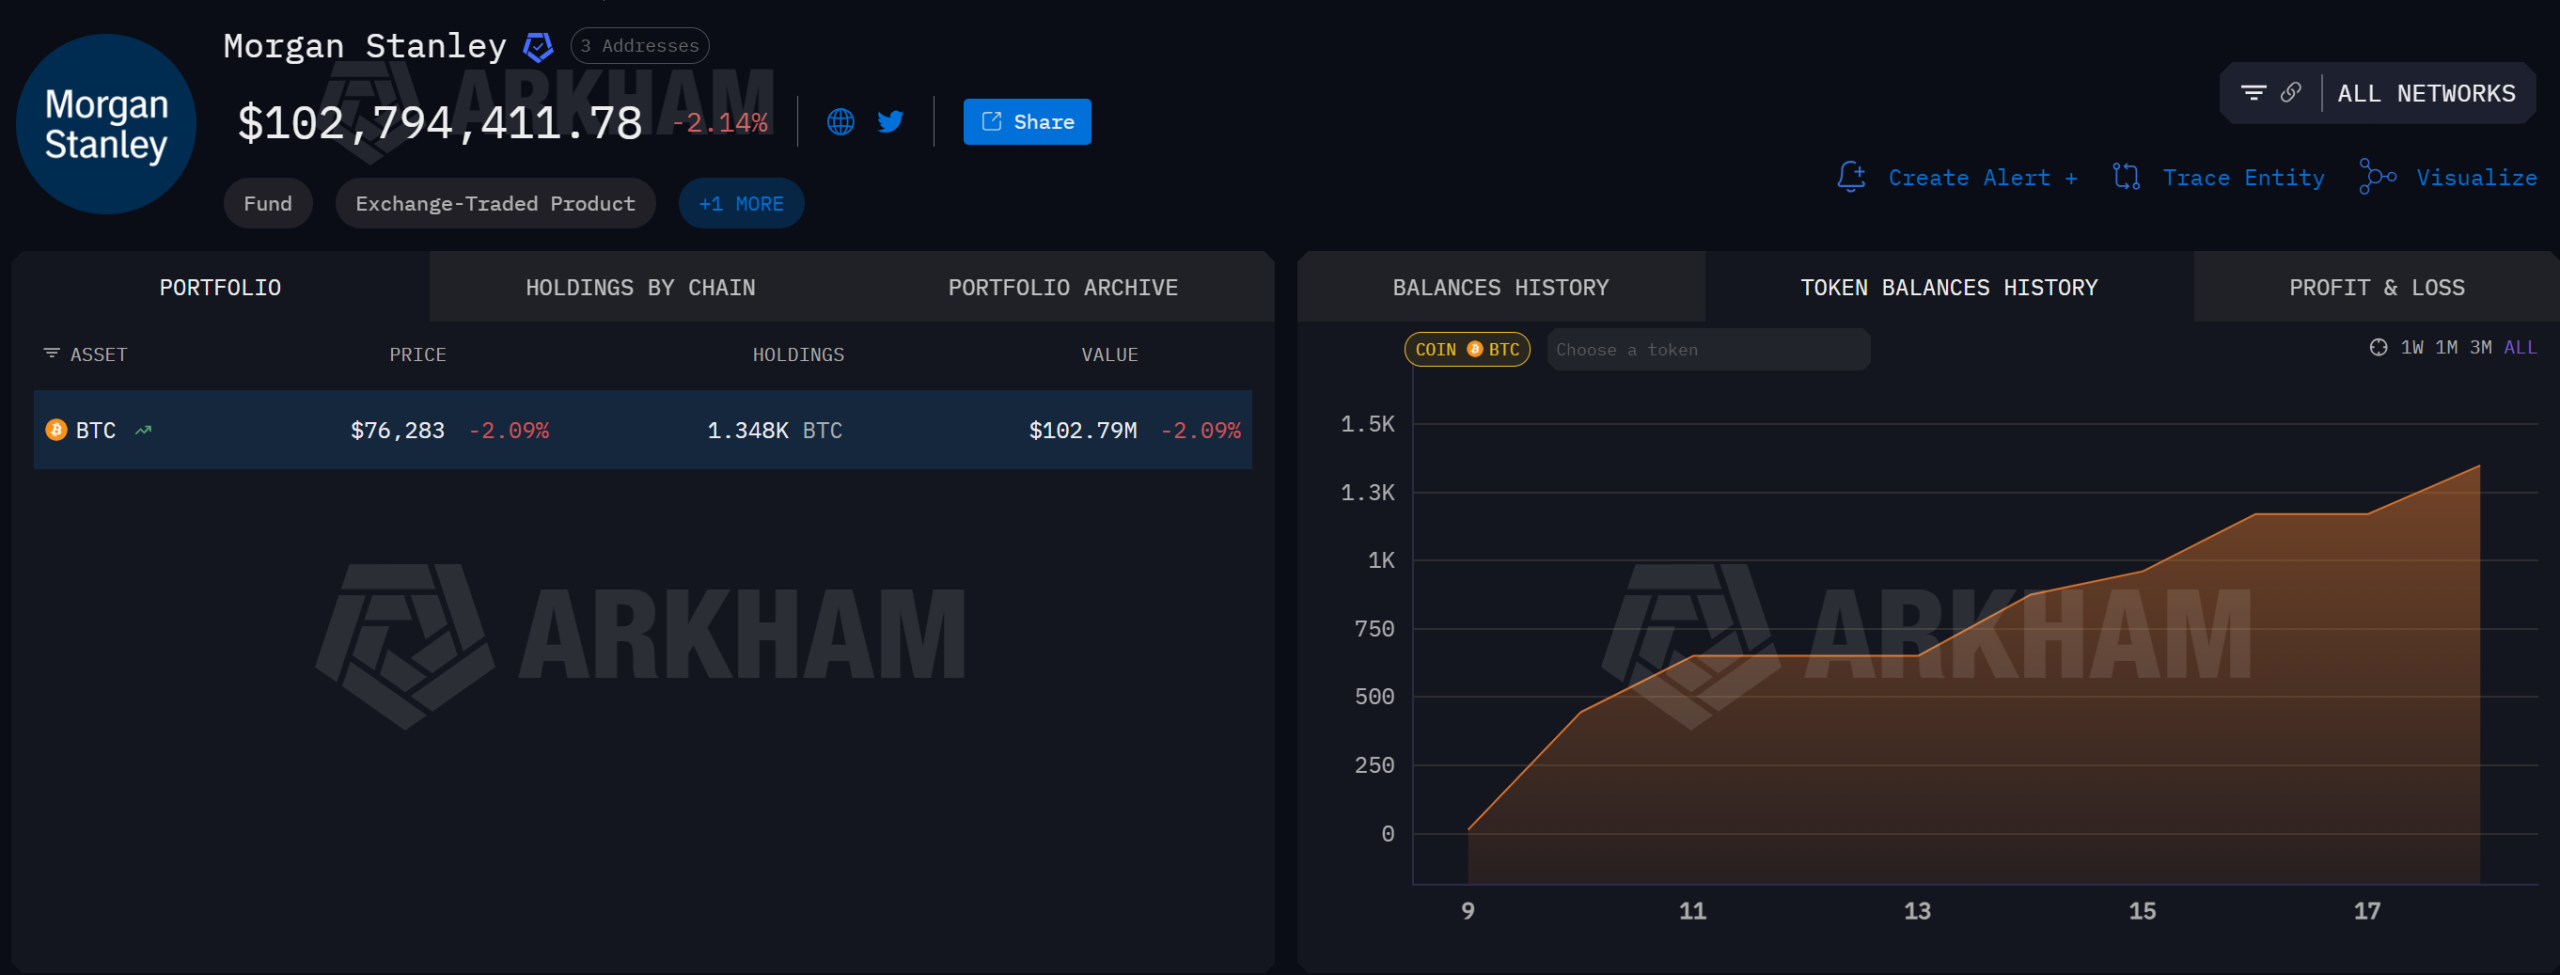
Arkham Intelligence has identified the on-chain wallets behind Morgan Stanley’s new spot Bitcoin (BTC) ETF. The bank’s BTC holdings are now publicly traceable in near real time.
The Morgan Stanley Bitcoin Trust (MSBT) began trading on NYSE Arca on April 8. It is the first spot Bitcoin ETF issued by a major US bank.
Arkham Makes MSBT Holdings Visible
Arkham’s blockchain analytics team identified the custodian wallets used by MSBT with high accuracy before verifying them. Users can now monitor BTC inflows and outflows as they settle on-chain.
However, traditional finance operates on a T+1 settlement cycle. On-chain confirmations appear one day after allocation decisions are made. That structural lag means wallet data reflects yesterday’s moves, not today’s.
Since launch, MSBT has purchased roughly $102.79 million in BTC. On-chain holdings sit at approximately 1,348 BTC.

Bloomberg ETF analyst Eric Balchunas placed the debut in the top 1% of all ETF launches over the past year.
Low Fees Target BlackRock’s Lead
MSBT charges 0.14% in annual fees, the lowest among US spot Bitcoin ETFs. BlackRock’s iShares Bitcoin Trust (IBIT) charges 0.25% and leads the market with roughly $57 billion in assets under management.
Morgan Stanley’s wealth management arm employs around 16,000 advisors overseeing $9.3 trillion in client assets. Even a modest allocation shift toward MSBT could generate substantial inflows over time.
Coinbase and BNY Mellon serve as digital asset custodians for the fund. Goldman Sachs and Charles Schwab are reportedly preparing competing crypto products, which suggests further fee pressure may follow.
The post Wall Street’s Biggest Wealth Manager Now Has a Public Bitcoin Wallet appeared first on BeInCrypto.
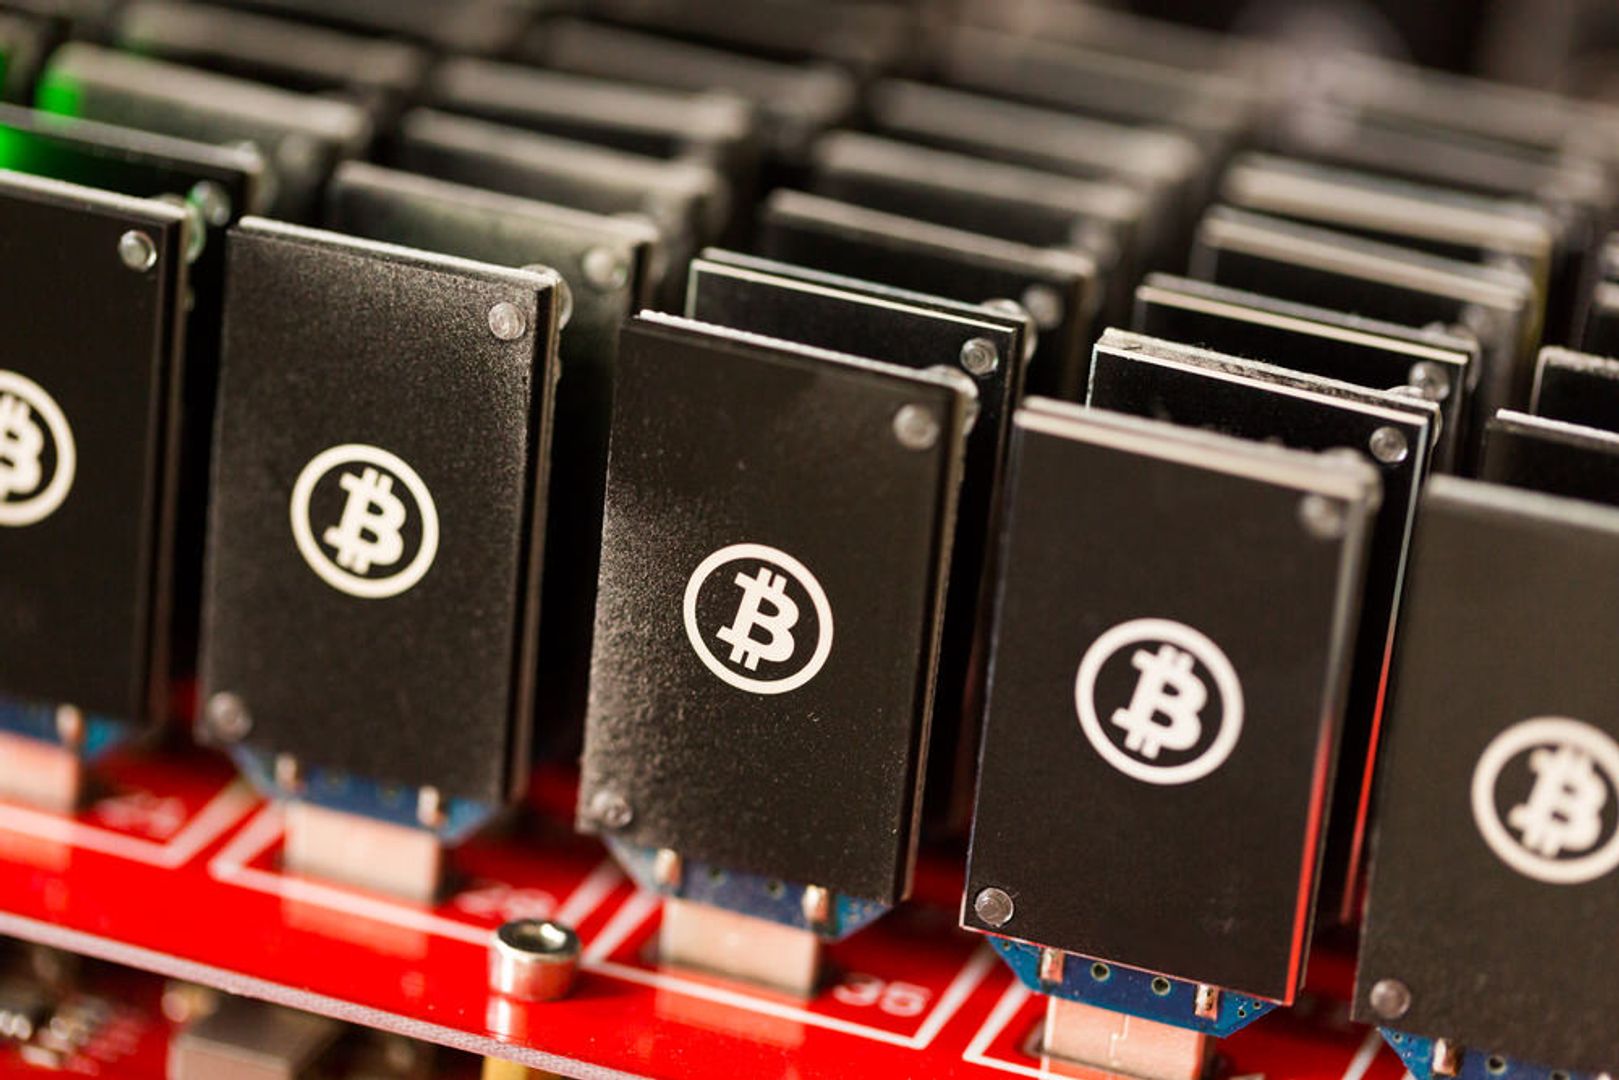

A bitcoin mining pool built to reject both the industrial pay-per-share model and the pure lottery approach has now proved its design works. Twice.
Upstart mining pool Parasite Pool mined block 945,601 on Friday morning, its second block since launching in April 2025 and roughly 48 days after the pool’s first block at #938,713 in late February.
The block carried 7,398 transactions and 0.002 BTC in fees, landing with bitcoin trading at $76,213.
The pool operates on a hybrid model that has no parallel in mainstream mining. A winning miner that solves a block receives 1 BTC outright, with the remaining 2.125 BTC plus fees distributed proportionally among all pool participants based on shares submitted since the previous block.
There are no fees to take part in this pool, and payouts are routed through the Lightning Network.
Mining secures bitcoin by having computers compete to solve a cryptographic puzzle every 10 minutes, with the winner earning the right to add the next block of transactions to the blockchain and collecting a reward.
That reward is currently 3.125 BTC plus whatever transaction fees are bundled in, worth about $238,000 at Friday’s price, down from 6.25 BTC after the April 2024 halving and scheduled to drop again to 1.5625 BTC in 2028.
The competition is dominated by industrial operators running warehouse-scale facilities of specialized ASIC hardware that pulls enough electricity to rival a small city.
Mining pools exist to smooth the variance of who finds blocks, bundling the hashrate of thousands of participants so the proceeds get split by contribution rather than winner-take-all.
Parasite is founded by ZK Shark, the pseudonymous creator of Ordinal Maxi Biz (an NFT collection on Bitcoin), and targets the home miner.
Pure solo pools like CKpool pay the full block reward minus a 2% fee to the finder, but statistical reality means the vast majority of participants never see a block.
But Parasite’s answer is to split the difference. The 1 BTC finder’s fee preserves the lottery payday, while proportional distribution of the remainder keeps satoshis flowing to participants during the stretches between blocks.
The second block carries more weight than the first. The pool retained hashrate through the 48-day gap between payouts, and the proportional distribution mechanics now have two rounds of real validation rather than one.
Parasite’s hashrate currently sits at 52 petahashes per second, down from a peak of 182 PH/s in June 2025, according to the pool’s dashboard. That works out to roughly 0.005% of bitcoin’s estimated 1-zetahash network hashrate.
The pattern around solo and small-pool mining has been running hot.
CoinDesk reported earlier this year on a 230 terahash-per-second home miner who beat 1-in-28,000 odds to claim block 943,411 and a $210,000 reward, and on a separate operator who rented $75 of cloud hashrate to validate block 938,092 via CKpool for a $200,000 payday. Both wins followed the CKpool model of winner-take-all minus a 2% fee.
Parasite is the first pool at this scale to test whether a hybrid split keeps participants mining through the losing stretches. A third block inside the next two months would settle the case for Parasite’s model, while a six-month drought would suggest the first two were the easy ones.
Crypto World
Binance and Biget to probe RAVE’s 4,500% token surge as claims of insider-orchestrated rally grow
Binance and Bitget, two major cryptocurrency exchanges, have opened investigations into trading activity surrounding RaveDAO’s RAVE token, after onchain sleuth ZachXBT alleged insiders engineered a large short squeeze that drove the token’s rapid rise.
Crypto exchange Bitget’s CEO Gracy Chen said the exchange had “started investigating” the matter, while Binance CEO Richard Teng later said publicly that the platform was also looking into the claims and would “always” do its part to examine signs of market misconduct. Another exchange, Gate, was also mentioned in ZachXBT’s investigation.
ZachXBT has also personally offered a $10,000 bounty to whistleblowers who come forward privately to share evidence about the parties involved.
The little-known project rallied earlier in the week, leading to over $44 million in RAVE positions, most of which were bearish, getting liquidated in a single day. Those liquidations followed a 4,500% rally over the course of a week.
Still, the short squeeze highlighted the concentration of RAVE tokens within a small set of wallets. In fact, nearly 90% of its supply was in just three Gnosis Safe wallets at the time.
Investigators also flagged token transfers to exchanges shortly before the rally began. Millions of tokens were moved to exchanges before prices started surging.

RaveDAO presents itself as a Web3 project focused on electronic music events, offering blockchain-based ticketing and community governance. It traces its origins to a 2023 afterparty in Istanbul and has since hosted events across several regions. The project reported about $3 million in revenue in 2025.
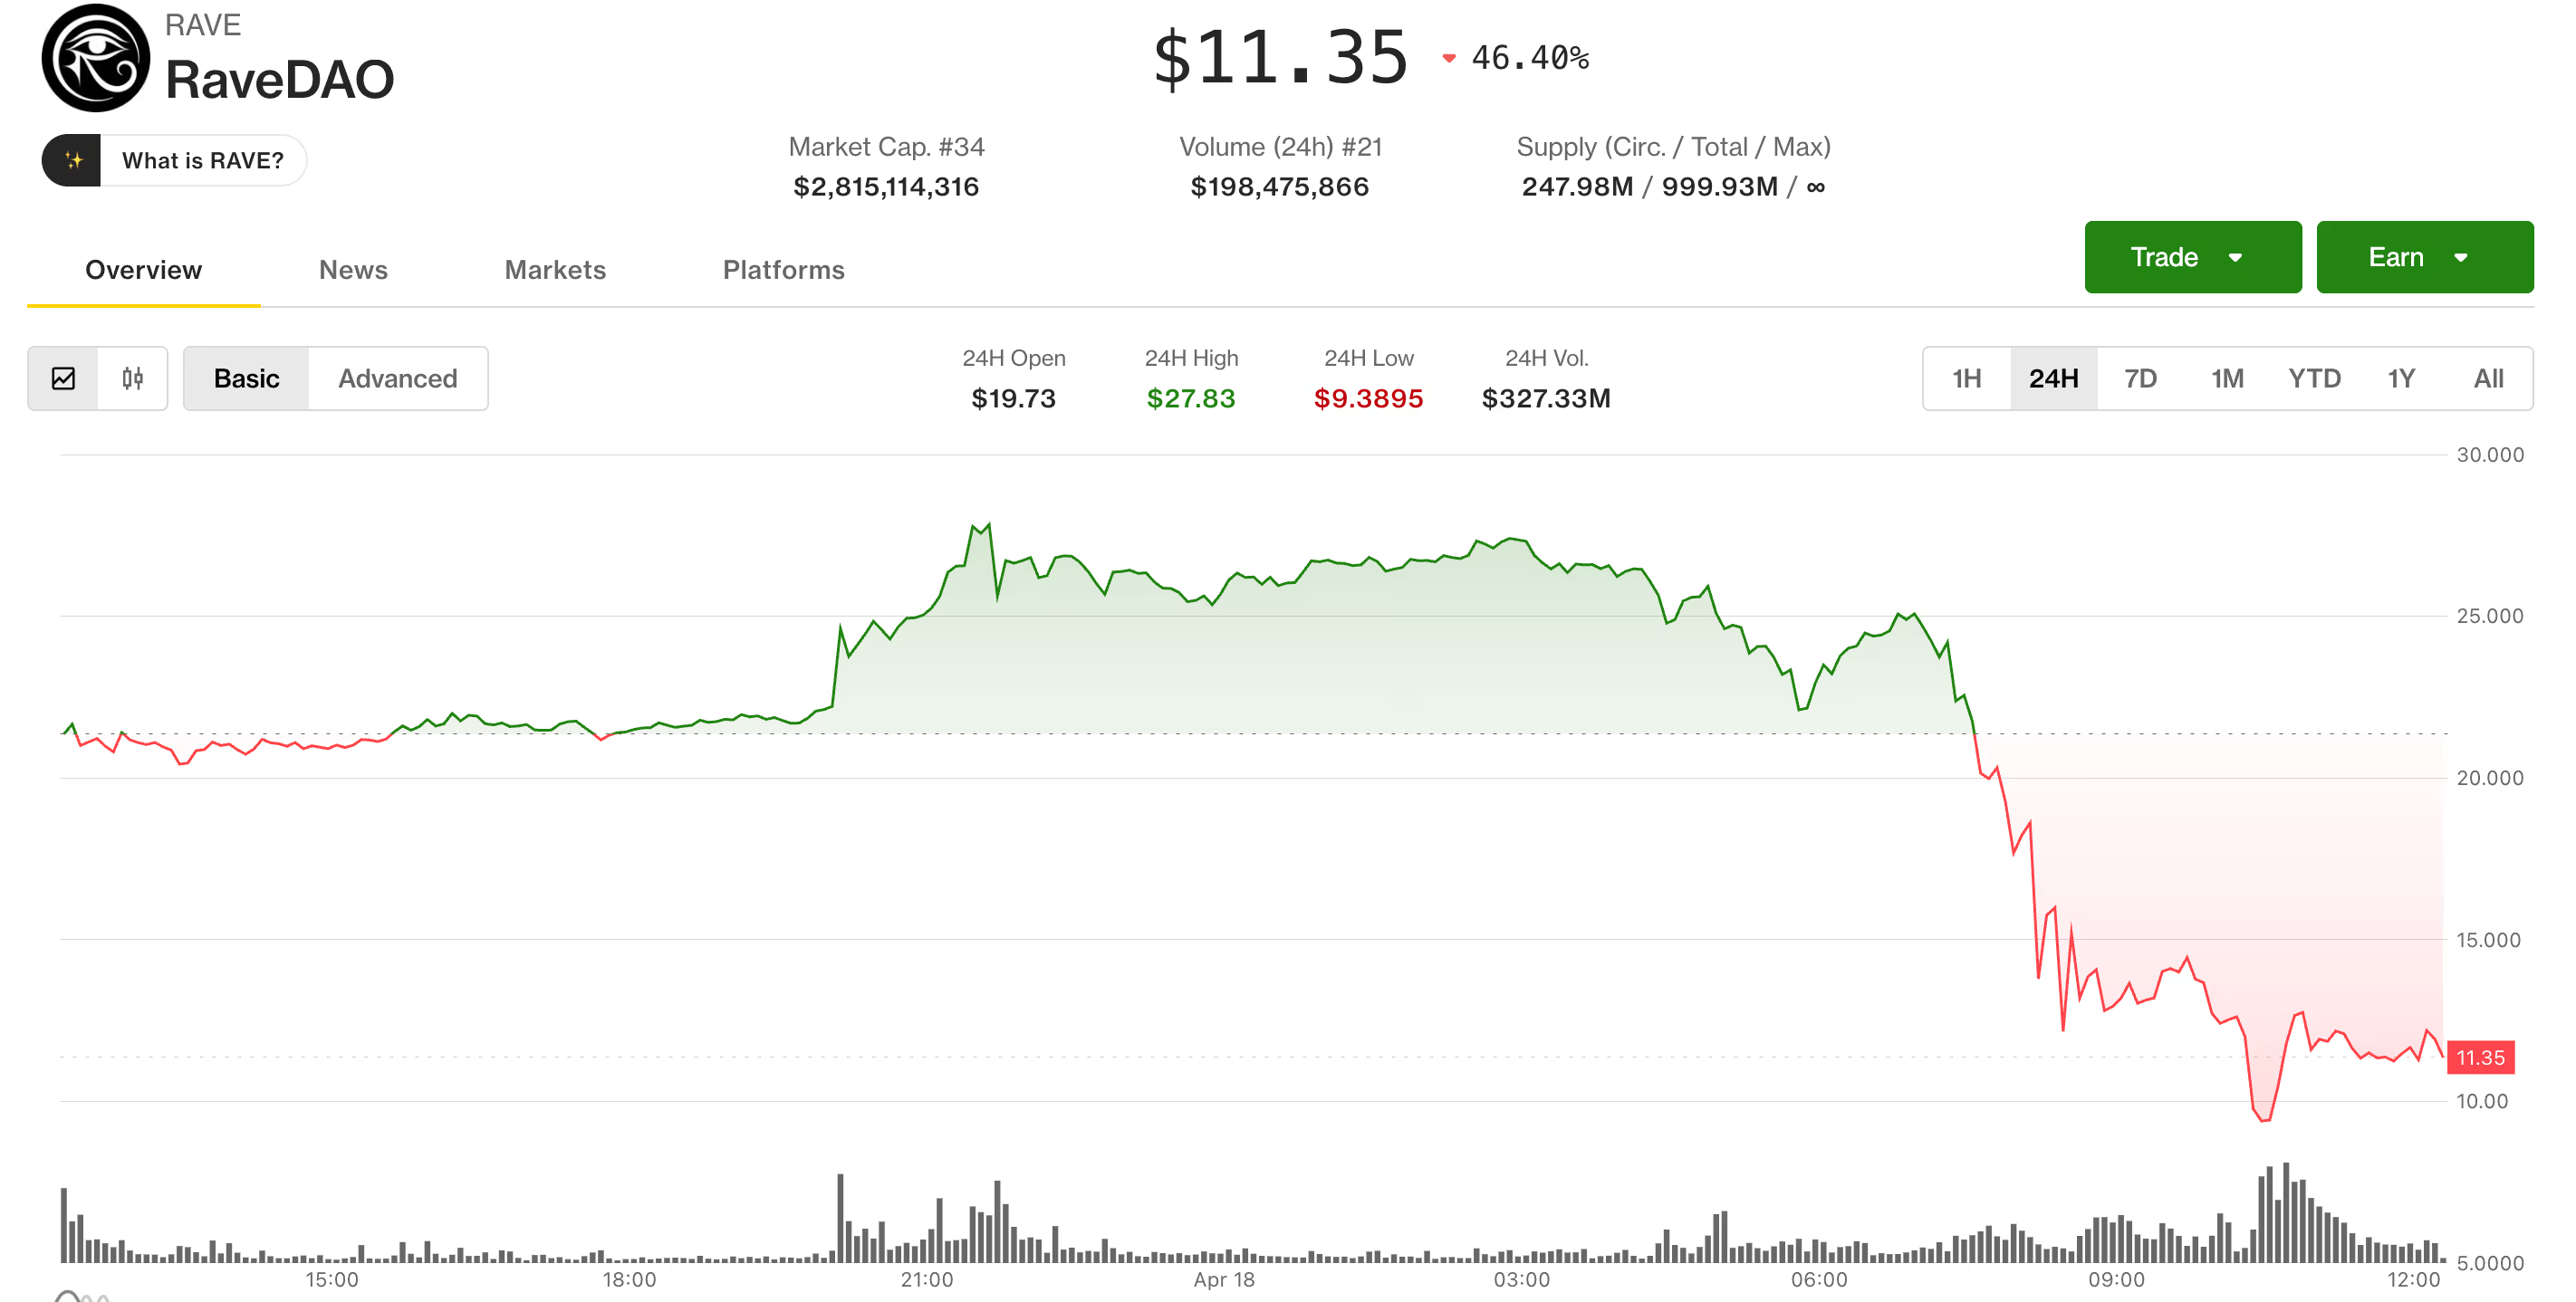
That footprint contrasts with the token’s market behavior. RAVE traded below $0.50 for most of its history before surging in April. It jumped from about $0.30 to over $6 in a single day, then climbed past $27 before starting to recede.
At its peak, the token’s market value briefly exceeded $6 billion, placing it among the largest cryptocurrencies by market cap before dropping. The token is now down more than 50% from its peak and 30% over the last 24 hours.
‘Bait and liquidate’
A separate claim centers on what some describe as a “bait and liquidate” pattern. The idea is that visible transfers suggest selling pressure, drawing traders into short positions.
If those tokens are later withdrawn while prices rise, short sellers may be forced to buy back at higher prices, driving further gains for those on the other side of the trade. These claims remain unproven, but the concentration of supply suggests it’s a real possibility.
Community reports have also linked the project to figures associated with earlier crypto ventures, including ARPA and Bella Protocol, though those connections have not been independently verified. None of the individuals named in these reports has responded publicly.
RaveDAO addressed the situation in a social media thread, stating that the team is “not engaged in, nor responsible for, recent price action.”
In the thread, RaveDAO did not address specific onchain allegations, including supply concentration or the millions transferred to exchanges ahead of the pump, but confirmed it does plan to liquidate portions of unlocked tokens “when appropriate.”
RaveDAO said it was “exploring appropriate models, including price-triggered or performance-triggered locks, that tie team incentives to ecosystem growth.” It stopped short of committing to any specific mechanism or timeline.
CoinDesk has reached out to RaveDAO for comments.

Crypto Breaking News is a fast-growing digital media platform focused on the latest developments in cryptocurrency, blockchain, and Web3 technologies. Our goal is to provide fast, reliable, and insightful content that helps our readers stay ahead in the ever-evolving digital asset space.
Web3 Digital L.L.C-FZ
License Number: 2527596
📞 +971 50 449 2025
✉️ info@cryptobreaking.com
📍Meydan Grandstand, 6th floor, Meydan Road, Nad Al Sheba, Dubai, United Arab Emirates
Justin Hartley Jokes He ‘Used to Have a Life’ Before Tracker

More Red Lion than Three Lions as YouTubers put on 20-goal show

Lululemon Athletica: China Growth & Full Priced Tailwinds Meet Uncertain Recovery


-
 NewsBeat6 days ago
Pep Guardiola and Gary Neville agree over Arsenal title problem that benefits Man City
-

 Crypto World5 days ago
The SEC Conditionalises DeFi Platforms to Be Avoided for Broker Registration
-

 Politics6 days ago
World Cup exit makes Italy enter crisis mode
-

 Fashion1 day ago
Weekend Open Thread: Theodora Dress
-

 Crypto World5 days ago
SEC Signals Exemption for Crypto Interfaces From Broker Registration
-

 News Videos3 days ago
Secure crypto trading starts with an FIU-registered
-

 Sports1 day ago
NWFL Suspends Two Players Over Post-Match Clash in Ado-Ekiti
-

 Crypto World5 days ago
SEC Proposes Certain Crypto Interfaces Don’t Need to Register as Brokers
-

 NewsBeat4 days ago
Trump and Pope Leo: Behind their disagreement over Iran war
-

 Politics22 hours ago
Palestine barred from entering Canada for FIFA Congress
-
 NewsBeat6 days ago
JD Vance announces ‘no agreement’ with Iran over nuclear weapons fear
-

 Crypto World20 hours ago
Russia Pushes Bill to Criminalize Unregistered Crypto Services
-

 Sports5 days ago
NWFL opens Pathway for new Clubs ahead of 2026 Season
-
 Business2 days ago
Creo Medical agree sale of its manufacturing operation
-
Sports6 days ago
Dexter Lawrence, Stefon Diggs, Trading for De’Von Achane
-

 Crypto World5 days ago
Trump whales load up ahead of Mar-a-Lago luncheon.
-
Crypto World6 days ago
Sei Network Enters Quiet Reset Phase as On-Chain Metrics Signal a Slowdown in 2026
-
Business5 days ago
Kering slides after Morgan Stanley downgrade, Gucci woes loom
-
 Entertainment5 days ago
Karol G’s ‘Ultra Raunchy’ Coachella Set Gave ‘Satanic Vibes’
-
 Entertainment5 days ago
Brand New Day’ Footage Reveals the Devastating Impact of ‘Now Way Home’
You must be logged in to post a comment Login