Cryptocurrency
Bithumb earned millions through dark pattern tactics, South Korean lawmaker says

A South Korean lawmaker accused Bithumb of using dark patterns to charge users higher fees than advertised.
Cryptocurrency exchange Bithumb earned more than 140 billion won (nearly $97.6 million) in extra fees by using unclear processes that misled users, The Maeil Business Newspaper reports, citing a South Korean lawmaker.
Kim Jae-sup, a member of the People’s Power party, revealed that Bithumb earned 672.79 billion won in total fees between February 2023 and February 2024, referring to data submitted by the Financial Supervisory Service.
During the period, Bithumb advertised a “lowest commission in Korea” of 0.04%. In reality, however, the average commission rate charged to actual users was 0.051%, Kim added. As a result, consumers faced an additional fee of about 140.91 billion won, the lawmaker emphasized.
Kim explained that Bithumb failed to properly notify users that they needed to register a coupon to receive the minimum fee rate. The South Korean lawmaker suggested that such a practice seems to be a typical dark pattern, a deceptive scheme where a user interface is carefully crafted to trick users into doing things they didn’t mean to.
The lawmaker also highlighted that the extra fee burden was heavier on older users. “The damage to the middle-aged who may have difficulty recognizing or carrying out the coupon registration process is even more serious,” Kim said. The lawmaker urged regulators to step in, saying the Financial Services Commission and the Fair Trade Commission should take strong action to stop this kind of consumer deception.
Bithumb successfully returned to profitability in 2024, with revenue increasing by 265.4% year-over-year.
Per data from the Financial Supervisory Service’s electronic disclosure system, Bithumb posted an operating profit of 130.7 billion won (around $90.1 million) last year, marking a turnaround from losses as the exchange had recorded an operating loss of 14.8 billion won in 2023. Net profit for 2024 surged 565.8% year-over-year to 161.8 billion won (nearly $111.2 million).


U.S. stocks were mixed amid uncertainty over trade, while Nvidia earnings boosted investor sentiment.
Markets reacted positively to Nvidia’s latest earnings, but tariff-related news continued to weigh on investor confidence. On Thursday, May 29, the tech-focused Nasdaq rose 35 points, or 0.18%. At the same time, the Dow Jones slipped 0.04%, while the S&P 500 gained a modest 0.15%.
Traders are focusing on the latest legal challenge to Trump’s trade policy. Judges at the US Court of International Trade blocked Trump’s tariffs on Wednesday, May 27. According to the legal body, the president does not have the authority to impose such sweeping tariffs.
The White House responded with a formal notice of appeal. A spokesperson added that “unelected judges” should not dictate policy to the president, calling the situation a “national emergency.”
The legal battle, which might eventually arrive before the Supreme Court, will likely take some time. In the meantime, Trump has several options to try and circumvent the ruling, including imposing more limited tariffs.
Traders are excited over Nvidia’s AI supercomputer
Nvidia’s stock was up post earnings call, gaining 2.69%, despite just barely hitting projections. The chipmaker reported revenue of $44.1 billion and EPS of 96 cents versus expectations of $43.31 billion and 93 cents per share.
Revenue was up 69% year over year, and investors were enthusiastic about the announcement of Nvidia’s new Blackwell NVL72 AI supercomputer. The “thinking machine,” as CEO Jensen Huang described it, is now in full-scale production. He also noted that demand for Nvidia’s AI infrastructure remains strong.

TL;DR
- Bitcoin continues to show signs of strength, with indicators pointing toward sustained interest and potential for continued growth.
- While sentiment is overwhelmingly positive, similar conditions in the past have sometimes preceded sharp corrections, reminding investors to stay vigilant.
The Bullish Elements
Bitcoin (BTC) made history on May 22 by surging to nearly $112,000 – its highest level ever. Since then, it has pulled back to $108,600 (according to CoinGecko), but several factors suggest that there is still fuel left for further gains.
Earlier today (May 29), the popular analyst Ali Martinez revealed that more than 30,000 BTC have been moved off exchanges in the last 30 days. Calculated in current rates, the stash equals over $3.2 billion.
Such a development suggests that investors have shifted from centralized platforms to self-custody solutions, which reduces the immediate selling pressure.
According to CryptoQuant’s data, the asset’s supply on exchanges currently stands at less than 2.45 million BTC, which is the lowest point observed since the summer of 2018.
The following factor is the growing inflows toward the spot Bitcoin ETFs. Data compiled by SoSoValue shows that the last day with a negative daily netflow was May 13. Since then, the funds have attracted over $4.1 billion in the span of just a couple of weeks.
BlackRock’s iShares Bitcoin ETF (IBIT), for instance, has recorded 33 consecutive days of inflows, accumulating nearly $4 billion over the last two weeks. The investment vehicle now ranks among the top five ETFs (out of over 4,200 products) in terms of inflows for 2025.
Last but not least, we’ll take a look at BTC’s Market Value to Realized Value (MVRV) ratio. As the name suggests, it compares bitcoin’s market capitalization to its realized capitalization and helps traders identify whether the asset is undervalued or overvalued.
Over the past month, the ratio has been hovering in the healthy zone of 2-2.50, indicating that there is still room for price growth. CryptoQuant claims that historically, values above 3.70 have indicated market tops, while figures below 1 have pointed out bottoms.

Something for the Bears
Contrary to the optimistic landscape, there are some concerns to consider. IntoTheBlock’s data shows that, as of the moment, no single BTC investor is sitting on paper losses, while a staggering 98% have made some profits (at least on paper) on their initial investments.
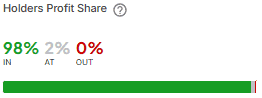
This might sound encouraging, but in the past, such trends were sometimes followed by a price pullback. In October 2024, about 95% of BTC holders were in profit as the asset’s valuation topped $69,000 before briefly falling below $65,500. A similar pattern was also seen in September and March last year.
As reported earlier today, Santiment also believes that such high numbers of investors in profit could spell trouble for the asset as they tend to realize profits.
We now move on to the popular Fear & Greed Index, whose ratio has been in either “Greed” or “Extreme Greed” territory since May 5. The metric examines various factors, including price fluctuations, survey responses, and social media activity, to assess the ongoing investor sentiment toward the cryptocurrency.
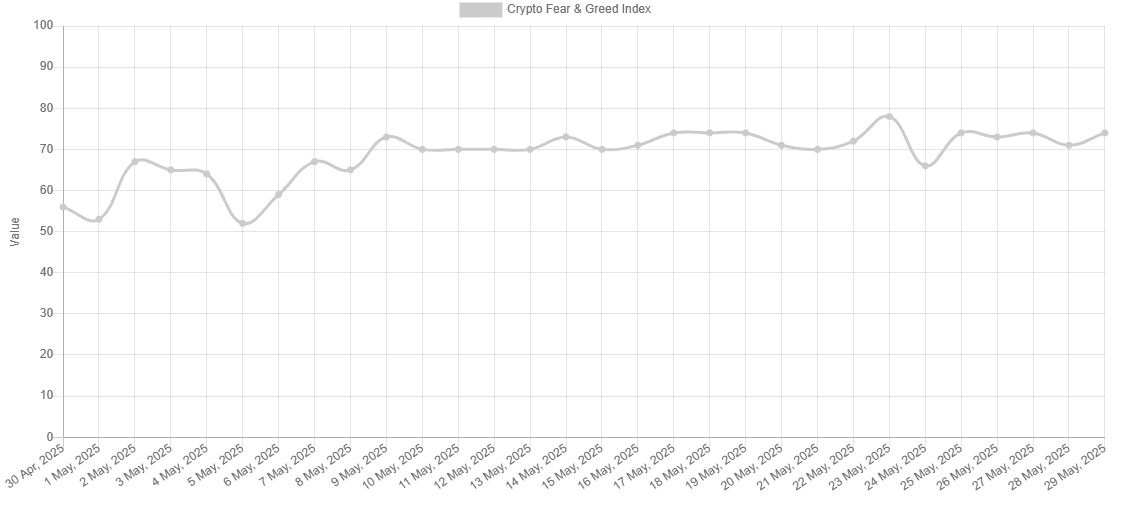
It appears that there is growing optimism and an increasing appetite for BTC, but let’s not forget that the crypto market is unpredictable, and price movements often defy the crowd’s expectations. One should also keep in mind Warren Buffett’s famous advice, who once said people should “be fearful when others are greedy and to be greedy only when others are fearful.”
Binance Free $600 (CryptoPotato Exclusive): Use this link to register a new account and receive $600 exclusive welcome offer on Binance (full details).
LIMITED OFFER for CryptoPotato readers at Bybit: Use this link to register and open a $500 FREE position on any coin!

Reason to trust
![]()
Strict editorial policy that focuses on accuracy, relevance, and impartiality
Created by industry experts and meticulously reviewed
The highest standards in reporting and publishing
Strict editorial policy that focuses on accuracy, relevance, and impartiality
Morbi pretium leo et nisl aliquam mollis. Quisque arcu lorem, ultricies quis pellentesque nec, ullamcorper eu odio.
Crypto analyst Egrag Crypto has made a bold prediction that the XRP price can hit a $1.5 trillion market cap. He revealed how the altcoin can achieve this milestone by alluding to technical indicators, which show the measured move from this current market cap to a $1.5 trillion market cap.
How The XRP Price Can Reach $1.5 Trillion Market Cap
In an X post, Egrag Crypto stated that the Logarithmic move could send the XRP price to around $1.5 trillion market cap, exceeding the Fib 1.618 by approximately $500 billion. Meanwhile, the Non-Logarithmic move will put the altcoin at around $270 billion, aligning with the Fib 1.618.
Related Reading
The crypto analyst remarked that he sees two potential growth levels by measuring the previous cycle, the move from Fib 1.0 to Fib 1.618. Based on this, he predicts a 242% increase and a 600% increase. He then highlighted the four possible targets from the lowest to the highest. The first is the projected XRP price rally to a $270 billion market cap in line with the non-logarithmic measured move.

The second target is a 242% XRP price rally to a $450 billion market cap, backing the previous cycle’s move from Fib 1.0 to Fib 1.618. The third target is another 242% rally to a $978 billion market cap. Meanwhile, the rally to a $1.5 trillion market cap is the last target, with the Non-Log W pattern measured move for maximum potential.
Egrag Crypto highlighted what the XRP price could be based on its current circulating supply of 58.68 billion if it reaches these market cap targets. The altcoin’s price will be $4.60, $7.66, and $16.65 if it reaches the $270 billion, $450 billion, and $978 billion market caps, respectively. Meanwhile, XRP will hit $25.56 if it reaches the $1.5 trillion market cap milestone.
Another Analysis To Support This Price Projection
In another X post, Egrag Crypto predicted that the XRP price can reach between $13 and $22 based on his analysis of the altcoin’s yearly chart. He stated that candle 13 will be the breakout candle, which will lead to the rally to $13 or $22, with the wick potentially extending even higher.
Related Reading
He noted that by analyzing Candle 9, the 2021 yearly candle, and its full body move of an 800% gain, applying this increase to Candle 13 points to an XRP price target of around $17. He added that this aligns perfectly between Line 1 at $13 and Line 2 at $22. It is worth mentioning that Egrag Crypto has also predicted that the altcoin could rally to $27 in 60 days, aligning with the $1.5 trillion market cap projection.
At the time of writing, the XRP price is trading at around $2.28, down in the last 24 hours, according to data from CoinMarketCap.

Featured image from Getty Images, chart from Tradingview.com


-

 Gym & Fitness4 weeks ago
9 Exercises To Grow Arms at Home | Increase Arm Strength Without Equipment
-
Gym & Fitness6 days ago
Good Morning America Full Broadcast — Monday, May 19, 2025
-
Entertainment1 month ago
Kim Zolciak & Kroy Biermann, Timeline of Their Relationship Drama
-
Gym & Fitness4 weeks ago
The Worst Mistake for a Flat Stomach
-
Entertainment2 weeks ago
The Weeknd And Jenna Ortega Star In A Dull Film
-
Gym & Fitness2 weeks ago
BECOME TALLER & GET SLIMMER /11 MIN FULL BODY EXERCISES ROUTINES TO GROW TALLER AT HOME_ Shrilyn
-
Gym & Fitness2 weeks ago
15-minute arm workout with dumbbells for biceps and triceps
-
Entertainment1 month ago
Kody Brown Kinda Regrets Telling Ex-Wives He Never Loved Them


