
Crypto World
BMNR stock on the verge of a rebound as BitMine Ethereum buying spree continues
The BMNR stock price rose by over 4% on Monday and retested the important resistance level at $20 as Ethereum rebounded and the company continued accumulating.
Summary
- BitMine stock rose on Monday as the company continued buying Ethereum.
- It now holds over 4.5 million ETH tokens worth over $9 billion.
- The stock has formed a falling wedge pattern, pointing to an eventual rebound.
BitMine stock rose to $20, inside a range it has remained in the past few weeks. This price remains much lower than the all-time high of $150.
In a statement, the company said that it continued accumulating Ethereum (ETH) tokens last week, making it the biggest holder in the world. It now holds 4.534 million tokens, which is equivalent to 3.76% of Ethereum’s total supply. Its Ethereum holdings are now worth over $9 billion.
The company hopes to continue accumulating its Ethereum holdings in the coming months. Its goal is to become a 5% owner of Ethereum, a goal it may achieve later this year or in 2026. It has staked 67% of these holdings and generated over $174 million in annualized revenue.
BitMine also owns 195 Bitcoin (BTC), currently worth over $13 million, a $200 million investment in Beast Industries, and $1.2 billion in unencumbered cash.
The company will likely do well, especially when a crypto market rally starts, which is a possibility when the war in Iran ends, which may happen as soon as this month.
BMNR stock price technical analysis
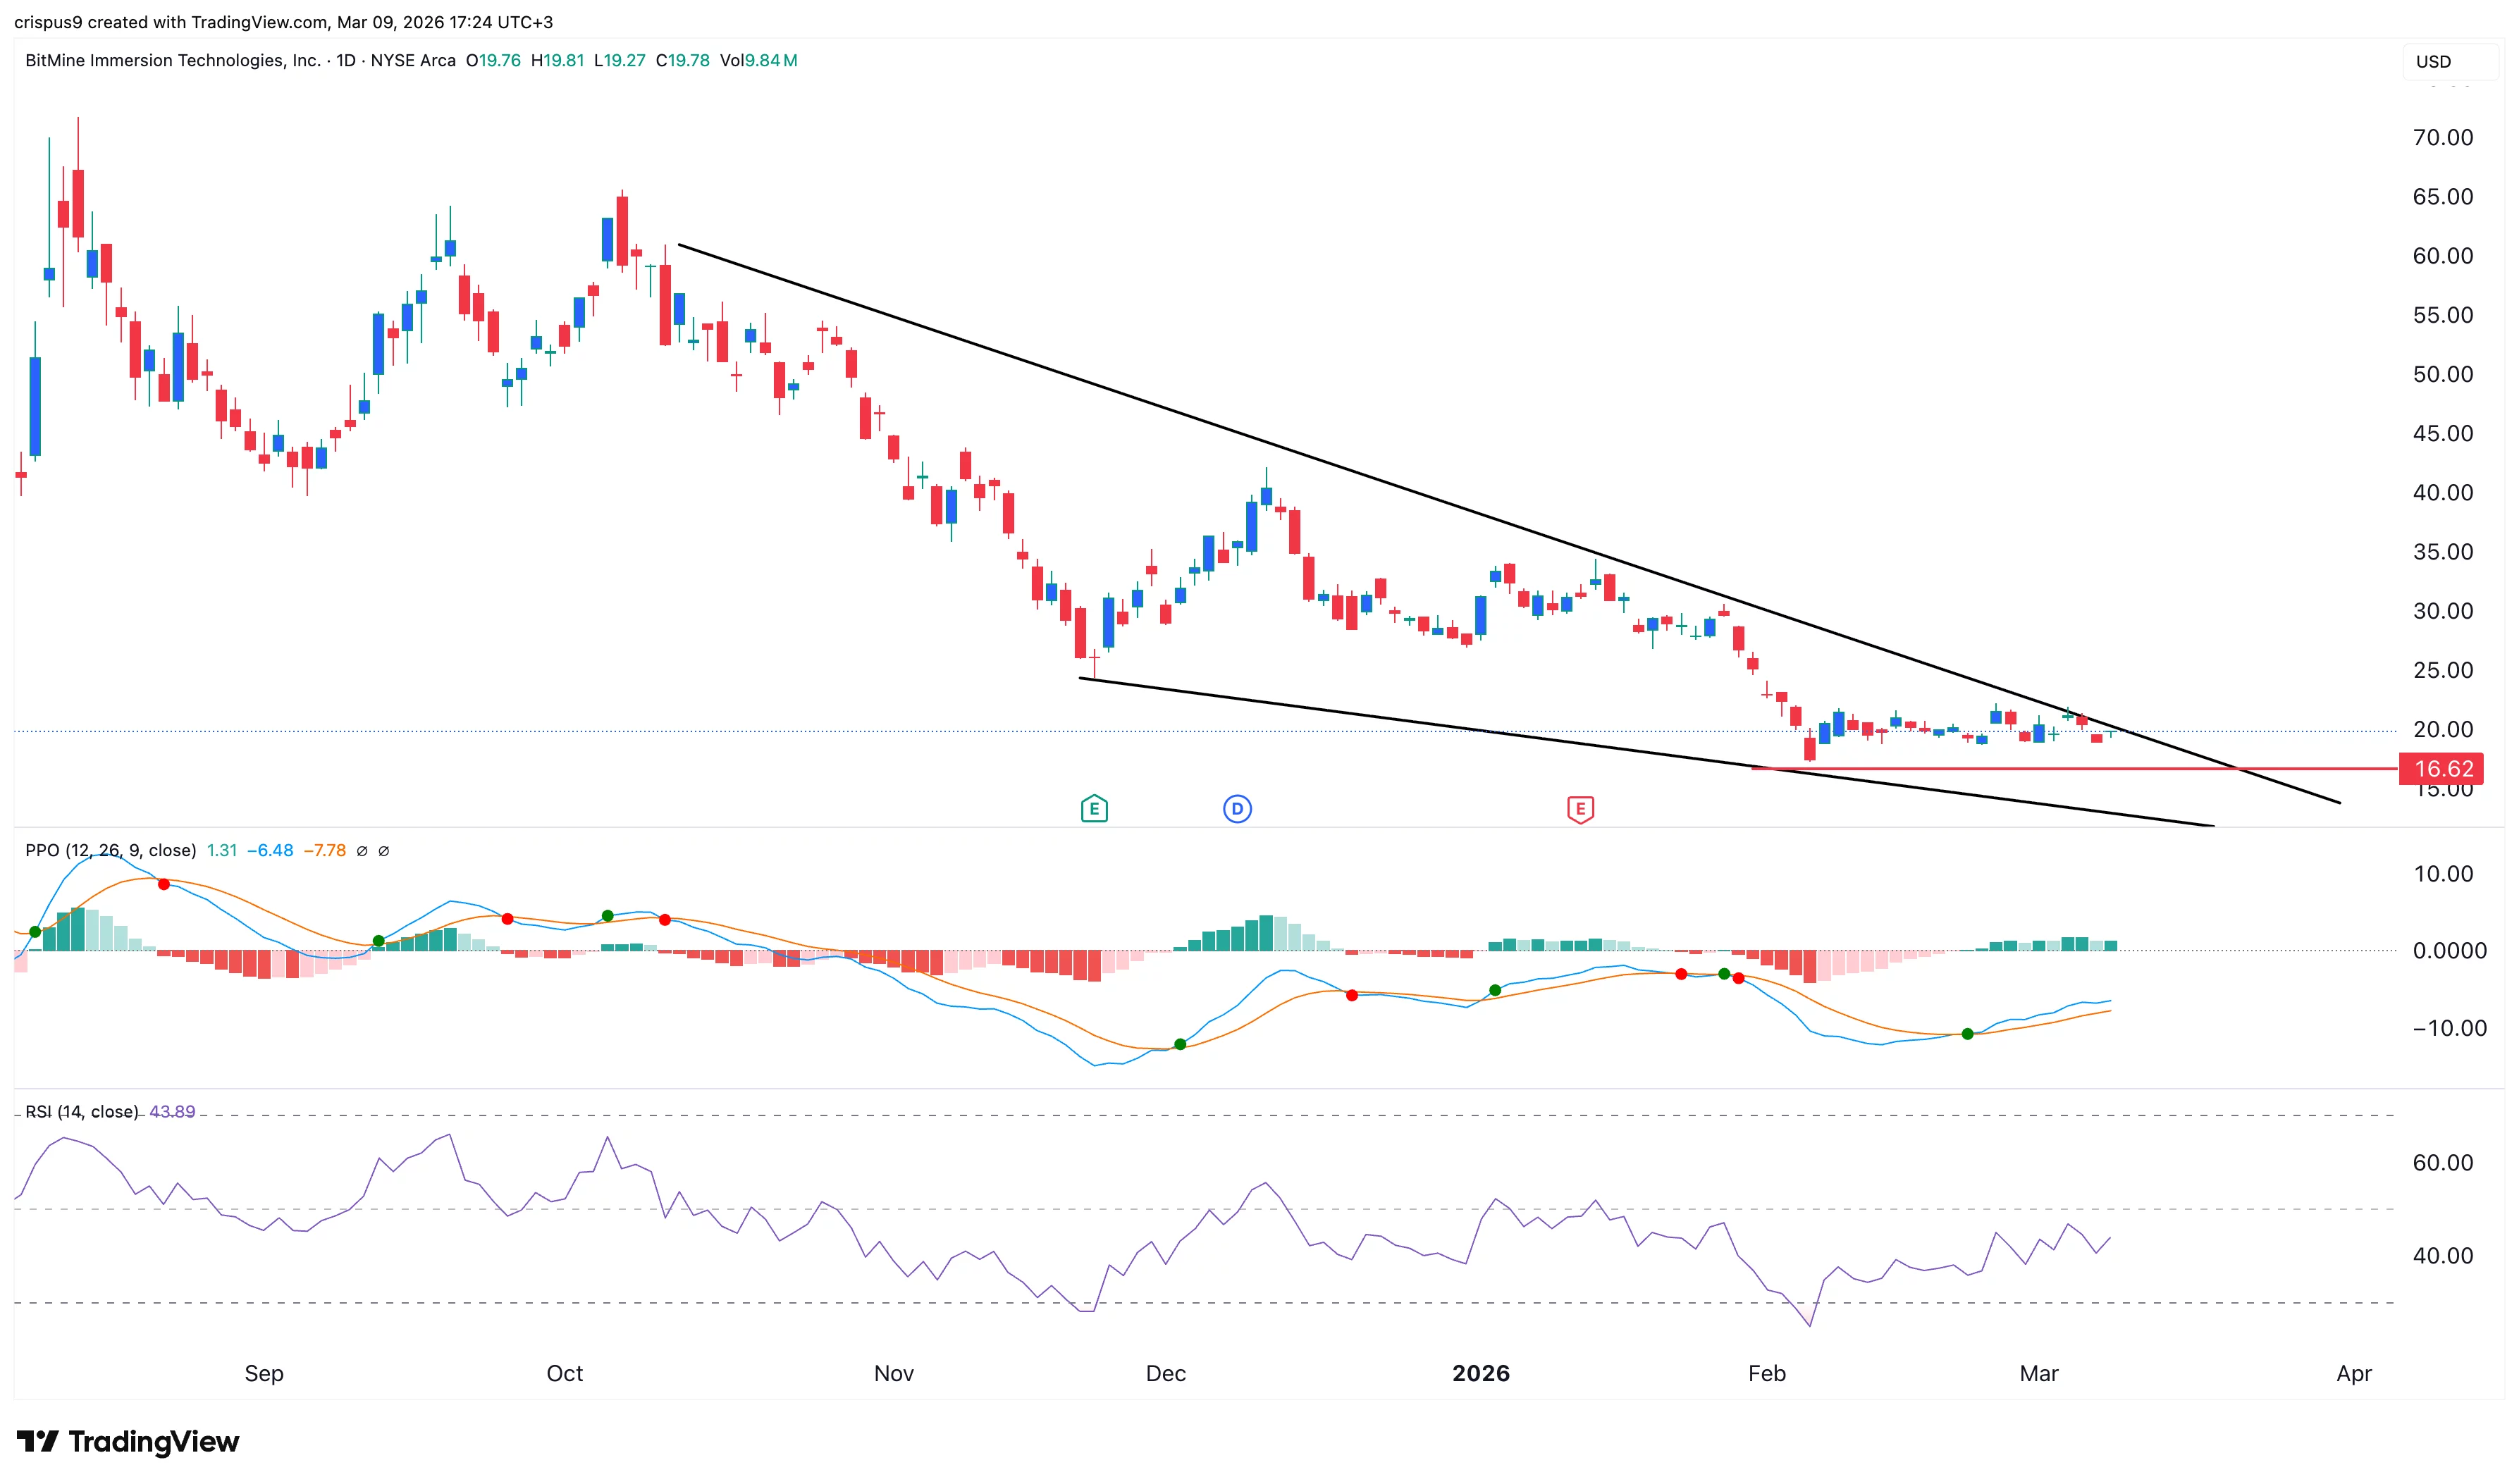
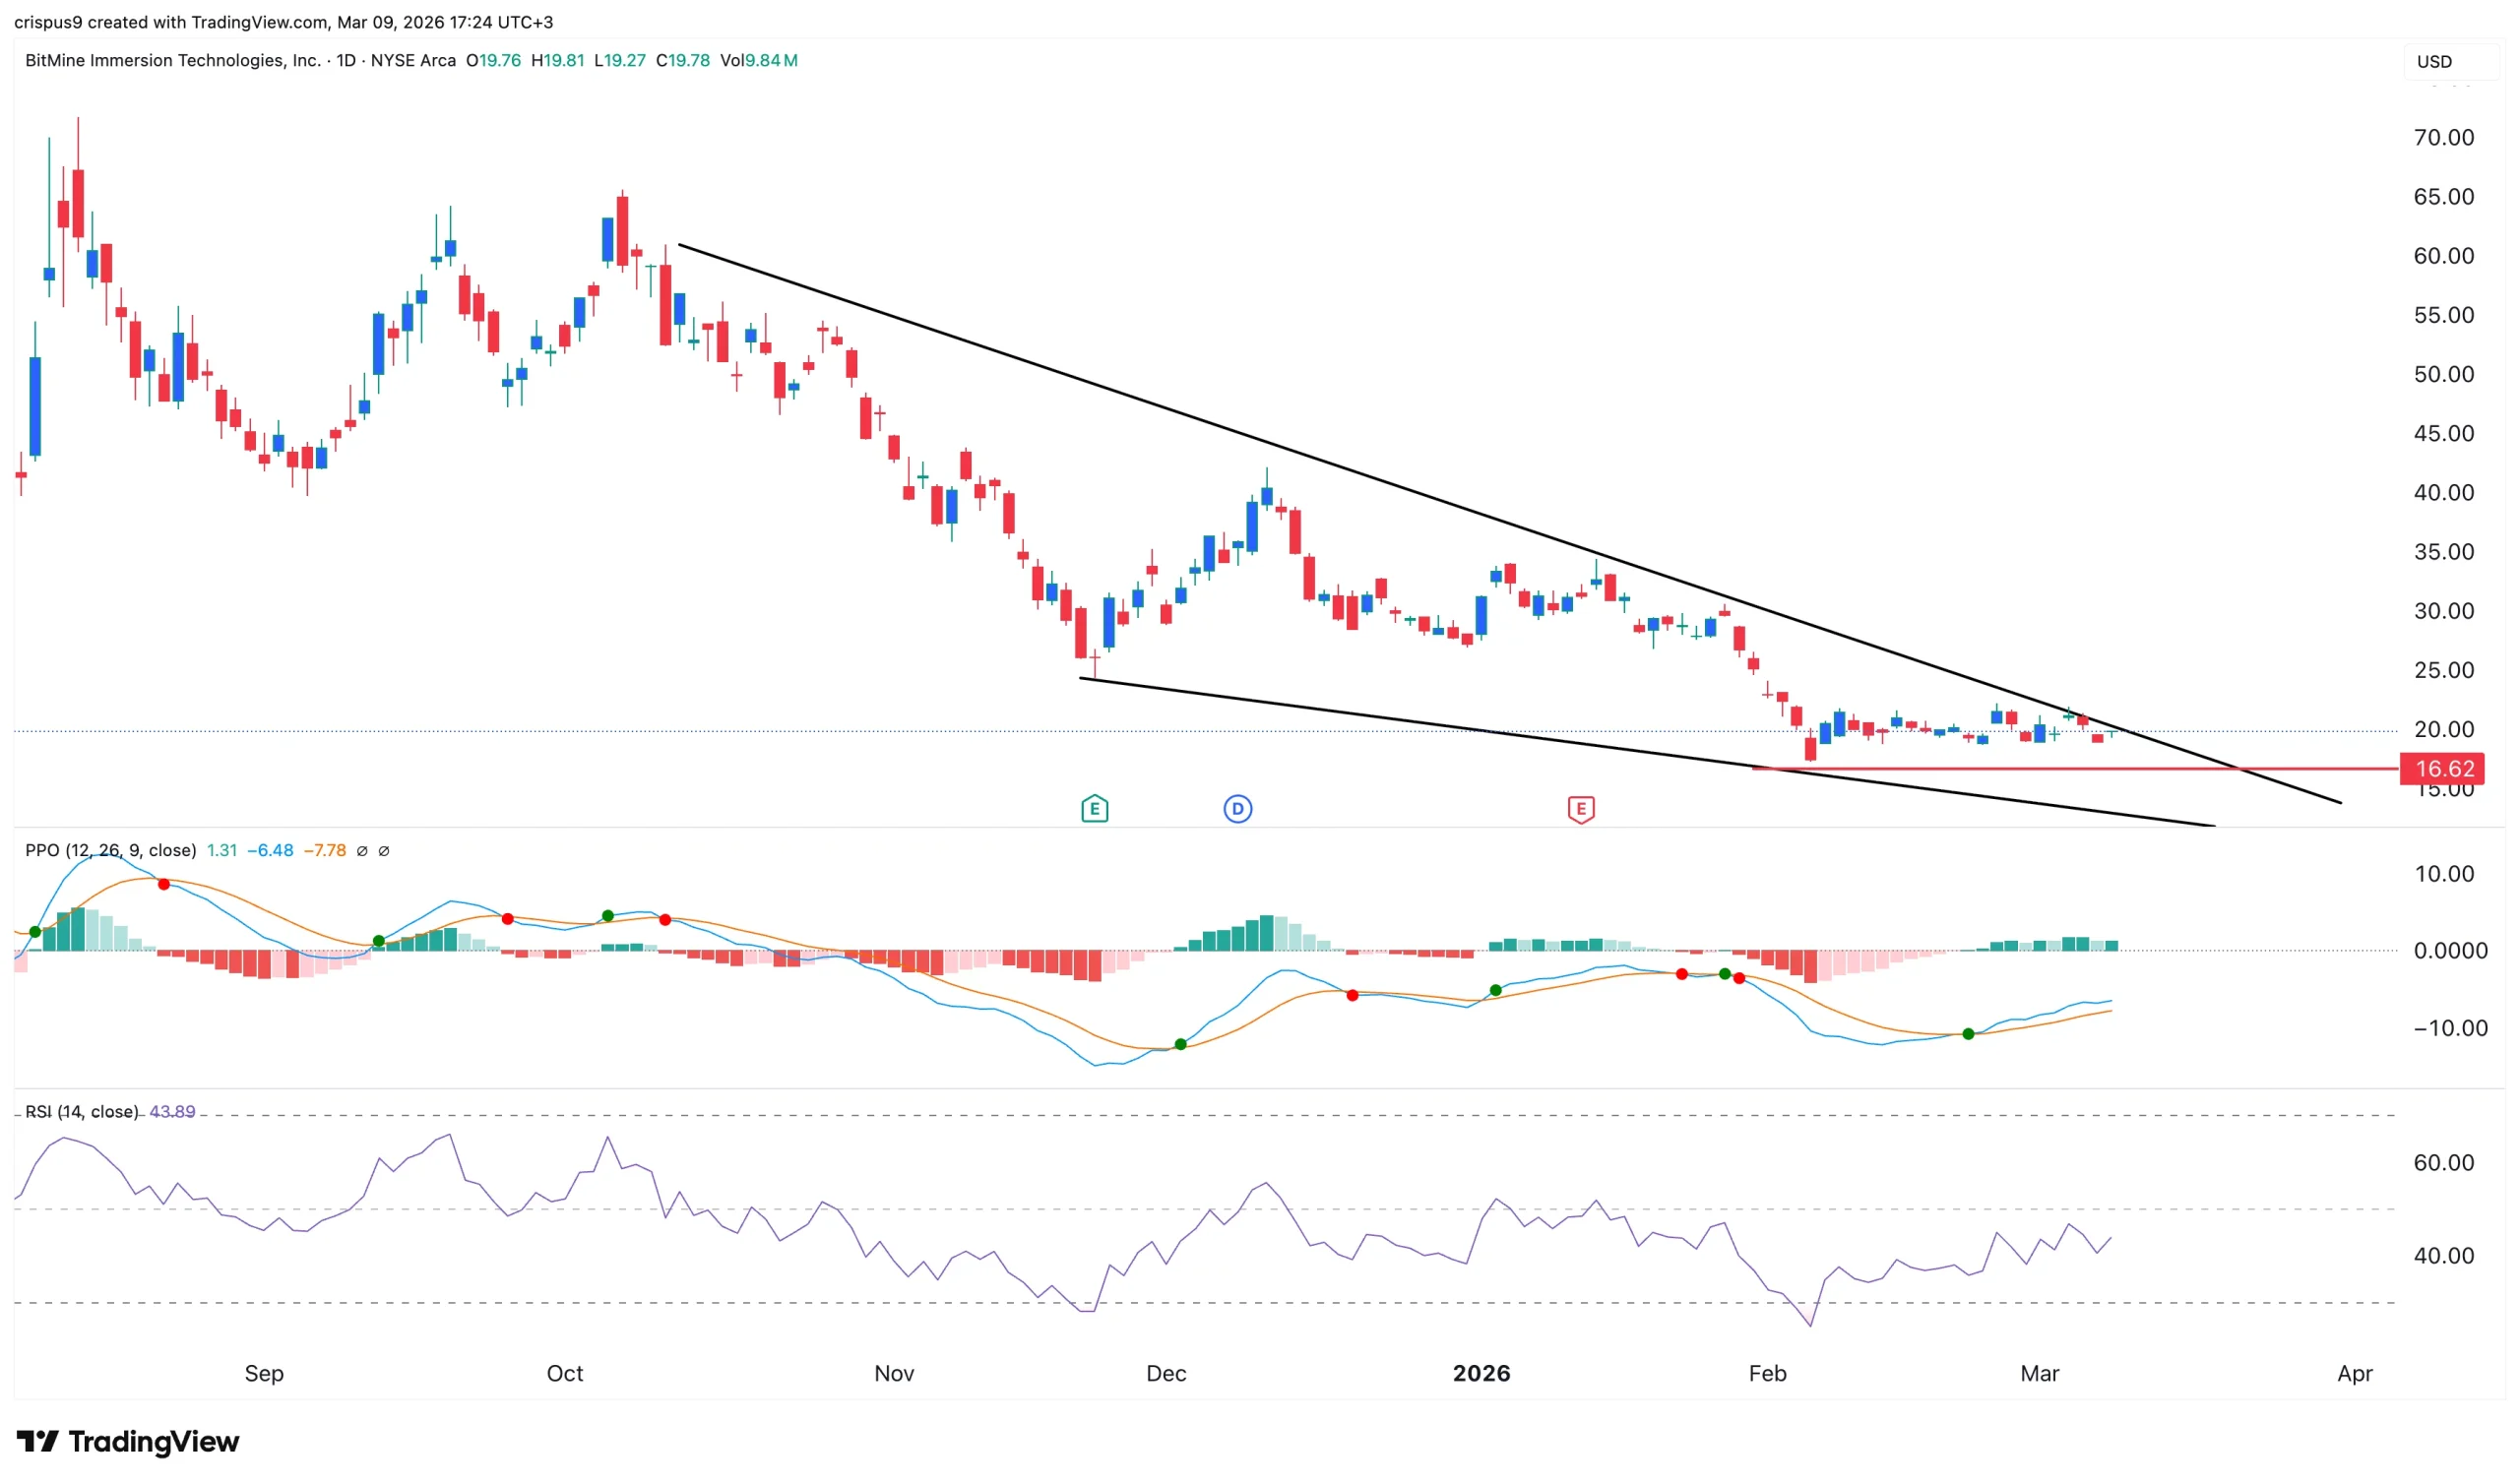
The daily chart shows that the BitMine share price has remained in a narrow range in the past month. It was trading at $20 on Monday, up modestly from the year-to-date low of $16.60.
The stock is along the upper side of the falling wedge pattern, a common bullish reversal sign in technical analysis.
It has formed a bullish divergence pattern as the two lines of the Percentage Price Oscillator have made a bullish crossover and are pointing upwards.
The Relative Strength Index has also moved from the oversold level of 25 in February to the current 43.
Therefore, there is a possibility that the stock will have a strong bullish breakout, potentially to the next key resistance level at 30. The bullish outlook will become invalid if it drops below the year-to-date low of $16.

Bitcoin price slipped toward its lowest levels of 2026 on April 4 as social sentiment also weakened.
Summary
- Bitcoin traded near $66,800 as Santiment showed bearish discussion reached its highest level since late February 2026.
- Retail traders turned cautious as spot demand weakened, while leverage remained elevated during Bitcoin’s latest pullback.
- Institutional buyers stayed active as ETFs, Strategy, and Metaplanet kept adding Bitcoin despite weak sentiment.
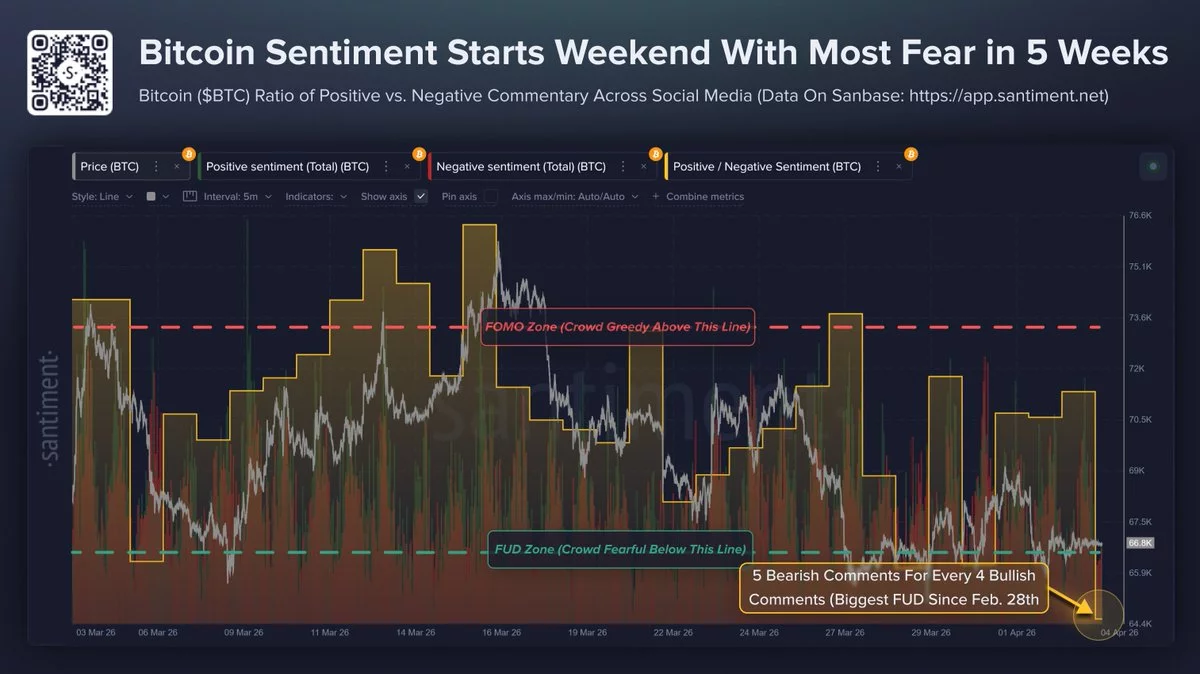
Data from Santiment showed bearish Bitcoin commentary rising across X, Reddit, and Telegram while the asset traded near $66,800.
Santiment said Bitcoin recorded its highest level of bearish discussion since February 28. The platform found that positive comments fell to 0.81 for every bearish comment, showing that negative talk now leads online discussion.
The shift came as crypto market volatility stayed high and pushed Bitcoin below the $70,000 mark. The data also showed that traders posted about five bearish comments for every four bullish ones across major social platforms.

Retail traders appeared more cautious as Bitcoin pulled back to one of its weakest levels this year. The drop in price and the rise in negative commentary pointed to growing fear, uncertainty, and doubt in the broader market.
Spot demand is weakening while leverage stays elevated. That suggests that buyers in the spot market have slowed down, even as leveraged positions remain active and add pressure during volatile trading sessions.
Institutions continue to buy
While retail sentiment weakened, institutional demand remained more stable. Bitcoin ETFs continued to attract attention, and corporate holders such as Strategy and Metaplanet kept adding exposure despite the latest market decline.
This contrast showed a clear split in market behavior. Smaller traders reacted to price weakness and online sentiment, while larger players focused on longer-term positioning during the current pullback.
As crypto.news recently reported, exchange supply keeps falling, but macro risks still cloud the setup. Lower exchange balances often suggest reduced selling supply, but broader economic pressure still affects market direction.
Disclosure: This article does not represent investment advice. The content and materials featured on this page are for educational purposes only.


Elon Musk’s X is rolling out a security feature that will automatically lock any account that mentions cryptocurrency for the first time — requiring additional verification before posting resumes — a direct response to a wave of account hijacking campaigns exploiting social trust to promote scam tokens.
Summary
- X Head of Product Nikita Bier confirmed the auto-lock feature, saying it targets the financial incentive behind crypto phishing attacks on the platform
- The measure follows a surge in account hijacking incidents, including the April 1 compromise of Predictfully founder Benjamin White’s account, which was used to push scam content and extort $4,000 from the real owner
- Bier estimates the feature should eliminate 99% of the incentive behind current phishing operations and called out Google for failing to block phishing emails at the Gmail level
The auto-lock triggers on an account’s first-ever cryptocurrency-related post. Once triggered, the account is locked, and the user must complete verification before regaining access. Bier described it as targeting the core attack vector: hackers gain account access through phishing emails, lock out the original owner, and use the account’s established follower trust to promote fraudulent tokens, fake giveaways, and memecoins.
“This should kill 99% of the incentive,” Bier wrote in response to a user’s account of how they lost control of their profile to a phishing attack disguised as a copyright violation notice. The attacker had used a pixel-perfect fake login page to harvest the user’s credentials and two-factor authentication codes before locking them out and beginning scam promotion.
What This Targets
Crypto-linked account hijacking on X has been a documented and persistent problem since the platform’s days as Twitter. The auto-lock builds on earlier platform efforts to eliminate mention-spam campaigns and coordinated account behavior used in crypto promotions. Long-term users who have never posted about cryptocurrency will face verification on their first such post, while legitimate accounts, Bier indicated, can regain access quickly through the process.
Bier also publicly criticized Google for allowing phishing emails to reach users through Gmail. “Google isn’t doing shit to stop the phishing,” he wrote — framing the auto-lock as a platform-level workaround to a vulnerability upstream that X cannot directly control.
The U.S. Federal Trade Commission has documented how social media crypto scams have surged into a multi-billion dollar problem, with victims often unable to recover funds given the irreversibility of on-chain transfers. This structural reality is what makes hijacked accounts with established follower trust so valuable to attackers — and what the auto-lock directly targets by severing the link between account access and immediate monetization via crypto promotion.
Limitations
Critics have flagged that the measure only intervenes after an account has already been compromised via phishing. If email providers do not better filter phishing emails upstream, the attack chain remains intact. The feature could also create friction for legitimate first-time crypto posts from established accounts, though Bier indicated the verification process will be brief for genuine users.
As broader crypto hack and phishing losses have shown improvement in recent months — with February 2026 recording the lowest monthly total since March 2025 — the $285 million Drift Protocol exploit this week is a sharp reminder that headline risk remains high. X’s new feature addresses one specific and high-volume attack vector within a much larger ecosystem of crypto-linked fraud.


Crypto has spent years obsessing over speed, fees and scalability. Now it may have to confront a more existential question: what happens when its core security breaks?
That question is moving from theory to urgency. Quantum computers, machines that use the principles of quantum physics to process information in fundamentally different ways than today’s computers, could eventually solve the kinds of mathematical problems that underpin modern encryption.
Discussions around post-quantum cryptography have intensified across the industry in recent weeks, especially after new research from Google and academic collaborators suggested that such systems could one day break widely used encryption, potentially cracking systems like Bitcoin’s in minutes rather than years.
While Bitcoin developers scramble to find a solution and Ethereum prepares for the event, Solana is trying to get ahead of that scenario.
Cryptography firm Project Eleven has teamed up with the Solana Foundation to experiment with post-quantum security, technology designed to withstand quantum attacks that could render today’s cryptography obsolete. The early work is already surfacing a difficult reality: making Solana quantum-safe may come at the expense of the performance that defines it.
In practice, that effort has meant moving beyond theory and into live testing. Project Eleven has worked with the Solana ecosystem to model how the network would behave if its current cryptography were replaced, including deploying a test environment using quantum-resistant signatures — the digital keys that authorize transactions. The goal is not just to prove the technology works, but to understand what breaks when it’s pushed to scale.
The early results show a clear tradeoff.
The new, quantum-safe “signatures” that approve transactions are much larger and heavier than those used today, roughly 20 to 40 times larger, Project Eleven CEO Alex Pruden, who founded the project, after years in crypto and venture capital, brings a mix of military and industry experience to the problem, told CoinDesk. That means the network can handle far fewer transactions at once. In testing, a version of Solana using this new cryptography ran about 90% slower than it does today, Pruden said.
That tradeoff cuts directly at the heart of Solana’s design. The blockchain has built its reputation on high throughput and low latency, positioning itself as one of the fastest networks in crypto. But post-quantum cryptography — while more secure against future threats — comes with heavier data and computational requirements, making it harder to maintain those speeds.
‘Pick any wallet’
Solana may also face a more immediate structural challenge than its peers.
Unlike Bitcoin and Ethereum, where wallet addresses are typically derived from hashed public keys, Solana exposes public keys directly. That difference matters in a quantum scenario. “In Solana, 100% of the network is vulnerable,” Pruden said.
“A quantum computer could pick any wallet and immediately start trying to recover the private key.”
Pruden, a former Army Green Beret, first became interested in Bitcoin while deployed in the Middle East, later worked at Coinbase and joined Andreessen Horowitz’s venture team on its first fund. He then became an early leader at privacy-focused blockchain Aleo before launching Project Eleven, a firm focused on preparing digital assets for what he calls “Q-day,” the moment quantum computers can break today’s cryptography.
Some developers in the Solana ecosystem, meanwhile, are looking at simpler, more immediate fixes. One example is something called ‘Winternitz Vaults’, which uses a different kind of cryptography that’s believed to be safer against quantum attacks. Instead of changing the entire network, these tools focus on protecting individual wallets, giving users a way to secure their funds now while bigger, system-wide upgrades are still being figured out.
Despite those hurdles, Solana has moved faster than much of the industry in at least one respect: experimentation. “There’s something tangible,” Pruden said. “We actually have a testnet with post-quantum signatures.” He added that the Solana Foundation “deserves credit for at least engaging and wanting to do the work.”
Across crypto, that level of engagement remains rare. While some ecosystems, most notably Ethereum, have begun discussing long-term migration paths, concrete implementation has been limited.
The broader challenge is not just technical, but social: upgrading cryptography in decentralized systems requires coordination across developers, validators, applications and users, all of whom must move in sequence.
For Pruden, the risk is that the industry waits too long to begin that process. “This is a tomorrow problem — until it’s today’s problem,” he said. “And then it takes four years to fix.”
Read more: Here’s how bitcoin, Ethereum and other networks are preparing for the looming quantum threat
Crypto World
Bitcoin whales are selling the most aggressively on record while ETFs and Strategy keep buying
The most visible bitcoin buyers in the world are buying at near-record pace. It is not enough.
A CryptoQuant weekly report showed overall 30-day apparent demand at negative 63,000 BTC as of late March, meaning the broader market is selling far faster than institutions can absorb. ETF purchases hit approximately 50,000 BTC in the rolling 30-day window, the highest since October 2025. Strategy’s accumulation held steady at roughly 44,000 BTC. Together, the two largest institutional channels absorbed about 94,000 BTC in March.
If institutions bought 94,000 BTC and net demand is still negative 63,000, the rest of the market — such as retail, older whales, miners, funds — sold approximately 157,000 BTC in the same period.
At least four other independent indicators are pointing in the same direction.
The whale reversal
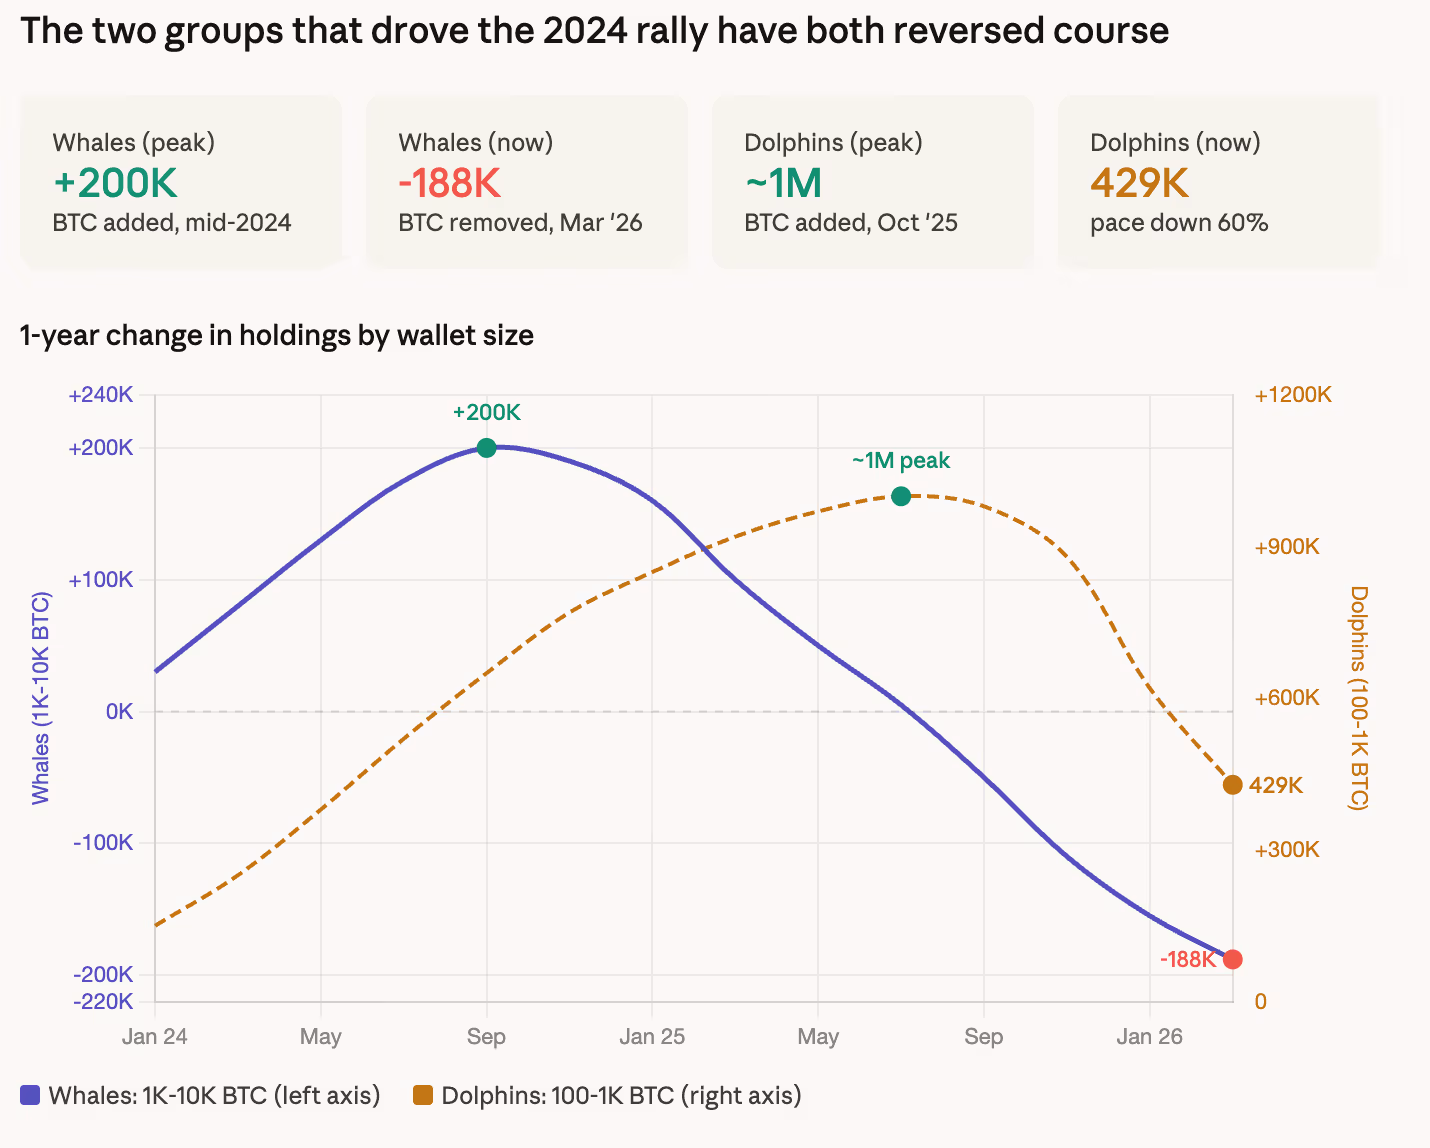
Large holders, wallets with 1,000 to 10,000 BTC, have turned from the market’s biggest buyers into its biggest sellers on a scale CryptoQuant describes as one of the most aggressive distribution cycles on record.
A year ago, these wallets were collectively adding 200,000 bitcoin to their holdings. Today they are collectively removing 188,000. That is a nearly 400,000 BTC swing from accumulation to distribution in roughly 18 months.
Mid-tier holders, wallets with 100 to 1,000 BTC, are still technically accumulating but the pace has collapsed more than 60% since October 2025, from nearly 1 million BTC in annual additions to 429,000. They haven’t stopped buying. They’ve dramatically slowed down.

The realized price compression
Bitcoin’s spot price at in the $67,000-$68000 range sits 21% above its realized price of $54,286, the average cost basis of every coin on the network weighted by its last transaction. That means the average holder is still in profit, which historically means the market has not bottomed, as CoinDesk noted earlier in the week.
In 2022, the signal that marked the actual cycle low was spot falling below realized price. Bitcoin traded under its aggregate cost basis from June through October of that year, and the deepest point, roughly 15% below realized, coincided almost exactly with the low near $15,500.
The current setup is not that. But the gap is closing fast. In late 2024, when bitcoin traded above $119,000, the premium to realized price was roughly 120%. That has compressed to 21% in about 15 months, one of the fastest approaches to the realized price line outside of outright crashes.
The sentiment disconnect
The Fear and Greed Index has been stuck between 8 and 14 for the past month, deep in extreme fear territory. Yet bitcoin ETFs drew over $1 billion in net inflows in March.
That combination of extreme fear alongside strong institutional buying is unusual. It means the flows are not translating into broader confidence, but that institutions are buying into a market that the rest of the participants do not want to be in.
The widely-followed Coinbase Premium Index reinforces this. The metric, which measures whether bitcoin trades at a premium or discount on Coinbase relative to other exchanges and serves as a proxy for U.S. institutional appetite, has been persistently negative since bitcoin’s all-time high above $126,000 in early October 2025. Even with prices in the $65,000 to $70,000 range, American buyers have not stepped back in at scale.

The war pattern
The behavioral explanation for the demand drain is visible in the price action of the past five weeks. Bitcoin has spent the entire Iran conflict grinding between $65,000 and $73,000, selling on every escalation headline, rallying on every de-escalation headline, and ending up roughly where it started. Monday’s 4% equity rally on ceasefire optimism gave back by Wednesday after Trump’s address promised to hit Iran “extremely hard.”
The pattern of hope, headline, reversal repeats with such regularity that the dominant strategy has become not to have a position at all. That shows up in the demand data as gradual withdrawal rather than panic selling.
The drawdown is compressing, not ending
The current drawdown from October’s all-time high above $126,000 is roughly 47%, significantly less severe than the 84% to 87% crashes that followed the 2013 and 2017 peaks. Fidelity Digital Assets analyst Zack Wainwright noted in late March that bitcoin’s growth is becoming “less impulsive,” with a reduced probability of extreme downside events as the asset matures.
“Bitcoin’s drawdowns compressing to about 50% is a sign of a maturing market structure,” said Jason Fernandes, co-founder and market analyst at AdLunam. “As liquidity deepens and institutional participation increases, volatility naturally compresses on both the upside and the downside.
The drawdown compression framing matters for the demand data. If bitcoin is maturing into an asset where 50% corrections replace 85% crashes, then the current contraction may not resolve with the violent capitulation flush that marked previous cycle bottoms.
What could change this
Two catalysts sit on the near-term horizon.
Morgan Stanley received approval this week for a bitcoin ETF charging just 14 basis points, 11 below the category average. The product opens access to 16,000 financial advisors managing $6.2 trillion, a channel that has not previously had direct bitcoin ETF exposure.
Strategy’s STRC preferred equity product saw hundreds of millions in inflows around its recent ex-dividend date, providing the funding mechanism for its 44,000 BTC monthly accumulation. If that repeats and accelerates each month, it adds a new source of sustained buying pressure.
However, it would remain a single company running a leveraged bitcoin strategy.
CryptoQuant’s own report identifies a potential short-term bounce toward $71,500 to $81,200 if the Iran conflict de-escalates, corresponding to the Lower Band and Trader On-chain Realized Price resistance zones.
These two metrics track the average cost basis of short-term and active traders respectively, and that have historically acted as ceilings during bear market rallies. Bitcoin currently trades below both.
The read across all five data sources is that bitcoin’s demand structure is thinning from the inside.
That does not mean the current range floor breaks, but that the floor depends entirely on whether ETFs, Strategy, and the new Morgan Stanley channel can continue absorbing what the rest of the market is trying to get rid of.


Cambodia has moved closer to tougher action against scam centers linked to crypto fraud and other online crimes.
Summary
- Cambodia’s Senate approved a draft bill targeting scam compounds tied to crypto and online fraud.
- The bill sets prison terms, fines, and tougher penalties for gangs or multiple victims involved.
- The measure now awaits royal approval as Cambodia faces pressure over regional scam centers globally.
The country’s Senate approved a draft law that would impose prison terms and fines on people involved, marking a new step in its response to scam compounds.
Cambodia’s Senate said it unanimously approved the draft law on Friday, with all 58 senators voting in favor. The bill now awaits the king’s approval before it can take effect.
Reports said the proposed law would impose prison terms of two to five years and fines of up to $125,000 for certain offenses. Those penalties could double if the crimes involve a gang or affect several victims.
The Senate said the draft law would create criminal rules to address gaps in current legislation. It described the measure as part of a wider effort to respond to fraud carried out through technology systems.
In its notice, the Senate said the law would help tackle risks to social security, the economy, and public order. The notice added that the measure aimed to improve cooperation in the fight against fraud and protect Cambodia’s reputation. It said the draft law would help “fill the gaps and deficiencies in the current law” and improve efforts against fraud.
In addition, the bill moved forward after criticism from foreign governments and international bodies over scam activity in Southeast Asia. A 2025 report from the US State Department said Cambodia’s government had often treated scam cases as labor disputes and had not prosecuted owners or operators of suspected scam compounds.
The timing also followed action from the United Kingdom, which sanctioned operators of a Cambodia-based scam center. Cambodia also extradited to China the leader of a criminal syndicate with reported links to scam compounds. Before the Senate vote, the National Assembly approved the bill on March 30 with all 112 members voting in support.
Scam centers remain under scrutiny
Reports from the region have described scam compounds as closed sites where workers may face control, threats, and abuse. A 2024 UN report on a compound in the Philippines said some workers were trafficked, held against their will, and exposed to violence.
The report said many of these sites operate like self-contained facilities. It stated that the people inside are “basically fenced off from the outside world,” with access to restaurants, dormitories, and other services that reduce the need to leave. Cambodia’s proposed law now places fresh attention on how the country plans to address such operations.


Bitcoin (BTC) traded near $67,000 over the weekend after a week of sharp swings. The broader crypto market also stayed steady, while Pi Network’s PI token held above $0.17 after days of losses.
Summary
- Bitcoin traded around $67,000 as weekend volatility faded and the broader crypto market stayed subdued.
- Pi Network’s PI token stabilized above $0.17 after recent losses, ending its sharp downward trend.
- VeChain climbed 9% daily while HASH dropped 10%, marking the strongest altcoin moves reported today.
Bitcoin showed limited movement over the past 24 hours and remained close to the $67,000 level. Its price action followed a volatile week in which the asset moved between $66,000 and $68,000 before rising to $69,200 on Wednesday.
That move reversed after fresh market pressure, sending Bitcoin down to $65,700 later the same day. Since then, the asset has traded in a narrow range. At press time, Bitcoin’s market capitalization stood at about $1.34 trillion, while its market dominance remained near 56.2%.
Most large-cap altcoins posted small changes during the same period. Ethereum held near $2,050 after a slight daily loss, while XRP remained above $1.30. BNB, Solana, TRX, and Cardano all recorded gains of less than 1%.
The biggest moves among larger altcoins came from a smaller group of assets. RAIN fell more than 6% and dropped below $0.0075. HBAR, PEPE, UNI, and SHIB also traded lower. In contrast, Ethereum Classic rose 3.5% to $8.30 and stood out from the broader market.
PI token steadies after recent drop
Pi Network’s PI token showed signs of stability after a recent downward move. The token traded above $0.17, marking a pause in the decline that had drawn attention across the altcoin market.
Elsewhere, HASH posted the sharpest daily loss among the mentioned tokens, falling 10% over the past 24 hours. VeChain moved in the opposite direction and gained 9% on the day, helping it return to the top 100 altcoins by market value.
Meanwhile, the total crypto market value changed little over the day and remained just below $2.4 trillion. That flat reading matched the quiet performance seen across Bitcoin and most major altcoins during the weekend session.
Market activity also stayed muted despite recent macro and geopolitical headlines that had raised expectations of stronger price swings earlier in the week.
Disclosure: This article does not represent investment advice. The content and materials featured on this page are for educational purposes only.


HypurrFi has warned users not to interact with its website or lending app after reporting a possible domain hijacking.
Summary
- HypurrFi warned users to avoid its app after reporting a possible domain compromise Friday.
- The team said user funds remain safe while it investigates the suspected hijacking incident.
- Frontend attacks remain a crypto risk because compromised domains can trick users into signing transactions.
The incident has raised fresh concern over frontend attacks in decentralized finance, even when onchain systems remain intact.
HypurrFi said it is investigating a possible compromise involving its domain. The team asked users to avoid the website and the lending protocol until it shares a new update.
Founder androolloyd posted on X, “Do NOT USE THE HYPURR .FI domain, it is compromised.” The team later repeated that warning and told users not to interact with the app until further notice.
HypurrFi also said there is no current sign of risk to user funds. It added that its social media accounts remain under team control during the investigation.
The warning focused on the website and user access point rather than the protocol’s core contracts. That distinction is common in cases where attackers target frontend systems instead of onchain code.
HypurrFi operates as a DeFi lending and borrowing protocol on HyperEVM. HyperEVM is the EVM-compatible network linked to Hyperliquid’s trading ecosystem.
The protocol has about $30 million in total value locked, based on DefiLlama data. That made the warning more urgent for users who may still try to access the platform through the compromised domain.
The team did not provide details on how the hijacking may have happened. It also did not say when the site would return to normal use.
For now, the main message from the project remains clear. Users should avoid the domain and wait for an official notice before reconnecting wallets or signing any transaction requests.
Domain hijacking remains a known crypto risk
Domain hijacking has become a recurring issue across the crypto sector. These attacks often target a project’s website and user interface instead of its smart contracts.
Once attackers control a domain, they can place wallet drainers or other malicious prompts on the site. This method can affect users even when the underlying protocol has passed security reviews.
A similar case affected the BONKfun domain last month. That incident added to a growing list of attacks that use fake or compromised frontends to reach users.


Bitcoin (BTC) stayed near $67,000 on April 4 as two CryptoQuant analysts pointed to a split market structure.
Summary
- Bitcoin spot volume dropped faster than open interest, showing derivatives still carried more market weight.
- Exchange reserves fell by 66,300 BTC as OTC flows pointed to continued institutional accumulation recently.
- Negative funding and nearby downside liquidity kept short-term liquidation risk elevated for Bitcoin traders.
CryptoQuant analyst Carmelo_Alemán said Bitcoin daily spot volume fell from 42,026 BTC on March 17 to 35,590 BTC on April 2. That marked a 15.31% drop in spot activity over the period. At the same time, open interest fell from $23.33 billion to $21.26 billion, a smaller 8.87% decline.
He also said the estimated leverage ratio rose from 0.2207 to about 0.225. In his view, Bitcoin is becoming “less dependent on real buying and selling” and more tied to leveraged positions. The same note said funding rates stayed mostly negative, showing stronger short positioning in perpetual futures.
Carmelo_Alemán said liquidity below the market sits closer than the larger liquidity zones above. That setup, according to his note, leaves Bitcoin open to a short-term move driven by long liquidations before any stronger recovery attempt.
CryptoQuant research published this week also said Bitcoin spot demand remains in deep contraction even as institutional buying continues through ETFs and Strategy purchases. That supports the view that price action has relied more on derivatives and large buyers than on broad spot demand.
Exchange reserves fall as institutions absorb supply
In a separate note, CryptoQuant analyst GugaOnChain said Bitcoin exchange reserves dropped by 66.3K BTC over the past 30 days. The post added that OTC absorption made up 92.1% of recent flow, compared with 7.9% on regular 24-hour market volume.
GugaOnChain said that pattern points to ongoing institutional accumulation. However, the analyst also warned that on-chain scarcity is facing a “cloudy macroeconomic scenario,” with geopolitical shocks still able to force fast moves back to exchange liquidity.
According to crypto.news data, Bitcoin traded around $67,150 at press time, with a market cap near $1.34 trillion.
Disclosure: This article does not represent investment advice. The content and materials featured on this page are for educational purposes only.


The Digital Asset Market Clarity Act’s compromise language on stablecoin yield has circulated among crypto and banking industry stakeholders in closed-door Capitol Hill sessions, with a Senate Banking Committee markup now targeted for the second half of April — though the text has drawn a mixed, and in some corners hostile, reception.
Summary
- Senators Thom Tillis and Angela Alsobrooks reached an agreement in principle on stablecoin yield on March 20; formal draft language was reviewed by crypto industry leaders on March 24 and banks on March 25
- The compromise bans passive yield on stablecoin balances but permits activity-based rewards tied to payments, transfers, or platform use
- Polymarket had the CLARITY Act priced at a 66% probability of becoming law in 2026 as of April 2
The Tillis-Alsobrooks deal draws a firm line: platforms cannot offer yield — directly or indirectly — for simply holding a stablecoin. Rewards remain permissible only when tied to user activity, not passive balances. The framework gives the SEC, CFTC, and Treasury twelve months to define what specific rewards programs are permissible.
“The compromise that myself and Senator Tillis have been working on is one that we believe will allow us to have the guardrails in place that will help us prevent deposit flight,” Senator Alsobrooks told an American Bankers Association summit.
The banking industry’s position reflects existential concern. Standard Chartered analysts estimated that an open-ended yield provision could redirect up to $500 billion in deposits from traditional banks into stablecoin products by 2028. Banks won the core argument they sought: passive yield is off the table.
Industry Reaction
The industry reception has been far from unified. As the deal first emerged, the market structure bill was framed as potentially unblocking one of the most consequential crypto legislative events of the cycle. But the actual text has landed closer to the bank position than the White House’s earlier compromise framing. Coinbase privately told Senate staff it could not accept the March 23 draft. Stripe has also objected. Broader institutional appetite for regulated crypto products — from ETFs to structured tokens — makes the CLARITY Act’s outcome a critical variable for the entire institutional crypto pipeline in 2026.
The stablecoin yield text is not the only outstanding issue. Senate Democrats are focused on ethics language barring government officials and their families from personally benefiting from crypto holdings. DeFi provisions and the potential attachment of community bank deregulation to the bill also remain unresolved.
The Calendar
The Senate was in pro forma session only through April 9 and returns to full session April 13. Senator Bernie Moreno has stated explicitly that if the bill does not reach the full Senate floor by May, digital asset legislation may not advance before the midterm election cycle. The CLARITY Act passed the House 294–134 in July 2025 and cleared the Senate Agriculture Committee in January 2026. It enters the banking panel with broad support — but a narrowing clock that leaves almost no room for further substantive revision.

The Ethereum Foundation (EF), the non-profit organization at the heart of the world’s most-used blockchain, has staked nearly $100 million in ETH during the last 24 hours.
The move signals a departure from the organization’s long-standing and often controversial practice of selling its native tokens to fund operations.
Ethereum Foundation Could Earn Up to $4 Million in Annual Yield
On-chain data confirms that on April 3, the Foundation deposited approximately 45,034 ETH—valued at roughly $93 million—into the Ethereum Beacon Deposit Contract.
The move, tracked via Arkham Intelligence, saw funds moved from the EF’s Treasury Multisig wallet in systematic batches of 2,047 ETH.
This follows a smaller deposit of 22,500 ETH earlier in the week. It brings the Foundation’s total staked balance to 69,500 ETH, or approximately $143 million.
For much of the last decade, the Foundation’s treasury management has been a flashpoint for market speculation. The organization historically relied on periodic ETH liquidations to cover its annual budget, research grants, and ecosystem development.
These ETH sales frequently occurred near market highs, leading some traders to view Foundation “dumps” as a reliable signal of a local price ceiling. Consequently, the practice fueled accusations that the protocol’s leaders lacked long-term conviction.
This pivot toward staking transforms the Foundation into a primary participant in its own economic system. By acting as a validator rather than a liquidator, the organization is converting its $430 million Ether treasury into a productive, yield-bearing endowment.
At current institutional staking yields of roughly 2.7%, the Foundation’s current staked holdings are projected to generate approximately $4 million in recurring annual revenue.
However, this move forces the Foundation to navigate the same operational risks and “slashing” frictions faced by ordinary network participants.
Meanwhile, the Foundation’s new strategy mirrors a broader trend among institutional holders.
Firms such as BitMine have staked millions of tokens over the last year, contributing to a global total of 38.5 million Ether—roughly 30% of the circulating supply—now committed to securing the network.
The post Ethereum Foundation is Staking Nearly $100 Million in ETH Again appeared first on BeInCrypto.

Don’t make the same financial mistake that I did! #costofliving #smartmoney #makemoneyfromhome

Complete stand-up novice to perform at Consett Comedy Festival
Landmark’s regeneration ‘needs to start before uncertainty of big council shake-up’

Smart energy pays enters the US market, targeting scalable financial infrastructure

Why Israel is blocking foreign journalists from entering

Bitcoin: We’re Entering The Most Dangerous Phase
Don’t make the same financial mistake that I did! #costofliving #smartmoney #makemoneyfromhome

Ripple XRP: “THE SHADOW ACCOUNTS LEAKED IT” Goldman Sachs $154M Secret Filing! (DECODING THE PLAN)

Everyday Motivation : Review your financial goals
-

 NewsBeat2 days ago
Steven Gerrard disagrees with Gary Neville over ‘shock’ Chelsea and Arsenal claim | Football
-

 Business2 days ago
No Jackpot Winner and $194 Million Prize Rolls Over
-
Entertainment5 days ago
Fans slam 'heartbreaking' Barbie Dream Fest convention debacle with 'cardboard cutout' experience
-

 Fashion18 hours ago
Weekend Open Thread: Spanx – Corporette.com
-

 Crypto World3 days ago
Gold Price Prediction: Worst Month in 17 Years fo Save Haven Rock
-

 Tech5 days ago
The Pixel 10a doesn’t have a camera bump, and it’s great
-
Crypto World4 days ago
Dems press CFTC, ethics board on prediction-market insider trades
-
 Entertainment7 days ago
Lana Del Rey Celebrates Her Husband’s 51st Birthday In New Post
-

 Tech5 days ago
Avatar Legends: The Fighting Game comes out in July and it looks pretty slick
-

 Tech4 days ago
EE TV is using AI to help you find something to watch
-

 Sports4 days ago
Tallest college basketball player ever, standing at 7-foot-9, entering transfer portal
-

 Business2 days ago
Login and Checkout Issues Spark Merchant Frustration
-

 Fashion6 days ago
Amazon Sundays: Soft Spring Layers
-

 Tech6 days ago
Elon Musk’s last co-founder reportedly leaves xAI
-

 Fashion5 days ago
The Best Spring Trends of 2026
-

 Tech4 days ago
How to back up your iPhone & iPad to your Mac before something goes wrong
-

 Politics5 days ago
Should Trump Be Scared Strait?
-

 Tech5 days ago
Apple will hide your email address from apps and websites, but not cops
-

 Crypto World5 days ago
U.S. rule change may open trillions in 401(k) funds to crypto
-

 Tech4 days ago
Flipsnack and the shift toward motion-first business content with living visuals
You must be logged in to post a comment Login