

Crypto World
BNB-based Prediction Market Opinion Launches Token
OPN debuted at a $450 million valuation but is dropping steadily amid airdrop selling pressure.
Opinion, a prediction market built on BNB Chain, launched its native OPN token earlier today with an airdrop for early users.
OPN is currently trading at a $350 million valuation, down around 20% from its launch price, according to Coingecko. The token is facing heavy selling pressure, likely from airdrop recipients, and has already generated nearly $150 million in trading volume.

Most of the activity is concentrated on Binance, which listed OPN on its spot markets with trading rewards. The token has also been listed by Bybit, MEXC and various other centralized exchanges, with Coinbase set to launch perpetuals.
Launched in October 2025, Opinion is the third-largest prediction market by volume after Kalshi and Polymarket, according to data from Artemis. However, it’s worth noting that the validity of its data has come under scrutiny after it reported a whopping $8 billion in January volume.

A month ago, Opinion raised $20 million in a pre-Series A round that included Hack VC, Jump Crypto, and Primitive Ventures.


TLDR:
- The SEC roundtable on listed options market structure is scheduled for April 16, 2026, in Washington, D.C.
- Commissioner Hester M. Peirce praised retail investor growth and called for continued options market reflection.
- Public comments referencing File Number 4-887 can be submitted electronically or on paper through one method.
- The roundtable will be live-streamed on SEC.gov, with a full recording made available at a later date.
The SEC roundtable on listed options market structure is set for April 16, 2026, in Washington, D.C. The Securities and Exchange Commission officially announced the event on March 5, 2026.
It will be held at the agency’s headquarters at 100 F Street, N.E. The discussion will also be streamed live on SEC.gov for audiences unable to attend in person.
Core topics include facilitating competition in quote-driven markets, evaluating the customer experience, and identifying growth opportunities in listed options.
What the SEC Roundtable Will Cover
The roundtable is designed to foster open public dialogue on the listed options market structure reform. The SEC aims to examine how competition can be better supported within quote-driven market environments.
Along with that, evaluating the overall customer experience remains a key focus for the discussion.
Commissioner Hester M. Peirce commented publicly on the growth of the U.S.-listed options market. She pointed out that retail investor participation has grown remarkably in recent years.
The roundtable, she noted, will celebrate the market’s achievements while considering areas that may need further reflection.
The SEC posted on X, formerly Twitter, confirming the date and format of the event:
“The SEC is hosting a roundtable on April 16 to discuss listed options market structure. The event will be in-person and live-streamed on SEC.gov. Agenda, panelists, and registration info will be available soon.” — @SECGov
The SEC will release agenda details and speaker information before the roundtable takes place. In-person participation will be open to the public, though space may be limited. All visitors attending in person will be subject to standard security checks at the SEC’s headquarters.
Public Comment Submissions for the Roundtable
Members of the public who wish to share views on the listed options market structure may submit comments. Submissions can be made electronically or on paper, but only through one method at a time. All comments submitted will be entered into the official public record of the roundtable.
The SEC has clarified that personal identifying information will not be removed or edited from any submission. Therefore, submitters are cautioned to include only information they are willing to make publicly available. This applies to both electronic and paper submissions equally.
All submissions must reference File Number 4-887 in the text of the comment. For those submitting via email, the file number should appear in the subject line. The SEC will publish all received comments on its official website without modification.
A recording of the SEC roundtable will be made available on SEC.gov at a later date. This allows those unable to attend or watch the livestream to still access the full discussion.
The agency remains committed to keeping the options market reform conversation open and accessible to all.


Mantle’s ecosystem stablecoin has added roughly 375 million dollars in market value over the past month, climbing from about 494 million to nearly 870 million and cementing the network’s push to become a full‑stack on‑chain liquidity and banking layer built around ETH staking and restaking primitives.
Summary
- Stablecoin market cap jumps 75% in 30 days, approaching 870 million dollars as Mantle’s liquidity products gain traction across DeFi.
- Growth rides on Mantle’s mETH staking and cmETH restaking stack, which channels yield and demand back into the broader ecosystem.
- Mantle’s deep treasury and “fortress” balance sheet reinforce confidence in its stablecoin and DeFi rails despite wider market volatility.
Mantle’s stablecoin engine is firing on all cylinders. Over the past 30 days, the total market value of the Mantle ecosystem stablecoin has risen from roughly 494 million dollars to around 870 million, a gain of more than 75% that sharply outperforms the broader market and highlights the chain’s emerging role as an on‑chain liquidity hub.
The move comes as Mantle doubles down on an integrated strategy: pair an Ethereum Layer 2 with native liquid staking and restaking, then plug that liquidity into DeFi. At the base layer sits mETH, Mantle’s liquid staking token for Ethereum, which has already attracted more than 1 billion dollars in total value locked by letting users earn staking rewards while keeping their assets liquid. On top of that, cmETH extends those positions into restaking, unlocking additional yield and incentives without forcing users to unwind core ETH exposure.
This composable stack is now bleeding directly into stablecoin demand. As traders and protocols seek dollar liquidity backed by yield‑bearing collateral, Mantle’s stablecoin becomes a natural settlement and liquidity layer inside the ecosystem, tightening the feedback loop between ETH staking flows, DeFi usage and dollar‑denominated volume. Campaigns such as “Methamorphosis” and ecosystem incentive seasons have further accelerated user onboarding and capital rotation into Mantle’s products.
Underpinning the growth is a balance sheet that rivals mid‑tier centralized players. Mantle controls a multi‑billion‑dollar treasury, including more than 270,000 ETH, giving the DAO ample capacity to backstop liquidity, co‑invest in protocols and defend key pegs or markets when needed. Research firms have already labeled Mantle a “fortress” protocol for its ability to withstand severe price shocks in its native token while maintaining solvency. If current growth persists, Mantle’s stablecoin could become one of the core dollar rails for restaking‑centric DeFi over the coming cycle.
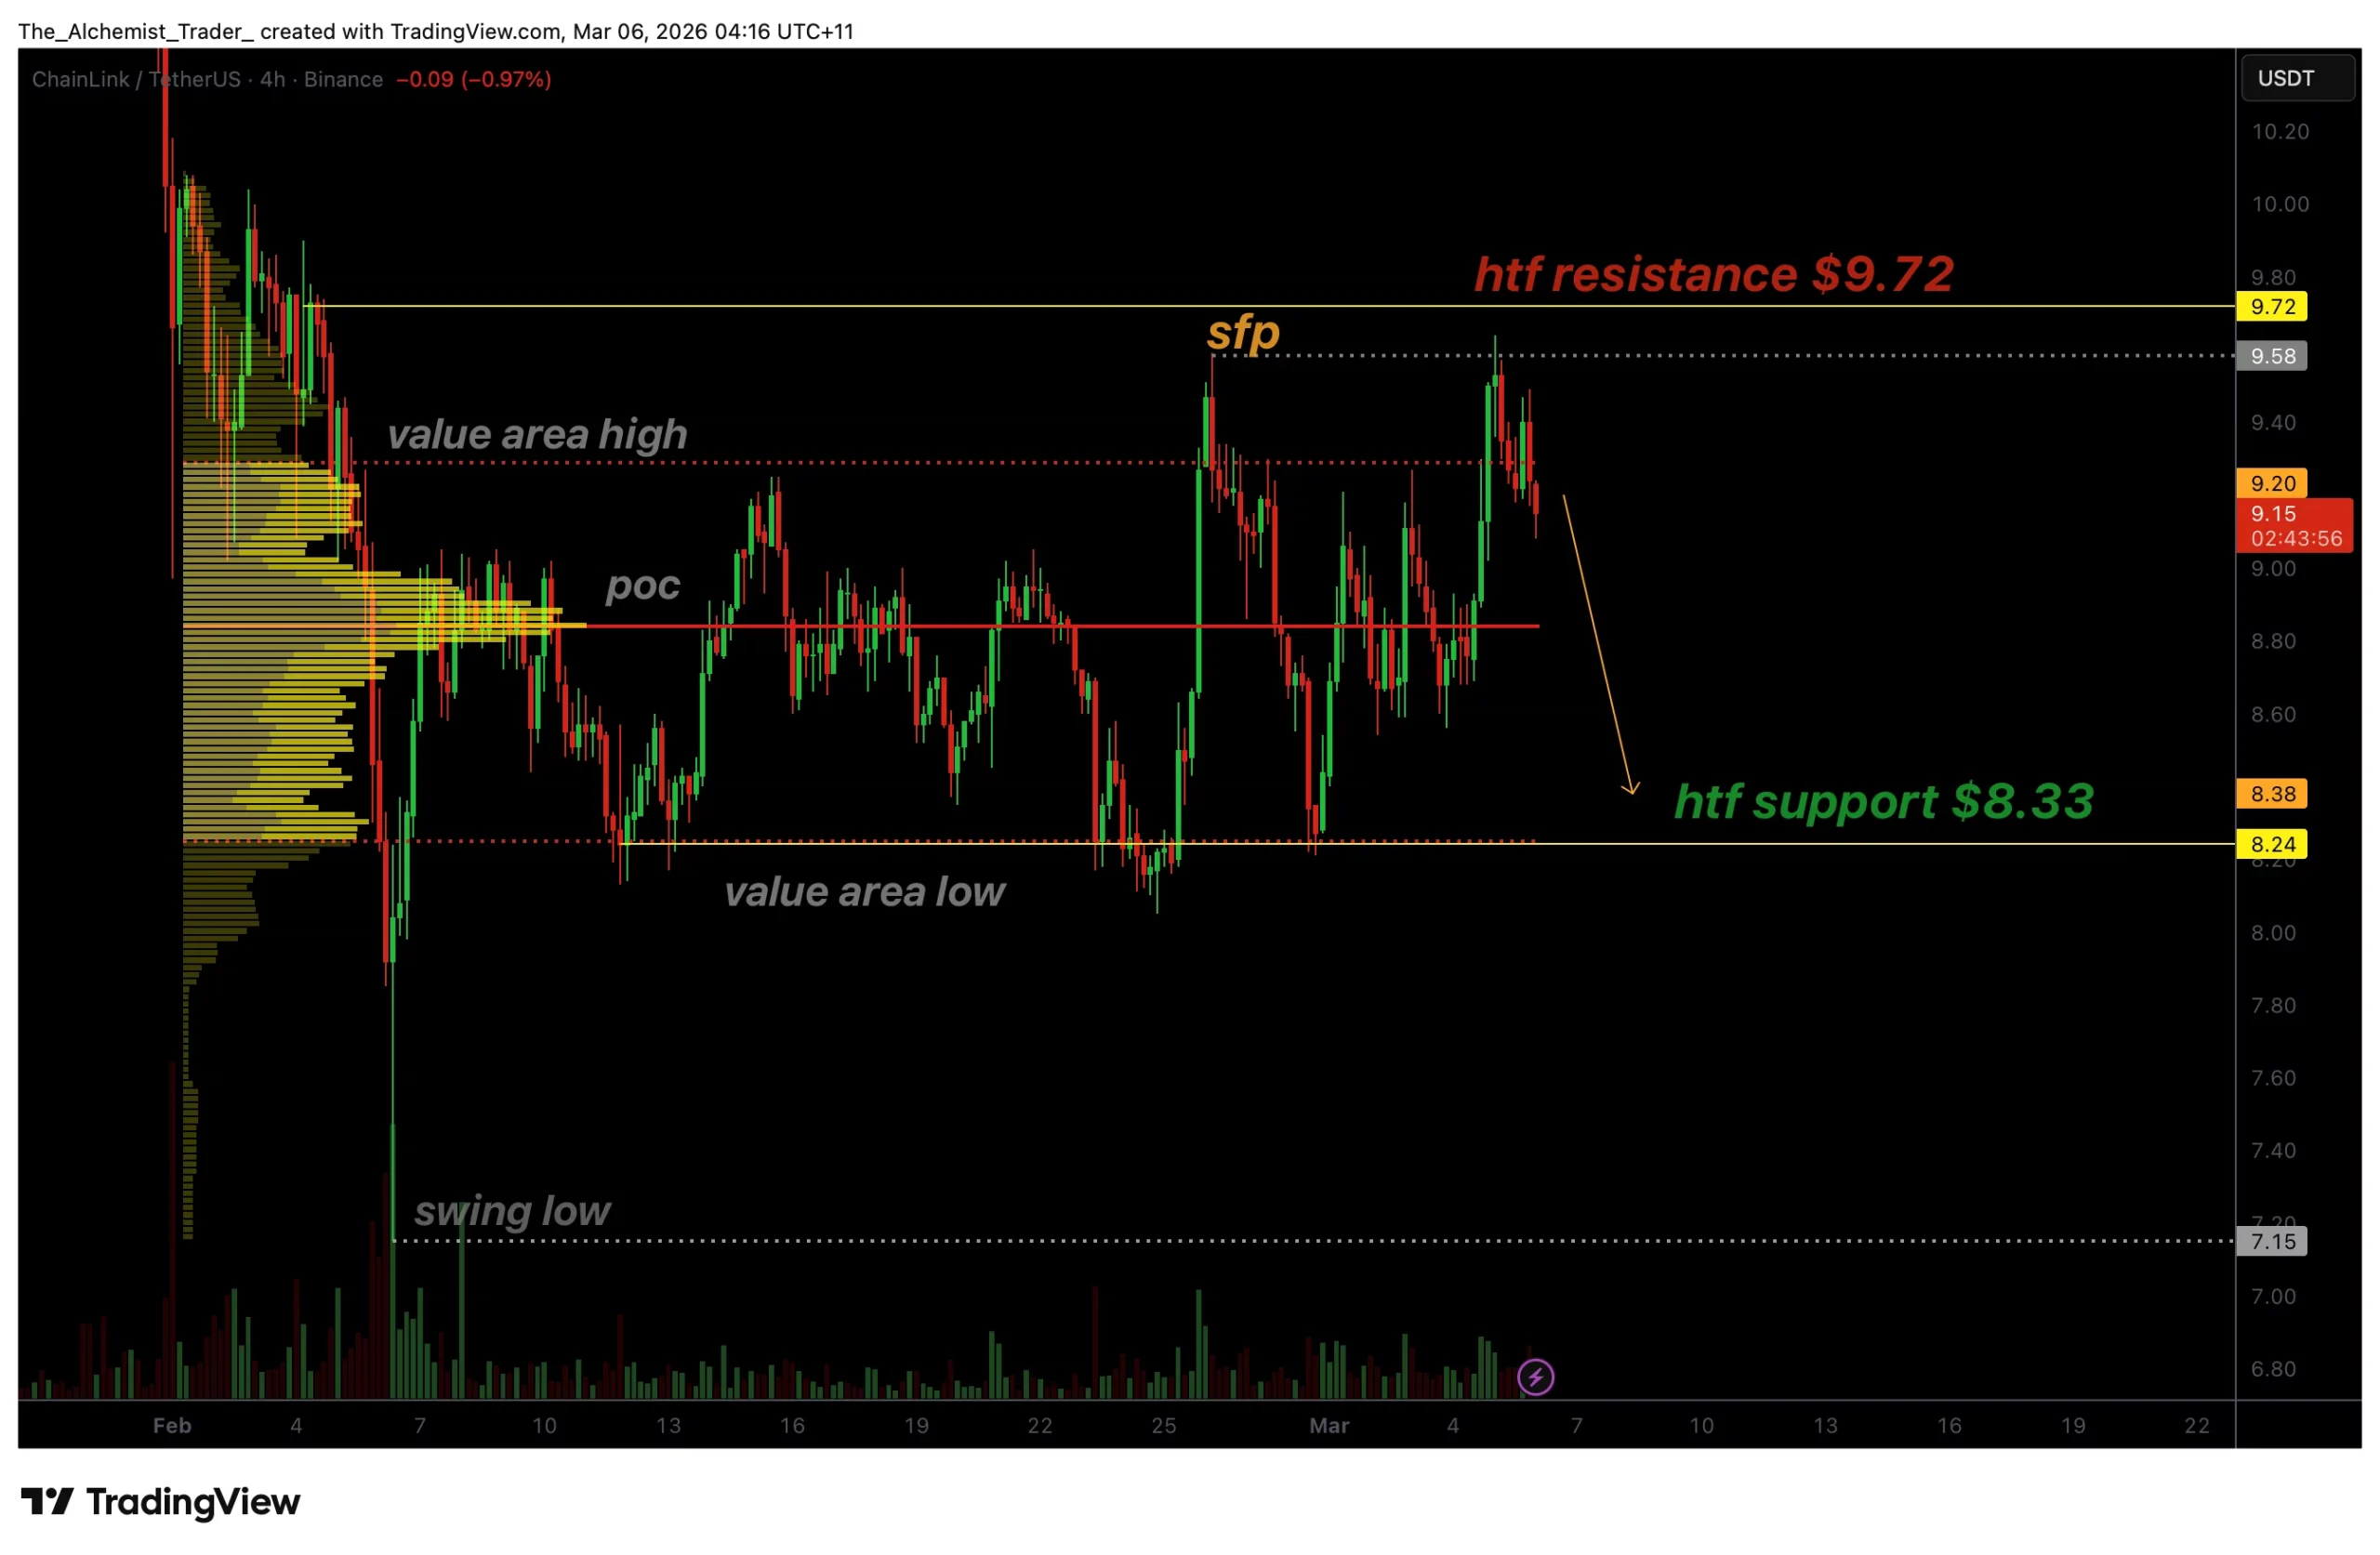
Chainlink price has confirmed a bearish swing failure pattern at a key resistance zone, signaling a potential downside rotation. The rejection near $9.72 increases the probability of a corrective move toward the $8.33 high-timeframe support.
Summary
- Bearish SFP confirmed: Rejection at the $9.72 resistance signals weakening bullish momentum.
- Value Area High lost: Indicates a shift in market structure toward downside pressure.
- $8.33 support in focus: Confluence with value area low makes it the next major downside target.
Chainlink (LINK) price is showing clear signs of technical weakness after failing to sustain momentum above a critical resistance level. Recent price action formed a bearish swing failure pattern (SFP) at the $9.72 high-timeframe resistance, a signal that often indicates exhaustion in bullish momentum.
With this rejection now confirmed, traders are closely watching the $8.33 region as the next significant support level.
Chainlink price key technical points
- High-timeframe resistance rejection: Price rejected the $9.72 resistance with a bearish SFP formation.
- Value Area High lost: Loss of this key level signals weakening bullish momentum.
- Downside target: $8.33 aligns with the value area low and major high-timeframe support.

Chainlink recently attempted to break above the $9.72 resistance level, which has historically acted as a major barrier in price action. However, the breakout attempt was short-lived. The market briefly traded above the previous swing high but quickly reversed, leaving a wick above the level before closing back below it. This structure forms a classic swing failure pattern, which is widely recognized by traders as a signal that liquidity above the highs has been taken before the market rotates lower.
The confirmation of this SFP highlights a shift in short-term market control. When price fails to sustain above a key resistance and closes back within the previous range, it often indicates that buyers have lost momentum. In Chainlink’s case, the inability to hold above $9.72 suggests that the move was primarily driven by liquidity collection rather than genuine bullish continuation. This increases the probability of a retracement as the market seeks lower levels of support.
Another important technical development is the loss of the value area high. This level previously acted as a key pivot within the current trading range, providing support during earlier pullbacks. Once price loses this level, it often signals a structural shift where sellers begin to gain greater control of the market.
The breakdown from this region reinforces the bearish outlook and suggests that Chainlink may continue rotating within the broader range. On the regulatory front, Chainlink’s deputy general counsel, Taylor Lindman, has also joined the Securities and Exchange Commission’s Crypto Task Force, stepping in to replace Michael Selig.
The next major level of interest is the point of control, which represents the price level with the highest traded volume within the range. This area typically acts as a magnet for price due to the high concentration of market activity. If Chainlink continues to show weakness and fails to reclaim the value area high, price is likely to gravitate toward this zone as traders reposition within the range structure.
Below the point of control lies the value area low, which sits in direct confluence with the $8.33 high-timeframe support level. This region represents a critical area where buyers may attempt to step in and defend price. Historically, high-timeframe supports combined with volume-profile levels tend to attract significant market interest, making $8.33 an important level to monitor in the coming sessions.
Meanwhile, on the fundamental side, Chainlink has recently enabled Coinbase’s cbBTC bridging to Monad, unlocking over $5 billion in Bitcoin-backed liquidity for decentralized finance applications and further expanding its ecosystem utility.
While short-term bounces can occur during corrective phases, the broader structure currently favors downside continuation. As long as price remains below the rejected resistance at $9.72 and fails to reclaim the value area high, the bearish market structure remains intact. This keeps the probability tilted toward a deeper rotation within the current range.
What to expect in the coming price action
From a technical and structural perspective, Chainlink remains under bearish pressure following the confirmed SFP rejection at $9.72. If the value area high continues to act as resistance, price is likely to rotate lower toward the $8.33 support zone.
A strong reclaim of the lost resistance would invalidate the bearish outlook, but until then, the path of least resistance remains to the downside.
Smart investors adjust their strategy during bear markets and 50% drawdowns like the one seen in Bitcoin (BTC) over the last five months. The strategy, known as dollar-cost averaging (DCA), involves investing the same amount at regular intervals regardless of market conditions.
Historical market cycle data and forward-looking BTC price simulations provide a clearer view of how these steady investment patterns develop across different entry periods and time horizons.
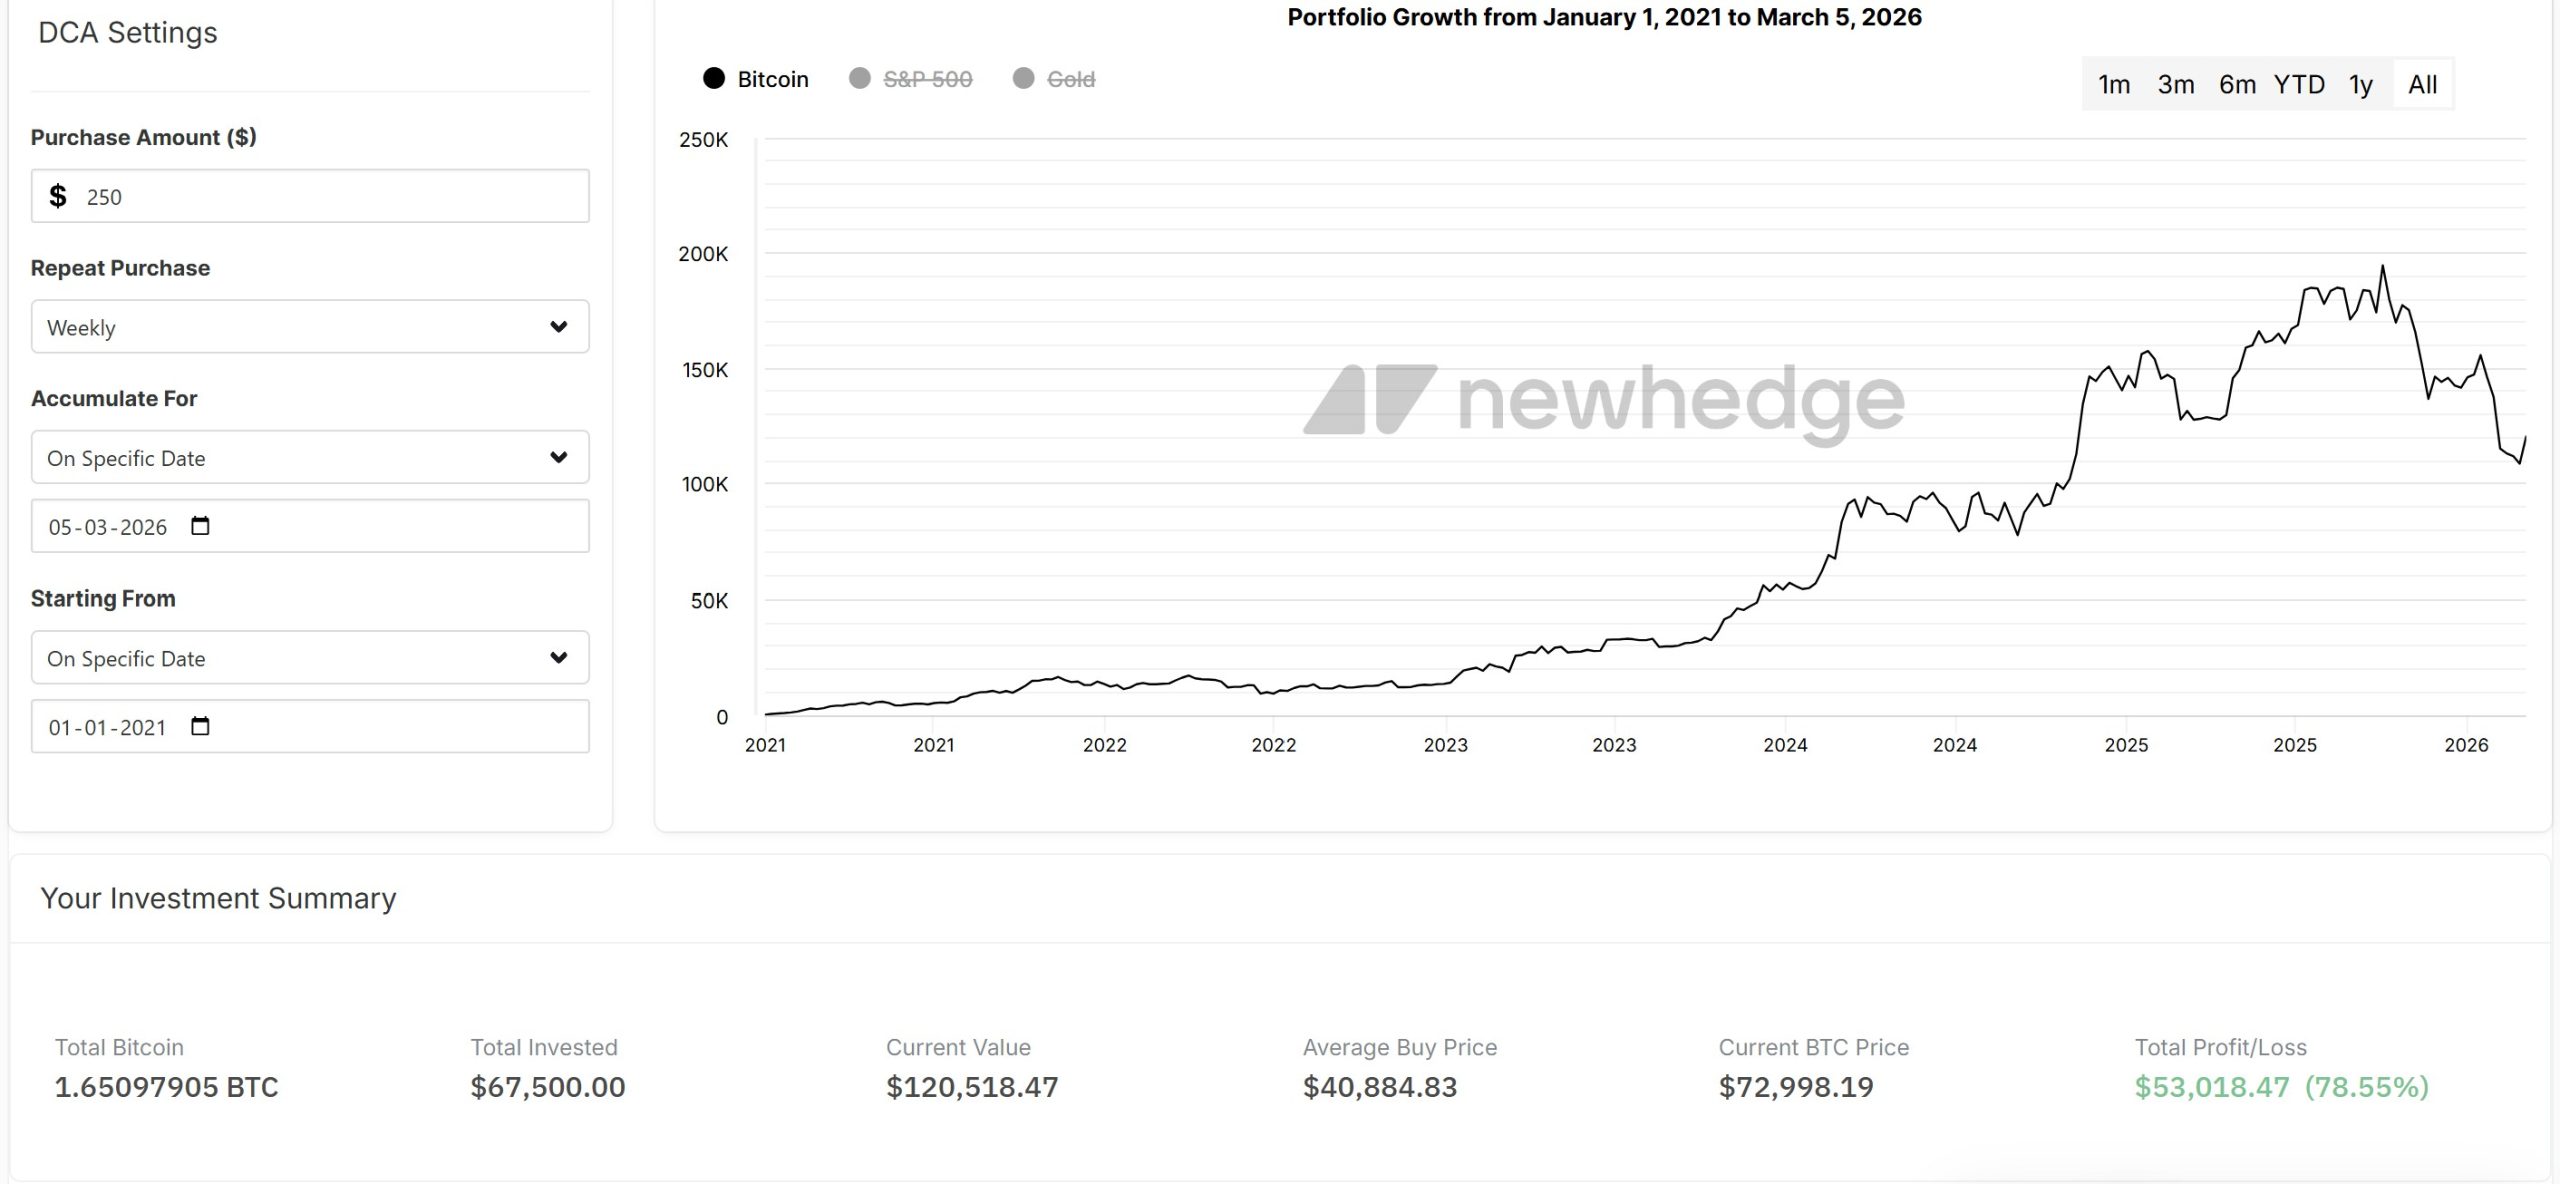
A five-year Bitcoin DCA stack shows strong net gains
A $250 weekly Bitcoin purchase starting in January 2021 resulted in $67,500 invested over a five-year period. Based on DCA simulation data, the strategy accumulated 1.65097905 BTC at an average purchase price of $40,884.
At the current Bitcoin price near $71,000, that 1.65097905 BTC is valued at roughly $120,518, representing a $53,018 gain (76%) on the invested capital. When Bitcoin traded for $100,000, the holdings were worth about $165,098, while at the cycle peak near $126,000 in October 2025, the same amount reached $208,023.

A shorter accumulation window illustrates how entry timing changes the early outcome while the strategy continues building exposure. A $250 weekly DCA beginning January 2024 results in $28,500 invested, accumulating 0.36863166 BTC with an average purchase price of $77,312.
At the current price of $71000, the amount is valued at about $26,909, a –6% unrealized loss. At $100,000, the holdings had risen to $36,863, while a $126,000 cycle high valued the Bitcoin at $46,448.
In a February X post, Swan Bitcoin analyst Adam Livingston compared a similar DCA approach against equities over the past five years. A $100 weekly allocation produced $42,508 in Bitcoin versus $37,470 in S&P 500 (SPX), representing 62.9% and 43.6% returns, respectively.
Livingston noted that purchasing Bitcoin consistently during drawdowns has historically produced stronger cumulative returns despite the price volatility.

Related: Bitcoin’s bullish momentum accelerates but topping $78K remains a challenge
Long-term models emphasize the time horizon
Forward-looking simulations examine how the DCA strategy could work from 2026 onward. A $250 weekly DCA beginning January 2026 allocates about $54,250 by March 2030.
The price assumptions come from Bitcoin’s long-term power-law growth curve, which tracks Bitcoin’s historical price relative to time on a logarithmic scale. The model produces a rising support band and median trend that have broadly aligned with previous market cycles.

Using this framework, analysts estimate that by 2028, the long-term trend support may move above $100,000, forming the base assumption for future DCA modeling. Simulations from Bitcoin Well place the median price near $430,278 by March 2030.
To capture the wider range around that path, the model also considers deviation bands of the power-law channel, producing a lower projection near $274,000 and an upper expansion scenario near $900,000.
Under those assumptions, the weekly strategy accumulates about 0.30 BTC over four years.
-
At $274,000, the holdings are worth about $82,200.
-
At the $430,278 median estimate, the investment value reaches $129,000.
-
At a $900,000 BTC price, the investment is worth nearly $270,000.

A November 2025 study by Bitcoin researcher Sminston With tested how the entry timing affects the long-term outcomes using similar projections. Even buying 20% above $94,000 (the price of BTC at that time) and exiting 20% below the projected 2035 median still produced nearly 300% gains on the remaining holdings after a decade.
The total savings reached 7.7 times the initial capital in the simulation.
The study concluded that entry timing adjusts the range of outcomes, while long holding periods drive the majority of the results.
Related: A sucker’s rally? Why Bitcoin analysts say BTC price must hold $70K
This article does not contain investment advice or recommendations. Every investment and trading move involves risk, and readers should conduct their own research when making a decision. While we strive to provide accurate and timely information, Cointelegraph does not guarantee the accuracy, completeness, or reliability of any information in this article. This article may contain forward-looking statements that are subject to risks and uncertainties. Cointelegraph will not be liable for any loss or damage arising from your reliance on this information.
Hyperliquid price is approaching a key resistance level, and shrinking volatility suggests a possible breakout toward $35.
Summary
- HYPE trades near $31 after slipping 5.7% in 24 hours but remains up 80% over the past year.
- Bollinger Bands are tightening, signaling a volatility squeeze that often precedes a major move.
- A breakout above $34 could push price toward $35, while losing $29 may expose the $26 support zone.
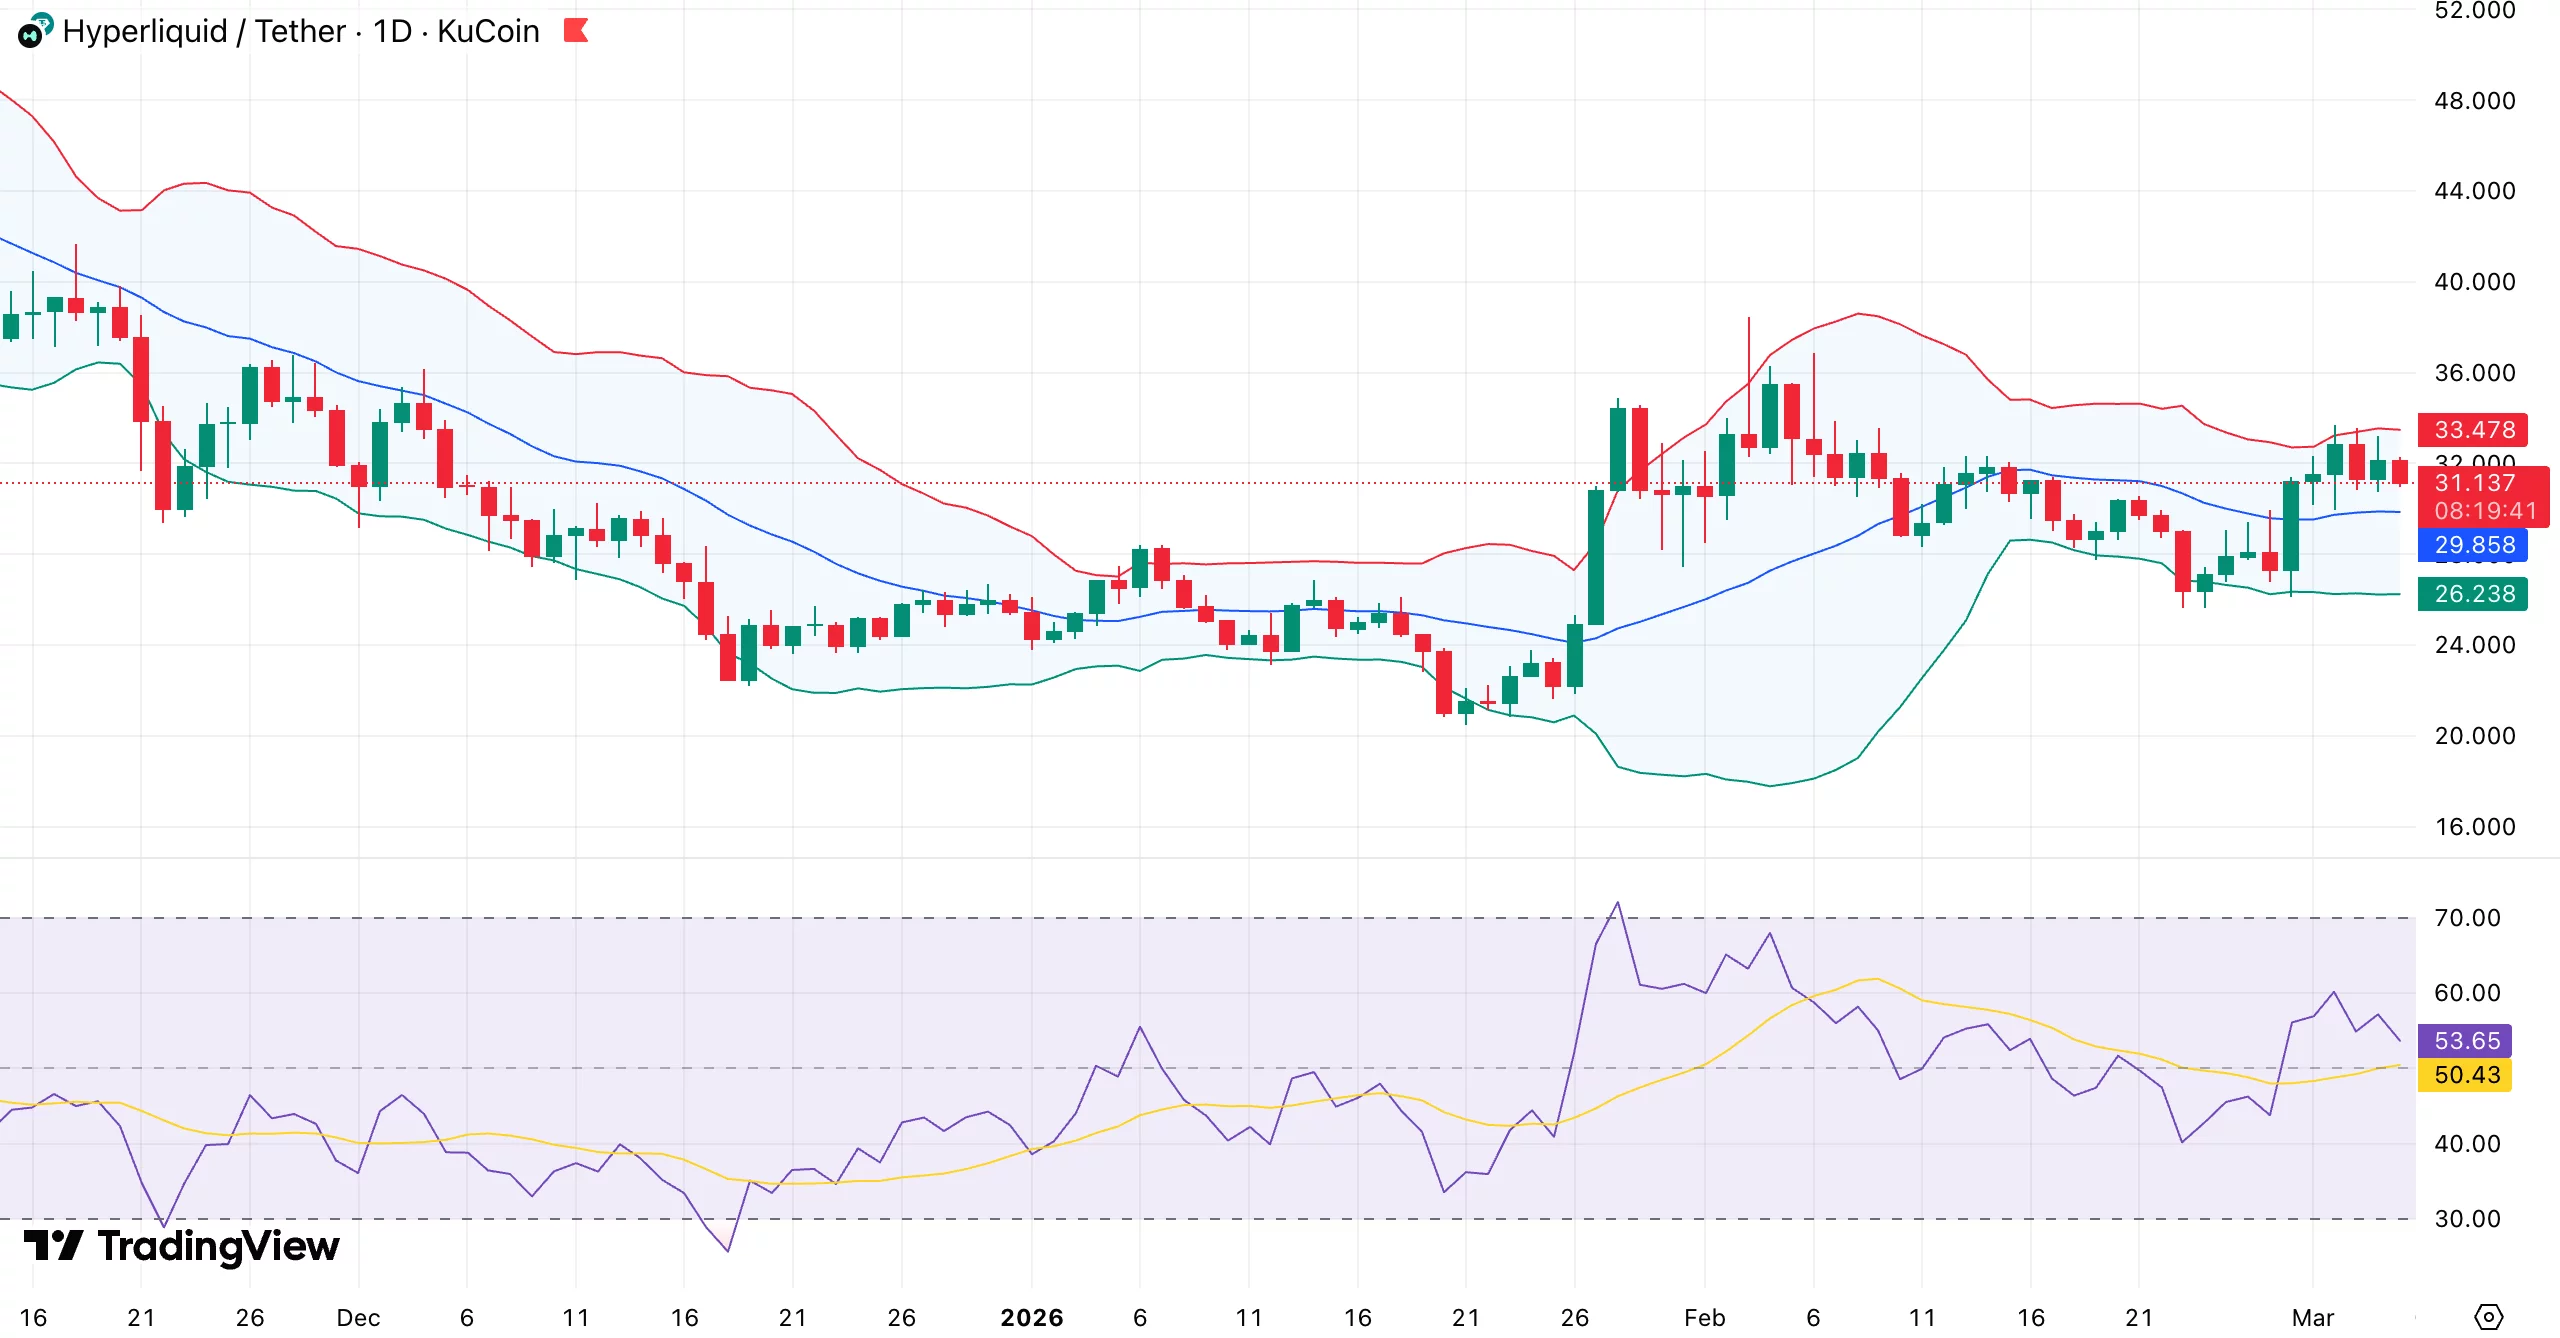
At press time, Hyperliquid (HYPE) was trading at $31.24, down 5.7% in the past 24 hours. Over the last week, it moved between $26.22 and $33.33, ending roughly 7% higher. However, the token has decreased by roughly 10% per month.
HYPE continues to be one of the better-performing altcoins despite the recent decline. Over the past year, the token has increased by about 80%, despite difficulties in the larger cryptocurrency market.
Derivatives activity has cooled slightly. CoinGlass data shows that trading volume dropped 18% to about $1.25 billion, while open interest fell 7.5% to $1.21 billion, showing some traders closing their positions.
HYPE token fundamentals
HYPE’s price is influenced by several structural factors. The core of Hyperliquid’s ecosystem is perpetual futures trading, and the Assistance Fund for token buybacks receives about 97% of platform fees.
Increases in trading are directly correlated with increases in buybacks. For example, when trading volumes averaged $29 billion daily, $5.82 million in buybacks were generated, demonstrating a direct correlation between trading demand and token support.
Market sentiment has also been influenced by protocol upgrades. Permissionless perpetual markets were introduced by HIP-3, which produced a total volume of about $83 billion.
HIP-4 proposal aims to launch outcome trading products, combining prediction markets, options, and binary-style contracts. These additions could expand platform activity if more retail or institutional traders participate.
Hyperliquid price technical analysis
HYPE appears to be entering a compressed volatility phase. Bollinger Bands have tightened on the daily chart, which is frequently an indication of an impending big move.
The upper band, which has caused pullbacks in recent sessions, is being tested by the price.

The structure of the market has improved. HYPE has formed a string of higher lows around $26 and $29 since late January, indicating that buyers are intervening earlier on dips. This outlook is also supported by momentum indicators.
There is potential for more gains as the relative strength index is in the mid-50s and trending upward. Meanwhile, the mid-Bollinger Band has been offering dynamic support around $29.
A move toward $35 could ensue if HYPE breaks above $33–$34, with a possible extension to $38 if buying pressure increases. Deeper losses could retest the $26 base, and rejection at resistance could push the token back toward $29 on the downside.
The post from Eric Trump, tagging his crypto company, came hours after his father claimed banks were holding a market structure bill “hostage.”
Eric Trump, son of US President Donald Trump and one of the co-founders of the family-backed crypto business World Liberty Financial, has jumped on the anti-bank messaging that many in the industry are espousing amid disagreements over how to handle stablecoin rewards.
In a Wednesday X post, Eric Trump echoed his father, claiming that banks were “desperately targeting” cryptocurrencies and stablecoins as discussions lag on the market structure bill in the US Senate. The post came hours after the president posted a similar message claiming that banks were holding the legislation “hostage.”

The issue of stablecoin yield has been dividing many US lawmakers, banking industry representatives, and crypto companies, stymieing the market structure legislation. Eric Trump and many in the crypto industry oppose a ban on stablecoin yield, arguing it would “block any rewards or perks from being given to customers,” while some banking organizations have argued such rewards could undermine credit and lead to deposit flight risk.
Related: Trump met Coinbase CEO before slamming banks over crypto bill: Report
A company representative, in response to questions about Eric Trump’s post, said that the company was “not a political organization” and he “has been clear about why he helped create World Liberty Financial.”
Senate banking panel has yet to reschedule market structure bill markup
Eric Trump’s message was one of the latest public statements from a leading industry figure after three meetings between White House officials and banking and crypto representatives on how to address stablecoin yield in the market structure bill. The legislation, called the CLARITY Act when it passed the House of Representatives in July, has been delayed by a 43-day government shutdown and debates among lawmakers on ethics, tokenized equities and stablecoins.
Although the Senate Agriculture Committee advanced its version of the bill in January, the banking panel postponed a markup and had yet to reschedule it as of Thursday. Both versions will likely need to pass the two committees and be consolidated before the full Senate can potentially vote on the bill.
Magazine: Bitcoin may face hard fork over any attempt to freeze Satoshi’s coins


Aave Labs is going all in on security ahead of its V4 launch.
The team has spent about $1.5 million on an extensive audit program, making it one of the most intensive security reviews in DeFi so far.
The review process lasted roughly 345 days and involved several security firms, as well as a large public audit contest.
The era of “move fast and break things” is fading. In today’s market, resilience and security are becoming the real competitive edge.
- Audit Scale: The $1.5 million program covered 345 days of cumulative review across four major firms and 900+ independent researchers.
- V4 Architecture: Aave has shifted to a “security-first” model where formal verification runs parallel to code writing, not after.
- TVL Implication: The zero-critical-finding result from the public contest signals institutional-grade readiness for V4 liquidity scaling.
Aave Labs $1.5M Audit Program: What the Investment Signals About V4 Risk
The V4 audit went far beyond a normal protocol upgrade.
Backed by funding from the Aave DAO, the team brought in major security firms like ChainSecurity, Trail of Bits, Blackthorn, and Certora. Instead of one audit pass, the code was tested from multiple angles.
Altogether, the protocol underwent nearly a full year of testing by internal teams, external auditors, and independent researchers. One of the biggest phases was a six-week public security contest on Sherlock between December 2025 and January 2026.
More than 900 researchers joined the contest and submitted over 950 findings. Despite that massive review, no critical or high-severity vulnerabilities were found.
That clean result strengthens confidence in Aave’s hub-and-spoke architecture, which was designed to reduce the protocol’s overall attack surface.
Aave V4’s Layered Security Model: How It Works and Why It’s Different
Aave Labs is moving away from the old “build first, audit later” approach. With V4, security teams are working alongside developers from day one.
The framework revolves around five core ideas: formal verification to mathematically test the code, layered reviews combining manual audits and automated testing, continuous checks on every code update, ongoing bug bounties, and AI tools scanning for unusual attack paths.
The AI element stands out. Automated systems can catch edge cases that human auditors might miss. Verification firm Certora helped define strict rules, called invariants, that the code must always follow before it even reaches manual review.
Early researchers who examined the code described it as unusually clean for a pre-audit project. The architecture also reduces the attack surface, helping eliminate common DeFi exploit points before launch.
Security is becoming a major competitive advantage in DeFi. Institutional capital will not touch protocols that carry unknown smart contract risk. Spending $1.5 million upfront on security is a small price to pay for the value locked in the protocol, but it sends a strong trust signal.
The next key test will come after launch. If Aave V4 runs its first months without major issues, cautious capital that has stayed away from DeFi after recent hacks could start flowing back in.
The post Aave Labs Outlines Layered Security Plan for V4 After $1.5 Million Audit appeared first on Cryptonews.


Ethereum derivatives markets saw a sharp bout of deleveraging over the past day, with total ETH contract open interest across major centralized exchanges falling 5.62% to 27.119 billion dollars, according to Coinglass data.
Summary
According to data from Coinglass, the total open interest of Ethereum (ETH) contracts across the network has contracted by 5.62% in the past 24 hours, bringing the figure down to 27.119 billion dollars.
The decline signals a decisive round of risk reduction in the derivatives market, with traders closing or being forced out of leveraged positions as conditions turn more defensive. While granular liquidation figures were not provided, the magnitude of the move suggests a mix of voluntary deleveraging and margin-driven position exits rather than a purely organic rotation.
Binance remains the largest concentration point for ETH derivatives risk, now holding 5.74 billion dollars in open interest, while Gate registers 2.866 billion dollars, Bybit 2.059 billion dollars, and OKX 1.772 billion dollars. This clustering of leverage on a handful of venues means that order book dislocations or sudden funding shifts on these exchanges can quickly bleed into spot pricing. For basis and spread traders, the reset in open interest may open up cleaner arbitrage conditions after a period of elevated speculative positioning.
Historically, single‑day pullbacks of this scale in open interest have often acted as either mid‑trend “cleanup” events or the first leg of a broader de‑risking cycle, depending on subsequent spot demand and funding dynamics. If funding normalizes and fresh spot buying emerges, the current move could be framed as a healthy clearing of excess leverage built up during prior rallies. However, if open interest continues to grind lower while spot remains under pressure, it would indicate that systematic and speculative capital are still in distribution mode.
At press time, Ethereum is trading around 2,067 dollars, down approximately 3.65% over the past 24 hours, broadly echoing the scale of the derivatives drawdown. In the near term, traders are watching the 2,000‑dollar psychological level as key support; holding that zone while open interest stabilizes would support a consolidation narrative, whereas a decisive break lower alongside further OI contraction could signal an extension of the current downside phase.
TLDR:
- Web3 Foundation has closed its General Grants Program, Decentralized Voices, and several other key initiatives.
- W3F is now focused on two pillars: global Web3 evangelism and responsible long-term asset management.
- Polkadot’s next development phase is being led by Parity Technologies and its broader builder community.
- On-chain treasury and governance tools remain active, ensuring decentralized funding continues without W3F oversight.
Web3 Foundation has announced a major strategic realignment, stepping back from its hands-on operational role.
The organization is returning to its founding purpose: championing decentralized web technologies on a global scale.
For years, W3F actively helped bootstrap networks like Polkadot and Kusama into functioning, community-driven ecosystems.
As those networks have now reached a level of maturity, the Foundation is refocusing its priorities. It will concentrate on global advocacy and disciplined long-term asset management.
Concluded Programs Mark a Shift in the Foundation’s Operational Direction
Web3 Foundation has already closed several key programs as part of this transition. These include the General Grants Program, Support, Decentralized Voices, and Decentralized Nodes.
Each of these programs played a distinct role during the ecosystem’s early growth stages. Their conclusion marks a clear shift in how W3F operates.
Over the past year, W3F undertook a thorough review of its programs and spending. Several resource-heavy bounties were closed, and spending was carefully audited throughout this period.
Clearer documentation and operational guidelines were established based on lessons learned along the way.
Moreover, several additional initiatives are being evaluated for transition to external teams. These include the JAM Prize, Polkadot Governance Support, the Polkadot Wiki, and developer documentation.
The Knowledge Base and Kusama Vision are also among the programs being considered for handover.
Despite these changes, decentralized funding mechanisms remain fully active within the ecosystem. Communities still have direct access to on-chain governance and treasury tools for funding initiatives. These pathways continue to support innovation without requiring centralized oversight from the Foundation.
Two Core Priorities Will Define the Foundation’s Long-Term Strategy
Web3 Foundation is now centering its work around two clear pillars going forward. The first involves evangelizing and advancing the decentralized web on a global scale. The second focuses on safeguarding the Foundation’s assets in alignment with its broader Web3 mission.
At the same time, Polkadot is entering a phase focused on building products with real-world utility. Parity Technologies and a wider community of builders are now driving this development stage. The Foundation’s reduced operational role is designed to complement, rather than direct, this effort.
This transition also reflects how blockchain ecosystems naturally evolve over time. As networks become self-sustaining, support structures around them must adapt accordingly.
W3F is repositioning itself as a long-term steward rather than a day-to-day operational body. This approach allows the Foundation to focus on higher-level advocacy work.
Furthermore, this realignment places greater emphasis on disciplined asset allocation going forward. Resources will be directed toward efforts with the greatest global impact.
Through advocacy and financial stewardship, the Foundation aims to strengthen the Web3 ecosystem for years to come.
Crypto World
WhiteBIT Coin ($WBT) Officially Listed on Kraken Exchange, Highlighting Its Growing Recognition

[PRESS RELEASE – Vilnius, Lithuania, March 5th, 2026]
WhiteBIT, the largest European cryptocurrency exchange by traffic, announces that its native WhiteBIT Coin (WBT) is now trading on Kraken, one of the world’s long-standing crypto platforms. WBT trading is available on WBT/EUR and WBT/USD pairs, giving more traders worldwide access to the coin and reflecting the asset’s growing recognition in the market.
The listing marks a significant milestone for WhiteBIT, following rapid growth in 2025, during which WBT surged 160%, reaching an all-time-high of $64.11 and solidifying its position as the 11th-largest cryptocurrency by market capitalization at $10.7 billion, according to CoinGecko.
“Listing WBT on Kraken represents a logical next step in the expansion of the WhiteBIT ecosystem,” said Volodymyr Nosov, Founder and President of W Group, which WhiteBIT is a part of. “It reflects the momentum we’ve built through ecosystem growth, strategic partnerships, and increasing institutional visibility. It’s another important endorsement of WBT’s value and its role in the future of digital finance.”
This momentum has been powered by the expansion of the W Group ecosystem, which WhiteBIT is a part of, including:
- High-profile partnerships, such as the collaboration with Juventus, making WhiteBIT the club’s Official Sleeve and Cryptocurrency Exchange Partner.
- Global market expansion, with new operations in South America and the United States.
- Strategic cooperation in the Middle East, including partnership with Saudi Arabia to develop blockchain infrastructure and CBDC framework.
- Institutional recognition, including WBT’s inclusion in the S&P Crypto Indices, reflecting the token’s growing liquidity and market relevance.
Launched in 2022, WhiteBIT Coin (WBT) is the native utility token of the WhiteBIT platform. It offers significant advantages within the WhiteBIT exchange ecosystem, including reduced trading fees (up to 100% discount), increased referral bonuses (up to 50%), and free daily withdrawals. Users also gain from free AML checks, staking rewards up to 22.1%, and exclusive access to new projects via the WhiteBIT Launchpad.
The addition of WBT to Kraken not only expands access for traders worldwide but also reinforces WhiteBIT’s commitment to developing a globally recognized exchange-native coin that delivers utility, liquidity, and long-term value.
About WhiteBIT
WhiteBIT is the largest European cryptocurrency exchange by traffic, offering over 900 trading pairs, 350+ assets, and supporting 8 fiat currencies. Founded in 2018, the platform is a part of W Group which serves more than 35 million customers globally. WhiteBIT collaborates with Visa, FACEIT, FC Juventus and the Ukrainian national football team. The company is dedicated to driving the widespread adoption of blockchain technology worldwide.
Binance Free $600 (CryptoPotato Exclusive): Use this link to register a new account and receive $600 exclusive welcome offer on Binance (full details).
LIMITED OFFER for CryptoPotato readers at Bybit: Use this link to register and open a $500 FREE position on any coin!
‘One of the best’ period dramas confirmed to be ending after new series
Cloudflare’s Zatlyn sells $13.9 million in shares

SEC Schedules April 16 Roundtable to Review Listed Options Market Structure Reform


-

 Politics3 days ago
Alan Cumming Brands Baftas Ceremony A ‘Triggering S**tshow’
-

 Fashion6 days ago
Weekend Open Thread: Iris Top
-

 Tech5 days ago
Unihertz’s Titan 2 Elite Arrives Just as Physical Keyboards Refuse to Fade Away
-

 NewsBeat5 days ago
Abusive parents will now be treated like sex offenders and placed on a ‘child cruelty register’ | News UK
-
 NewsBeat5 days ago
Dubai flights cancelled as Brit told airspace closed ’10 minutes after boarding’
-
Sports6 days ago
The Vikings Need a Duck
-
 NewsBeat6 days ago
The empty pub on busy Cambridge road that has been boarded up for years
-

 NewsBeat4 days ago
‘Significant’ damage to boarded-up Horden house after fire
-

 Tech18 hours ago
Bitwarden adds support for passkey login on Windows 11
-

 Entertainment4 days ago
Baby Gear Guide: Strollers, Car Seats
-
 Sports7 hours ago
499 runs and 34 sixes later, India beat England to enter T20 World Cup final | Cricket News
-
 Tech7 days ago
NASA Reveals Identity of Astronaut Who Suffered Medical Incident Aboard ISS
-
Politics5 days ago
FIFA hypocrisy after Israel murder over 400 Palestinian footballers
-
 NewsBeat5 days ago
Emirates confirms when flights will resume amid Dubai airport chaos
-

 NewsBeat3 days ago
Is it acceptable to comment on the appearance of strangers in public? Readers discuss
-

 Tech5 days ago
Viral ad shows aged Musk, Altman, and Bezos using jobless humans to power AI
-

 Video4 days ago
How to Build Finance Dashboards With AI in Minutes
-

 Business2 days ago
Guthrie Disappearance Enters Fifth Week as Family Visits Memorial
-
 Crypto World5 days ago
US Judge Lets Binance Unregistered Token Class Action Proceed
-
 NewsBeat4 days ago
Ukraine-Russia war latest: Belgium releases video showing forces boarding Russian shadow fleet oil tanker