
Crypto World
BTC funds see $1.7 billion in recent inflows


After weeks of steady withdrawals, investors are beginning to allocate fresh capital to U.S. spot bitcoin exchange-traded funds (ETFs).
The shift follows a difficult start to the year for the products. From mid-October, when bitcoin’s price began its downfall, through late February, spot bitcoin ETFs recorded cumulative outflows of about $9 billion, according to data from Bloomberg Intelligence ETF analyst James Seyffart. The category still shows $1.1 billion in net outflows for 2026, but flows have shifted in recent days. Since Feb. 24, investors have added roughly $1.7 billion.
The rebound suggests some investors believe bitcoin may have found at least a short-term floor.
“It was surprising to me that there was basically no dip buying when bitcoin was a falling knife to start the year,” Seyffart said. At the time, software stocks and crypto assets were both sliding, yet investor behavior split. Software ETFs pulled in record inflows as traders tried to time a bottom while bitcoin ETFs continued to see steady withdrawals.
Those withdrawals were not dramatic, but they persisted.
Now the pattern appears to be reversing. Seyffart said recent price action may have helped restore confidence. Over the weekend, bitcoin held above its recent lows despite geopolitical tensions tied to Iran.
“I think investors are likely feeling a bit more comfortable that we have hit at least a near-term bottom,” Seyffart said. “That higher low this weekend on such massive news had to be a comfort to some.”
The inflows also appear to reflect outright bullish positioning rather than market-neutral trading strategies. Some institutional investors use ETFs and futures together in what is known as a basis trade, where they capture yield from price differences between spot and futures markets.
But that setup does not appear attractive right now.
Yields tied to those trades remain relatively low, while open interest across CME’s crypto futures and options markets has declined. That drop suggests fewer traders are putting on large derivatives positions that typically accompany arbitrage strategies.
Instead, the ETF inflows look more like straightforward bets on bitcoin’s price direction.
Despite bitcoin falling about 16% this year, nearly all spot bitcoin ETFs still show net positive flows for 2026, with BlackRock’s iShares Bitcoin Trust (IBIT) adding roughly $300 million in capital year-to-date. That dynamic highlights how investors continue to allocate through regulated fund structures even during downturns.
Nate Geraci, president of the ETF Store, said the flows also reflect growing conviction among large asset managers promoting the funds.
“It’s easy to frame this as BlackRock simply promoting its highest-revenue product,” Geraci said. “But I see it more as the firm doubling down on its conviction that bitcoin belongs in diversified portfolios.”
Geraci noted that BlackRock has many higher-fee ETFs it could spotlight instead. Meanwhile its spot bitcoin ETF, IBIT, is down about 4% this year. Asset managers rarely highlight lagging funds unless they believe strongly in the long-term case, he said.


Robinhood has approved a share repurchase program worth $1.5 billion, according to a filing with the U.S. Securities and Exchange Commission on Tuesday. The company said it plans to execute the buyback over the next three years.
Summary
- Robinhood approved a $1.5 billion share buyback program to run over the next three years.
- HOOD closed down 4.7% Tuesday and remains nearly 39% lower so far in 2026 overall.
- Robinhood replaced its prior credit line with a new $3.25 billion JPMorgan revolving facility Tuesday.
According to the filing, the total includes $1.1 billion in new capacity. Robinhood rolled over the rest from an older repurchase plan. The company said the move reflects its capital plans as it continues to build new products and return value to shareholders over time.
Robinhood Chief Financial Officer Shiv Verma addressed the decision in a company statement. He said,
“Robinhood is a generational company with a massive long-term opportunity.” Verma also said, “This authorization reflects the confidence of our management team and board in our ability to continue delivering innovative products for customers and creating value for shareholders while returning capital over time.”
The company linked the program to its broader business strategy rather than to a short-term market move.
Robinhood shares closed Tuesday at $69.08, down 4.7% on the day. That marked the stock’s lowest closing price of the year. The shares later recovered slightly to $70.90 in after-hours trading.
The stock has fallen nearly 39% so far this year. It also stands 54.7% below its October peak of $152.46. The decline came during a weak period for both stocks and crypto, with broader macro concerns and the Iran war weighing on risk assets.
Credit facility expands while growth plans continue
Robinhood also said its unit, Robinhood Securities, entered a new $3.25 billion revolving credit facility with JPMorgan Chase. The new facility replaces a prior $2.65 billion line. It also includes an option to expand by up to $1.62 billion, which would bring the total capacity to $4.87 billion.
Even with pressure on its share price, Robinhood continues to push into crypto, tokenization, and adjacent financial products. The company launched the testnet for its Ethereum layer-2 network in February. Chief Executive Officer Vlad Tenev said the network processed 4 million transactions in its first week of public testnet activity.
Robinhood plans to launch the mainnet later this year to support tokenized equities, ETFs, and other traditional financial assets. Robinhood Ventures Fund has also invested about $35 million across Stripe and ElevenLabs.

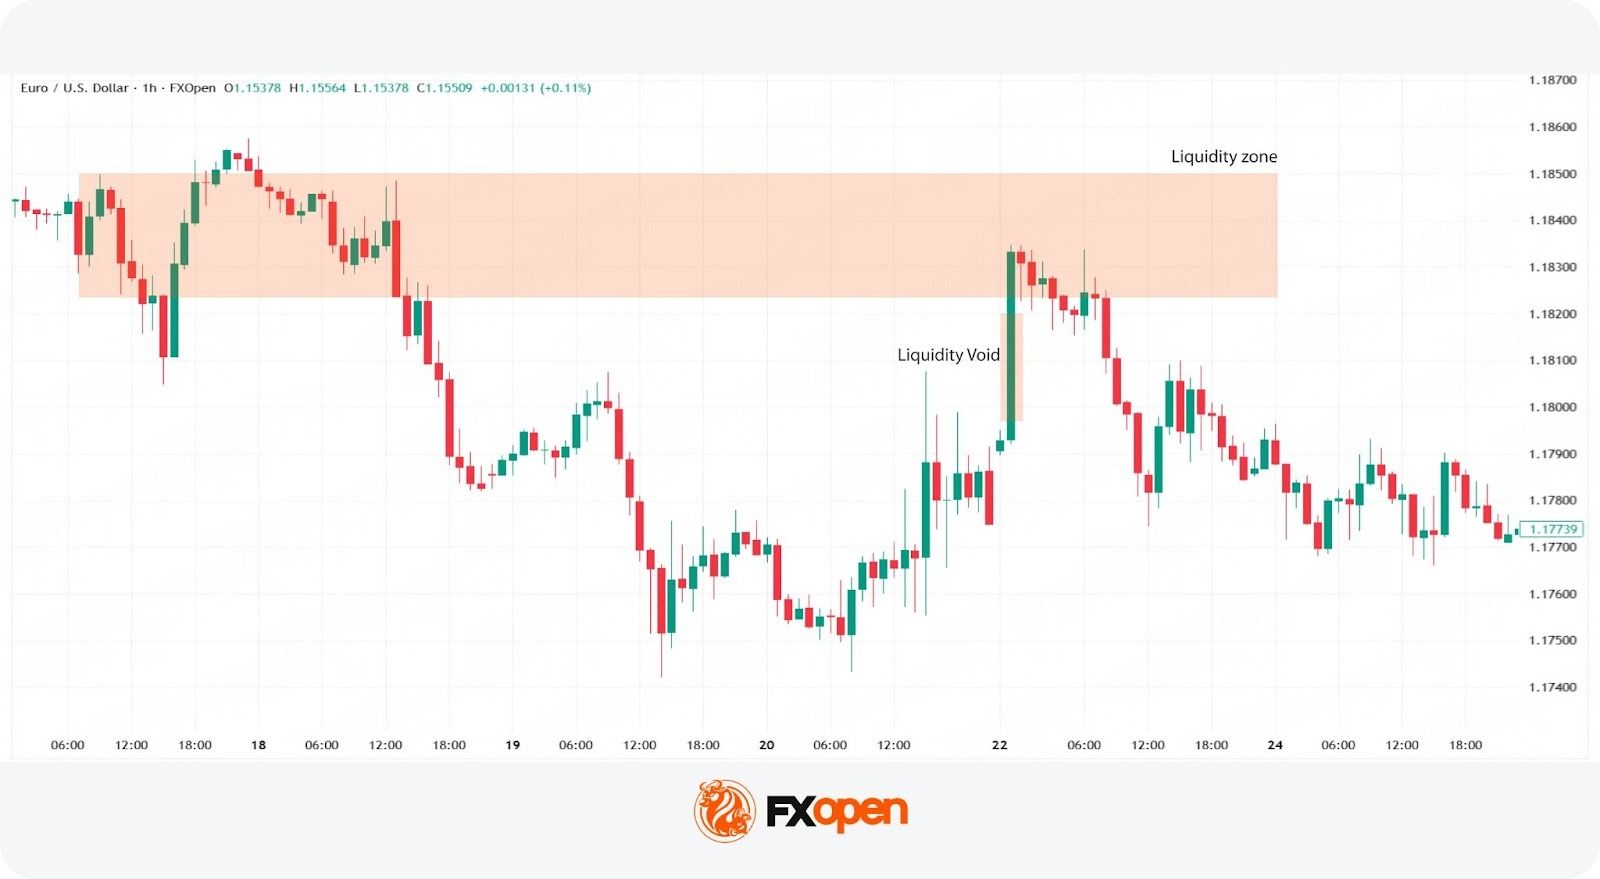
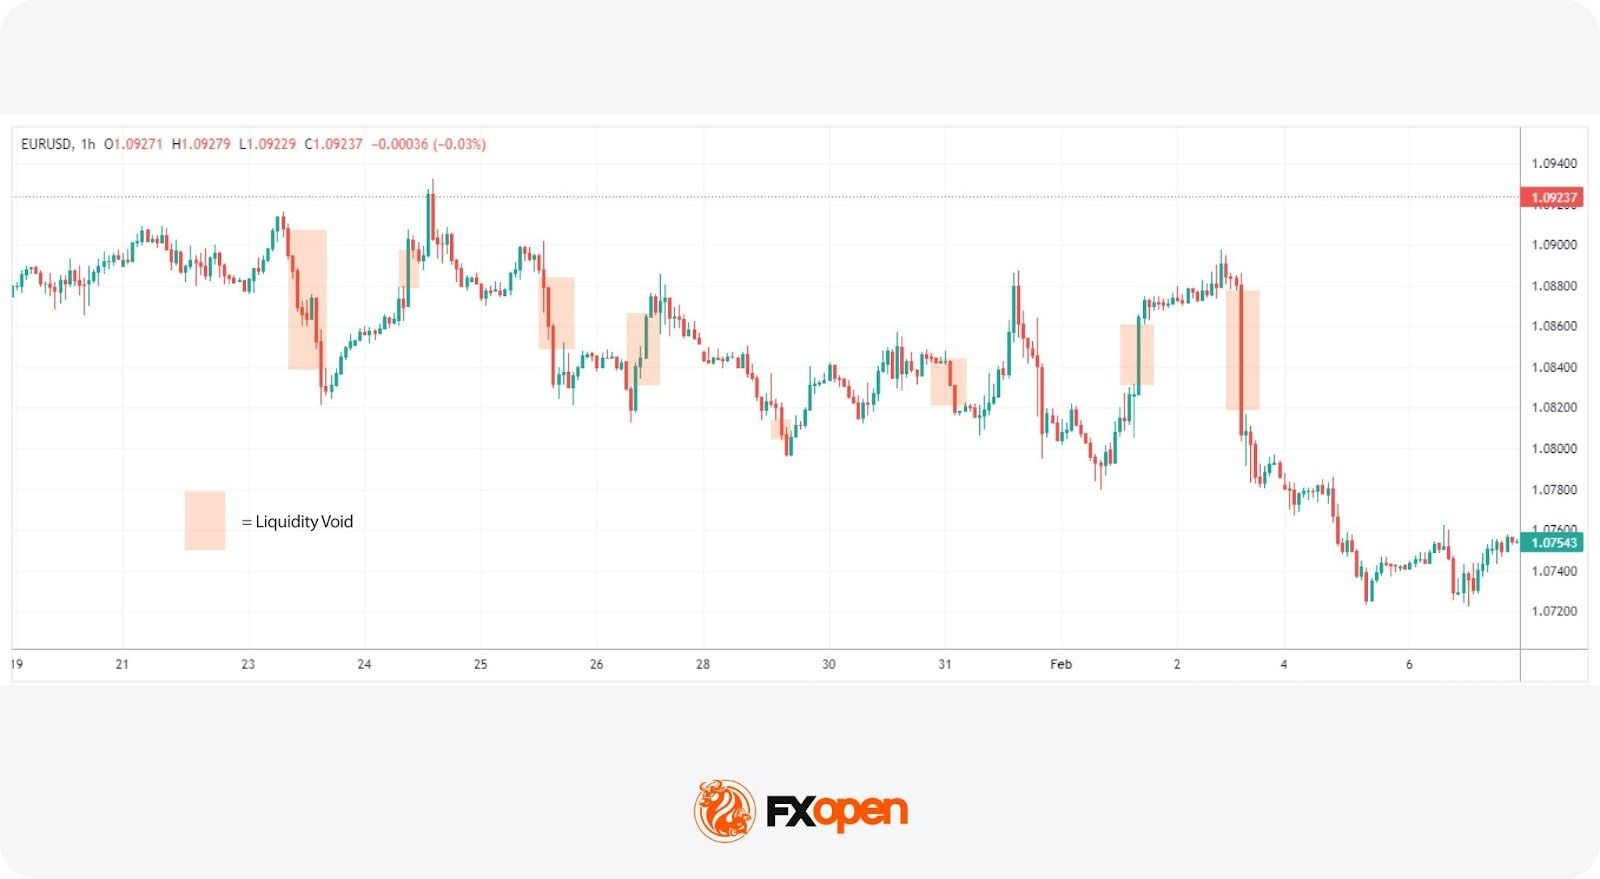
Liquidity zones are areas where large buy and sell orders cluster, often acting as support or resistance. Liquidity voids (or imbalances) are fast price moves where little trading occurred, and price often returns to fill them.
Traders use liquidity zones to identify entry and exit points, while liquidity voids may help anticipate retracements and continuation moves.
This article explains how liquidity zones and liquidity voids function in market structure and highlights their role on price charts.
Takeaways
- Liquidity zones = high trading activity (support/resistance)
- Liquidity voids = low activity (fast price moves)
- Price tends to:
- move towards liquidity
- return to fill voids
- Commonly used with:
- market structure
- volume analysis
Liquidity Zones vs Liquidity Voids
Liquidity zones and liquidity voids differ primarily in how order flow is distributed and how price behaves within each environment.
In liquidity zones, trading activity is elevated due to the presence of clustered orders around previous highs, lows, or consolidation ranges. This concentration of liquidity typically causes prices to slow down, rotate, or produce reactions, reinforcing their role as support and resistance areas.
In contrast, liquidity voids form during strong directional moves, leaving behind areas where little trading activity has previously occurred. As a result, when price revisits these regions, it often moves quickly due to the absence of significant opposing orders.
Liquidity zones are generally associated with reversal or breakout strategies, where traders anticipate interaction between buyers and sellers. Liquidity voids, however, are typically approached with mean reversion expectations, as the market tends to rebalance prior inefficiencies.
Understanding Liquidity in Trading
In trading, liquidity refers to how easily an asset can be bought or sold without significantly affecting its price. High liquidity means there are enough buyers and sellers at a given price level, facilitating smoother transactions. This concept is critical because it affects how quickly and at what price a trader can enter or exit positions.
Assets with high liquidity tend to have tighter spreads, which may reduce trading costs.
Conversely, assets with low liquidity can experience abrupt price movements due to limited order flow. Understanding liquidity may help traders make decisions.
These dynamics give rise to two important phenomena in trading: liquidity zones and voids. Liquidity zones are areas with a high concentration of trading activity, while liquidity voids represent gaps in the market where trading activity is sparse, each presenting unique conditions for trading strategies.
What Are Liquidity Zones in Trading?
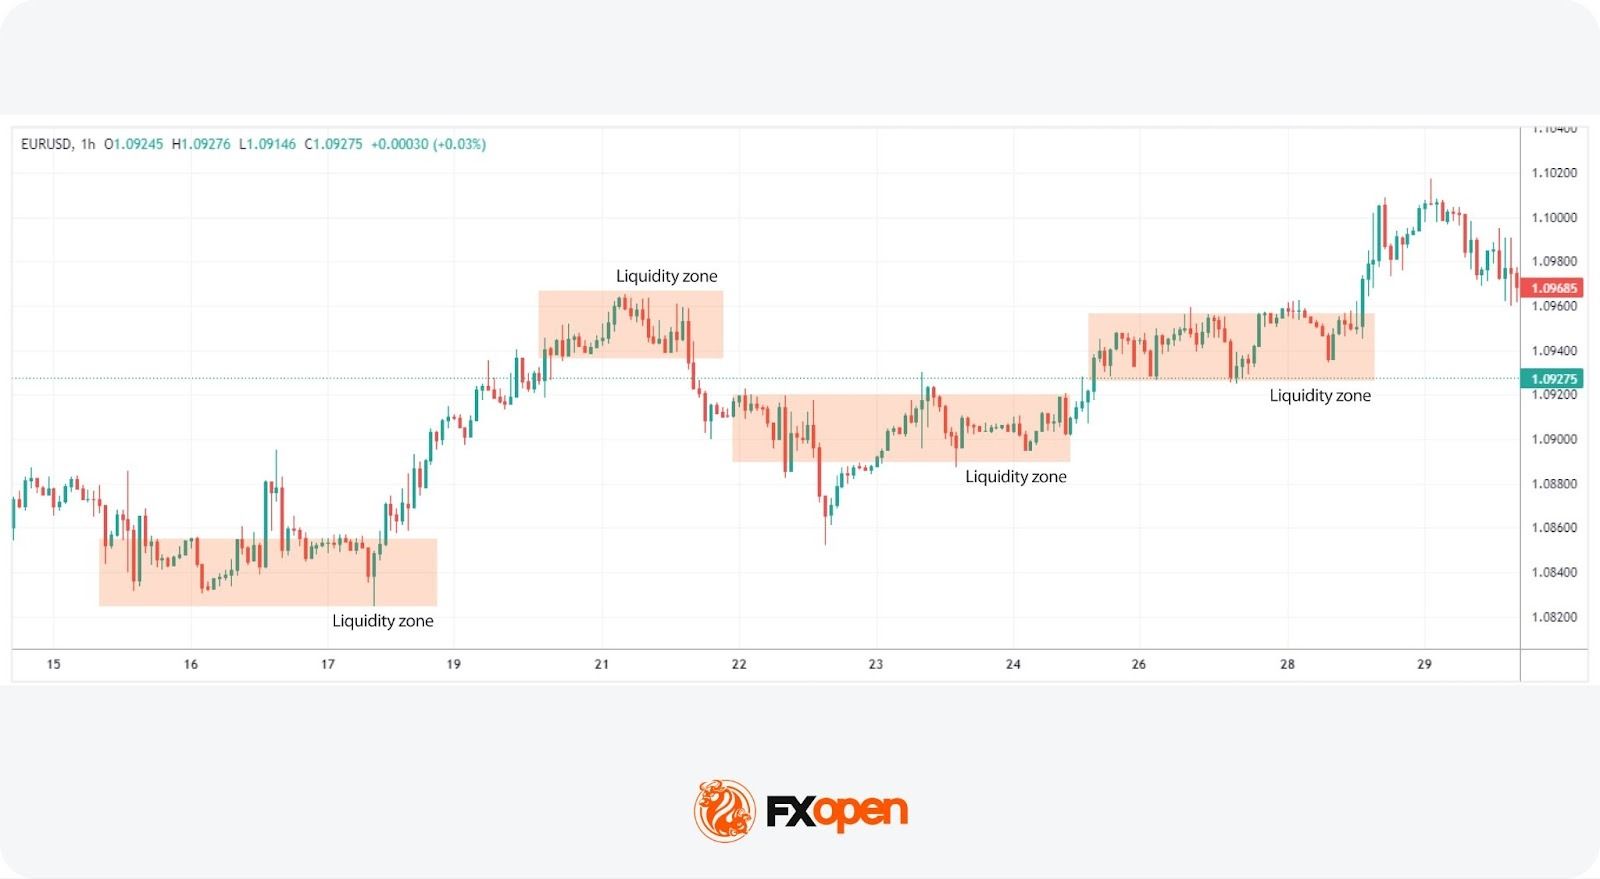
Liquidity zones (also called liquidity levels) are specific areas on a price chart where trading activity is highly concentrated. These zones indicate areas where large orders can be executed with minimal price impact.
Forex liquidity zones highlight areas where currency pairs tend to see higher activity.
These areas may be useful for identifying reversals or breakouts, providing reference points for entries and exits.
These zones often form around historical price levels where significant trading activity has occurred. They often act as magnets, attracting future price movement due to expected order flow. Liquidity levels are commonly associated with support and resistance. When price approaches these levels, traders can expect increased order flow, which may lead to clearer price reactions.
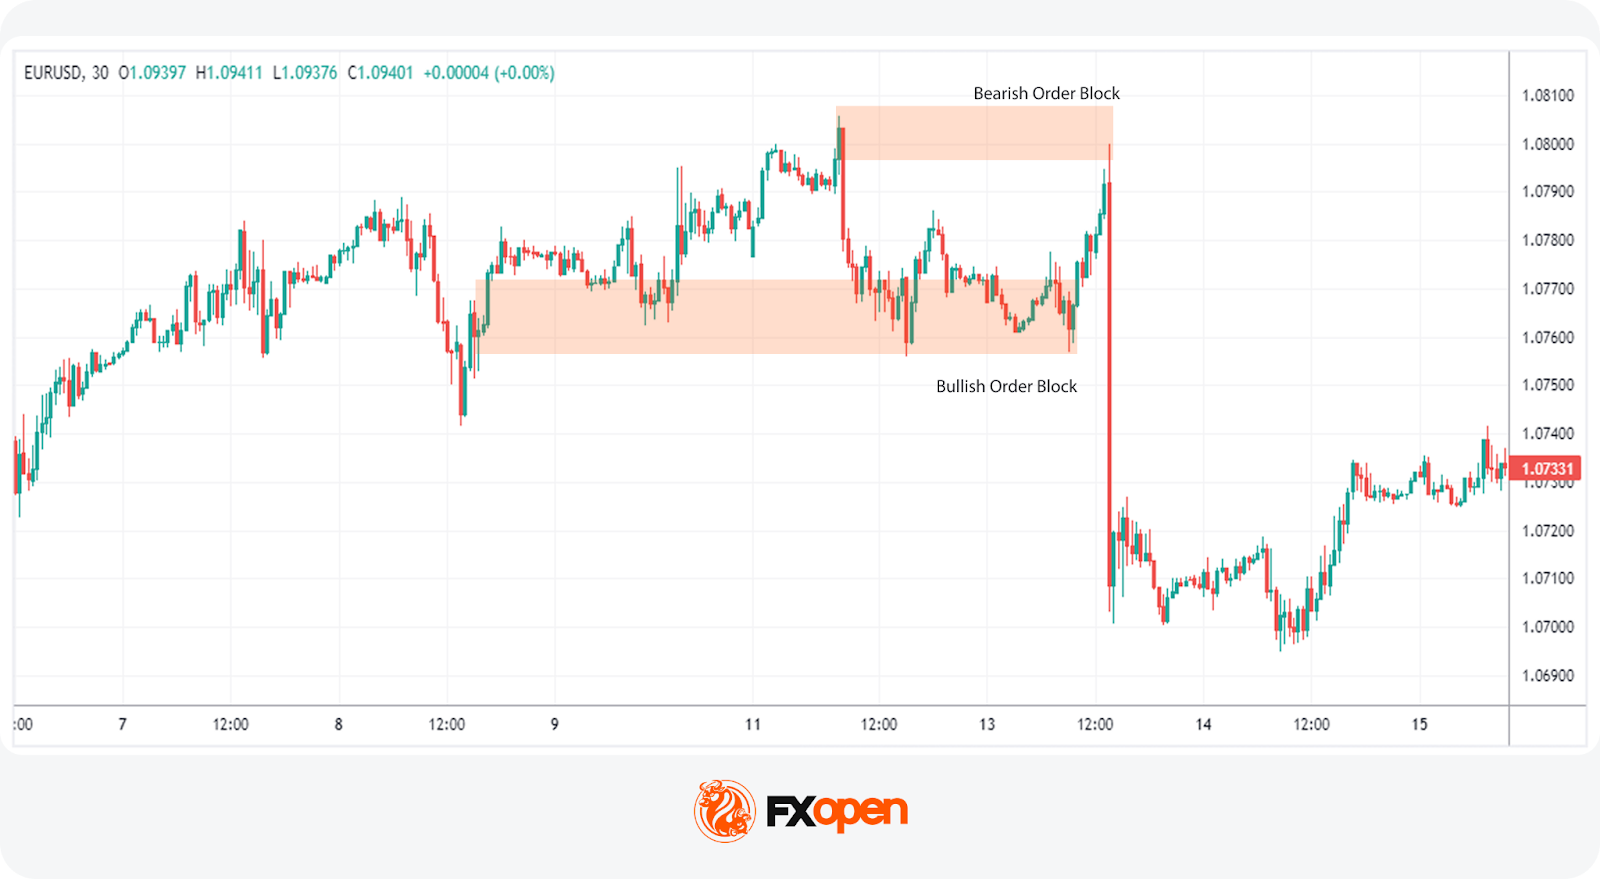
Liquidity Zones vs Order Blocks
How Traders Identify Liquidity Zones (With Examples)
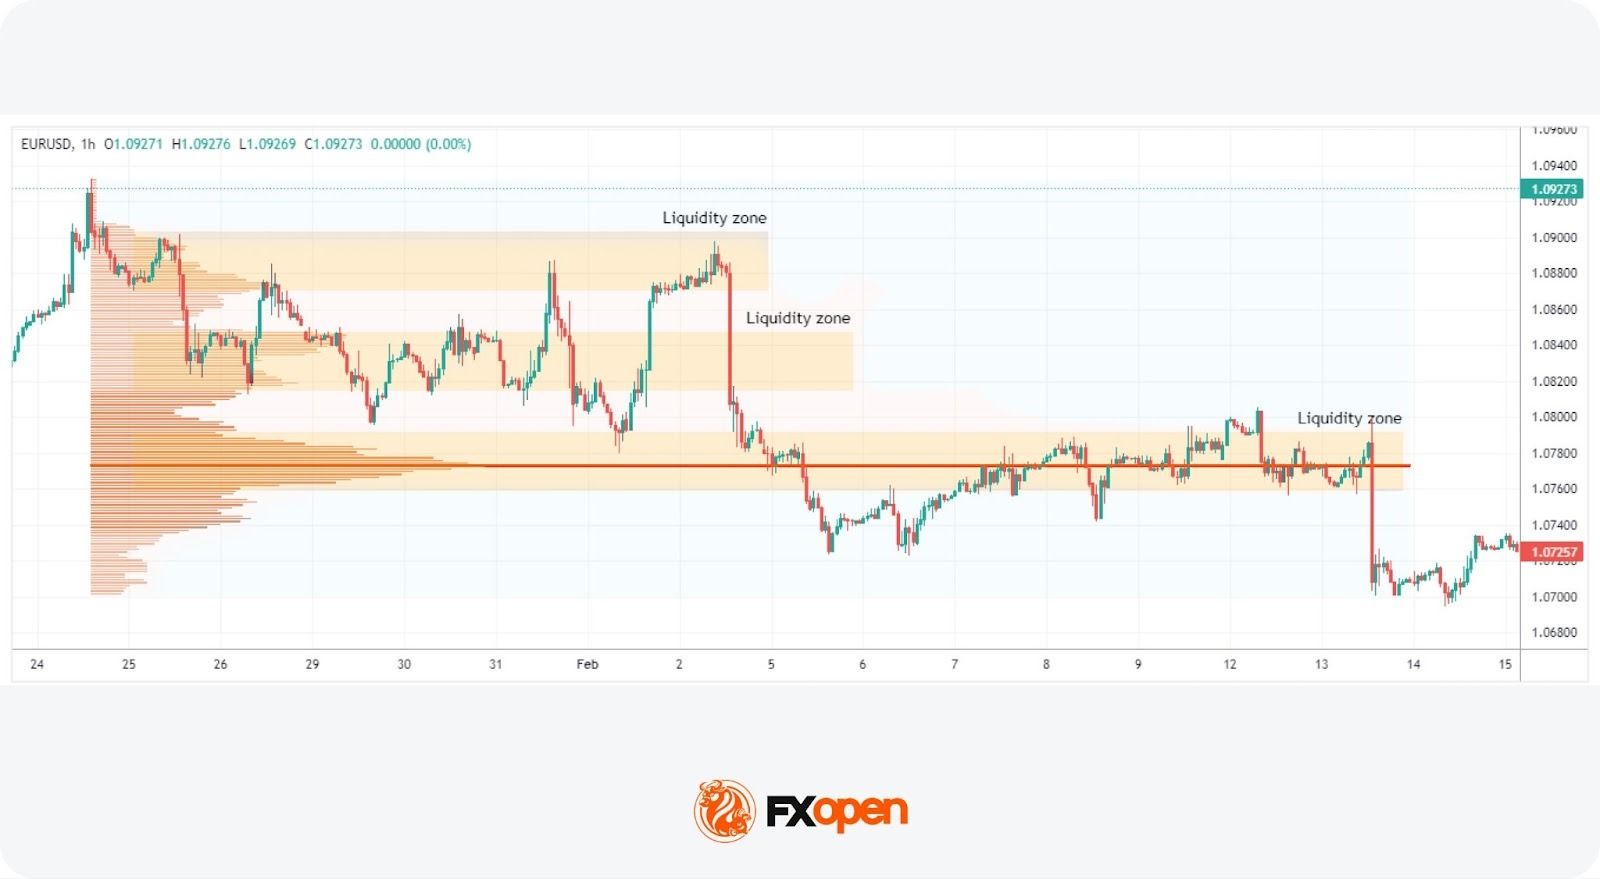
Traders identify liquidity zones using volume, price structure, and historical levels. Liquidity zone trading depends on accurately identifying areas where trading activity is concentrated. These levels highlight regions of high volume and may act as pivot points for price action.
Volume Profile
This approach uses the volume profile to show where most trading activity has occurred.
Unlike traditional indicators that display volume over time, the volume profile shows volume at specific price levels. This may help traders identify peaks in volume, highlighting areas of significant liquidity.
To use the volume profile tool as we have in the picture above, you can head over to FXOpen’s TickTrader trading platform and search for “Volume Profile Fixed Range” under the Indicators tab.
Price Consolidation Areas
Recognising zones where the price has consolidated for a notable period is another method. These areas represent a tug-of-war between buyers and sellers, resulting in a high volume of trades. Such levels often act as magnets for future price action, making them critical for liquidity area trading.
Previous Support and Resistance Levels
Historical support and resistance levels are invaluable for spotting zones. These are levels at which significant reversals or pauses in trend have occurred, indicating areas where large volumes of orders may accumulate. When price approaches these levels again, it often does so with increased trading activity, making them prime candidates for liquidity areas.
What Is a Liquidity Void (Imbalance)?
Liquidity voids (imbalances) are rapid price movements where little trading activity occurs between two levels. These gaps can lead to abrupt price changes and are often visible as sharp moves on a chart.
A liquidity void in forex signals an imbalance between buyers and sellers, causing prices to move quickly. This can result in sharp price movement as the market seeks a new equilibrium. These voids often occur after major news releases, during low-liquidity periods, or due to large institutional trades.
Their impact extends beyond the initial move. They represent areas where the market has not established a consensus price, which may lead to increased volatility later. Prices often return to these areas to “fill” the imbalance and restore balance in the market.
Traders navigate the increased volatility and unpredictability associated with these gaps but can also strategise to take advantage of the potential return to equilibrium.
How Traders Spot Liquidity Voids (Types of Liquidity Voids)
Liquidity voids can be classified based on where they appear in a trend. Liquidity voids in the forex market manifest in various forms, each with distinct characteristics and implications for traders. Understanding the different types of voids may support traders in navigating these challenging areas. Some notable types of liquidity voids are common, exhaustion, breakout, and runaway. Let’s take a look at them:
Common Liquidity Voids
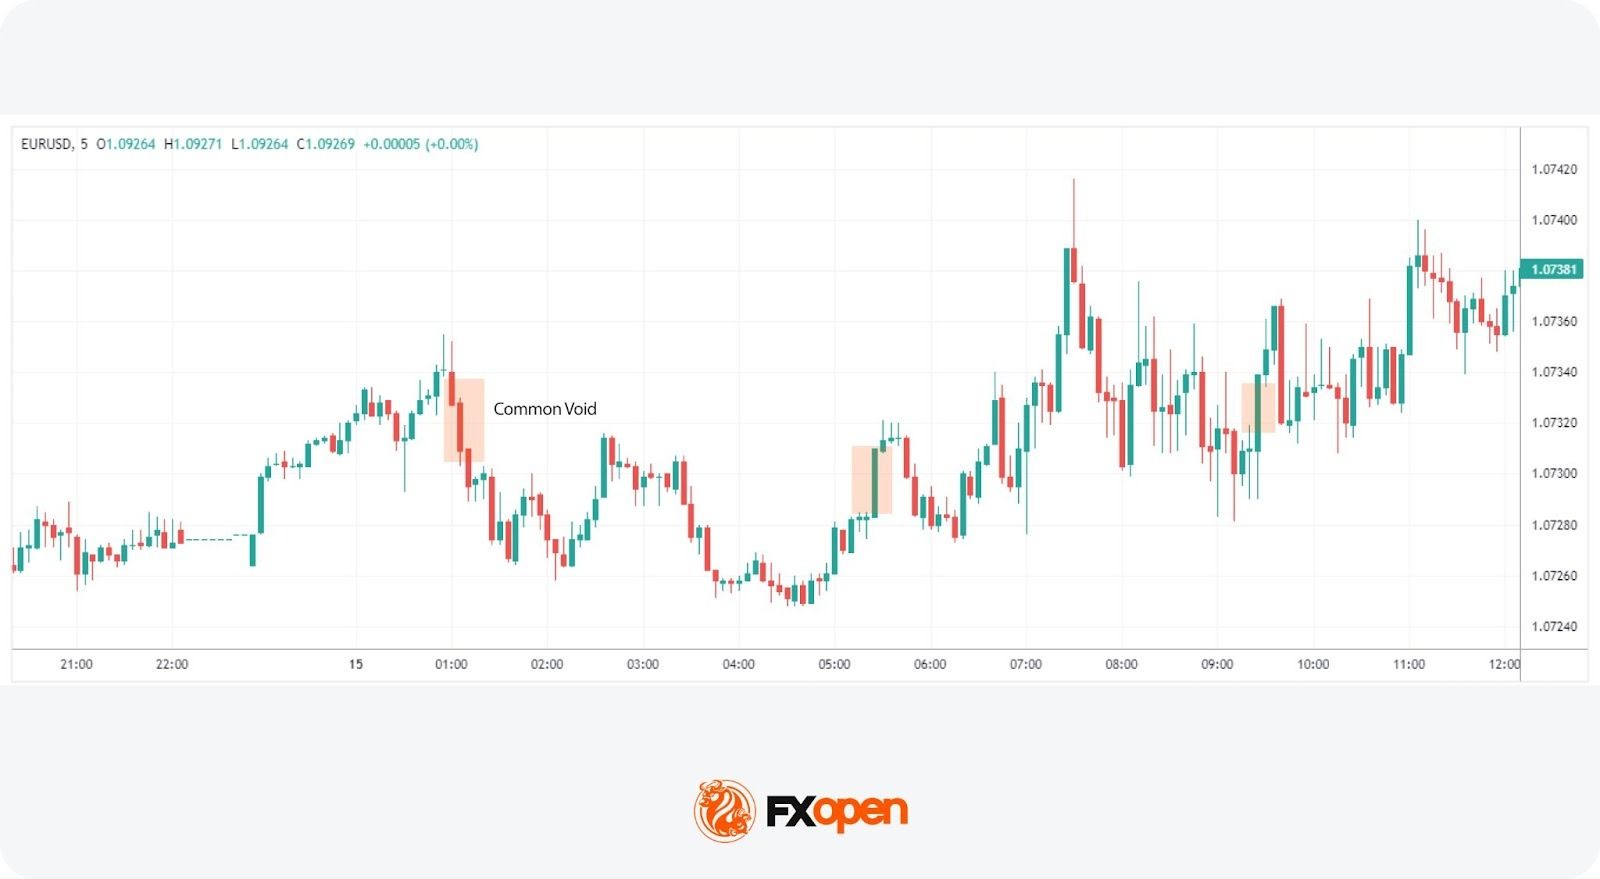
Common voids appear randomly across charts without any news or event trigger, forming from natural market ebb and flow. They don’t always carry significant analytical value but are still worth monitoring for risk management purposes.
Exhaustion Liquidity Voids
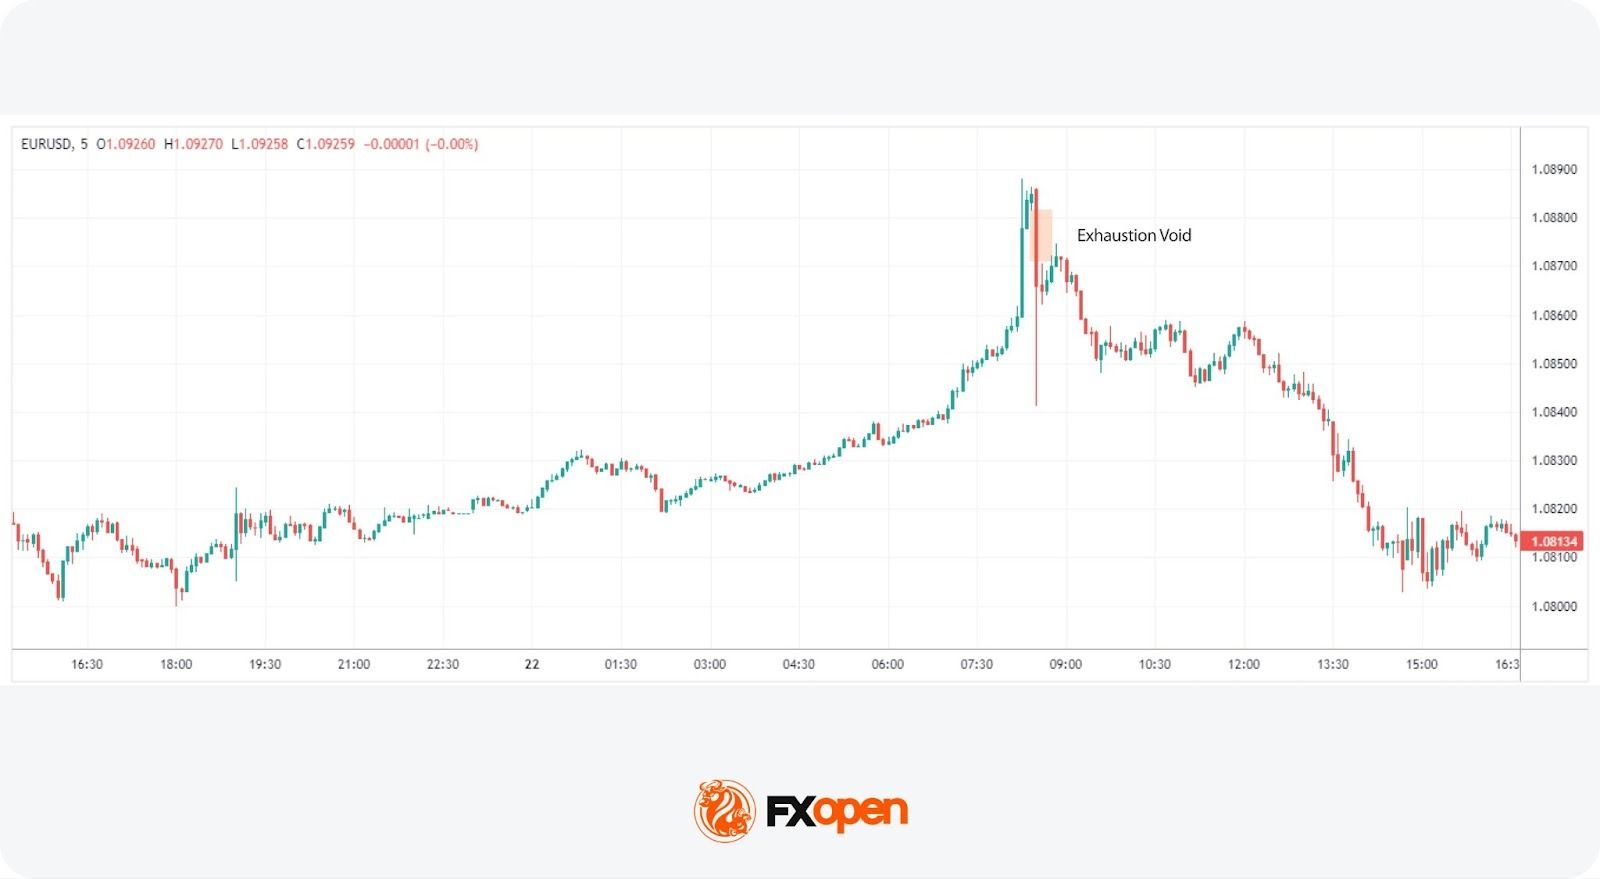
Exhaustion liquidity voids appear at the end of a trend when momentum fades and price makes a final push before reversing. Traders often watch for them as potential signals of a trend reversal.
Breakout Liquidity Voids
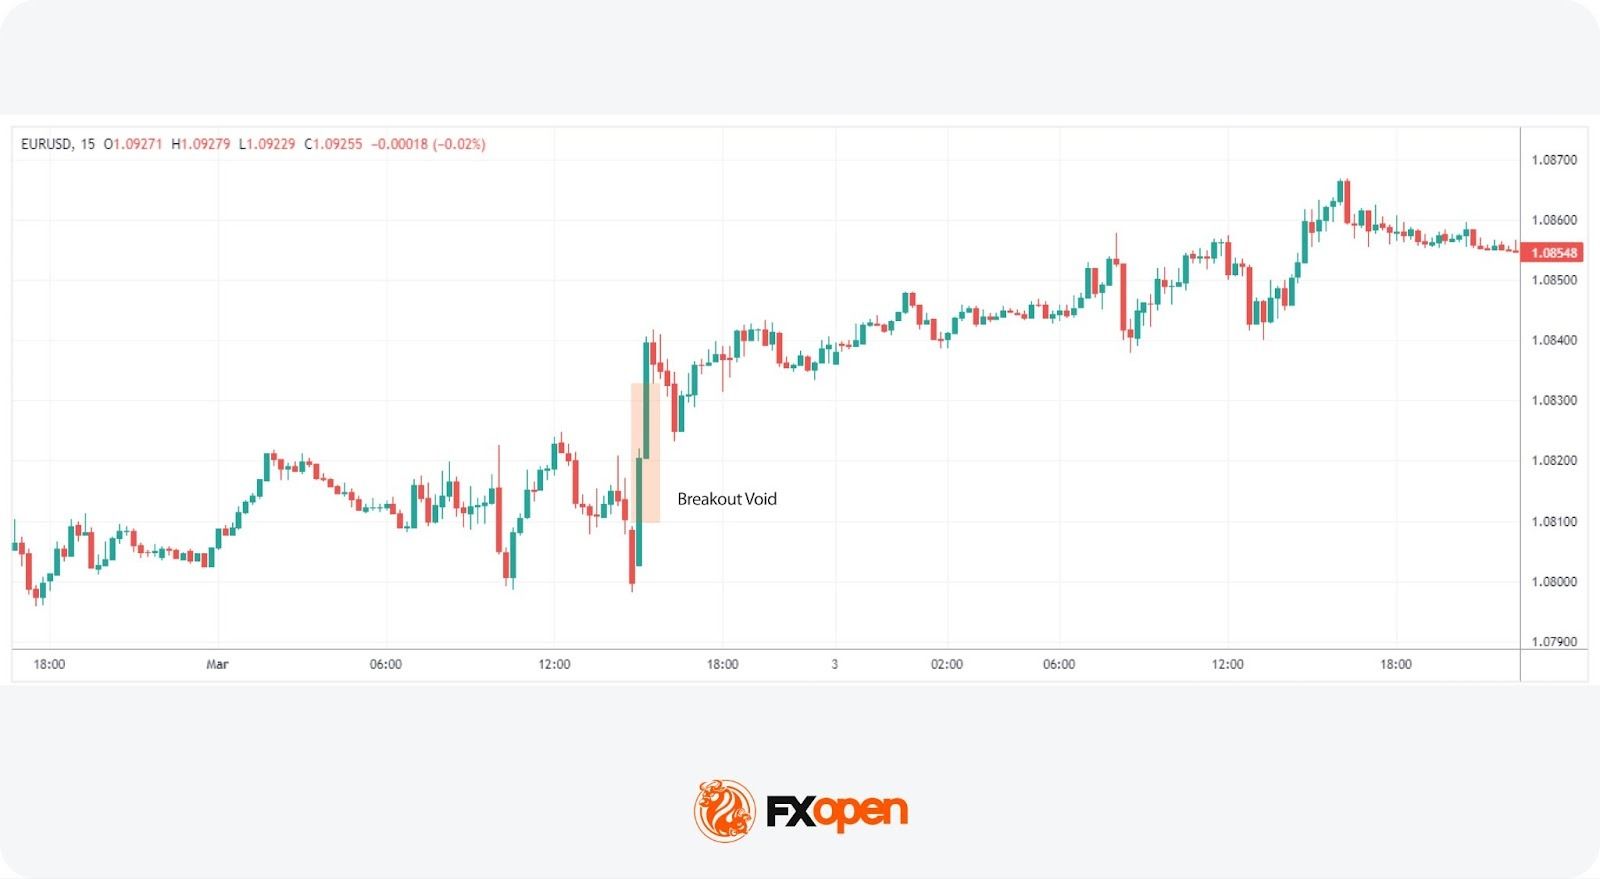
Breakout voids form when price breaks through a key support or resistance level with enough force to leave behind an imbalance. They often signal the beginning of a new trend.
Runaway Liquidity Voids
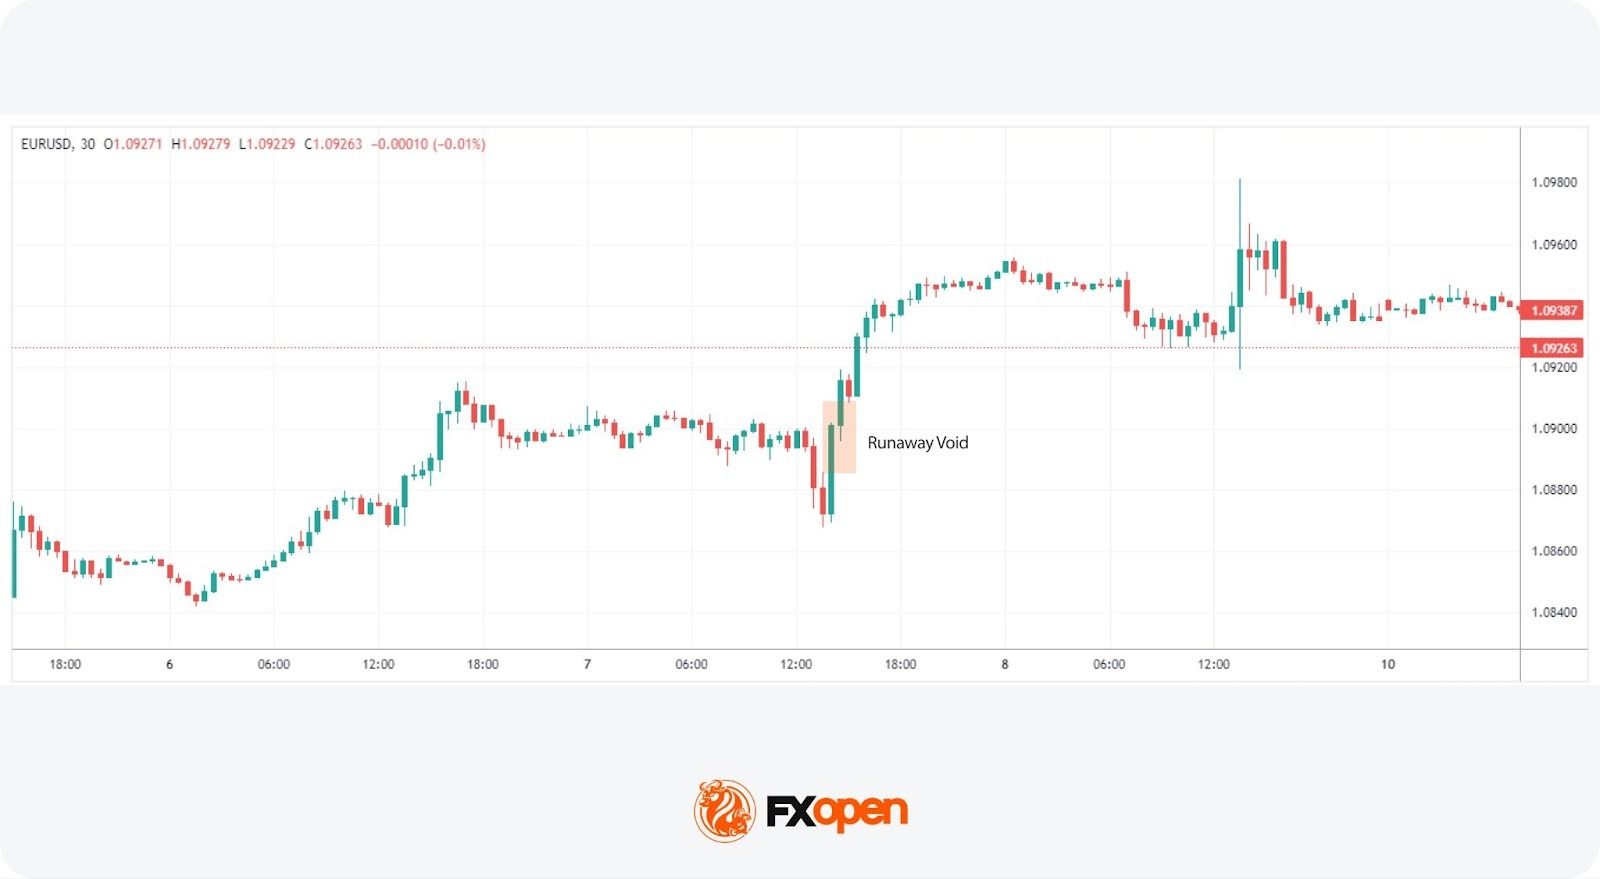
Runaway voids occur within an existing trend and signal its continuation. Price moves sharply in the trend’s direction, bypassing levels where liquidity would normally sit, which may support trend strength confirmation.
How Traders Use Liquidity Zones and Voids
Liquidity zones and voids form the basis of several common trading approaches. Here’s how traders typically work with them.
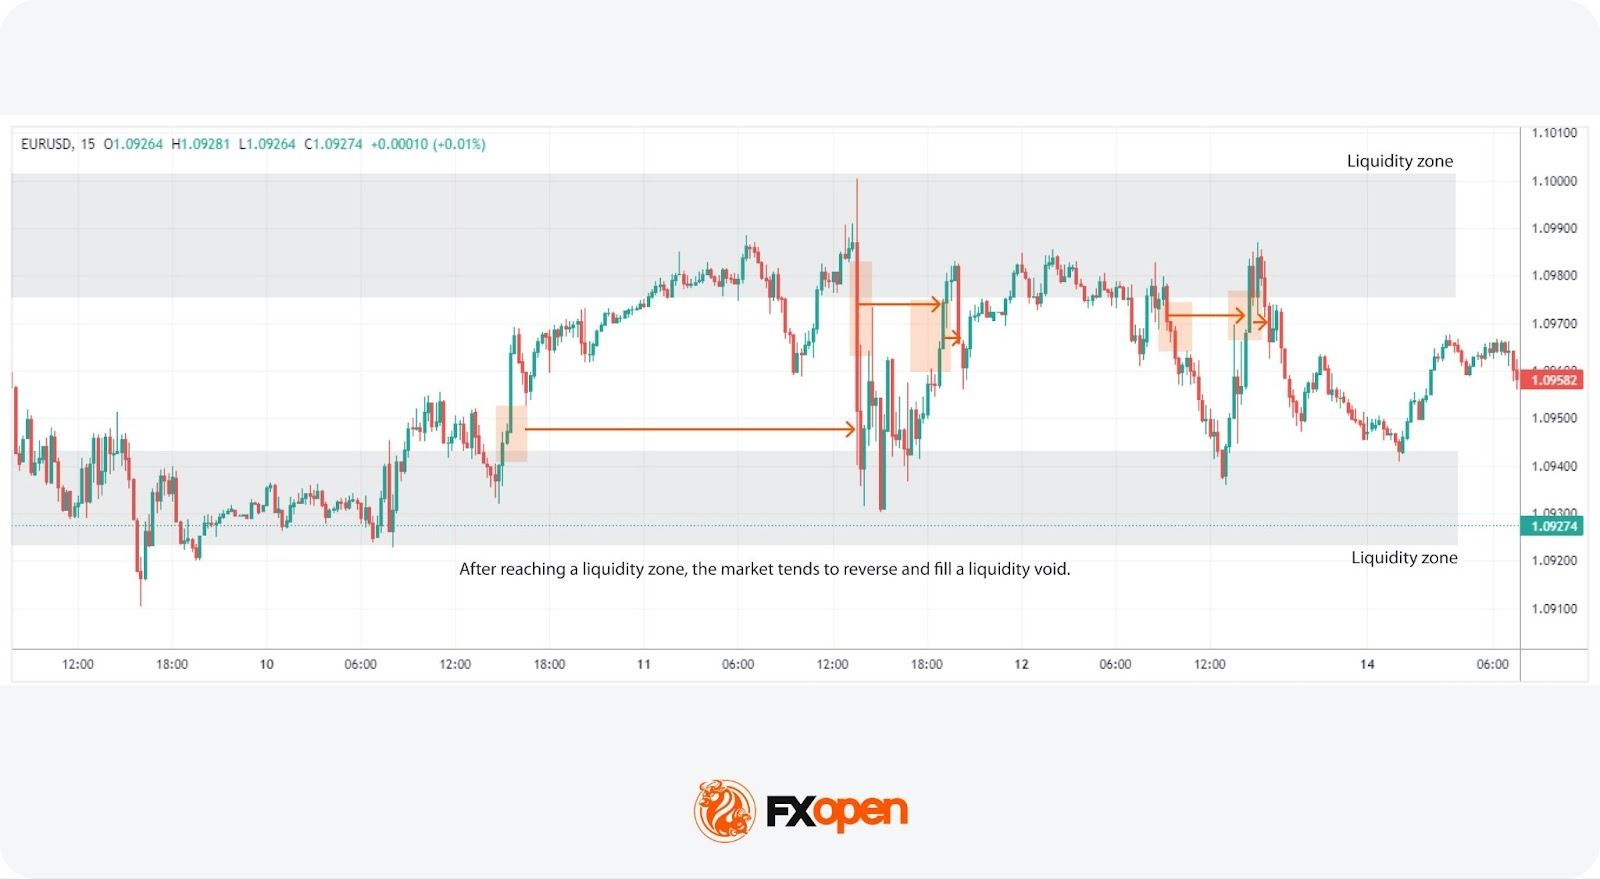
Step 1: Identify a Liquidity Zone
Traders start by locating areas where price has repeatedly reacted, such as support and resistance levels or high-volume nodes on a volume profile. These clusters of resting orders act as magnets for price.
Step 2: Wait for a Price Reaction
Rather than acting immediately, traders watch how price behaves when it reaches the zone. Does it stall? Reverse? Push straight through? The reaction tells the story.
Step 3: Look for Confirmation
A reaction alone isn’t enough. Traders look for confirmation through candlestick patterns (like pin bars or engulfing candles) or a shift in market structure, such as a break of a recent swing high or low.
Step 4: Target Nearby Liquidity or a Void
Once confirmed, traders typically set targets at the next liquidity zone or unfilled void. Voids act as areas price is likely to move toward, since they represent unfinished business on the chart.
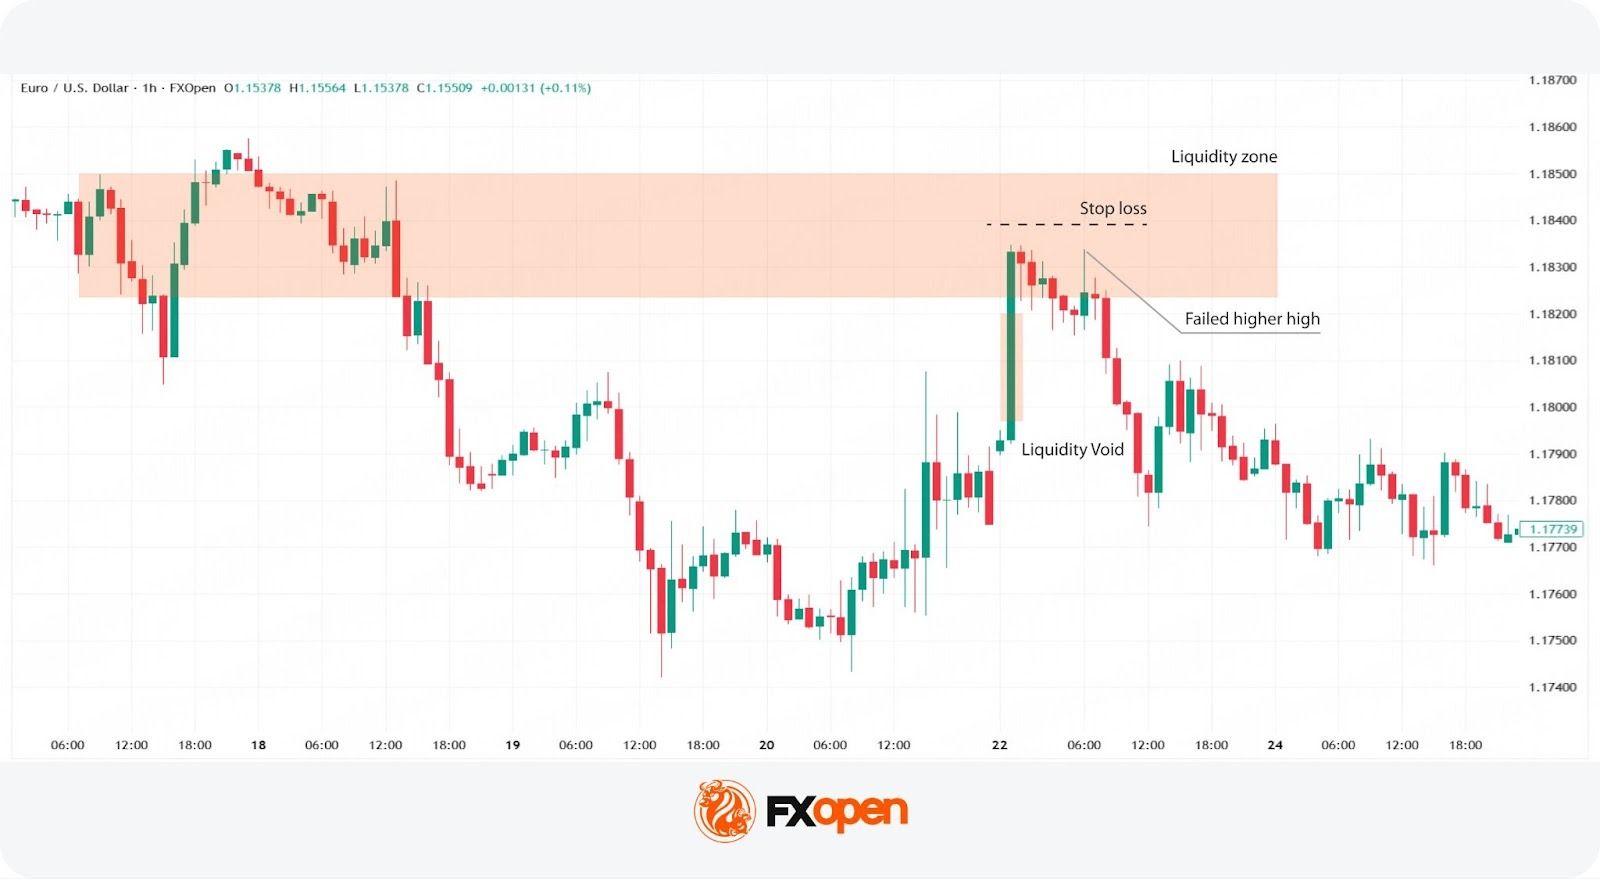
In this example, price moves into a liquidity zone, leaving a void behind it. Buyers attempt to push higher but fail, printing a long upper wick and signalling weakening momentum. Price then breaks below the established low and drops to fill the liquidity void left on the way up. A trader could have opened a sell position after the price broke below the low, set a stop-loss level above the nearest swing high, and closed the trade once the liquidity void was filled.
Limitations of Liquidity Zones and Voids
Understanding liquidity zones and voids provides traders with valuable insights into market dynamics, yet relying solely on these concepts comes with limitations. Here are some specific challenges to consider:
- Market Volatility: Market volatility can disrupt liquidity patterns, making historical levels less reliable.
- Influence of External Events: External events such as economic announcements can override expected behaviour.
- Timeframe Sensitivity: The relevance of zones and voids varies across timeframes, which may affect analysis.
- False Signals: These patterns can also produce false signals, leading to premature decisions.
The Bottom Line
Liquidity zones and voids may help explain how price moves within the forex market. They highlight areas of trading activity and imbalance, offering insight into potential price behaviour.
However, traders use them alongside other tools due to their limitations.
For traders seeking to apply these insights, opening an FXOpen account could provide a practical platform to explore and leverage the dynamics of liquidity in their trading across hundreds of tradable assets.
FAQs
What Are Liquidity Zones?
Liquidity zones are areas on a chart where buy and sell orders are concentrated, often acting as support or resistance. Traders monitor these levels to identify potential entry and exit points.
How Are Liquidity Zones Identified in Trading?
Liquidity zones are identified using tools such as volume profile, price consolidation, and historical support and resistance. These methods highlight areas where trading activity is concentrated.
How May Liquidity Zones Be Traded?
Liquidity zones are commonly used to identify potential entry and exit points. Traders monitor price reactions at these levels and may combine them with other tools to refine trading decisions.
What Are Liquidity Voids?
Liquidity voids are areas where price moves quickly due to low trading activity, creating an imbalance. Price often returns to these areas to “fill” the gap and restore market balance.
This article represents the opinion of the Companies operating under the FXOpen brand only. It is not to be construed as an offer, solicitation, or recommendation with respect to products and services provided by the Companies operating under the FXOpen brand, nor is it to be considered financial advice.

AUD/USD is attempting a recovery wave from 0.6910. NZD/USD is also correcting losses and might recover if there is a clear move above 0.5885.
Important Takeaways for AUD/USD and NZD/USD Analysis Today
· The Aussie Dollar found support near 0.6910 and is now recovering against the US Dollar.
· There is a key bearish trend line forming with resistance at 0.7015 on the hourly chart of AUD/USD at FXOpen.
· NZD/USD is attempting a recovery wave above 0.5800.
· There is a major bearish trend line forming with resistance near 0.5840 on the hourly chart of NZD/USD at FXOpen.
AUD/USD Technical Analysis
On the hourly chart of AUD/USD at FXOpen, the pair dipped from well above 0.7050. The Aussie Dollar declined below 0.7000, but the bulls were active near 0.6910 against the US Dollar.
The recent swing low was formed near 0.6938, and the pair is now correcting losses. There was a move above the 50% Fib retracement level of the downward wave from the 0.7062 swing high to the 0.6938 low.
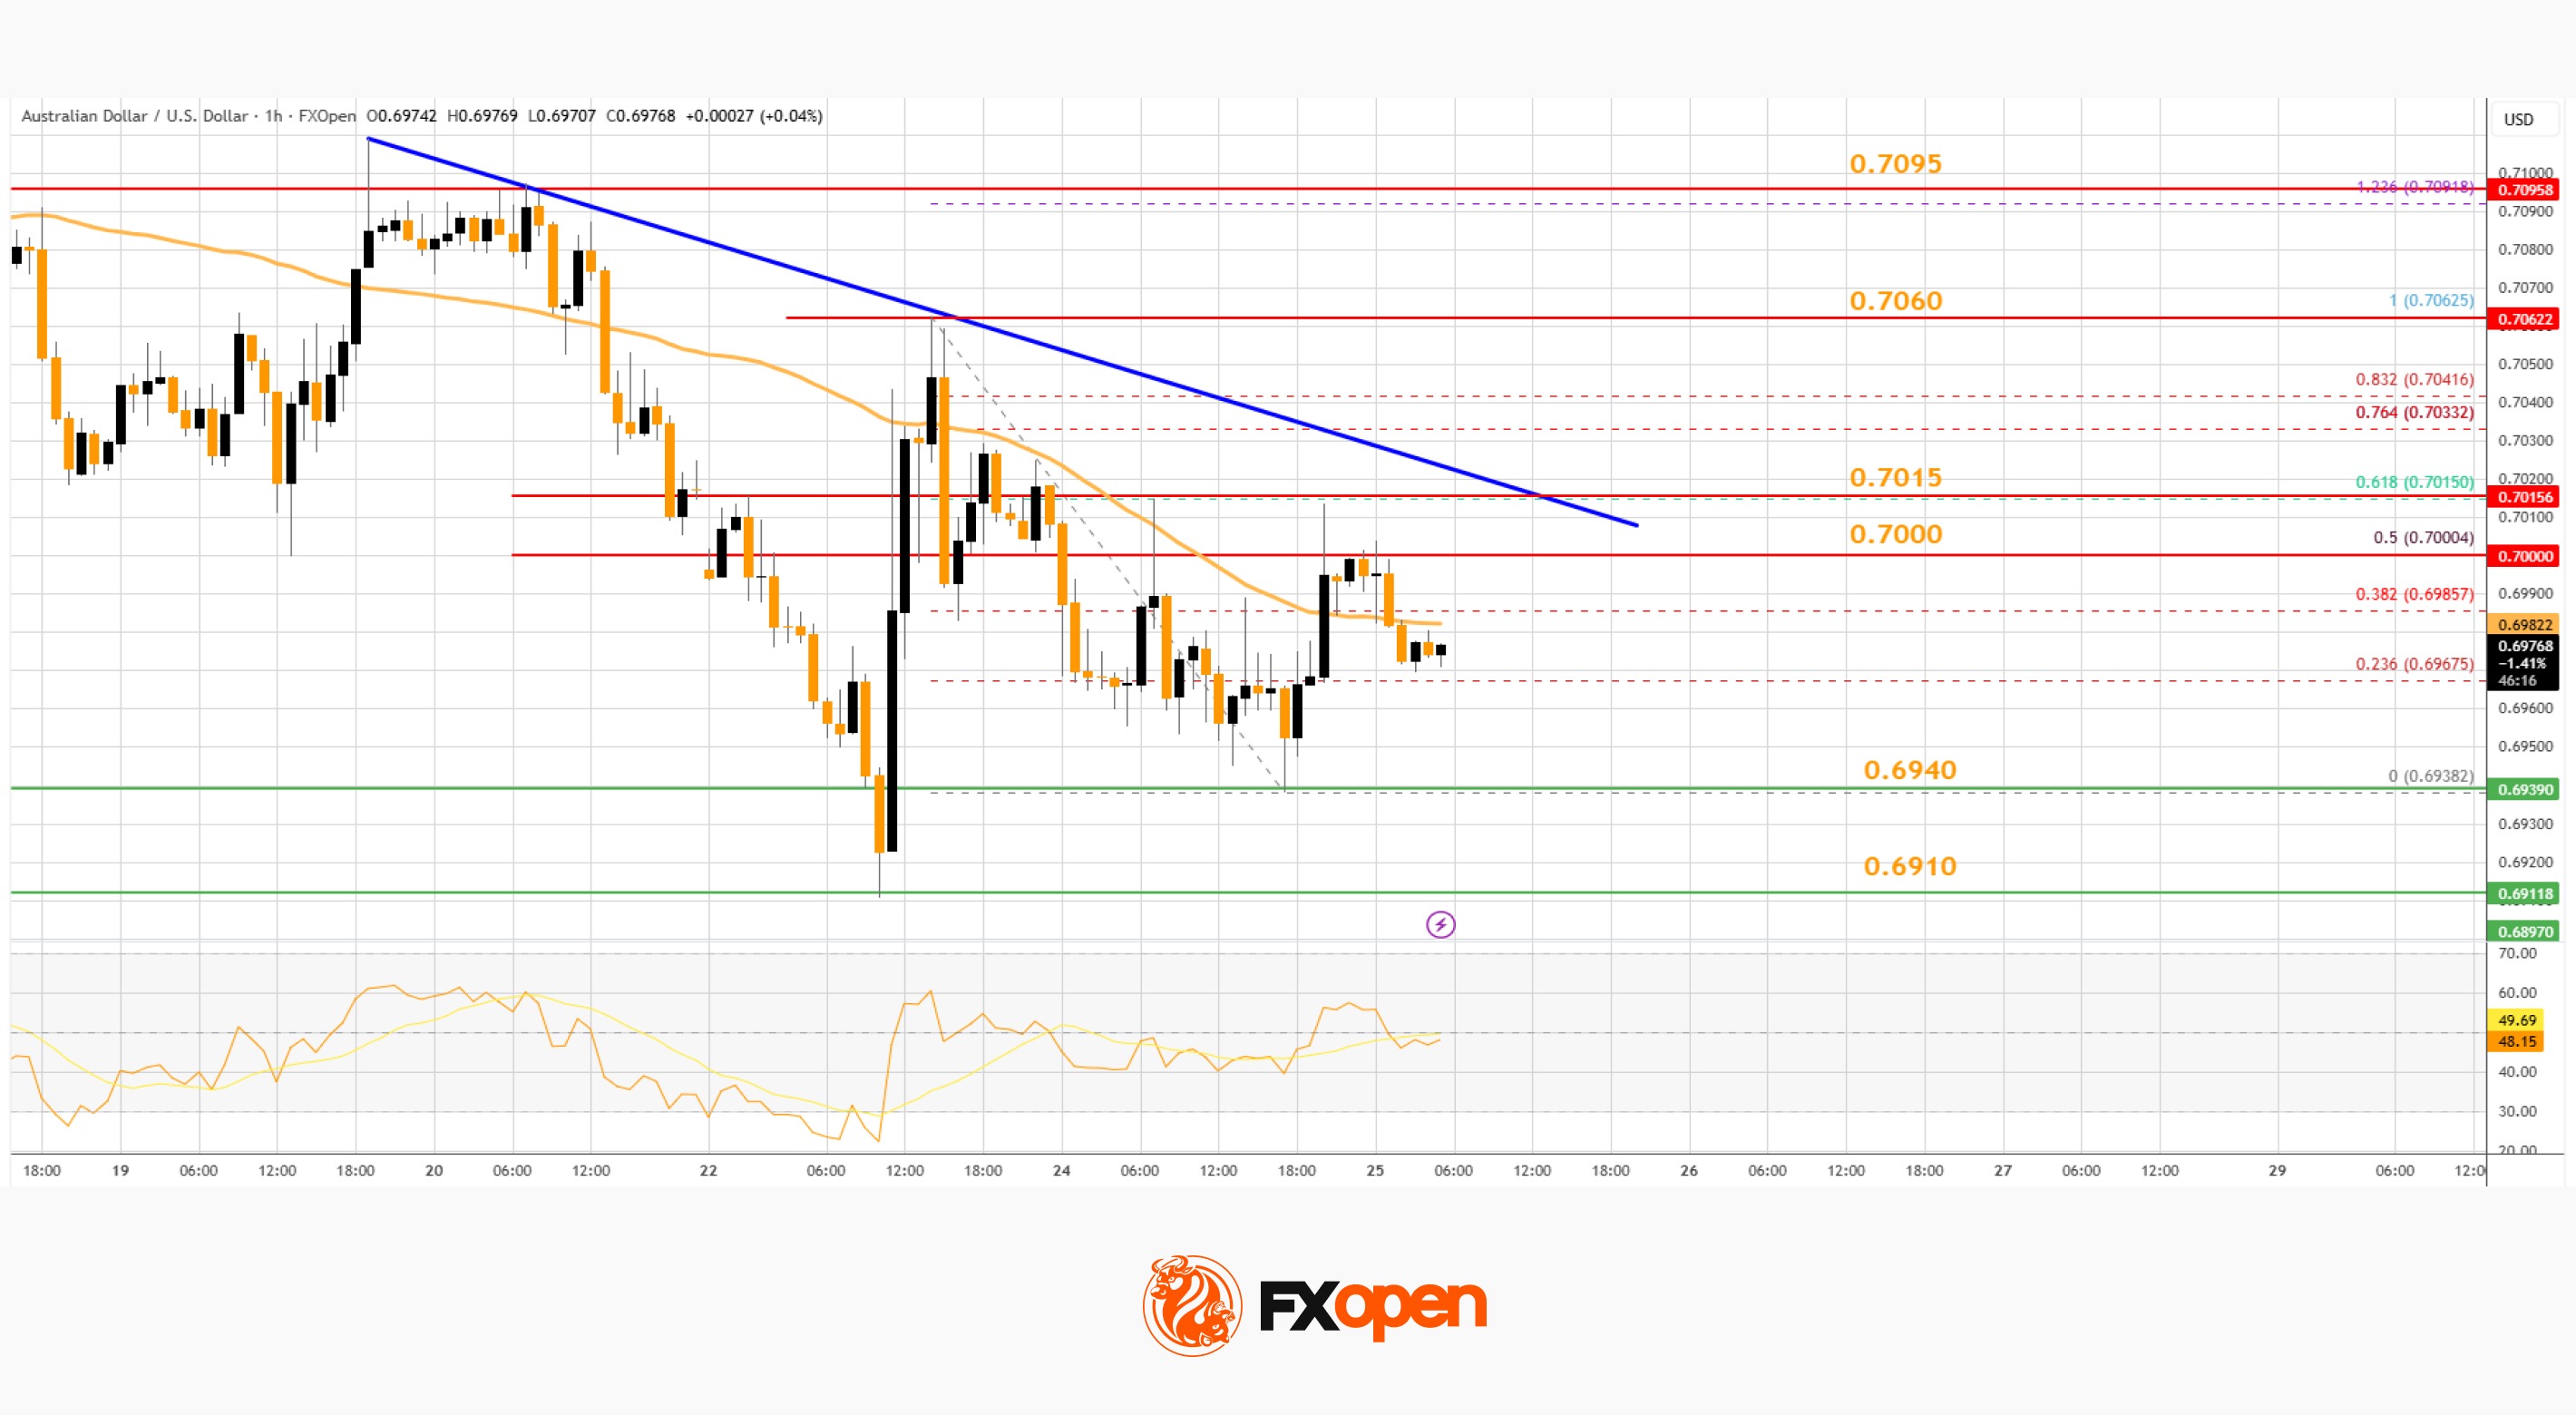
However, the bears are active near 0.7015 and the 61.8% Fib retracement. There is also a key bearish trend line near the same region. The pair is now trading below 0.7000 and the 50-hour simple moving average. On the upside, immediate resistance is 7000.
The first major hurdle for the bulls could be 0.7015. A clear upside break above 0.7015 could send the pair toward 0.7060. The next area of interest on the AUD/USD chart is near 0.7095, above which the price could rise toward 0.7120. Any more gains might send the pair toward 0.7150.
On the downside, initial support is near 0.6940. The key breakdown zone could be 0.6910 and 0.6900. Any more losses might send the pair toward 0.6840.
NZD/USD Technical Analysis
On the hourly chart of NZD/USD on FXOpen, the pair also followed a similar pattern and declined from the 0.5885 zone. The New Zealand Dollar gained bearish momentum and traded below 0.5850 against the US Dollar.
The pair even dropped below the 50-hour simple moving average and tested 0.5800. A low was formed near 0.5793, and the pair is now attempting a fresh increase. There was a move above the 50% Fib retracement level of the downward wave from the 0.5887 swing high to the 0.5793 low.
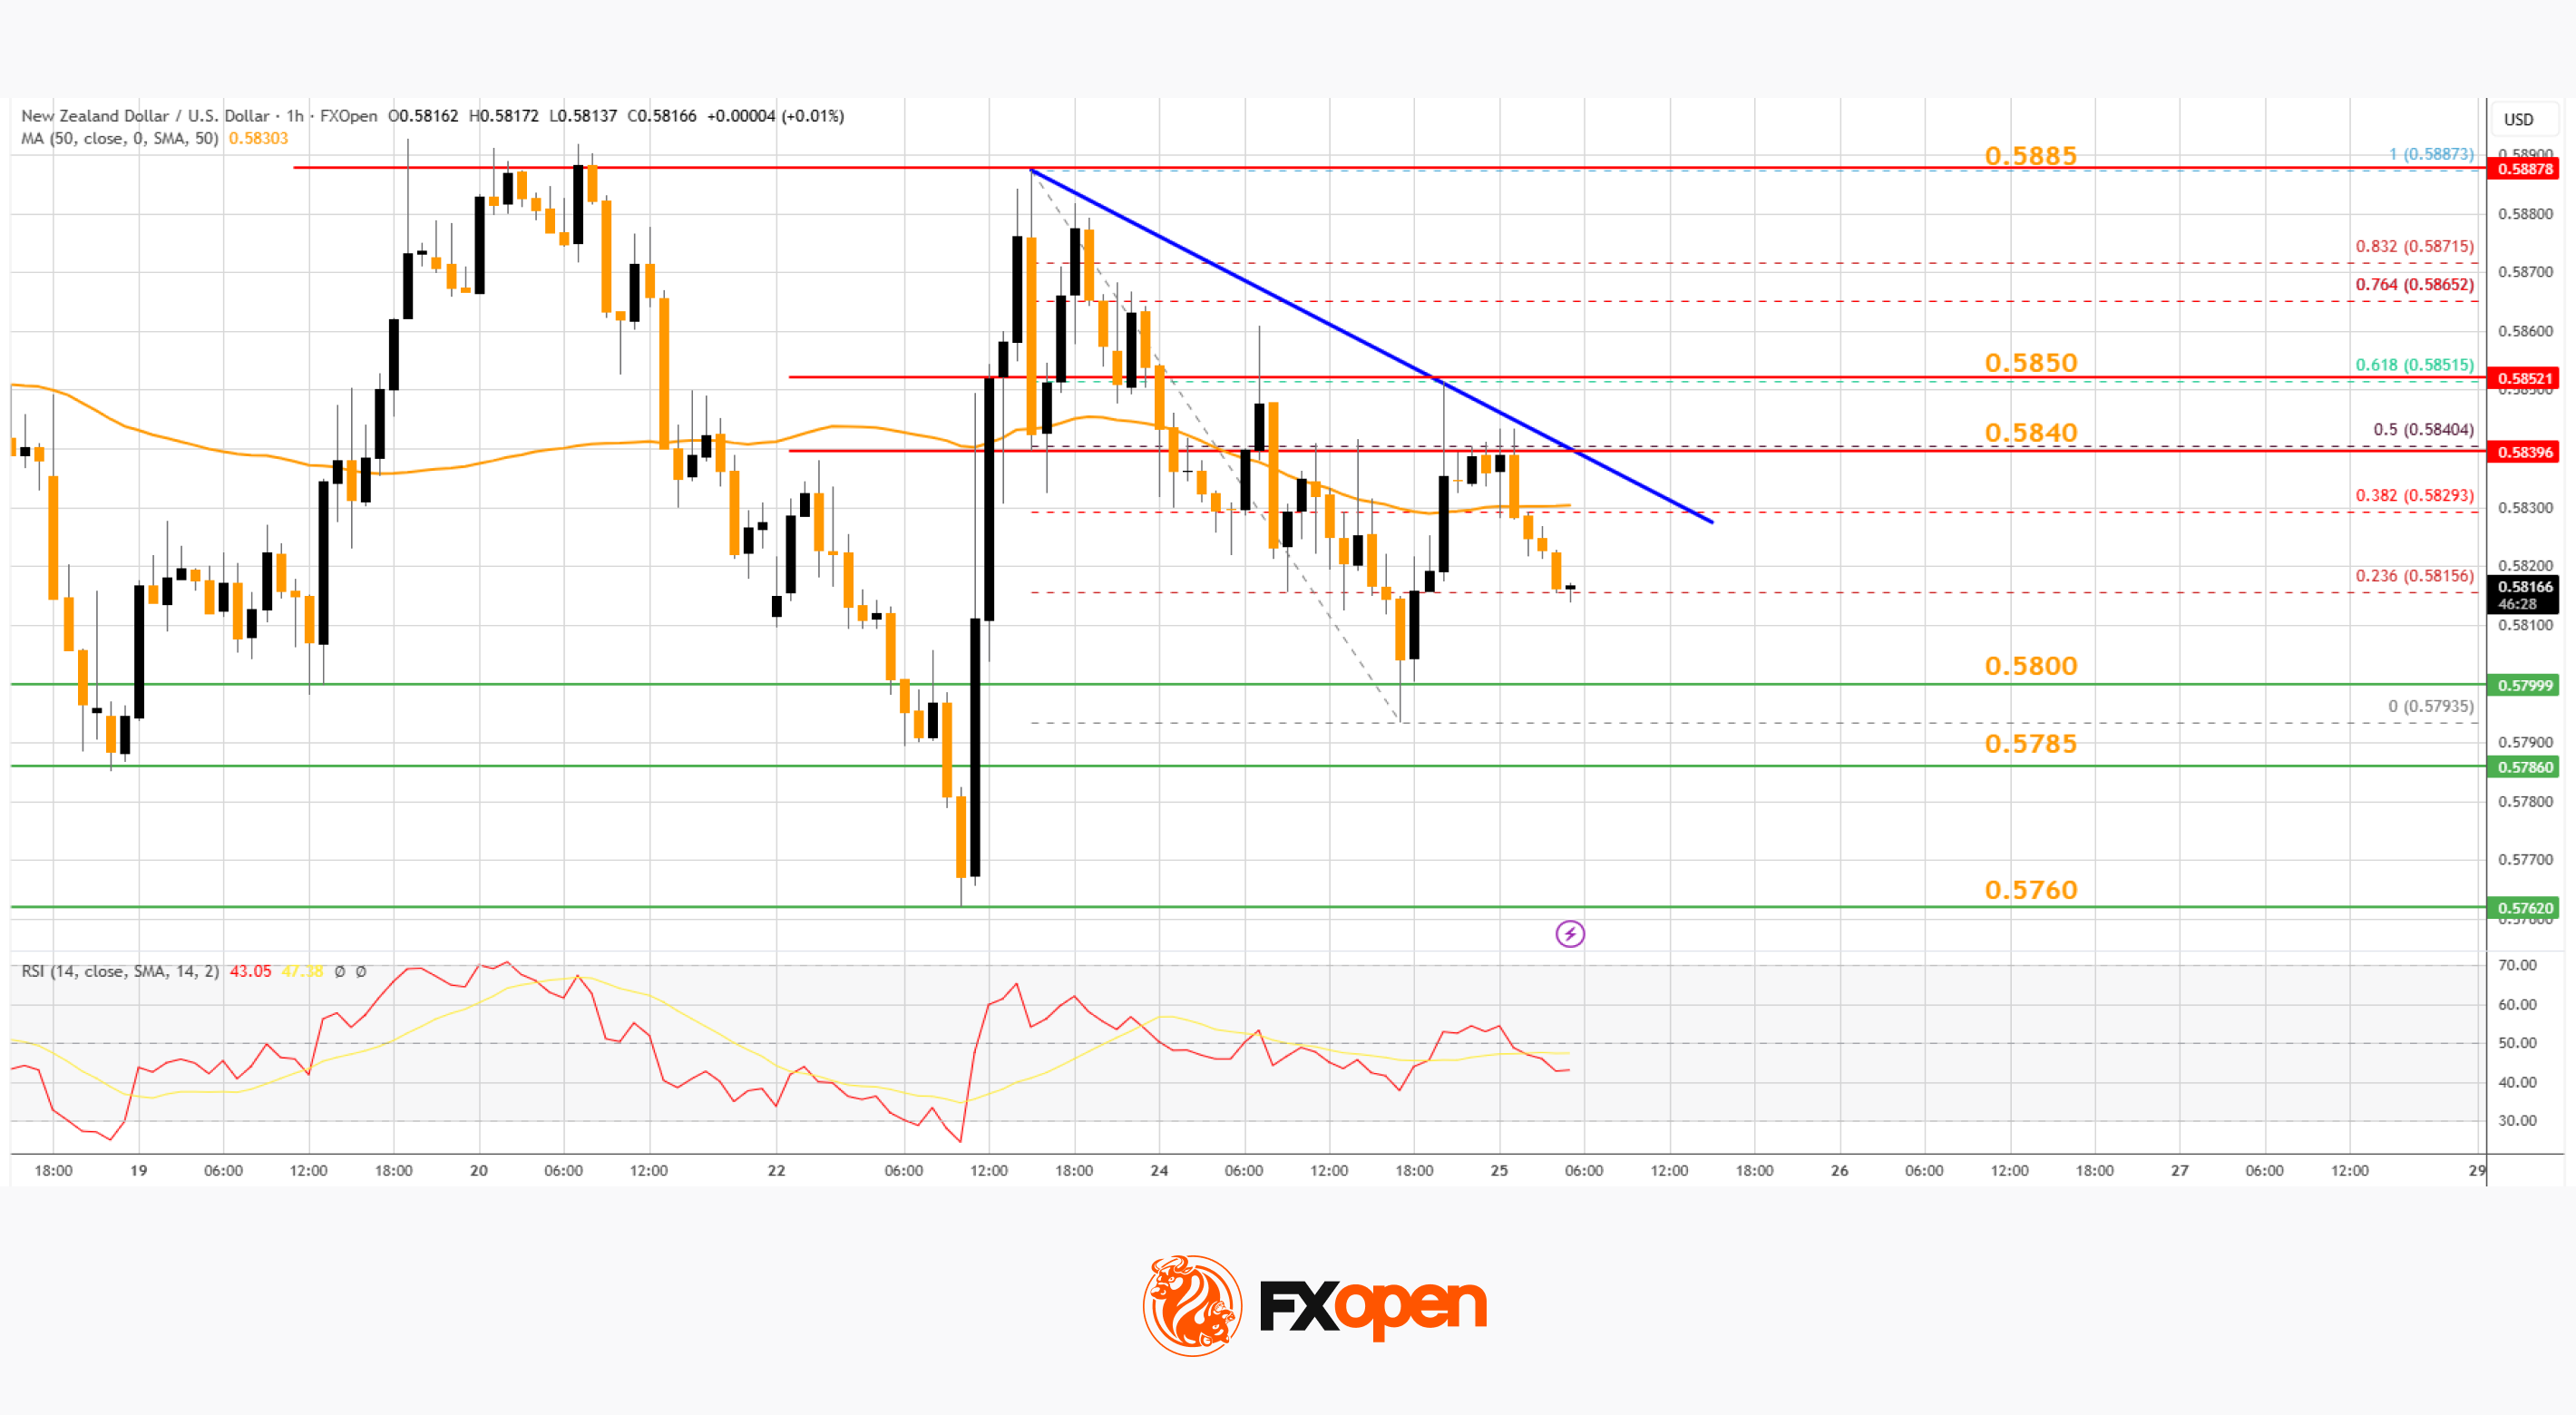
However, there was no close above the 50-hour simple moving average and the 61.8% Fib retracement. There is also a major bearish trend line forming with resistance near 0.5840.
On the upside, the pair is facing hurdles near the same trend line. The next key breakout zone sits near 0.5850. If there is a move above 0.5850, the pair could rise toward 0.5885. Any more gains might open the doors for a move to 0.5940.
On the downside, immediate support on the NZD/USD chart is near 0.5800. The next key area for the bulls might be 0.5785. If there is a downside break below 0.5785, the pair could extend the decline toward 0.5760. The main target for the bears below 0.5760 might be 0.5720.
Trade over 50 forex markets 24 hours a day with FXOpen. Take advantage of low commissions, deep liquidity, and spreads from 0.0 pips (additional fees may apply). Open your FXOpen account now or learn more about trading forex with FXOpen.
This article represents the opinion of the Companies operating under the FXOpen brand only. It is not to be construed as an offer, solicitation, or recommendation with respect to products and services provided by the Companies operating under the FXOpen brand, nor is it to be considered financial advice.

Key Highlights
- The board of directors greenlit a $1.5 billion share repurchase initiative, injecting $1.1 billion in fresh buyback authority into the existing program
- The share repurchase initiative is scheduled to span three years beginning in the first quarter of 2026
- Shares of HOOD declined 4.7% on Tuesday, closing at $69.08—the lowest level recorded in 2026
- The company’s brokerage arm secured an enhanced revolving credit line with JPMorgan, increasing it to $3.25 billion from $2.65 billion
- Year-to-date, HOOD has dropped approximately 39%, representing a 54.7% decline from its October peak of $152.46
Robinhood (HOOD) has greenlit a $1.5 billion share repurchase initiative even as its stock price continues its downward trajectory, reaching its weakest closing price of 2026 on the day of the announcement.
According to an 8-K filing submitted to the U.S. Securities and Exchange Commission, the board of directors authorized the repurchase program on Tuesday, March 24. The initiative introduces over $1.1 billion in additional buyback authorization, supplementing the remaining capacity from a prior program.
The financial services platform anticipates executing the share repurchases across approximately three years, commencing in the first quarter of 2026. The company maintains flexibility with no obligation to repurchase a predetermined amount.
Robinhood Chief Financial Officer Shiv Verma described the firm as “a generational company with a massive long-term opportunity,” stating that the authorization demonstrates the board’s belief in the company’s capacity to “continue delivering innovative products for customers and creating value for shareholders.”
Shares closed Tuesday’s trading session at $69.08, representing a 4.7% decline for the day. This marked HOOD’s weakest closing price in 2026. In extended trading, shares recovered slightly to $70.90.
Significant Retreat from October Peak
The stock has plummeted nearly 39% since the beginning of 2026 and has tumbled 54.7% from its record high of $152.46 reached in October. Macroeconomic headwinds and geopolitical uncertainty have pressured technology stocks and cryptocurrency-related equities alike.
Despite the challenging 2026 performance, HOOD remains approximately 43% higher compared to twelve months ago, buoyed by the platform’s strategic expansion into prediction markets, banking services, and cryptocurrency trading capabilities.
According to analyst sentiment tracker TipRanks, the average 12-month price target for HOOD stands at $123.85. Based on assessments from 16 Wall Street analysts, the consensus recommendation is classified as “strong buy.”
Share buyback programs are generally interpreted as management’s indication that the stock is trading below its intrinsic value—though investors appeared unimpressed by Tuesday’s announcement, as reflected in the day’s price action.
Enhanced Credit Line Provides Additional Financial Flexibility
In conjunction with the repurchase program disclosure, Robinhood Securities—the company’s registered brokerage entity—finalized an amended revolving credit arrangement with JPMorgan Chase as the lead arranger.
The credit facility was increased to $3.25 billion from its previous $2.65 billion limit. Additionally, the agreement includes provisions to potentially expand total commitments to as much as $4.875 billion, providing substantial liquidity flexibility.
Meanwhile, Robinhood continues advancing its cryptocurrency and tokenization strategy. The company released its Ethereum layer-2 blockchain network, Robinhood Chain, to public testnet in February.
Chief Executive Officer Vlad Tenev reported that the network handled 4 million transactions during its inaugural week on testnet. Robinhood Chain is designed to facilitate tokenized equities, exchange-traded funds, and other conventional financial products.
The mainnet deployment is scheduled for later in 2026.
HOOD concluded Tuesday’s regular trading at $69.08, with after-hours activity pushing the price modestly higher to $70.90.

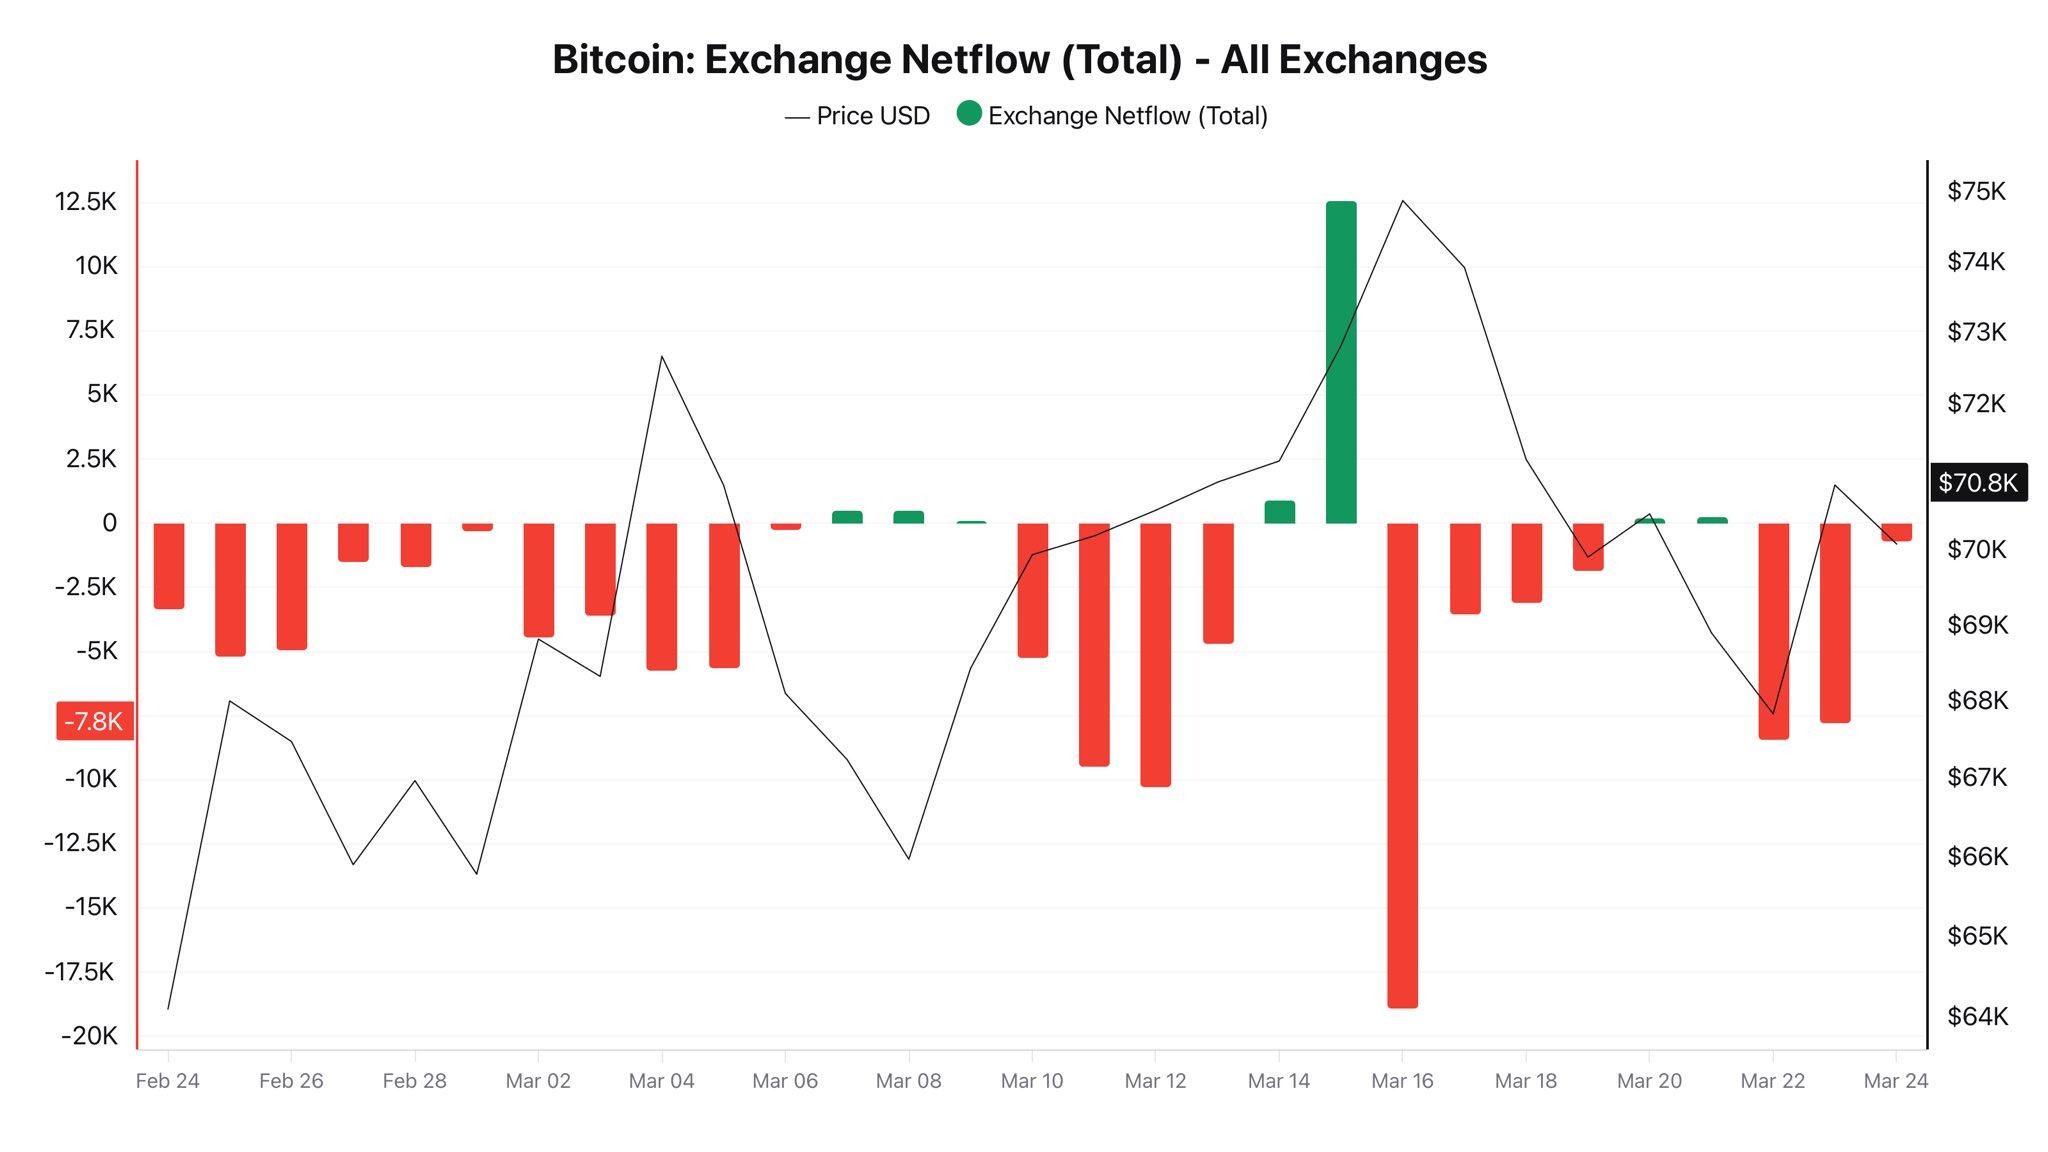
The net outflow of Bitcoin from exchanges over the past month suggests that investors have started to accumulate the cryptocurrency, according to a CryptoQuant analyst.
March has been largely dominated by Bitcoin (BTC) outflows from crypto exchanges, aside from one spike in inflows just before the asset tapped a six-week high of $76,000 on March 17, according to CryptoQuant data.
This negative net flow has remained present while Bitcoin “continues its liquidation phase,” the analyst known as Darkfost said on Wednesday.
“This persistent outflow suggests genuine accumulation by investors, who continue to buy and withdraw their BTC from exchange platforms,” he said.
Inflows to exchanges are generally bearish as investors prepare to exchange the asset for stablecoins, which adds to selling pressure, whereas outflows are often a sign of accumulation and a possible precursor to buying pressure.

Long-term accumulation rather than short-term speculation
The analyst added that the demand is not yet strong enough to restart a trend, “but it clearly indicates ongoing accumulation and is likely one of the factors behind the range formation that has been developing for several months now.”
Nick Ruck, director of LVRG Research, told Cointelegraph on Wednesday that the outflows signal “genuine long-term accumulation by investors rather than short-term speculation.”
The removal of Bitcoin from centralized platforms “showcases growing confidence in Bitcoin’s fundamentals amid current market conditions as holders indicate a lack of interest in selling to hedge against price volatility,” he added.
Related: Rising US Treasury yields, war in Iran, rising inflation risk pressure Bitcoin price
Jeff Mei, the chief operations officer at crypto exchange BTSE, told Cointelegraph that crypto has outperformed stocks and gold since the beginning of the Iran war, “so it’s no surprise that investors are accumulating Bitcoin.”
“Crypto was oversold in the weeks and months prior to the conflict, so it makes sense that it hasn’t sold off as hard as stocks have,” he added.
“This could also be an indication of Bitcoin emerging as a hedge against traditional stocks, as well as increased institutional ownership.”
Bitcoin makes higher highs, higher lows
Another indicator of potential trend formation is Bitcoin’s price making higher highs and higher lows, as it has done at least twice so far this month, according to TradingView.
In its weekly on-chain summary on Monday, Glassnode said that net unrealized profits and losses have improved slightly, “indicating a modest easing in unrealized losses across the market,” but cautioned that “sentiment is still under pressure despite tentative signs of stabilization.”
Magazine: Banks want to run Vietnam’s crypto exchanges, Boyaa’s $70M BTC plan: Asia Express

Non-crypto company Enlivex Therapeutics is expanding its exposure to Rain (RAIN), the token tied to a decentralized prediction market platform. The firm secured a $21 million debt facility from The Lind Partners to finance the purchase of additional Rain tokens and extend its option on a much larger tranche. In a Sunday move, Enlivex exercised an option to acquire about 3 billion RAIN tokens at a 62% discount for $10 million, and the agreement extends the right to purchase a further 272.1 billion RAIN tokens at the same price through December 2027. The financing is described by the company as a key component of its broader treasury strategy around Rain-linked assets.
Enlivex says the arrangement supports its operating plan while broadening its investor appeal through a diversified balance sheet. The Rain treasury’s value is closely tied to Rain’s decentralized prediction market platform, which operates with a built-in 2.5% fee that automatically buys back and burns RAIN tokens in an effort to bolster tokenomics through supply-demand dynamics.
Key takeaways
- Enlivex exercises an option to buy 3 billion Rain tokens at a 62% discount for $10 million, and extends the option to purchase an additional 272.1 billion RAIN tokens through December 2027.
- The Rain treasury gains exposure to tokens that participate in a platform whose fee mechanism triggers automatic buybacks and token burns, potentially impacting RAIN’s supply over time.
- Rain operates on the Ethereum Layer-2 Arbitrum network and has earned a spot in the top 10 prediction-market platforms by total value locked and fees, per DeFiLlama data.
- Enlivex also approved a $20 million share repurchase program, signaling a driver for shareholder value alongside its Rain exposure.
- Prediction markets have seen dramatic growth, with volumes rising roughly 1,200% to about $23.3 billion from February 2025 to February 2026, though Kalshi and Polymarket continue to account for the majority of trading activity (over 80%).
Enlivex’s Rain exposure deepens
Enlivex’s latest financing rounds out a longer-term treasury strategy centered on Rain. The company disclosed that it exercised the option to acquire 3 billion Rain tokens at a 62% discount for $10 million on Sunday, with a further option to purchase an additional 272.1 billion RAIN tokens at the same price extended through December 2027. The liability side of the arrangement comes in the form of a $21 million debt facility from The Lind Partners, a New York-based asset manager, enabling the purchases and the extended option window.
The move highlights a broader trend where traditional, non-crypto firms are incorporating digital asset holdings to bolster their balance sheets and diversify investor appeal. Enlivex’s executive chair, Shai Novik, framed the deal as a continuation of the company’s strategic commitment to Rain, stressing that the financing would fund both operations and the ongoing accumulation of Rain-based assets.
Rain’s own mechanics underpin the treasury strategy. The platform levies a 2.5% fee on trades, a portion of which is designated for automatic buybacks and burns of RAIN tokens. This mechanism is designed to influence the token’s supply-and-demand balance over time, potentially supporting price dynamics independent of broader market moves.
Treasury moves and corporate diversification
Alongside the Rain buys, Enlivex announced a $20 million share repurchase program. The buyback is positioned as a move to enhance shareholder value while the company pursues its core business in cell therapies for conditions such as knee osteoarthritis. The combination of debt-financed Rain acquisitions and a stock repurchase program underscores a strategic tilt toward capital management that some investors may view as a sign of confidence in Enlivex’s equity and liquidity position amid a turbulent market backdrop for small-cap biotech firms with non-traditional crypto exposures.
Rain’s link to Enlivex sits within a growing space where non-crypto enterprises seek crypto exposure as a hedge or growth lever. The dynamic also sits alongside ongoing policy and market scrutiny surrounding token-based treasuries, highlighting a need for disciplined risk management and transparent reporting as these cross-industry holdings mature.
Rain’s economics and market position
Rain’s token economics hinge on a built-in burn mechanism driven by a 2.5% platform fee that funds buybacks and token burning. This setup is intended to create a cyclical demand impulse for RAIN amid trading activity on the decentralized prediction market platform. The token’s price reaction following Enlivex’s disclosure reflects the market’s sensitivity to large treasury moves and token-asset exposure by non-crypto corporates.
Trading data from CoinGecko shows Rain fluctuating in the wake of the announcement. The token rose about 7% to around $0.009 before easing to roughly $0.0088, with the 24-hour change curling around flat to a 0.3% gain. Enlivex’s stock, ENVL, likewise moved little on the day—closing near $1.10 and edging higher to about $1.15 in after-hours trading—illustrating a market where traditional equities and crypto-tied instruments can move asynchronously on policy, earnings, and corporate strategy signals.
Rain’s market position is anchored on Arbitrum, an Ethereum Layer-2 network that hosts a growing ecosystem of decentralized finance and prediction-market protocols. DeFiLlama’s data shows Rain is among the top 10 prediction-market platforms by total value locked and fees over recent periods, reinforcing Rain’s relevance within the broader DeFi and forecasting sectors. In the wider market, Rain competes with established players like Kalshi and Polymarket, which together have historically accounted for a substantial share of prediction-market trading volumes.
Looking at the broader market backdrop, prediction markets have experienced a surge in activity. Data dashboards tracked by analytics platforms show volumes expanding roughly 1,200% year over year to reach about $23.3 billion between February 2025 and February 2026. That rapid growth underscores the potential long-term demand for decentralized forecasting tools, even as platform leadership remains concentrated among a handful of incumbents.
For investors and builders, the Enlivex development highlights several important considerations. First, the willingness of a non-crypto company to diversify into tokenized assets tied to a prediction market signals a potential shift in corporate treasury strategies, particularly if the token’s burn-and-buyback mechanics prove effective at sustaining demand. Second, the sustained liquidity and pricing of Rain will hinge on market depth and the ability of Rain-based platforms to attract meaningful trading volumes beyond a few lead markets. Third, regulatory and accounting implications of large, cross-asset treasury programs remain a critical area to monitor for both Enlivex and similar firms contemplating crypto-integration strategies.
Beyond the immediate deal, observers will watch for how Lind Partners structures the debt facility, how the Rain treasury evolves with ongoing buybacks, and whether the extended option window through 2027 translates into meaningful capital gains if Rain’s platform scales or if macro conditions dampen demand for prediction-market exposure. The next few quarters should reveal whether this cross-industry treasury experiment yields constructive outcomes for investors, token holders, and the broader market.
As Enlivex advances its Rain strategy, market participants will be watching for signals about liquidity in the Rain market, the sustainability of the buyback regime, and how Rain-backed treasuries perform relative to more conventional crypto exposures.
Enlivex’s activity with Rain continues to illustrate a growing trend where corporate treasuries experiment with decentralized finance instruments to diversify holdings, unlock potential upside, and align with an expanding ecosystem of prediction-market protocols on Layer-2 networks like Arbitrum. The coming months should clarify whether these treasury strategies can withstand market cycles and regulatory developments while delivering tangible value for both corporate actors and the broader Rain community.
Sources: GlobeNewswire press release on Enlivex’s debt financing and Rain-related updates; CoinGecko price data for RAIN and ENVL; DeFiLlama protocol rankings for Rain; Dune Analytics dashboards for prediction-market volumes.
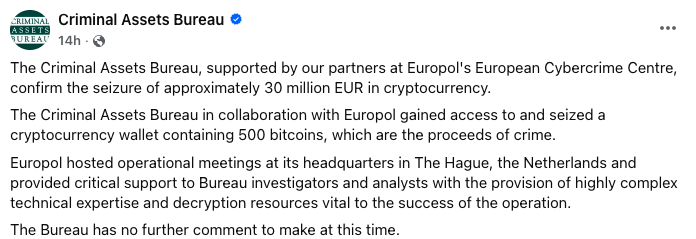
Irish national police say they have cracked one of 12 Bitcoin wallets linked to a convicted drug dealer, years after they were confiscated and their access codes were thought to be gone forever.
Ireland’s Criminal Assets Bureau (CAB) said in a statement on Tuesday that it had “gained access to and seized a cryptocurrency wallet” containing 500 Bitcoin (BTC), worth more than $35 million, with the help of Europol’s European Cybercrime Centre.
“Europol hosted operational meetings at its headquarters in The Hague, the Netherlands and provided critical support to Bureau investigators and analysts with the provision of highly complex technical expertise and decryption resources vital to the success of the operation,” the CAB said.
The Irish Times reported on Tuesday that the wallet is one of 12 holding a total of 6,000 Bitcoin once owned by Clifton Collins, a drug dealer sentenced to five years in prison for growing and selling cannabis. The access codes were lost when the paper they were printed on disappeared.

Most of the time, losing a Bitcoin private key means there’s no way to recover it or crack the wallet; the funds are permanently inaccessible due to public-key cryptography.
Cointelegraph has contacted the CAB and An Garda Síochána for comment.
Wallet flagged as belonging to Collins moves 500 BTC
A wallet labeled “Clifton Collins: Lost Keys” by blockchain intelligence platform Arkham transferred 500 Bitcoin to Coinbase Prime on Tuesday, more than a decade after the coins were first deposited.
Arkham lists Collins as controlling 14 addresses with total holdings of 5,500 Bitcoin, valued at more than $391 million.

Collins was arrested in 2017 after police searched his car and found a stash of cannabis, according to the Guardian.
Related: Coinbase, Microsoft and Europol take down phishing service ‘Tycoon 2FA’
Police said Collins used proceeds from his drug operation to purchase 6,000 Bitcoin in late 2011 and early 2012, spreading the holdings across 12 wallets. He stored the wallet keys on a single sheet of A4 paper, hidden inside the aluminum cap of a fishing rod case at his rental home.
After his arrest and sentencing, Collins’ landlord cleared out his rental home and discarded his belongings. Collins, however, claimed the fishing rod case had been stolen before the landlord ever entered the property.
Magazine: Banks want to run Vietnam’s crypto exchanges, Boyaa’s $70M BTC plan: Asia Express

Naples is set to become a key hub for emerging technologies this summer as ctrl/shift 2026, a major Web3, AI, and quantum computing conference, takes place from June 13 to 15 at Villa Doria d’Angri.
The event, powered by NapulETH, will gather institutions, researchers, developers, and investors to explore how these technologies are increasingly converging into a single innovation stack shaping the future of digital infrastructure.
Following the success of NapulETH 2025, which attracted over 1,200 participants and more than 120 speakers, the 2026 edition aims to further position Italy, and particularly Naples, as a growing center for high-level tech and blockchain events in Europe.

A convergence-focused Web3 and AI event in Italy
Unlike traditional tech conferences that separate verticals, ctrl/shift 2026 is built around a convergence model, combining Web3, artificial intelligence, and quantum computing into a unified framework.
The program is structured across three main tracks:
- Artificial Intelligence, focusing on autonomous agents and system-wide intelligence integration
- Web3 and Digital Assets, covering regulation, digital identity, and institutional adoption, including MiCA frameworks
- Quantum Computing, with a focus on post-quantum cryptography and long-term security challenges
This approach reflects a broader shift in the industry, where infrastructure, governance, and financial systems are evolving together rather than in isolation.
Hackathon and networking events to drive real-world innovation
Beyond panels and keynote sessions, ctrl/shift 2026 will feature a hackathon designed to turn concepts into working solutions, allowing participants to build and test ideas in real time.
Side events are also a core part of the experience.
One of the highlights is the NapulETH VIP Boat Party on June 16, a full-day networking event in the Bay of Naples, where founders, investors, and researchers are expected to connect in a more informal and high-value setting.
Institutional speakers and industry experts confirmed
The speaker lineup reflects strong institutional and industry involvement across multiple sectors.
Policy and regulation
- Marcello Coppo, Italian Parliament
- Giulio Centemero, Italian Parliament
Finance and academia
- Luisa Fischietti, Head of Italy ETFs, Borsa Italiana
- Francesco Pierangeli, Director of MSc in FinTech, University of Birmingham
Blockchain and technology
- Antonio Sanso, Ethereum Foundation
- Eugenio Reggianini, European Blockchain Association
- Luca Boiardi, The Crypto Gateway
Legal and compliance
- Marco Tullio Giordano, cybersecurity and Web3 legal expert
- Giuseppe Vaciago, Supreme Court lawyer and digital forensics specialist
Additional collaborations are in progress with institutions such as the Bank of Italy, Consob, and Banca Sella.
WeMakeFuture partnership strengthens AI track
A key addition to the 2026 edition is the partnership with WeMakeFuture, one of Europe’s leading innovation and digital culture events.
WeMakeFuture will curate the AI track, contributing speakers, content, and community, and reinforcing ctrl/shift’s positioning as a multi-sector technology summit rather than a single-industry event.
Sponsors and ecosystem support
The event is backed by a growing ecosystem of sponsors and partners, including:
Binance Italy is also expected to host a dedicated meetup on June 13.
Media coverage will include major Web3 outlets such as BeInCrypto and The Cryptoeconomist.
Tickets and participation details
Tickets for ctrl/shift 2026 are currently available in tiered pricing:
- Regular: €20
- VIP: €125, including access to all conference days, side events, and the June 16 boat networking experience
👉 Tickets: https://luma.com/hfs5ijms
👉 Official website: https://www.ctrlshift.events/
👉 Speaker applications: https://speak.ctrlshift.events
Why ctrl/shift 2026 stands out in the European tech landscape
As Web3, AI, and quantum computing continue to converge, events like ctrl/shift 2026 highlight the growing need for cross-disciplinary collaboration between technology builders, institutions, and regulators.
With its mix of technical depth, institutional participation, and real-world application through hackathons and networking, the Naples-based event is positioning itself as one of the most relevant blockchain and AI conferences in Italy for 2026.
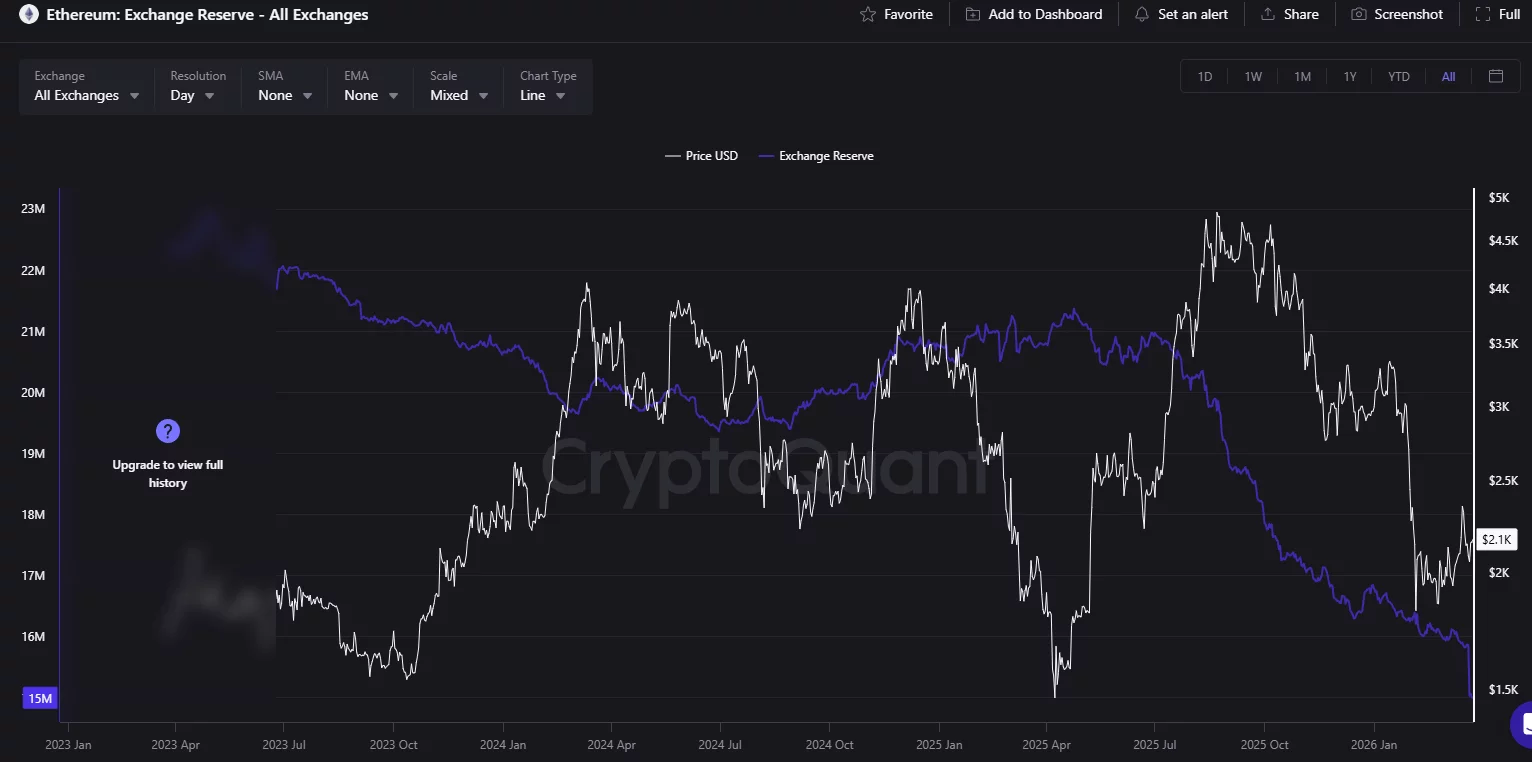
Ethereum price has formed a strong support at $2,100 as whales continue accumulating the asset. Now, a bullish pattern on charts hints at more potential upside over the coming sessions.
Summary
- Ethereum held firm above the $2,100 support as whales accumulated over 750,000 ETH in the past 48 hours, signaling sustained buying interest.
- The asset rebounded more than 3% as improved risk sentiment followed U.S.-led ceasefire efforts, with crude oil prices slipping below $90.
- A cup and handle pattern has formed on the daily chart, with a breakout above $2,384 potentially opening the path toward the $3,000 level.
According to data from crypto.news, Ethereum bulls managed to fend off a drop below the 100 support amidst some market correction on Sunday, arising from broader macroeconomic uncertainty.
The largest altcoin subsequently rallied over 3% to $2,170 as investor risk sentiment improved after the U.S. attempted to negotiate a temporary ceasefire with Iran through diplomatic channels, which saw crude oil slide back under $90.
Ethereum (ETH) price rebounded amid whale accumulation, which often sparks retail FOMO, who follow the smart money. Data from Santiment shows that whale wallets holding between 100 and 100,000 ETH bought over 750,000 ETH over the past 48 hours.
It also follows as Ethereum treasury company Bitmine continues to aggressively purchase more ETH as it nears its goal of owning at least 5% of the ETH supply, as earlier reported by crypto.news.
Another potential catalyst is the supply crunch. Notably, Ethereum exchange reserves have fallen to an all-time low of nearly 15 million. Depleting exchange reserves means investors could be moving assets to cold storage or staking them to earn passive rewards. Investors often see this as an incredibly bullish signal.

The Ethereum Foundation, the non-profit dedicated to the ecosystem, is also working to mitigate threats posed by quantum computing. Reports indicate that the new roadmap aims to transition the network to quantum-safe cryptography for centuries of security.
On the daily chart, Ethereum price has formed a giant cup and handle pattern, a popular bullish continuation pattern in technical analysis. A break above the neckline of the pattern confirms the setup, usually resulting in sustained upside over the following sessions.
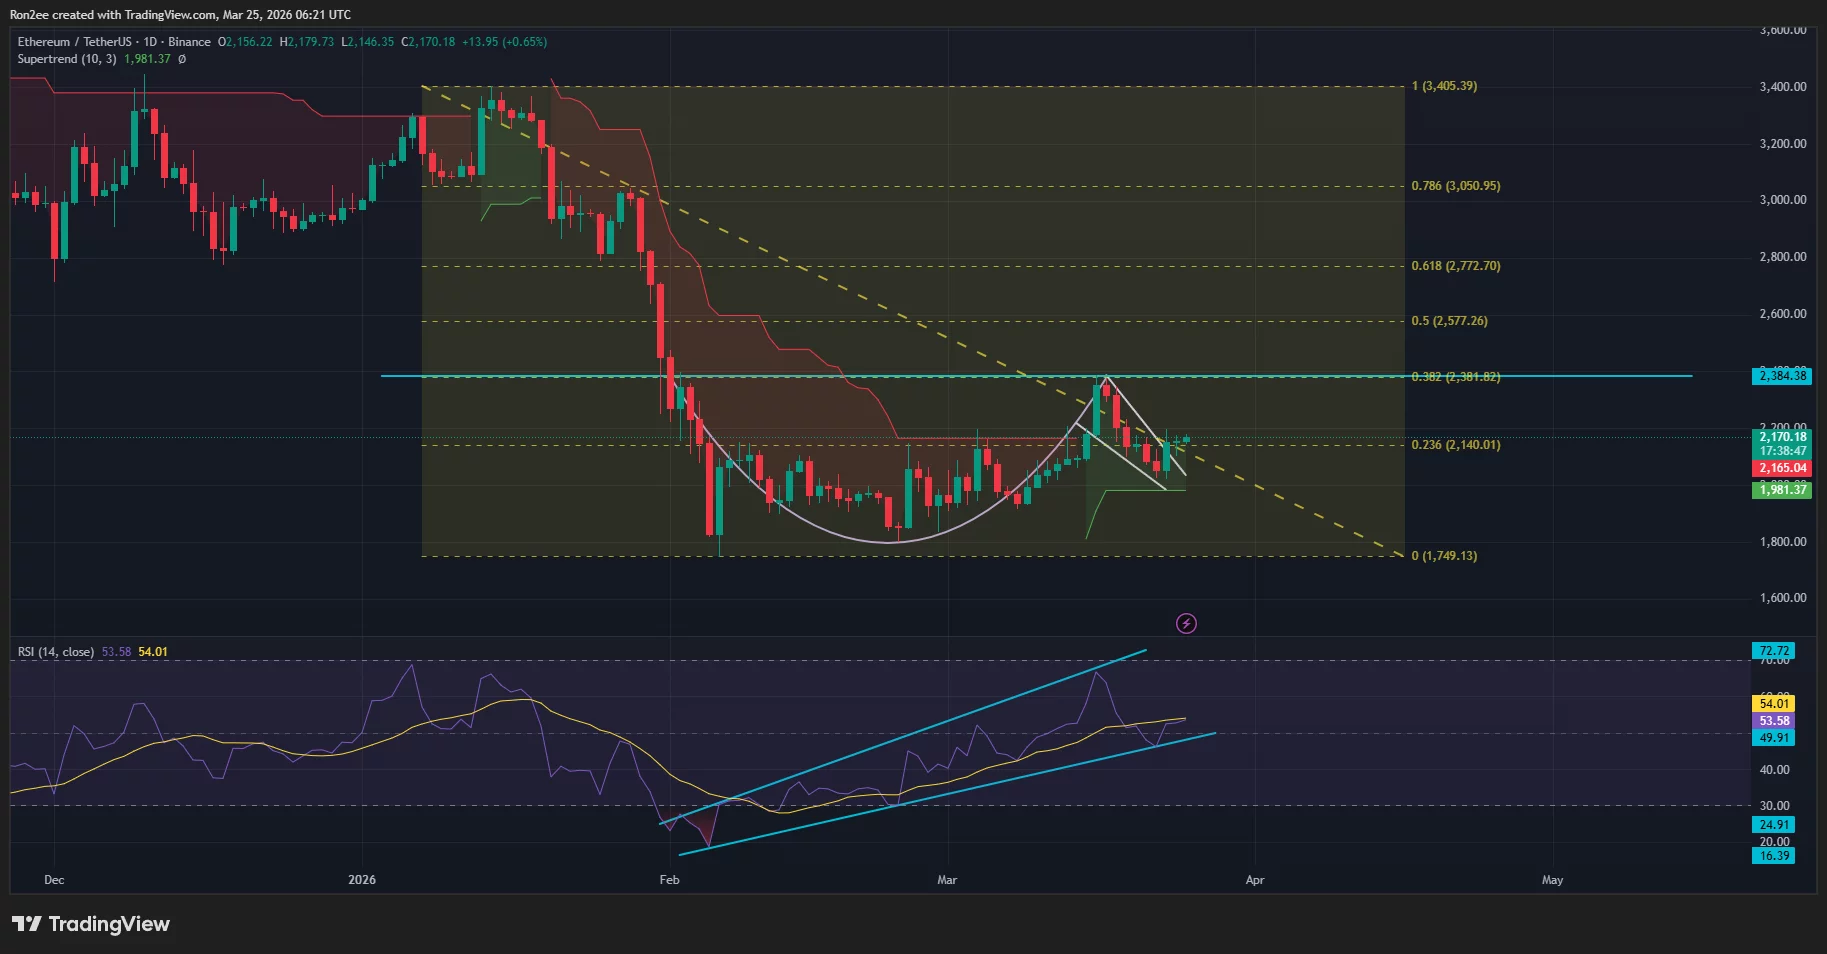
In Ethereum’s case, the neckline of the pattern lies at $2,384. If bulls manage to breach through this level, ETH price could swing above $2,400 and much higher towards the psychological $3,000 mark as the measured move targets become active.
Technical indicators seem to suggest bulls still have plenty of gas in the tank. The Supertrend indicator has flashed green, a sign that the prevailing momentum has shifted in favor of the buyers, while the RSI has rebounded from neutral territory to suggest that there is still significant room for growth before the asset becomes overbought.
Disclosure: This article does not represent investment advice. The content and materials featured on this page are for educational purposes only.


The Iran war has set oil on fire and crypto exchanges are racing to offer 24/7 trading to fill tradfi gaps, with most copying decentralized giant Hyperliquid’s perpetual-futures play.
Crypto market-making giant Wintermute is taking a different approach. On Tuesday, its derivatives unit, Wintermute Asia, launched over-the-counter (OTC) trading in WTI crude oil contracts for difference (CFDs).
CFD is type of derivative that allows traders to speculate on the price movement of an asset without owning it. Similar to futures, CFDs track the asset’s price, but the key difference is that only the difference between the opening and closing prices is exchanged between the trader and the broker when the contract is closed.
These are typically traded over-the-counter and can be tailored in term sof size, duration and margin requirements. This bespoke flexibility allows professional traders and institutions to design strategies that match specific risk-return objectives, rather than conforming to one-size-fits-all derivatives such as Hyperliquid’s oil perpetual futures.
Wintermute’s CFD launch comes amid weeks of intense geopolitical volatility in the Middle East. Escalating tensions between Iran and the U.S.–Israel coalition have left traders in a bind over weekends when traditional finance markets are closed, limiting their ability to adjust positions or manage risk effectively. This led to outsized trading activity on Hyperliquid’s energy market perpetuals and prompted WIntermute to offer CFDs.
“We are seeing strong demand from counterparties looking to use digital asset infrastructure to trade traditional products like oil. The recent price action made that need much more immediate, as many investors were unable to act until traditional venues reopened,” said Evgeny Gaevoy, CEO of Wintermute.
“A Wintermute counterparty could have traded the weekend move before the Monday gap or responded immediately to the reversal,” Gaevoy added.
Note that Wintermute is a counterparty in the CFD. Traders aren’t matched with each other; they are trading directly against Wintermute, which is taking on the market risk. The firm is, therefore, leveraging its risk management systems and deep liquidity to monetize demand for 24/7 crude than simply supplying liquidity to perpetual futures.
Traders can access WTI CFDs with zero trading fees, using a variety of fiat and crypto assets as margin, the official announcement said. Contracts can be executed via chat, Wintermute’s electronic OTC platform, or API. The rollout builds on the recent introduction of tokenized gold, further broadening Wintermute Asia’s suite of offerings beyond purely digital assets.

Austen Morgan: Why did Gerry Adams pull the plug on the victims’ claim?
One Team in Particular Is Monitoring Kirk Cousins

‘Daredevil: Born Again’ Season 2 Review: Series Soars With Unexpected Turns, Pumped-Up Suspense and Fierce Action


-
 Crypto World4 days ago
NIO (NIO) Stock Plunges 6.5% as Shelf Registration Sparks Dilution Worries
-

 Fashion5 days ago
Weekend Open Thread: Adidas – Corporette.com
-

 Politics5 days ago
Jenni Murray, Long-Serving Woman’s Hour Presenter, Dies Aged 75
-

 Crypto World3 days ago
Best Crypto to Buy Now: Strategy Just Spent $1.57 Billion on Bitcoin During Fear While Early Investors Quietly Enter Pepeto for 150x Potential
-

 News Videos7 days ago
RBA board divided on rate cut, unusually buoyant share market | Finance Report | ABC NEWS
-

 Crypto World3 days ago
Bitcoin Price News: Bhutan Sells $72 Million in BTC Under Fiscal Pressure, but the Smart Money Entering Pepeto Sees What the Market Does Not
-

 Politics7 days ago
The House | The new register to protect children from their abusers shows Parliament at its best
-

 Tech5 days ago
inKONBINI Lets You Spend Summer Days Behind the Register
-

 Crypto World7 days ago
Canada’s FINTRAC revokes registrations of 23 crypto MSBs in AML crackdown
-

 Sports2 days ago
Remo Stars and Kano Pillars Strengthen Survival Hopes in NPFL
-
 NewsBeat6 days ago
Residents in North Lanarkshire reminded to register to vote in Scottish Parliament Election
-

 News Videos7 days ago
PARLIAMENT OF MALAWI – PAC MEETING WITH REGISTRAR OF FINANCIAL ON AMARYLLIS HOTEL – INQUIRY LIVE
-

 Politics6 days ago
Gender equality discussions at UN face pushbacks and US resistance
-

 Business3 days ago
No Winner in March 21 Drawing as Prize Rolls to $133 Million for Next
-

 Business6 days ago
Who Was Alex Pretti? 5 Key Facts About the ICU Nurse Killed by Federal Agents in Minneapolis
-

 Sports2 days ago
Gary Kirsten Accuses Pakistan Cricket Board Of ‘Interference’, Mohsin Naqvi Responds
-

 Tech2 days ago
Give Your Phone a Huge (and Free) Upgrade by Switching to Another Keyboard
-

 Tech6 days ago
Inventec’s bizarre VeilBook laptop hides its touchpad under a sliding keyboard just to give cooling fans a little breathing room
-

 Sports5 days ago
2026 Kentucky Derby horses, odds, futures, preview, date: Expert who nailed 12 Derby-Oaks Doubles enters picks
-
Sports6 days ago
Vikings Free Agency Enters Phase 2 with Key Questions
You must be logged in to post a comment Login