

Crypto World
Liquidity Zones and Liquidity Voids: Analysing Price Dynamics

Liquidity zones are areas where large buy and sell orders cluster, often acting as support or resistance. Liquidity voids (or imbalances) are fast price moves where little trading occurred, and price often returns to fill them.
Traders use liquidity zones to identify entry and exit points, while liquidity voids may help anticipate retracements and continuation moves.
This article explains how liquidity zones and liquidity voids function in market structure and highlights their role on price charts.
Takeaways
- Liquidity zones = high trading activity (support/resistance)
- Liquidity voids = low activity (fast price moves)
- Price tends to:
- move towards liquidity
- return to fill voids
- Commonly used with:
- market structure
- volume analysis
Liquidity Zones vs Liquidity Voids
Liquidity zones and liquidity voids differ primarily in how order flow is distributed and how price behaves within each environment.
In liquidity zones, trading activity is elevated due to the presence of clustered orders around previous highs, lows, or consolidation ranges. This concentration of liquidity typically causes prices to slow down, rotate, or produce reactions, reinforcing their role as support and resistance areas.
In contrast, liquidity voids form during strong directional moves, leaving behind areas where little trading activity has previously occurred. As a result, when price revisits these regions, it often moves quickly due to the absence of significant opposing orders.
Liquidity zones are generally associated with reversal or breakout strategies, where traders anticipate interaction between buyers and sellers. Liquidity voids, however, are typically approached with mean reversion expectations, as the market tends to rebalance prior inefficiencies.
Understanding Liquidity in Trading
In trading, liquidity refers to how easily an asset can be bought or sold without significantly affecting its price. High liquidity means there are enough buyers and sellers at a given price level, facilitating smoother transactions. This concept is critical because it affects how quickly and at what price a trader can enter or exit positions.
Assets with high liquidity tend to have tighter spreads, which may reduce trading costs.
Conversely, assets with low liquidity can experience abrupt price movements due to limited order flow. Understanding liquidity may help traders make decisions.
These dynamics give rise to two important phenomena in trading: liquidity zones and voids. Liquidity zones are areas with a high concentration of trading activity, while liquidity voids represent gaps in the market where trading activity is sparse, each presenting unique conditions for trading strategies.
What Are Liquidity Zones in Trading?
Liquidity zones (also called liquidity levels) are specific areas on a price chart where trading activity is highly concentrated. These zones indicate areas where large orders can be executed with minimal price impact.
Forex liquidity zones highlight areas where currency pairs tend to see higher activity.
These areas may be useful for identifying reversals or breakouts, providing reference points for entries and exits.
These zones often form around historical price levels where significant trading activity has occurred. They often act as magnets, attracting future price movement due to expected order flow. Liquidity levels are commonly associated with support and resistance. When price approaches these levels, traders can expect increased order flow, which may lead to clearer price reactions.
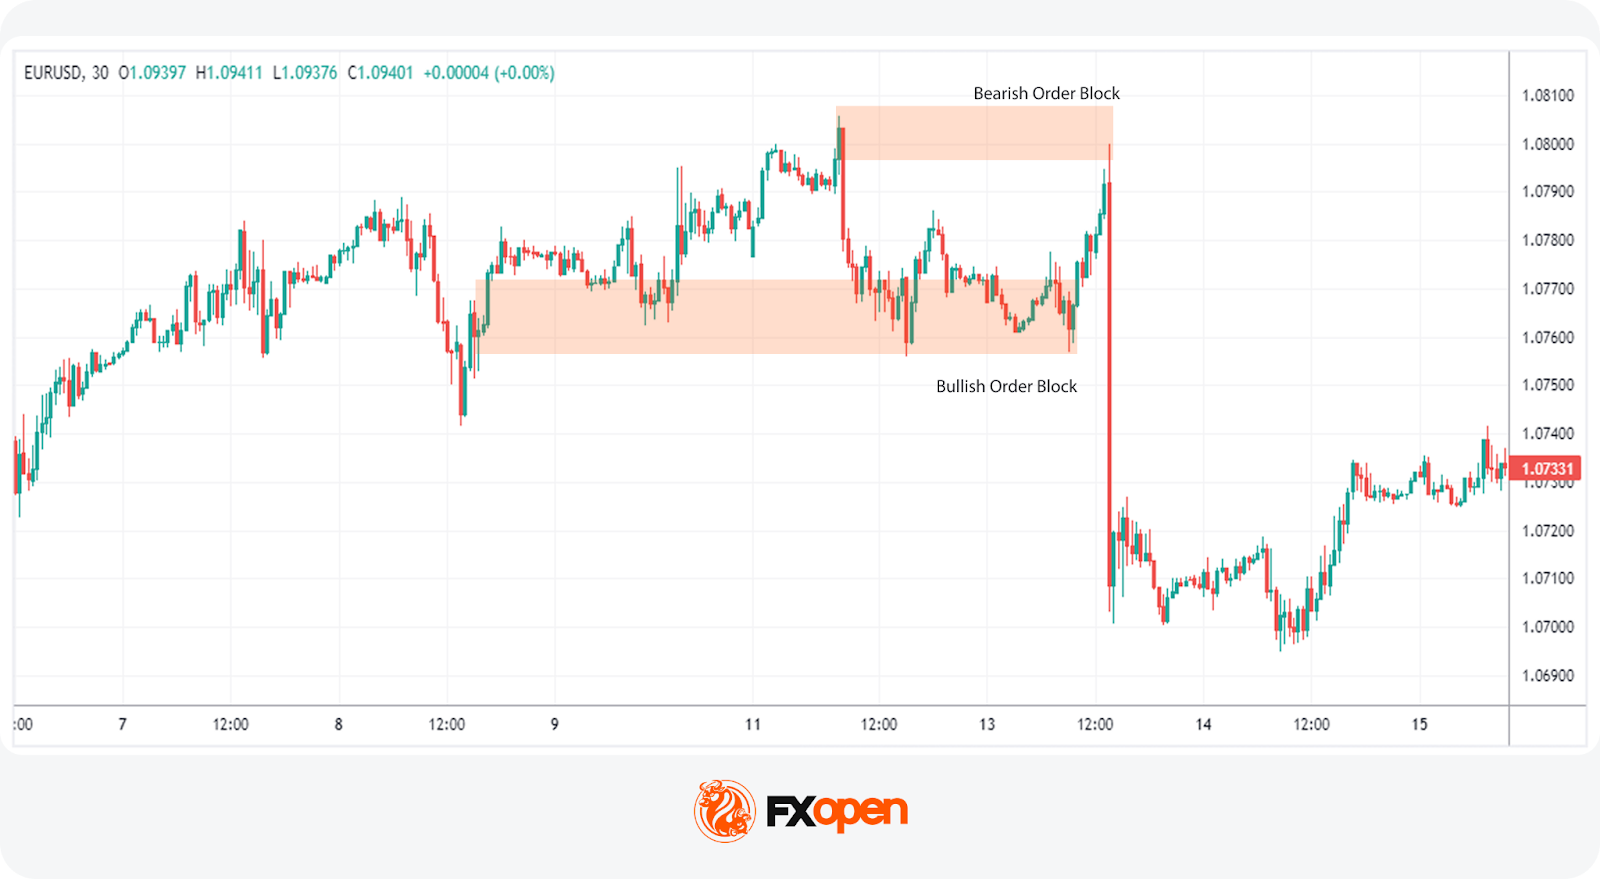
Liquidity Zones vs Order Blocks
How Traders Identify Liquidity Zones (With Examples)
Traders identify liquidity zones using volume, price structure, and historical levels. Liquidity zone trading depends on accurately identifying areas where trading activity is concentrated. These levels highlight regions of high volume and may act as pivot points for price action.
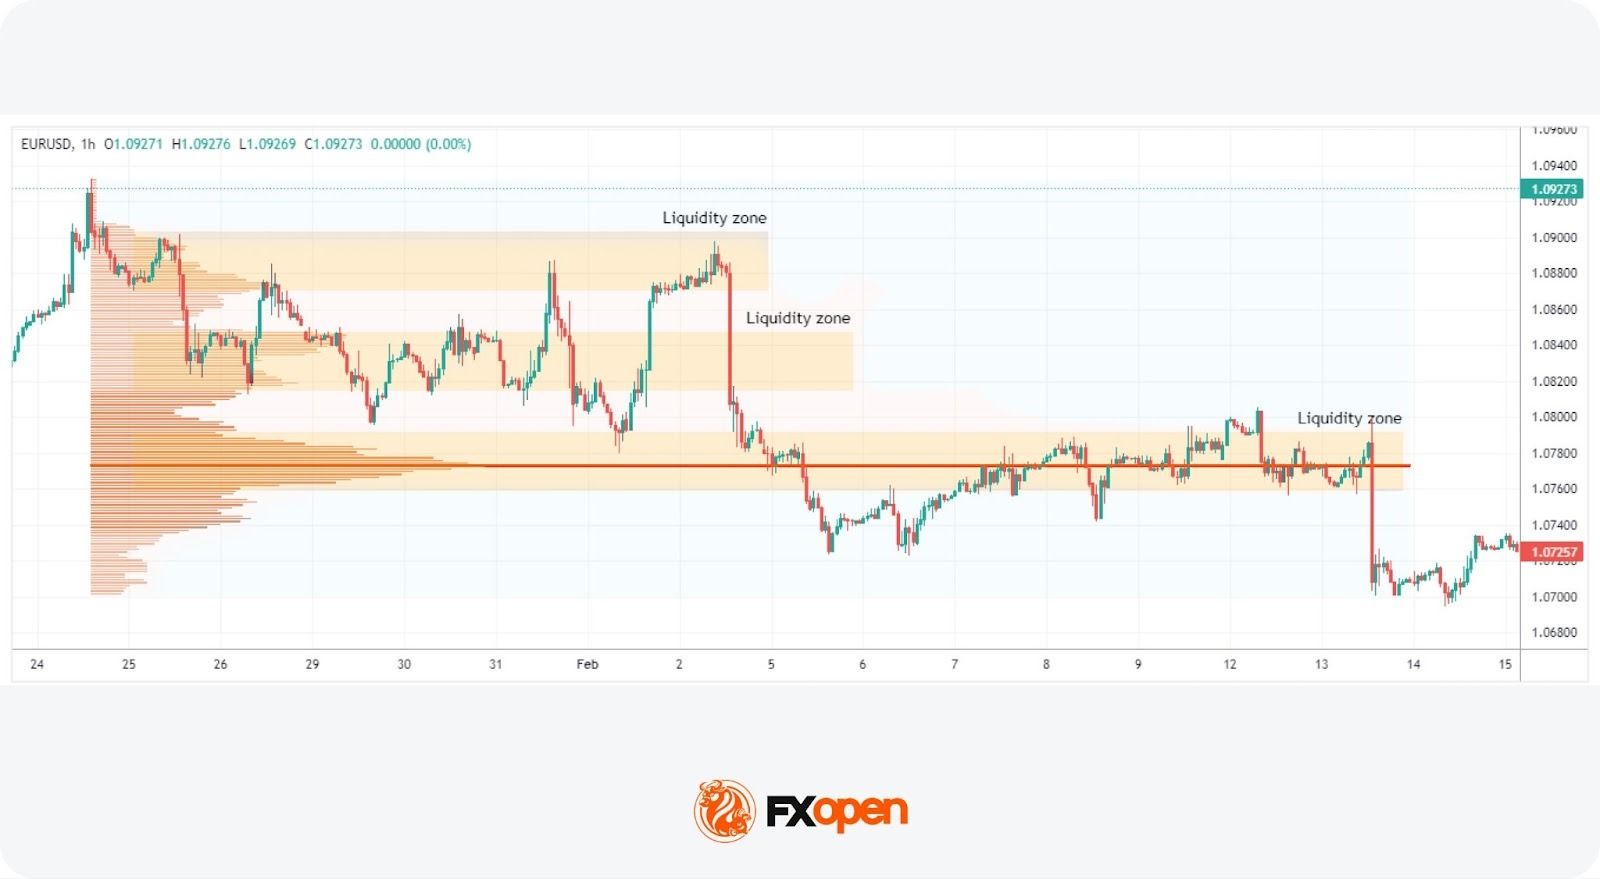
Volume Profile
This approach uses the volume profile to show where most trading activity has occurred.
Unlike traditional indicators that display volume over time, the volume profile shows volume at specific price levels. This may help traders identify peaks in volume, highlighting areas of significant liquidity.
To use the volume profile tool as we have in the picture above, you can head over to FXOpen’s TickTrader trading platform and search for “Volume Profile Fixed Range” under the Indicators tab.
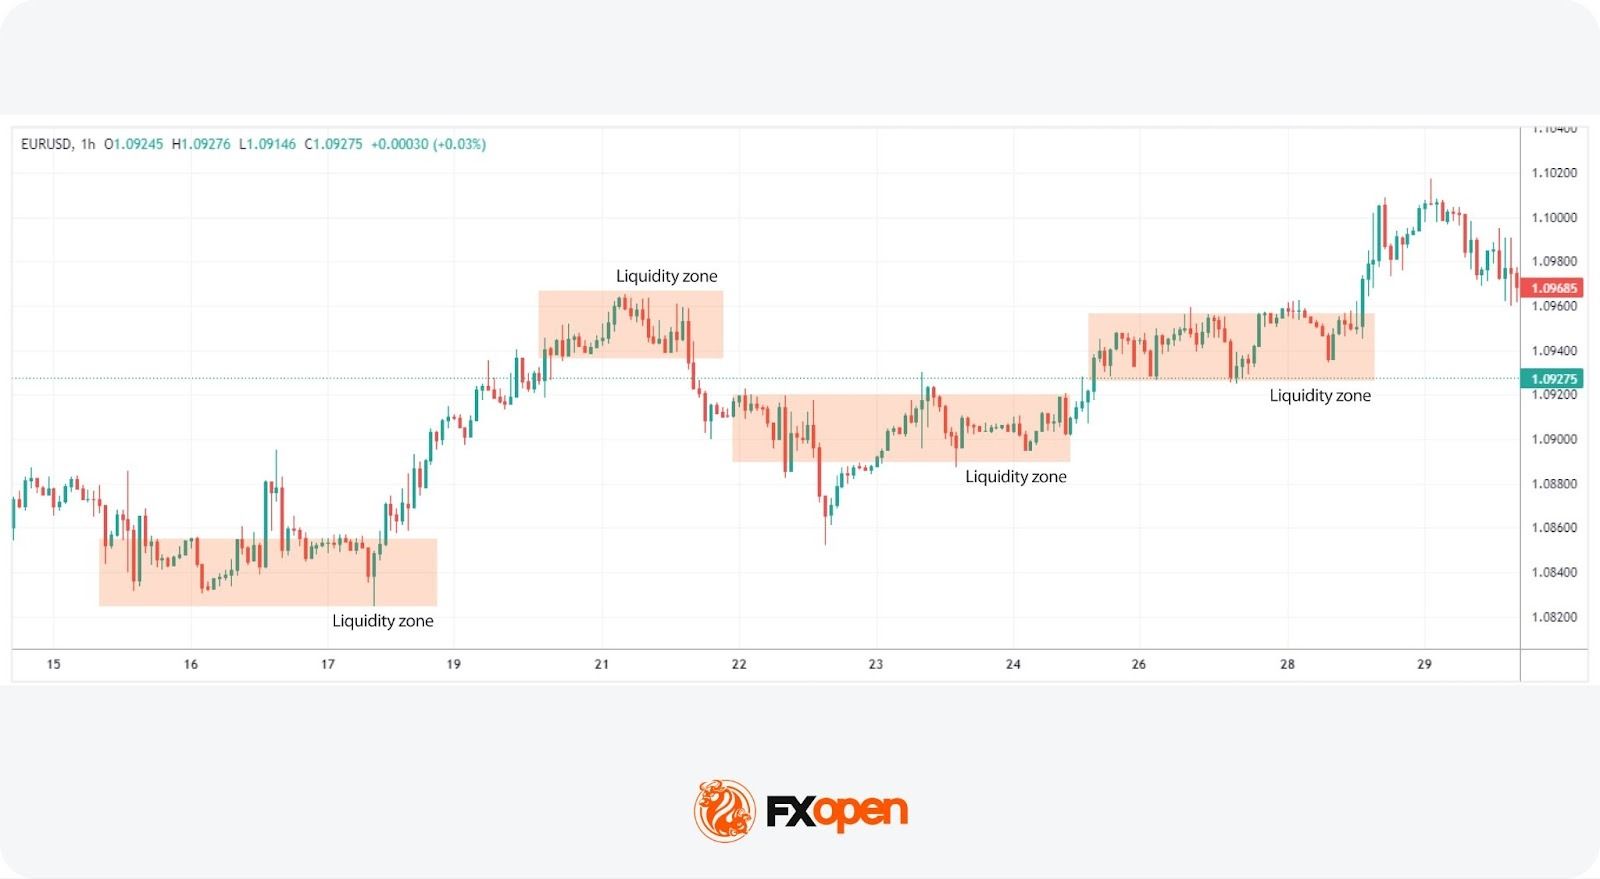
Price Consolidation Areas
Recognising zones where the price has consolidated for a notable period is another method. These areas represent a tug-of-war between buyers and sellers, resulting in a high volume of trades. Such levels often act as magnets for future price action, making them critical for liquidity area trading.
Previous Support and Resistance Levels
Historical support and resistance levels are invaluable for spotting zones. These are levels at which significant reversals or pauses in trend have occurred, indicating areas where large volumes of orders may accumulate. When price approaches these levels again, it often does so with increased trading activity, making them prime candidates for liquidity areas.
What Is a Liquidity Void (Imbalance)?
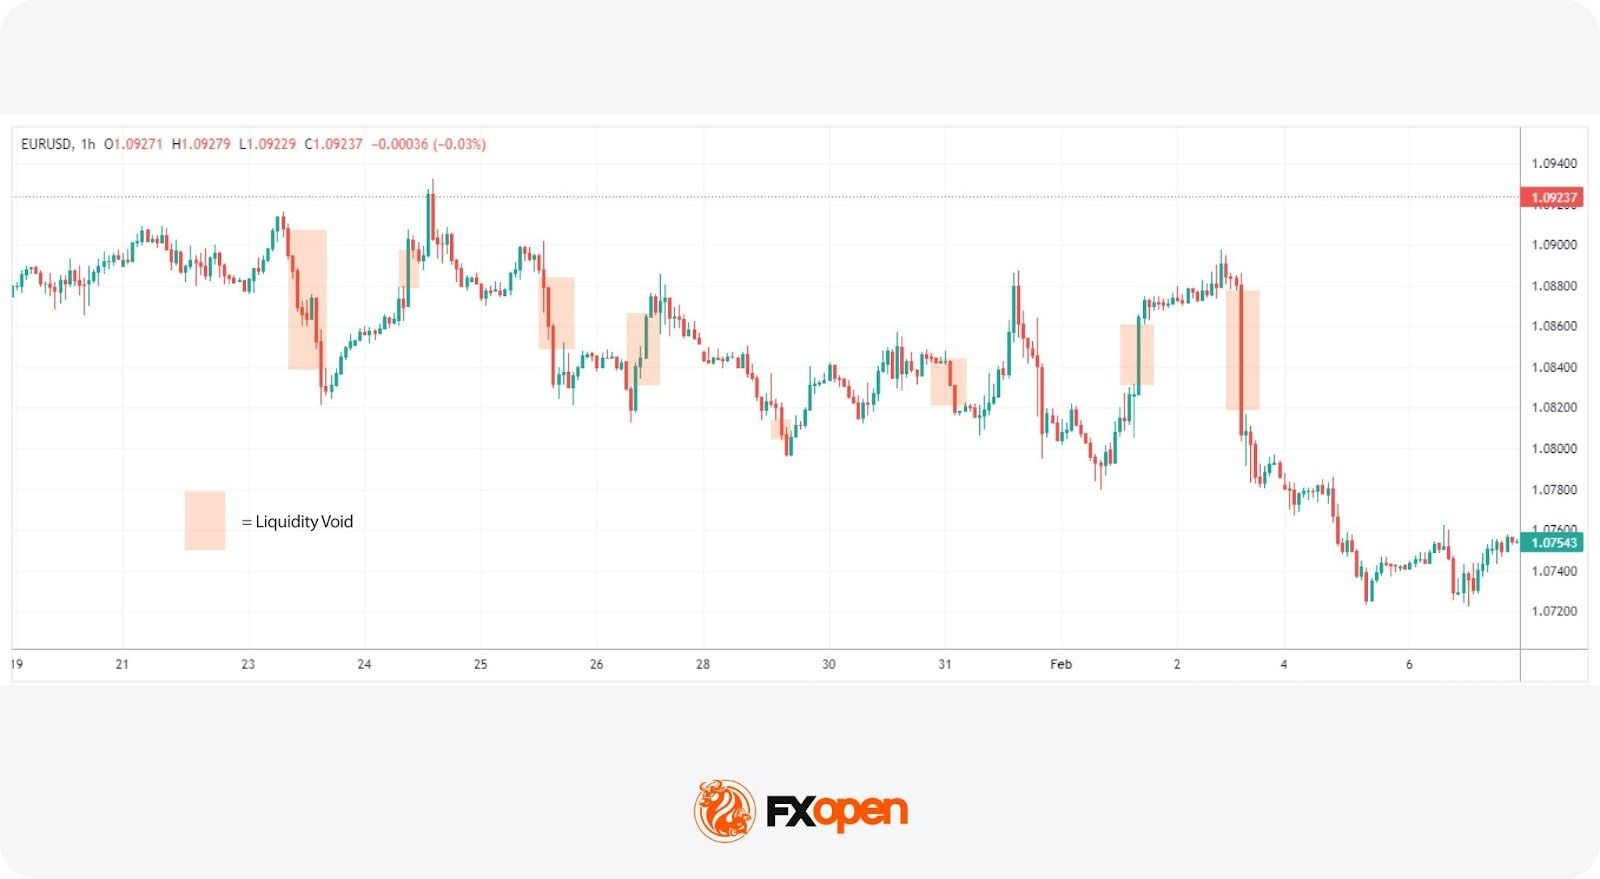
Liquidity voids (imbalances) are rapid price movements where little trading activity occurs between two levels. These gaps can lead to abrupt price changes and are often visible as sharp moves on a chart.
A liquidity void in forex signals an imbalance between buyers and sellers, causing prices to move quickly. This can result in sharp price movement as the market seeks a new equilibrium. These voids often occur after major news releases, during low-liquidity periods, or due to large institutional trades.
Their impact extends beyond the initial move. They represent areas where the market has not established a consensus price, which may lead to increased volatility later. Prices often return to these areas to “fill” the imbalance and restore balance in the market.
Traders navigate the increased volatility and unpredictability associated with these gaps but can also strategise to take advantage of the potential return to equilibrium.
How Traders Spot Liquidity Voids (Types of Liquidity Voids)
Liquidity voids can be classified based on where they appear in a trend. Liquidity voids in the forex market manifest in various forms, each with distinct characteristics and implications for traders. Understanding the different types of voids may support traders in navigating these challenging areas. Some notable types of liquidity voids are common, exhaustion, breakout, and runaway. Let’s take a look at them:
Common Liquidity Voids
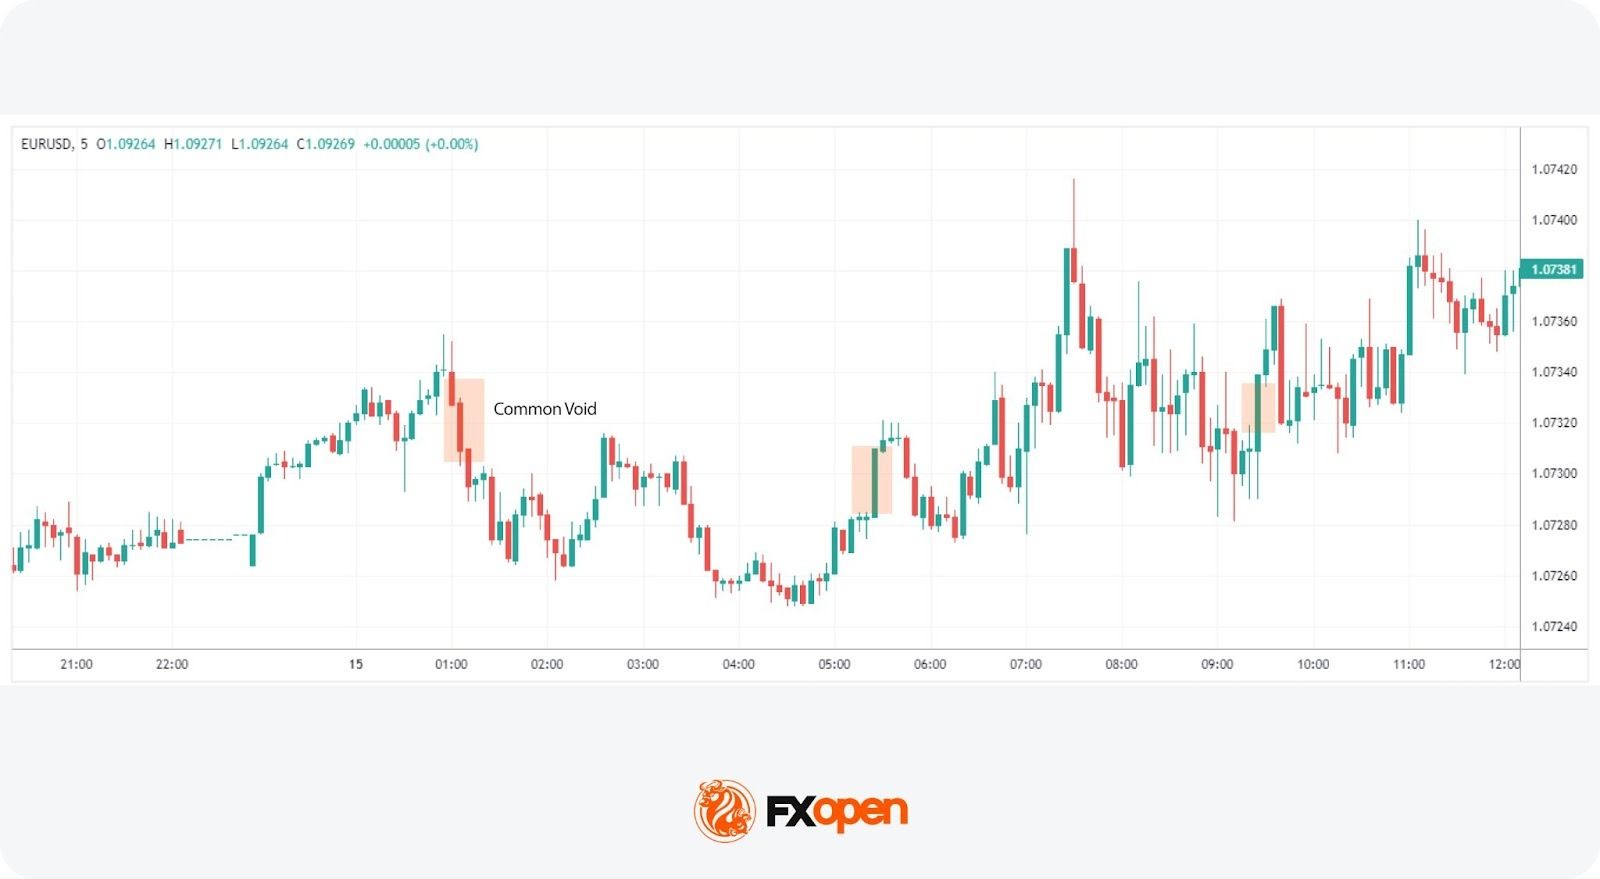
Common voids appear randomly across charts without any news or event trigger, forming from natural market ebb and flow. They don’t always carry significant analytical value but are still worth monitoring for risk management purposes.
Exhaustion Liquidity Voids
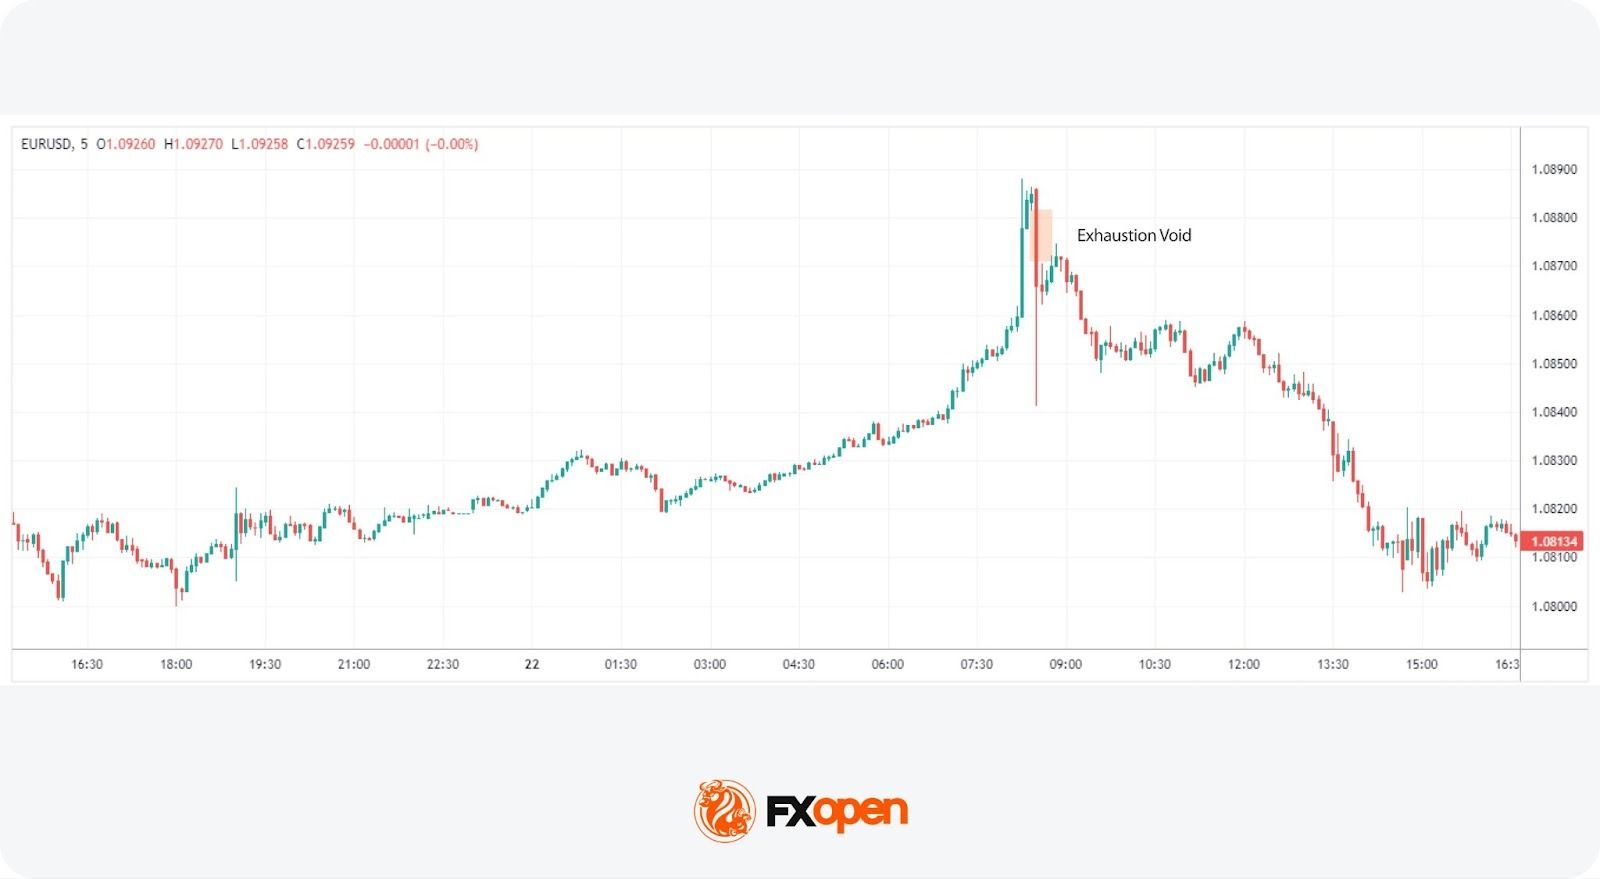
Exhaustion liquidity voids appear at the end of a trend when momentum fades and price makes a final push before reversing. Traders often watch for them as potential signals of a trend reversal.
Breakout Liquidity Voids
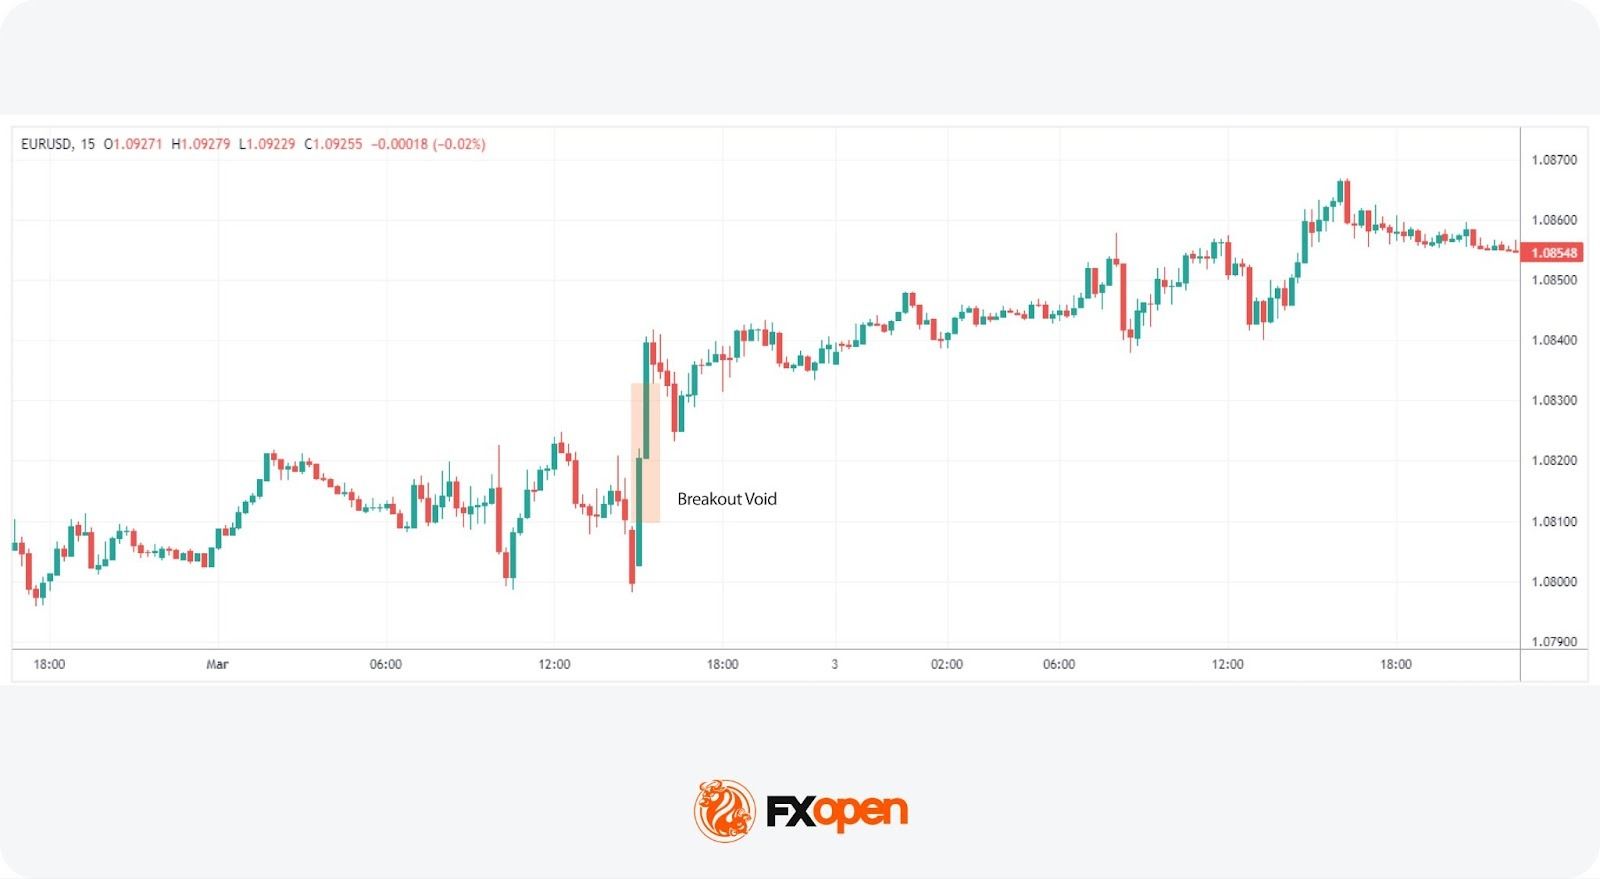
Breakout voids form when price breaks through a key support or resistance level with enough force to leave behind an imbalance. They often signal the beginning of a new trend.
Runaway Liquidity Voids
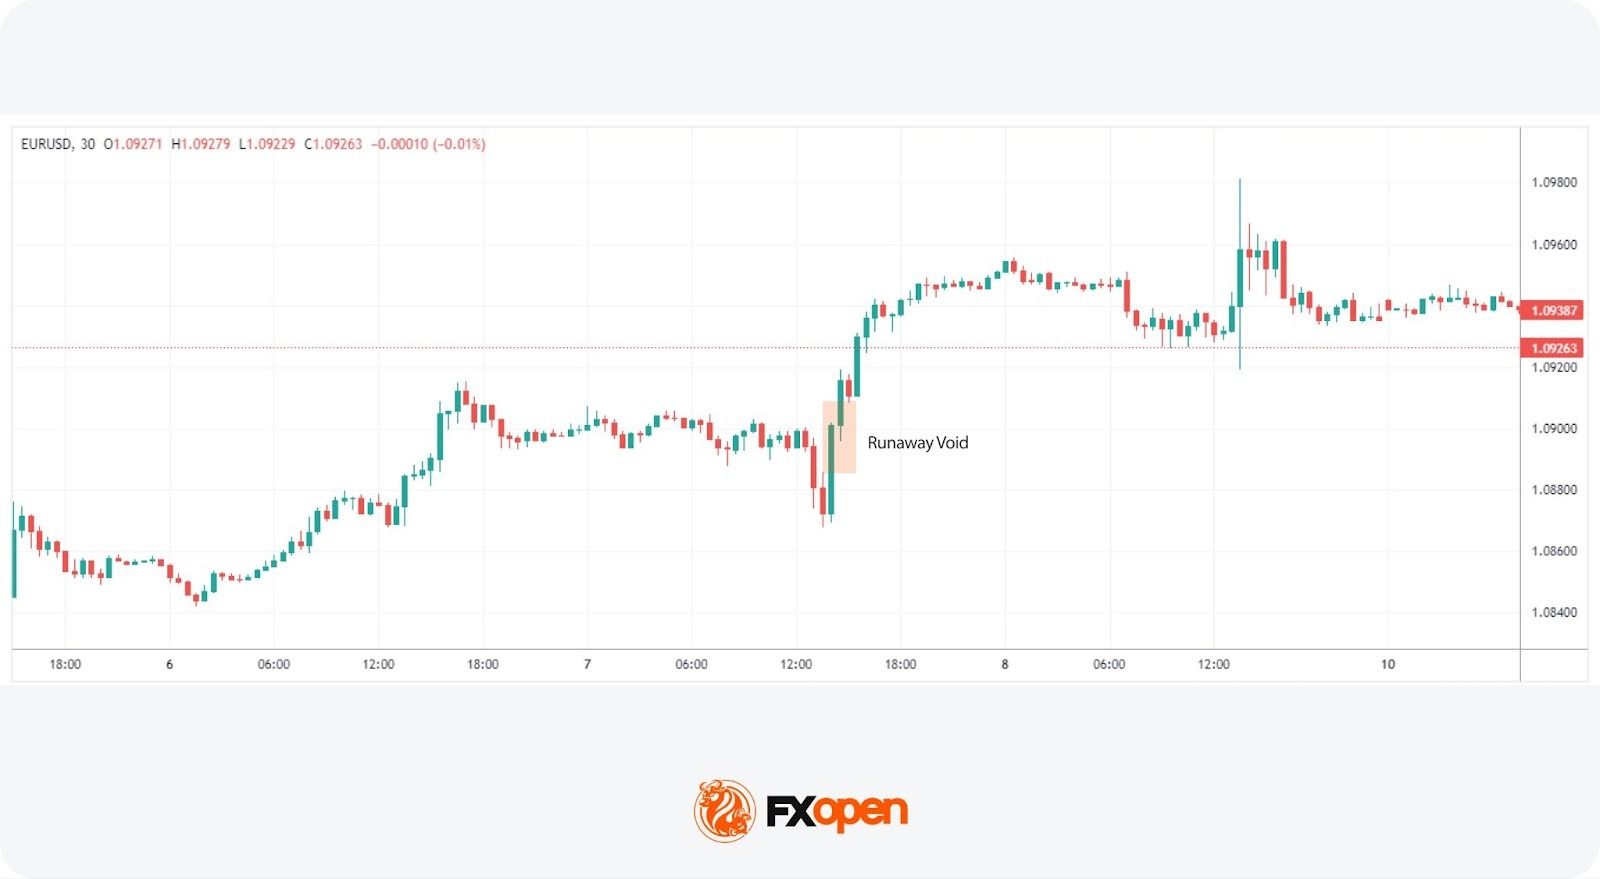
Runaway voids occur within an existing trend and signal its continuation. Price moves sharply in the trend’s direction, bypassing levels where liquidity would normally sit, which may support trend strength confirmation.
How Traders Use Liquidity Zones and Voids
Liquidity zones and voids form the basis of several common trading approaches. Here’s how traders typically work with them.
Step 1: Identify a Liquidity Zone
Traders start by locating areas where price has repeatedly reacted, such as support and resistance levels or high-volume nodes on a volume profile. These clusters of resting orders act as magnets for price.
Step 2: Wait for a Price Reaction
Rather than acting immediately, traders watch how price behaves when it reaches the zone. Does it stall? Reverse? Push straight through? The reaction tells the story.
Step 3: Look for Confirmation
A reaction alone isn’t enough. Traders look for confirmation through candlestick patterns (like pin bars or engulfing candles) or a shift in market structure, such as a break of a recent swing high or low.
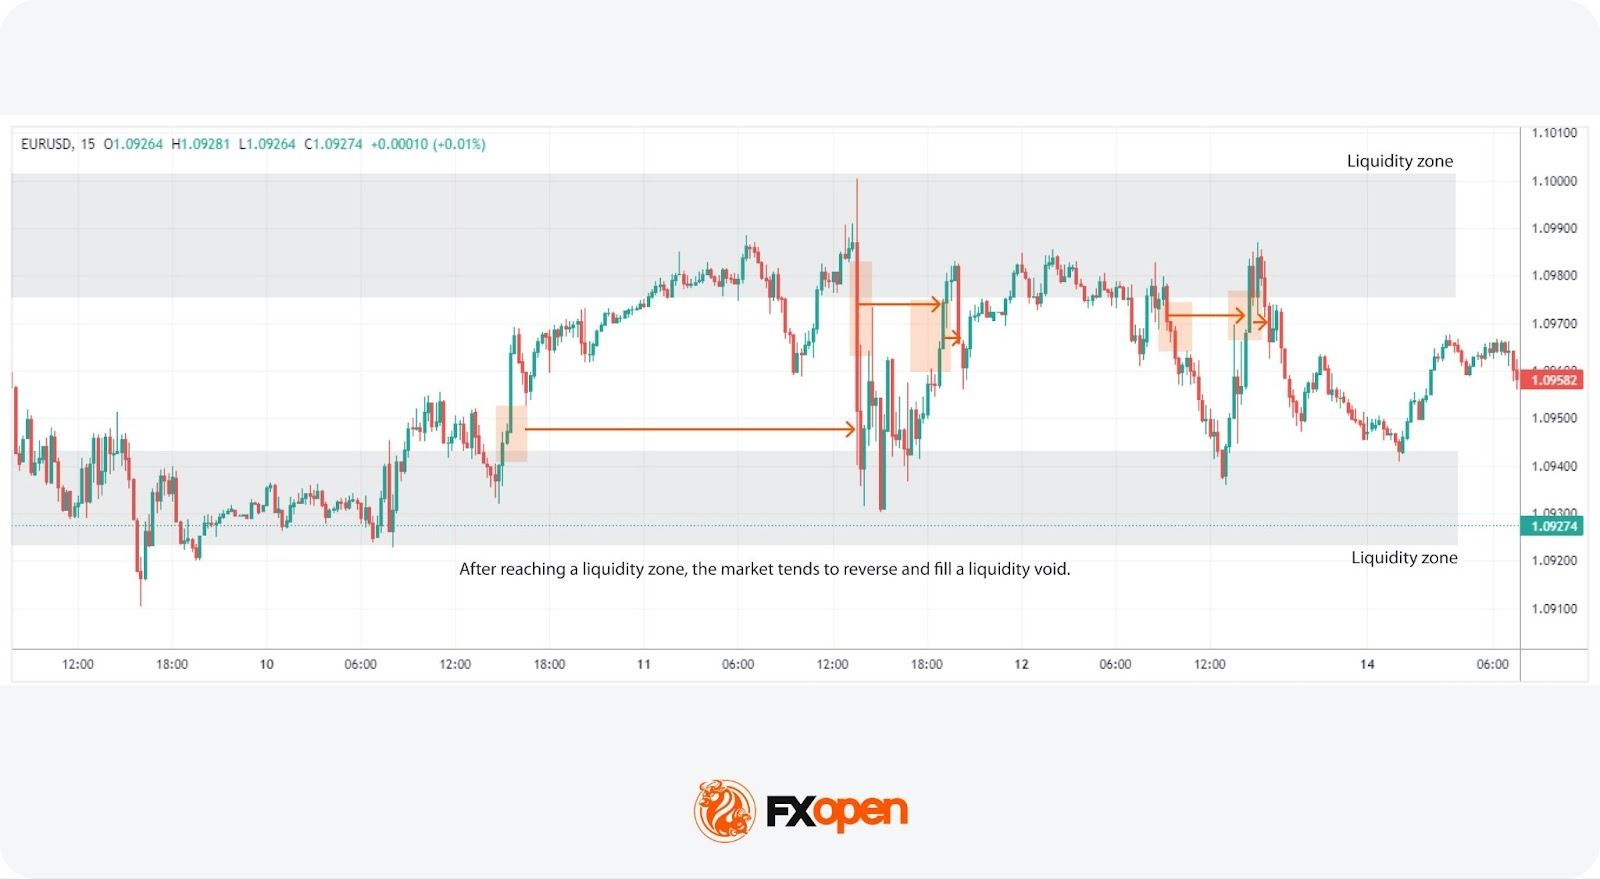
Step 4: Target Nearby Liquidity or a Void
Once confirmed, traders typically set targets at the next liquidity zone or unfilled void. Voids act as areas price is likely to move toward, since they represent unfinished business on the chart.
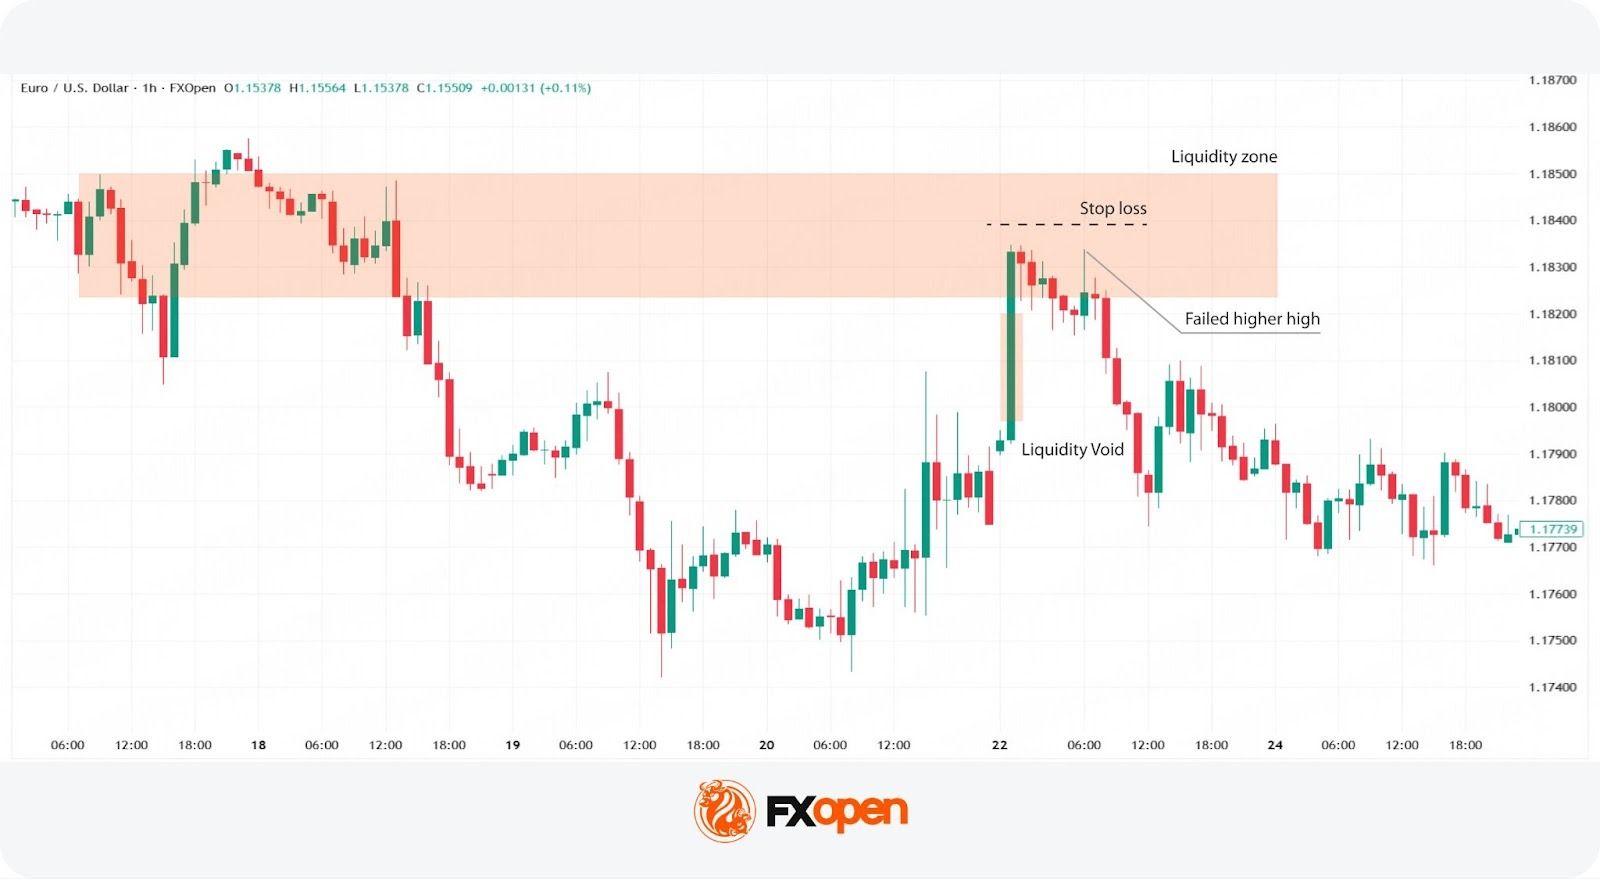
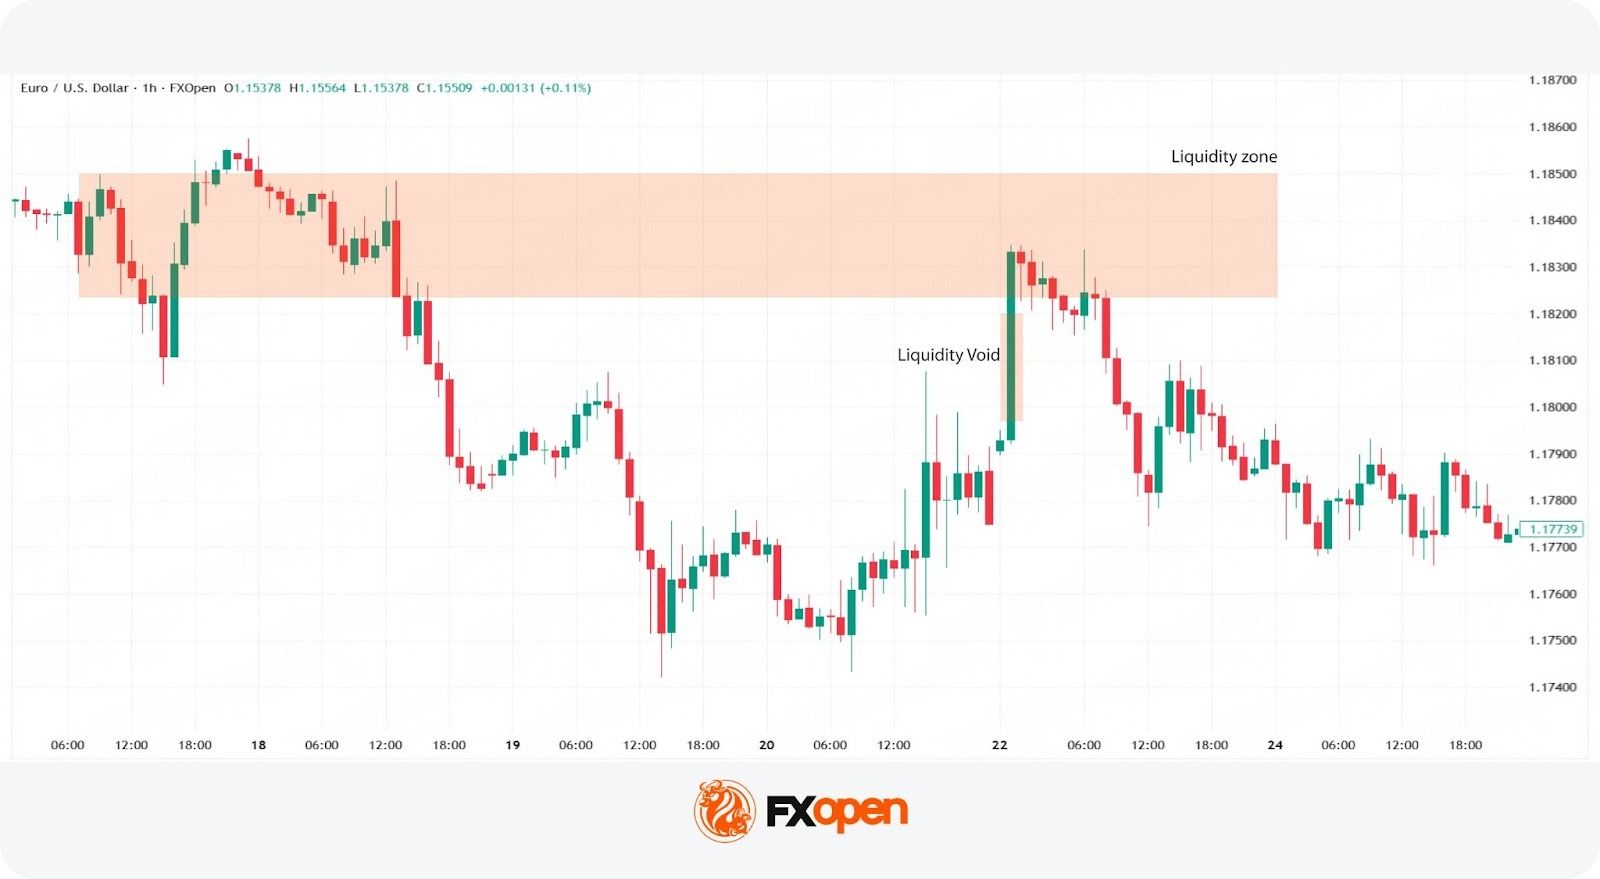
In this example, price moves into a liquidity zone, leaving a void behind it. Buyers attempt to push higher but fail, printing a long upper wick and signalling weakening momentum. Price then breaks below the established low and drops to fill the liquidity void left on the way up. A trader could have opened a sell position after the price broke below the low, set a stop-loss level above the nearest swing high, and closed the trade once the liquidity void was filled.
Limitations of Liquidity Zones and Voids
Understanding liquidity zones and voids provides traders with valuable insights into market dynamics, yet relying solely on these concepts comes with limitations. Here are some specific challenges to consider:
- Market Volatility: Market volatility can disrupt liquidity patterns, making historical levels less reliable.
- Influence of External Events: External events such as economic announcements can override expected behaviour.
- Timeframe Sensitivity: The relevance of zones and voids varies across timeframes, which may affect analysis.
- False Signals: These patterns can also produce false signals, leading to premature decisions.
The Bottom Line
Liquidity zones and voids may help explain how price moves within the forex market. They highlight areas of trading activity and imbalance, offering insight into potential price behaviour.
However, traders use them alongside other tools due to their limitations.
For traders seeking to apply these insights, opening an FXOpen account could provide a practical platform to explore and leverage the dynamics of liquidity in their trading across hundreds of tradable assets.
FAQs
What Are Liquidity Zones?
Liquidity zones are areas on a chart where buy and sell orders are concentrated, often acting as support or resistance. Traders monitor these levels to identify potential entry and exit points.
How Are Liquidity Zones Identified in Trading?
Liquidity zones are identified using tools such as volume profile, price consolidation, and historical support and resistance. These methods highlight areas where trading activity is concentrated.
How May Liquidity Zones Be Traded?
Liquidity zones are commonly used to identify potential entry and exit points. Traders monitor price reactions at these levels and may combine them with other tools to refine trading decisions.
What Are Liquidity Voids?
Liquidity voids are areas where price moves quickly due to low trading activity, creating an imbalance. Price often returns to these areas to “fill” the gap and restore market balance.
This article represents the opinion of the Companies operating under the FXOpen brand only. It is not to be construed as an offer, solicitation, or recommendation with respect to products and services provided by the Companies operating under the FXOpen brand, nor is it to be considered financial advice.

The AI and crypto industries have made headlines over the past year thanks to the impressive war chests amassed by corporate political action committees (PACs).
Profligate spending during the last federal elections in the US has led to unprecedented policy changes favoring the crypto industry, with indications that a full legislative framework in the form of the CLARITY Act is on its way to becoming law.
But this hasn’t endeared the crypto industry to voters. Recent polls from Politico show distrust of the crypto industry, and the electorate isn’t sold on the benefits of AI.
“Voters across the ideological spectrum are raising concerns,” Michael Beckel, director of money in politics reform at Issue One, told Cointelegraph. “Some candidates on both sides of the aisle are trying to harness that frustration and outrage.”
Voters don’t trust crypto and don’t believe AI benefits them
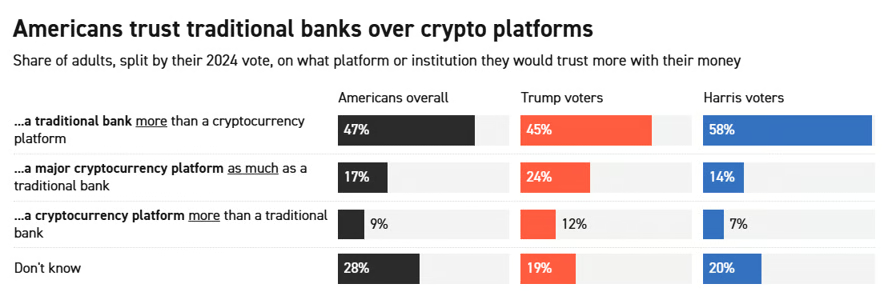
According to the recent poll by Public First for Politico, most Americans don’t trust crypto and don’t believe in the benefits of AI.

Source: Politico
While Republican voters are somewhat more likely to trust crypto, 47% of Americans overall trust a traditional bank over a crypto platform, while 17% trust a crypto platform as much as a traditional bank.
The numbers for AI aren’t great either. Some 43% of Americans overall believe that the risks outweigh the benefits, while 33% believe the inverse.

Source: Politico
Related: Crypto PACs secure massive war chests ahead of US midterms
Currently, most people haven’t heard about the major crypto and AI lobbies. According to Politico, only nine percent have heard of AI Super PAC Leading the Future. Only three percent have heard of pro-crypto PAC Fairshake.
That’s not much compared to public awareness of large lobbies like the National Rifle Association or the Planned Parenthood Action Fund, which are practically household names.
Still, association with crypto could be a problem. Ohio Republican Representative Jim Renacci told Politico, “I do think if they see somebody is backed by crypto, that’s always going to be a problem, because, let’s face it, the people that I talk to in Ohio, they don’t understand crypto, and most say they’re not comfortable with [it].”
Improving awareness around crypto lobbies may not help them much. Rick Claypool, research director at Public Citizen, told Cointelegraph:
“Generally speaking, voters are against corporate money influencing politics.”
“Even after Citizens United, the norm had been for big, brand-name corporations not to engage directly. Or when they did engage, they would often contribute through dark money groups that obscure their funding source.”
In this regard, the crypto industry’s spending spree in 2024 was somewhat unusual. Major contributors like Coinbase or a16z weren’t shy about the millions of dollars they put into campaigns.
But even then, “the voter-facing message from Fairshake was never about crypto, which voters never really cared about.” Mailers and ad buys reflected the supported candidates’ positions more broadly, or sometimes attacked those of the perceived anti-crypto candidate.
Overall, “candidates who are seen as not beholden to corporate interests have an electoral edge,” said Claypool. This was true for populist candidates like US Senator Bernie Sanders and even US President Donald Trump, who claimed during his 2016 campaign that “he was so rich he could not be bought, which is laughable in hindsight.”
If awareness about crypto — and crypto’s concerted efforts to influence policy — increases among the electorate, it may not shake out well.
Issue One’s Beckel said, “If voters view an industry as toxic, that can have serious implications for candidates who don’t want to be perceived as too close to a controversial company or industry.”
Grassroots organize against AI, crypto gets its day in Washington
Voter dissatisfaction with a certain industry has translated into real action.
Beckel noted a recent example when voter attitudes about the oil and fossil fuel lobby were enough to get some Democratic candidates to swear off any contributions. Beckel said that some organizations are already urging lawmakers to forswear any contributions from AI lobbies.
Indeed, there has been a grassroots movement growing against the AI industry more directly, namely the construction of the highly expensive and resource-intensive data centers. Local movements in seven states have blocked or delayed over $64 billion in data center investment. One state, Maine, is poised to introduce a state-wide ban.

Municipalities in California, Oregon, Arizona, Texas, Missouri, Indiana and Virginia have banned or delayed projects. Source: Data Center Watch
According to Claypool, this could prove a great opportunity for Congressional candidates “to seize the grassroots momentum against data centers and Big Tech for Democrats in particular, but not exclusively, since the tech sector has so fully enmeshed itself with the Trump administration.”
This increasing partisan alignment could also affect how voters perceive these industries.
Jason Thielman, former executive director of the National Republican Senatorial Committee, said that the crypto industry has attempted to “maintain a degree of bipartisanship and identify people whom they think will be champions on these issues.”
But even as the lobby claims to be bipartisan — Coinbase CEO Brian Armstrong called crypto “the most bipartisan issue” in DC — its priorities like deregulation and withdrawn enforcement lean mostly, but not exclusively, Republican, said Claypool.
Claypool said that “crypto billionaires have tried to present themselves as scrappy underdogs against Wall Street.”
“But that’s a less compelling argument now that crypto allies run, in addition to the White House, the DOJ, SEC, CFTC, the Treasury Dept., and the Commerce Dept.”
Furthermore, the sector has become deeply tied to Trump himself after the president’s full embrace of the industry in 2024, as well as pardons for convicted crypto execs and his use of crypto for his own personal enrichment.
With Trump’s popularity sliding due to geopolitical bungles, an unpredictable economic outlook and controversial policies at home, having ties to him and his party may carry political risk.
In a Democratic Illinois Senate primary, Illinois Lieutenant Governor Juliana Stratton accused her opponent Representative Raja Krishnamoorthi of being backed by big money from “MAGA-backed crypto bros.” She won by seven points.
It could also influence future policymaking. Said Beckel, “If an industry is viewed as a friend of one party and enemy of another, it may be more likely to be in the crosshairs or under the microscope when the other party is in power.”
For crypto and AI, that moment may come as soon as Nov. 4.
Magazine: XRP ‘probably going to $12,’ Bitcoin ETFs add $1B: Market Moves
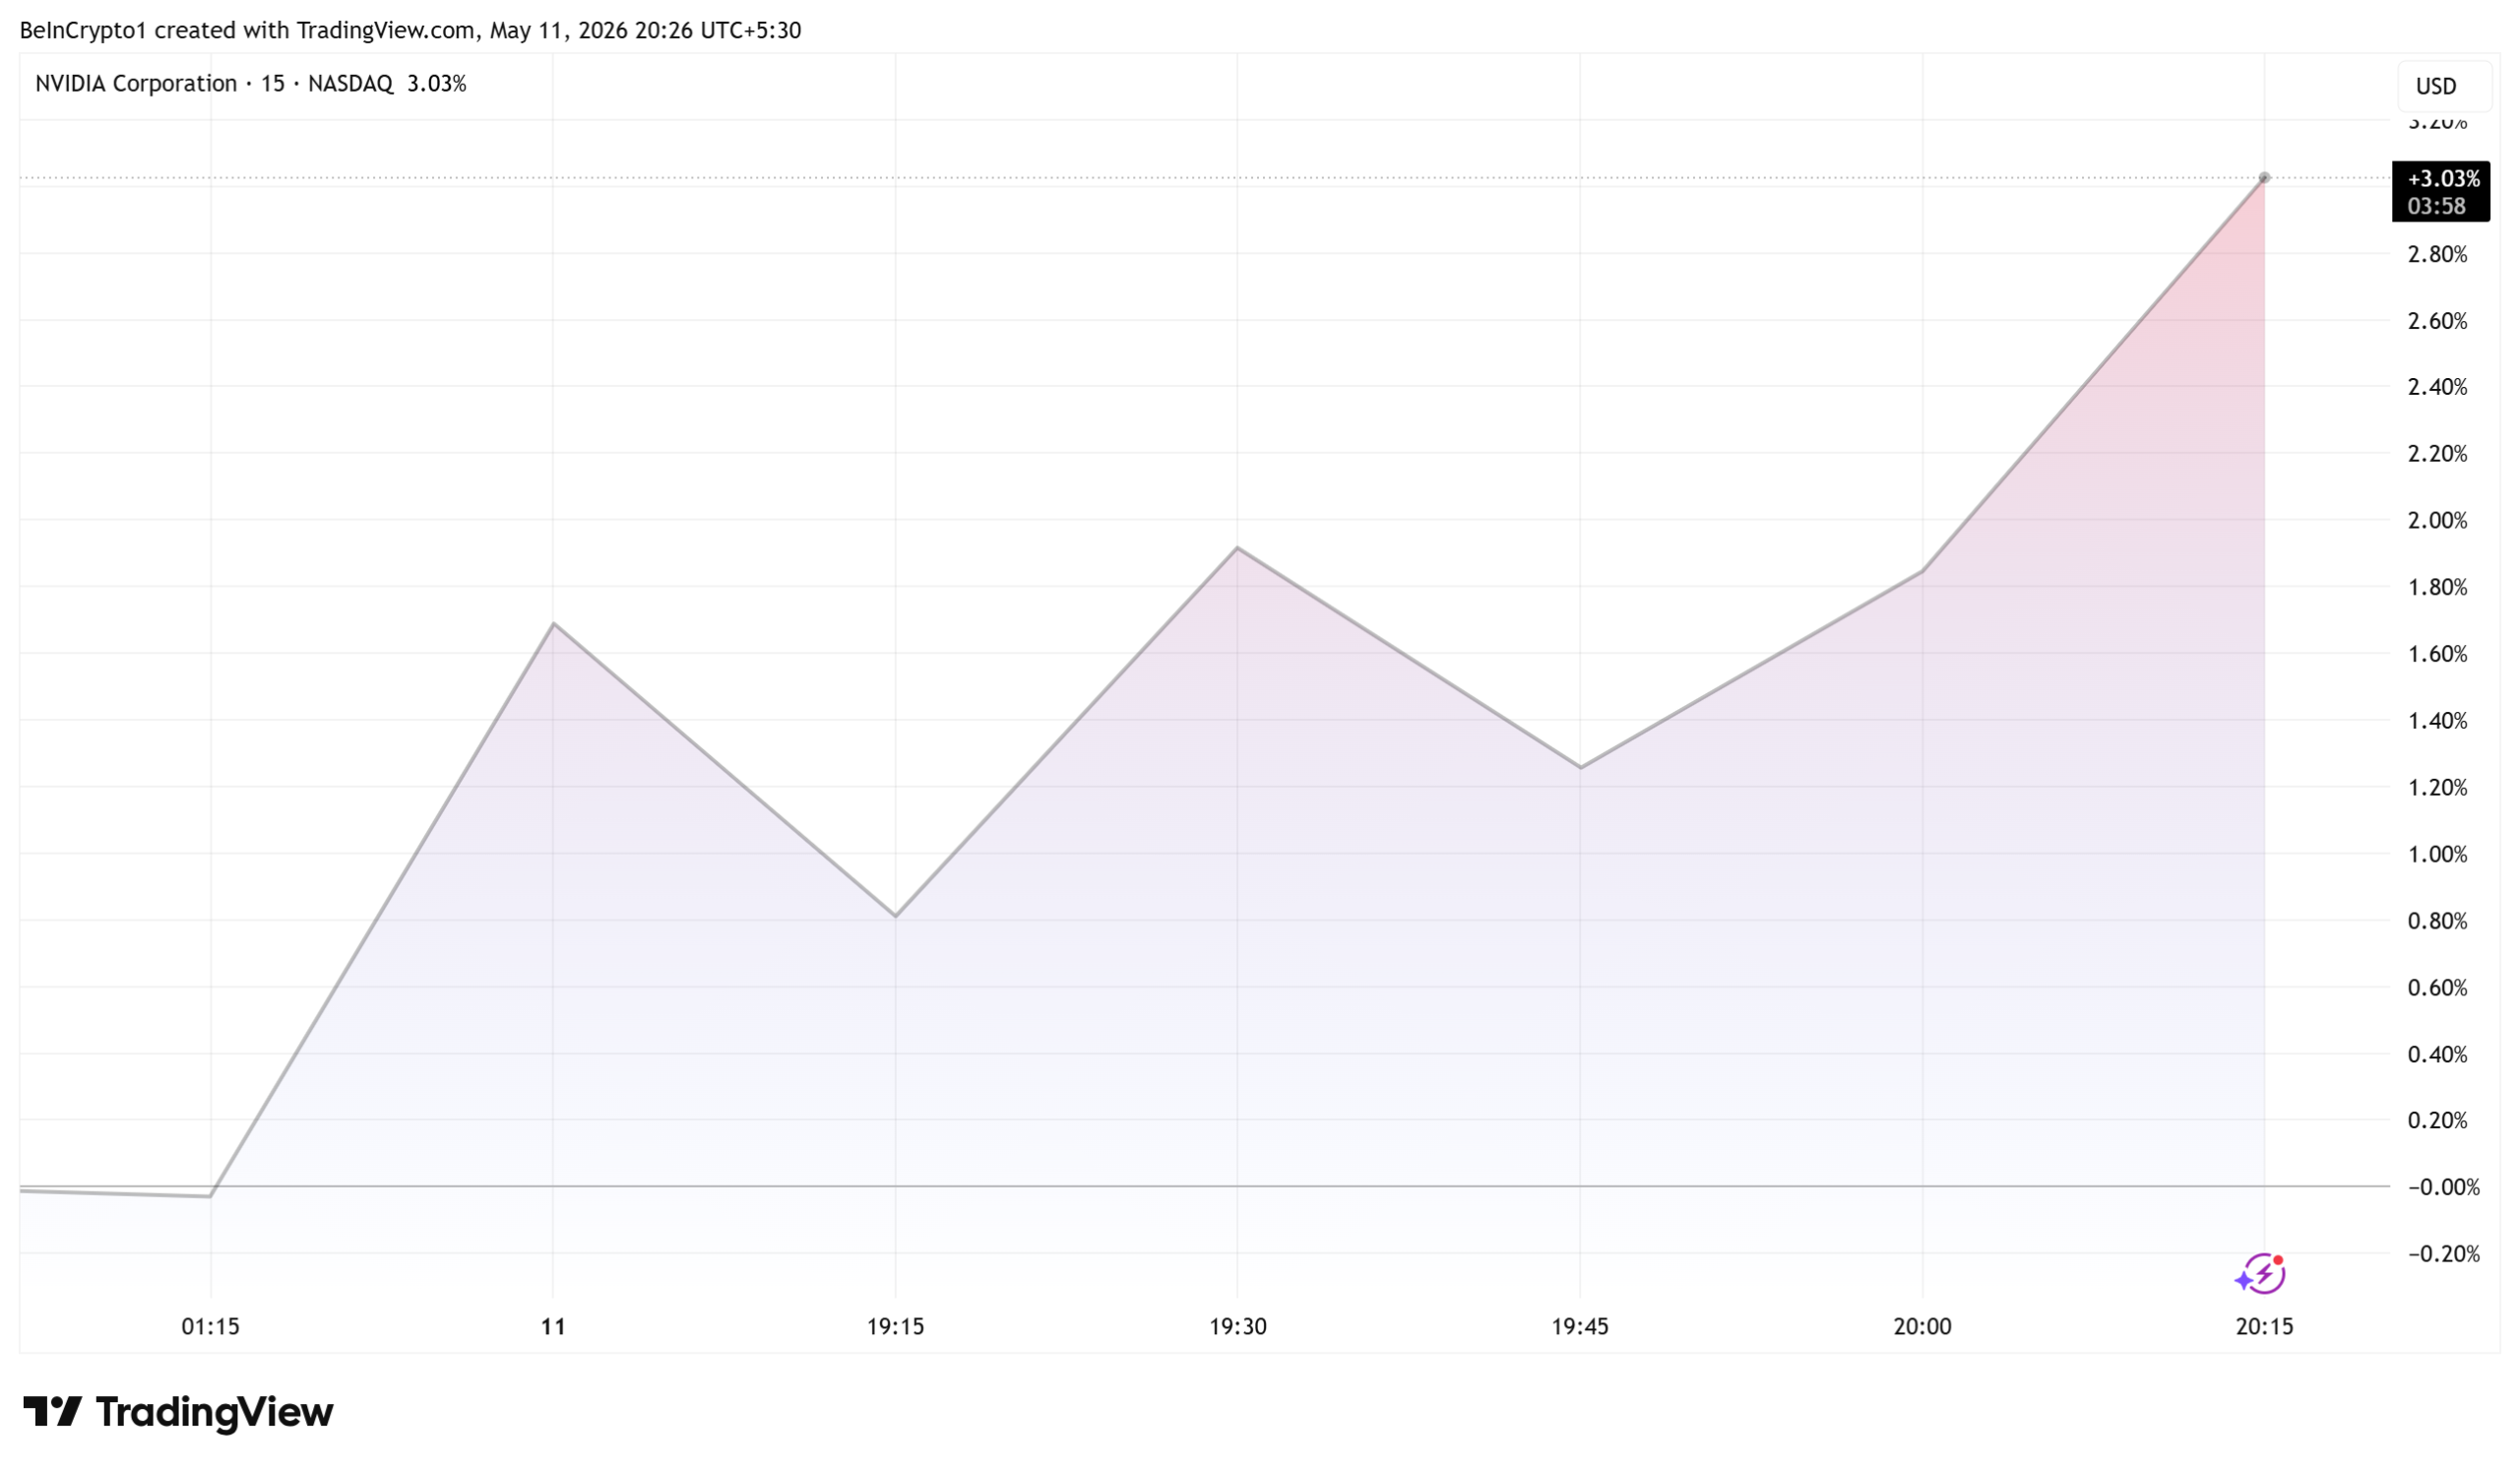
Nvidia (NVDA) shares advanced on Monday even after a “source familiar” report indicated chief executive Jensen Huang will not travel to Beijing with President Donald Trump for this week’s summit with Chinese leader Xi Jinping.
Earlier Reuters reporting named Nvidia among roughly a dozen companies invited to a trimmed CEO delegation. Trump arrives in Beijing on May 13, with formal state meetings scheduled for May 14 and May 15.
Why the Stock Shrugged Off the News
As of this writing, Nvidia’s NVDA stock was trading for $222.16, up nearly 5% on news that CEO Jensen Huang may not accompany Trump to China.

Wall Street has read the exclusion as background noise rather than a negative catalyst. Huang told investors that Nvidia’s market share for advanced AI accelerators inside China has collapsed to roughly zero under United States export restrictions.
Analyst models and current valuations already assume no meaningful revenue from restricted chips inside the country.
Nvidia stock has trailed the broader semiconductor index for weeks because of that overhang, with portfolio managers pointing to AI demand outside China as the dominant earnings lever.
A single state-visit appearance would not have changed the policy framework, which sits with the Commerce Department and Congress.
Investors likely viewed the speculation as the administration holding firm on chip controls rather than signaling concessions, a hawkish posture many funds prefer for long-term sector positioning.
“He is said to not have been invited, signaling Trump may not be willing to offer AI chip concessions in trade negotiations,” one user stated.
What Investors Are Watching Next
The CEO roster has been described as fluid in the days leading up to departure. Boeing chief Kelly Ortberg and Citigroup chief Jane Fraser are confirmed, while Qualcomm chief Cristiano Amon is expected. Others likely to go include Elon Musk and Apple’s Tim Cook.
The White House has not published a final attendee list.
Nvidia’s recent record revenue print and continued demand from hyperscale buyers remain the core bull case.
The question for holders is whether any post-summit communique touches chip export carve-outs.
Until then, AI infrastructure spending across U.S. and allied markets stays the only growth narrative investors are pricing.
The post Nvidia Stock Explodes Despite Rumors Jensen Huang Is Cut From Trump’s China Trip appeared first on BeInCrypto.


Payments firm Corpay (CPAY) add stablecoin wallets and settlement capabilities for its global corporate customers alongside BVNK to give companies another way to move money across borders outside traditional banking hours.
Teaming up with BVNK will allow Corpay clients to see stablecoin balances alongside fiat balances inside its platform, while allowing them to send, receive, store and convert stablecoins through embedded wallets.
Corpay said it will use the same stablecoin rails in its treasury operations. It expects to reduce reliance on pre-funded accounts, improve capital efficiency and make it easier to move funds across its global footprint doing so.
The firm has also added blockchain-based settlement to its cross-border payments platform through JPMorgan’s Kinexys private blockchain and BVNK’s stablecoin infrastructure. The company said the rails would be used across select corridors.
Those additions sit alongside SWIFT, Corpay’s proprietary iACH network and real-time local payment schemes. The new BVNK wallet integration brings that stablecoin functionality closer to customers.
BVNK has become one of the main firms helping payment companies add stablecoin rails. Mastercard agreed in March to buy BVNK for up to $1.8 billion, while Visa teamed up with BVNK earlier this year to support stablecoin funding and payouts through Visa Direct.
Other payment firms are taking a similar route. Stripe has been building stablecoin payments through Bridge, while Worldpay has used BVNK to offer stablecoin payouts to global businesses.
The use case is mostly operational. Stablecoins give payment firms another settlement option for liquidity movement, treasury management and cross-border transfers outside banking hours.
Stablecoin payments remain a small part of global money movement, but a growing one. Data from Visa shows that over the past 30 days, over $1.2 trillion in stablecoin transaction volume, up from $733 billion a year ago.

Bitmine Immersion Technologies has slowed the pace of accumulation of more ETH, as it’s well within its timeframe to reach the 5% supply target this year.
Nevertheless, its chairman remains highly bullish on crypto and Ethereum in particular, predicting the end of the bull market and the beginning of crypto spring.
The new press release from the firm shows that its total ETH holdings have risen to 5.21 million tokens from 5.18 million last week. This means that the firm has bought roughly 30,000 coins in the past week, which is a substantial decline from the over 100,000 in the previous few accumulation announcements.
The reason for this, according to chair Tom Lee, is that the previous pace of over 100,000 ETH per week “would have us reach 5% by mid-July.” He talks about the percentage of the asset’s total supply owned by the company he runs, which is now at around 4.3%. The company’s goal is to actually hit the coveted 5% in late 2026.
The declining buying efforts don’t mean that Lee and Bitmine are not as bullish on ETH as they were before; just the opposite.
“‘Crypto spring’ has commenced, and we wanted to highlight the importance of owning ETH as a source of diversification, and the likely drivers of this coming ‘crypto bull’ cycle. If ETH closes above $2,100 at the end of May 2026, this would be the third consecutive monthly gain – this has never been seen in a crypto bear market. Thus, a close above $2,100 would validate [that] ‘crypto spring’ has arrived.”
The company has accumulated over a million ETH since the start of 2026. In addition, its portfolio consists of 201 BTC, a $200 million stake in Beast Industries, an $88 million stake in Eightco Holdings, and total cash of $775 million.
It’s still the second-largest corporate holder of any cryptocurrency, trailing only Strategy, which increased its BTC holdings again today.
The post Tom Lee Doubles Down on ‘Crypto Spring’ Theory but Bitmine Slows ETH Accumulation appeared first on CryptoPotato.


All of a sudden, Bitcoin’s peer-to-peer communication layer for full nodes, known as its gossip channel, found four times more addresses than it did a month ago. Jameson Lopp has questioned whether somebody might be spinning up nodes for a sybil attack.
Lopp posted a concerning chart from a live network monitor on Sunday, flagging a sharp spike to 250,000 unique IP and IP-like addresses per day, after spending the prior eight years below 65,000.
The chart, maintained by a research group of the Karlsruher Institut für Technologie in Germany, tracks daily unique addresses via unsolicited ADDR messages.
ADDR and its variants, short for “address,” is a type of peer-to-peer message that Bitcoin nodes broadcast randomly to gossip about IP or IP-like addresses of full nodes with which they have established contact.
Messages sent via ADDR assist nodes with peer discovery. After connecting to a few initial nodes, new nodes during their early moments of entering the Bitcoin network randomly receive ADDR messages on an unsolicited basis, quickly learning about additional nodes.
Establishing a robust mesh empowers nodes to more efficiently broadcast and receive Bitcoin transactions and blocks.
For over eight years, the German researcher’s monitoring system found daily unique IP addresses in unsolicited ADDR messages ranging between roughly 30,000-60,000. Starting in mid-April 2026, however, it diverged sharply to the upside, reaching roughly 250,000 by early May.
A flood of new Bitcoin IP addresses
Innocuous interpretations of the data involve simple housekeeping or a sudden increase in legitimate network participation.
On the other hand, a hostile interpretation flagged preparation for a communication-based attack on Bitcoin nodes.
Lopp’s framing questioned the latter, naming the famous sybil attack as a possibility, i.e. tricking a reputation system by creating multiple, sockpuppet identities.
An eclipse attack is also a possible threat. Boston University researchers demonstrated in 2015, for example, that a Bitcoin node attacker who fills a victim’s IP address table with their own IP addresses could hijack that victim’s connections after a network restart.
Temporarily, an attacker could then feed the eclipsed node a doctored view of the blockchain.
To discourage this type of attack, Bitcoin Core software has tightened address-table bucketing and added ADDR rate limits. Still, no decentralized network is entirely impervious to all types of sybil attacks.
Sudden growth in Bitcoin ADDRs
Another possible explanation for the sudden spike in unique addresses could be surveillance.
As Protos previously documented, an entity dubbed LinkingLion spent years opening short connections to Bitcoin nodes from 812 IP addresses, possibly to record which IP first relayed each transaction for the purposes of downstream blockchain analytics.
A flood of bogus peer entries could provide useful cover for that kind of mapping work.
Moreover, anyone may start any number of Bitcoin nodes for any reason, at any time, permissionlessly. As a voluntary and open source network, there is no requirement to explain the starting or stopping of nodes, nor ADDR messages.
Nodes may also, without explanation, rotate their IP addresses at any time.
Read more: Bitcoin Core dev claimed Knots operators were inflating statistics
Another final possibility is preparation for a media campaign.
Bitcoin node operators periodically debate software features or fork proposals. The sudden spike of new IP addresses (and presumably nodes, assuming existing nodes are not simply rotating their IP addresses) might be an effort to signal support for a policy or consensus change.
In September 2025, Bitcoin developer SuperTestnet briefly suggested that 1,758 of 4,468 reachable Knots nodes were sockpuppets performing a coordinated sybil attack.
Hardware vendor Start9 then explained that up to 1,000 of those supposed sybil nodes were, in fact, regular customers purchasing equipment from its storefront. SuperTestnet retracted most of his earlier analysis.
As the educational episode demonstrated, one researcher’s sybil cluster could actually be an unremarkable product launch.
Overnight, debate among Bitcoiners about what was causing the spike remained active and ongoing.
Got a tip? Send us an email securely via Protos Leaks. For more informed news and investigations, follow us on X, Bluesky, and Google News, or subscribe to our YouTube channel.


The private token sale for Circle’s Arc blockchain was led by a16z crypto, and included BlackRock, Apollo, and Intercontinental Exchange.


The American Bankers Association (ABA) is mounting an aggressive lobbying push against portions of the Senate’s Digital Asset Market Clarity Act ahead of a scheduled Banking Committee markup on Thursday, warning lawmakers that stablecoin provisions in the updated bill could still undermine bank deposits and weaken financial stability.
In a call-to-arms circulated to bank executives nationwide, the ABA petitioned banks and their employees over the weekend to contact senators immediately to push for tighter restrictions on payment stablecoins in the crypto market structure bill. The group said the latest version of the legislation — after months of bank lobbying, meetings and input — still leaves room for crypto firms to offer interest-like rewards that may encourage consumers to move money out of traditional bank accounts.
The Senate Banking Committee is expected to release updated legislative text as soon as Monday, with comments and amendments from lawmakers likely to emerge Tuesday before Thursday’s committee vote on the Clarity Act.
“We need your help to drive this message home before senators consider this legislation,” ABA president Rob Nichols said in the request.
The ABA’s campaign follows a joint letter sent last week with other banking trade associations that outlined proposed edits to the bill. The groups argued lawmakers need to close what they describe as a loophole around stablecoin yield before advancing the legislation.
The dispute has become one of the defining battles in Washington’s crypto policy debate. Bank executives and trade groups have argued that yield-bearing stablecoins could function as substitutes for insured deposits, draining funding that banks rely on to make mortgages, business loans and other forms of credit.
Supporters of stablecoins, including many crypto firms and fintech companies, argue the products offer consumers faster payments and new ways to move money online. Critics in the crypto industry say banks are trying to preserve their dominance by limiting how digital dollar products compete for users.
“The banking cartel is in full panic mode,” U.S. Senator Bernie Moreno, an Ohio Republican who has been staunchly pro-crypto, posted on social media site X.
The fight previously delayed legislative progress, and lawmakers eventually negotiated a compromise that would prohibit stablecoin yield resembling deposit interest while allowing activity-based rewards programs similar to credit-card points. Even after those changes, major banking groups have continued pressing Congress for stricter guardrails.
While the White House Council of Economic Advisers had released an analysis on stablecoins that suggested their deployment wouldn’t damage the banking system, ABA economists answered with their own study in April. The banking group argued the administration focused on the wrong policy question by analyzing the effects of banning stablecoin yield rather than the consequences of allowing it. According to the ABA, permitting yield-bearing stablecoins could rapidly scale the market from roughly $300 billion today to as much as $2 trillion, increasing pressure on bank funding.
The longer negotiations drag on, lawmakers and industry participants warn, the harder it may become to move comprehensive crypto legislation through the Senate and onto the floor for a final vote. About 10 weeks of Senate floor time remain before the midterm elections, according to the current Senate calendar, and there are a lot of competing interests for that legislative bandwidth.
UPDATE (May 11, 2026, 14:55 UTC): Adds response from Senator Bernie Moreno.

Key takeaways
- XRP slipped below $1.50 as renewed Middle East tensions weakened broader crypto sentiment.
- XRP investment products saw nearly $40 million in inflows last week, while futures open interest climbed to $2.87 billion.
XRP tests key $1.45 support despite strong ETF and futures inflows
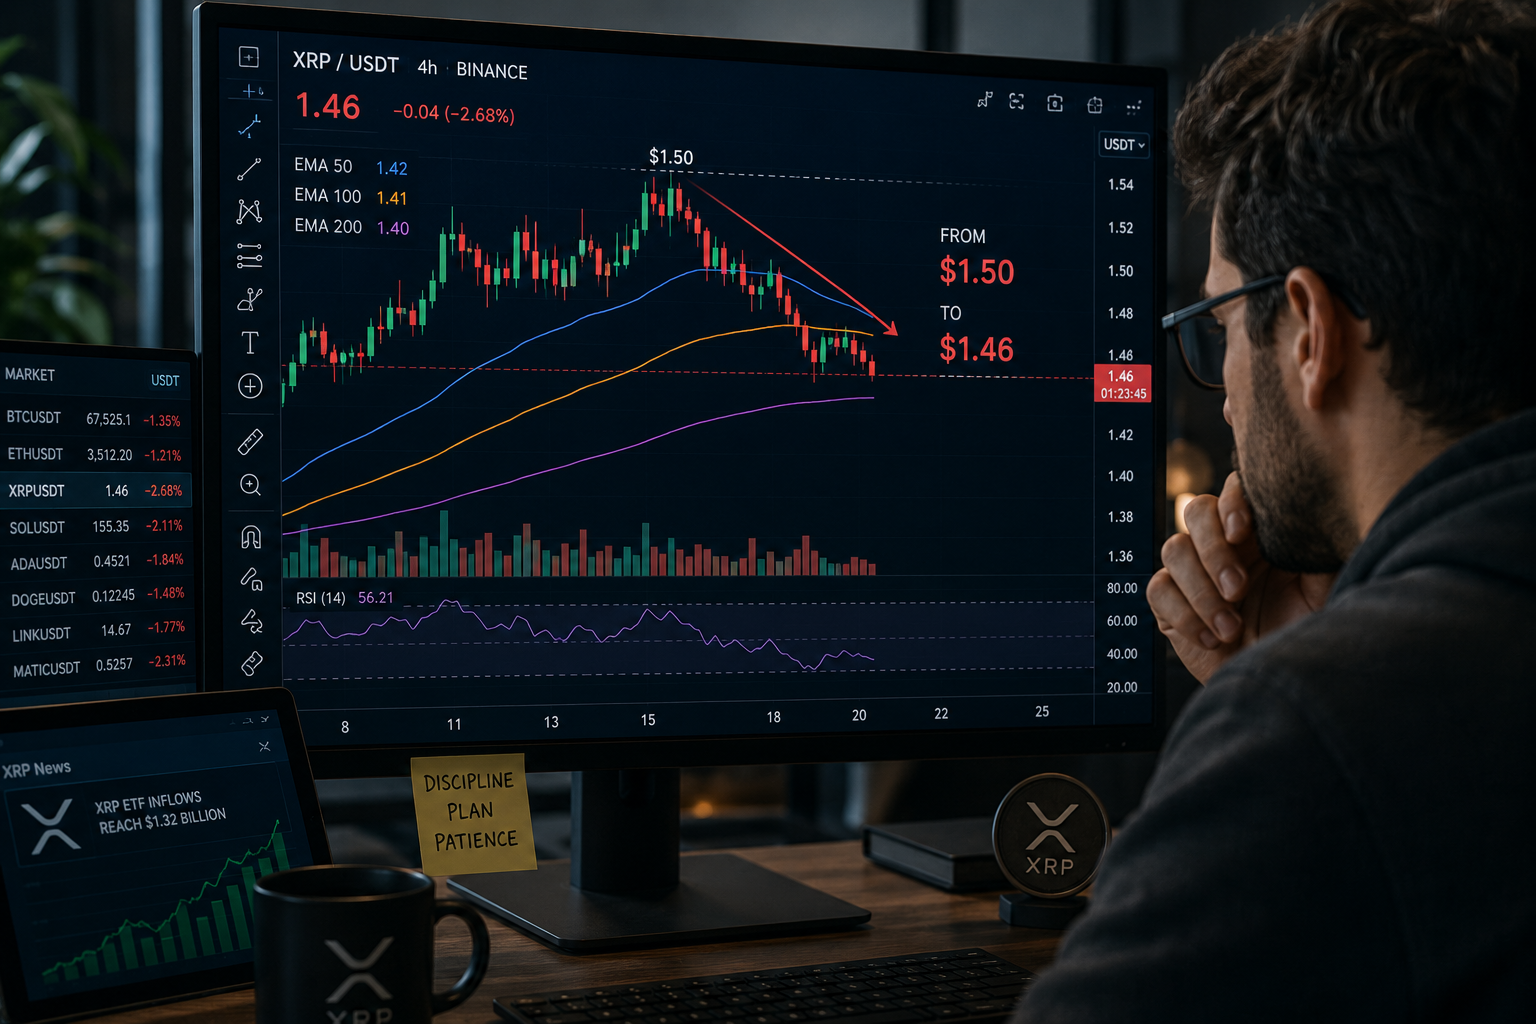
Ripple’s XRP retreated from highs near $1.50 and hovered around $1.46 on Monday as renewed geopolitical tensions in the Middle East pressured broader crypto markets and cooled recent bullish momentum.
The pullback followed comments from US President Donald Trump, who reportedly rejected Iran’s latest proposal aimed at ending the ongoing conflict in the region, calling the offer “totally unacceptable.”
The proposal included conditions tied to Iran’s sovereignty over the Strait of Hormuz alongside demands for compensation related to war damages.
Iranian Foreign Ministry spokesperson Esmail Baghaei defended the proposal, describing it as “reasonable” and “generous” for both Iran’s national interests and regional stability.
The renewed uncertainty rattled risk assets, including cryptocurrencies, which had recently rallied on hopes of a lasting ceasefire agreement between the US and Iran. XRP is up by less than 1% today as traders reassessed the broader macro outlook.
Despite the market weakness, capital inflows into XRP investment products remained resilient last week.
According to CoinShares, XRP-related digital investment products attracted nearly $40 million in inflows, with total assets under management averaging $2.5 billion, ranking fourth among crypto investment products.
Spot XRP exchange-traded funds (ETFs) accounted for approximately $34 million of those inflows, while cumulative ETF inflows climbed to $1.32 billion. Net ETF assets under management currently stand at around $1.12 billion, according to CoinGlass data.
Meanwhile, derivatives activity suggests retail traders continue positioning for further upside. XRP futures Open Interest (OI) surged to $2.95 billion from $2.65 billion a day earlier, indicating growing participation and investor conviction despite the recent pullback.
XRP technical outlook: bulls defend key EMA support zone
The XRP/USD 4-hour chart remains bullish as Ripple continues to trade above key levels. XRP is currently trading above the 50, 100, and 200 Exponential Moving Averages (EMAs) on the 4-hour chart clustered between $1.40 and $1.42, reinforcing a constructive short-term bias.
However, the $1.50 area remains a major resistance barrier after acting as a double-top ceiling during the recent rally.
Momentum indicators suggest bullish momentum is cooling rather than reversing entirely. The Relative Strength Index (RSI) remains in the high-50s, while the Money Flow Index (MFI) has eased from overbought territory, signaling a pause in buying pressure.

If the selloff persists, XRP could encounter a support level near the 50 EMA around $1.42, followed by stronger support around the 100 EMA at $1.41 and the 200 EMA near $1.40.
However, if the bulls regain control and XRP’s daily candle closes above the $1.50 resistance zone, it could pave the way for a more extended bullish move in the sessions ahead.
We fed Grok AI a carefully engineered prompt about XRP price action to find out what it predicts.
What came back was not a cautious hedge. It was a number that would make most analysts uncomfortable putting their name on.
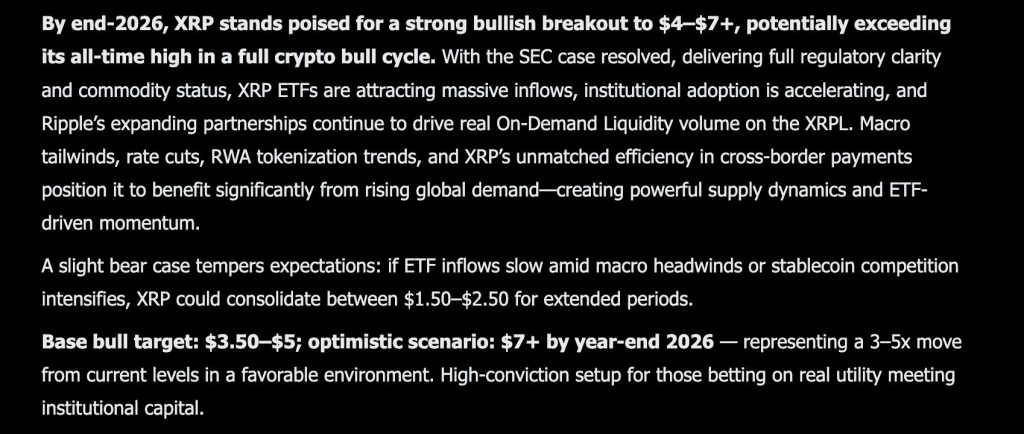
The AI did not blink. By the end of 2026, it sees XRP printing somewhere between $4 and $7, with an optimistic run potentially pushing past that entirely if the right conditions stack up.
Grok’s AI reasoning is not random. It anchors the call on 3 converging factors that are already in motion.
The SEC case is resolved, regulatory clarity no longer hangs over the asset, and XRP ETFs are now attracting real institutional money.
That alone changes the demand equation. Layer on Ripple’s expanding On-Demand Liquidity partnerships, driving actual XRPL volume, and you have utility backing the speculation rather than speculation alone.

The macro setup adds to it: rate cuts, RWA tokenization momentum, and XRP’s structural advantage in cross-border payments put it directly in the path of capital that is actively looking for somewhere to go.
The base target Grok lands on is $3.50 to $5. The optimistic scenario is $7 or higher by year-end, representing a 3 to 5x move from current levels.
That is the kind of setup that only works if institutional demand shows up consistently and ETF inflows do not stall.
The bear case is real, though. If ETF momentum slows or stablecoin competition starts eating into XRP’s payments niche, the more likely outcome is a prolonged grind between $1.50 and $2.50. Not a collapse, but not the breakout either.
The prediction is high conviction, not guaranteed.
Is Grok AI XRP Price Prediction Realistic? Here Is What the Chart Says About his Predicts
XRP is trading at $1.45 on the daily, sitting inside a descending wedge that has been tightening since the February lows around $1.20.
The pattern is textbook. Lower highs, higher lows, price coiling toward the apex. A descending wedge is a bullish reversal structure by nature, and the chart has it drawn out clearly with the breakout projection pointing toward the $3.73 area, roughly a 164% move from the current XRP USD price.
Resistance sits at $1.55 to $1.60, which is where the upper trendline of the wedge is currently pressing down.
That zone has rejected price multiple times since February, and it is the level that matters most right now. Support is $1.30, the floor that has held through every flush since the wedge formed. Lose that, and the bullish structure breaks down.
RSI on the daily is at 51.21, sitting just above the midline. That is neutral, not extended, and actually leaves room for a real move without hitting overbought territory immediately.
The signal line is tracking above at 58.08, which suggests the momentum side of the indicator is tilting bullish even if the XRP price has not confirmed yet.
The wedge breakout would need a clean daily close above $1.60 with volume behind it. If that happens, $2.00 is the first target, and the path toward Grok’s base case starts looking a lot less speculative.
Discover: The best crypto to diversify your portfolio with
Grok Projects That Bitcoin Hyper Could Outperform Them All
Some traders rotating between cycles are already looking past large caps entirely.
Bitcoin Hyper is positioning itself for that rotation. The project is building the first Bitcoin Layer 2 with Solana Virtual Machine integration, claiming sub-Solana latency while keeping Bitcoin’s security layer intact. Fast, low-cost smart contracts on Bitcoin without abandoning its trust model. That is a gap neither Ethereum nor Solana fills directly.
The presale has raised $32 million at $0.013679 per token with high APY staking available for early participants.
The risk profile is different here. Higher upside potential, earlier entry, and significantly more execution risk than anything trading on major exchanges. That tradeoff is the whole point.
The post Elon Musk New Grok AI Predicts the Price of XRP by The End of 2026 appeared first on Cryptonews.

Key takeaways
- Solana surged nearly 15% last week as spot SOL ETFs attracted $39.23 million in inflows — the strongest since January.
- Solana surged nearly 15% last week as spot SOL ETFs attracted $39.23 million in inflows — the strongest since January.
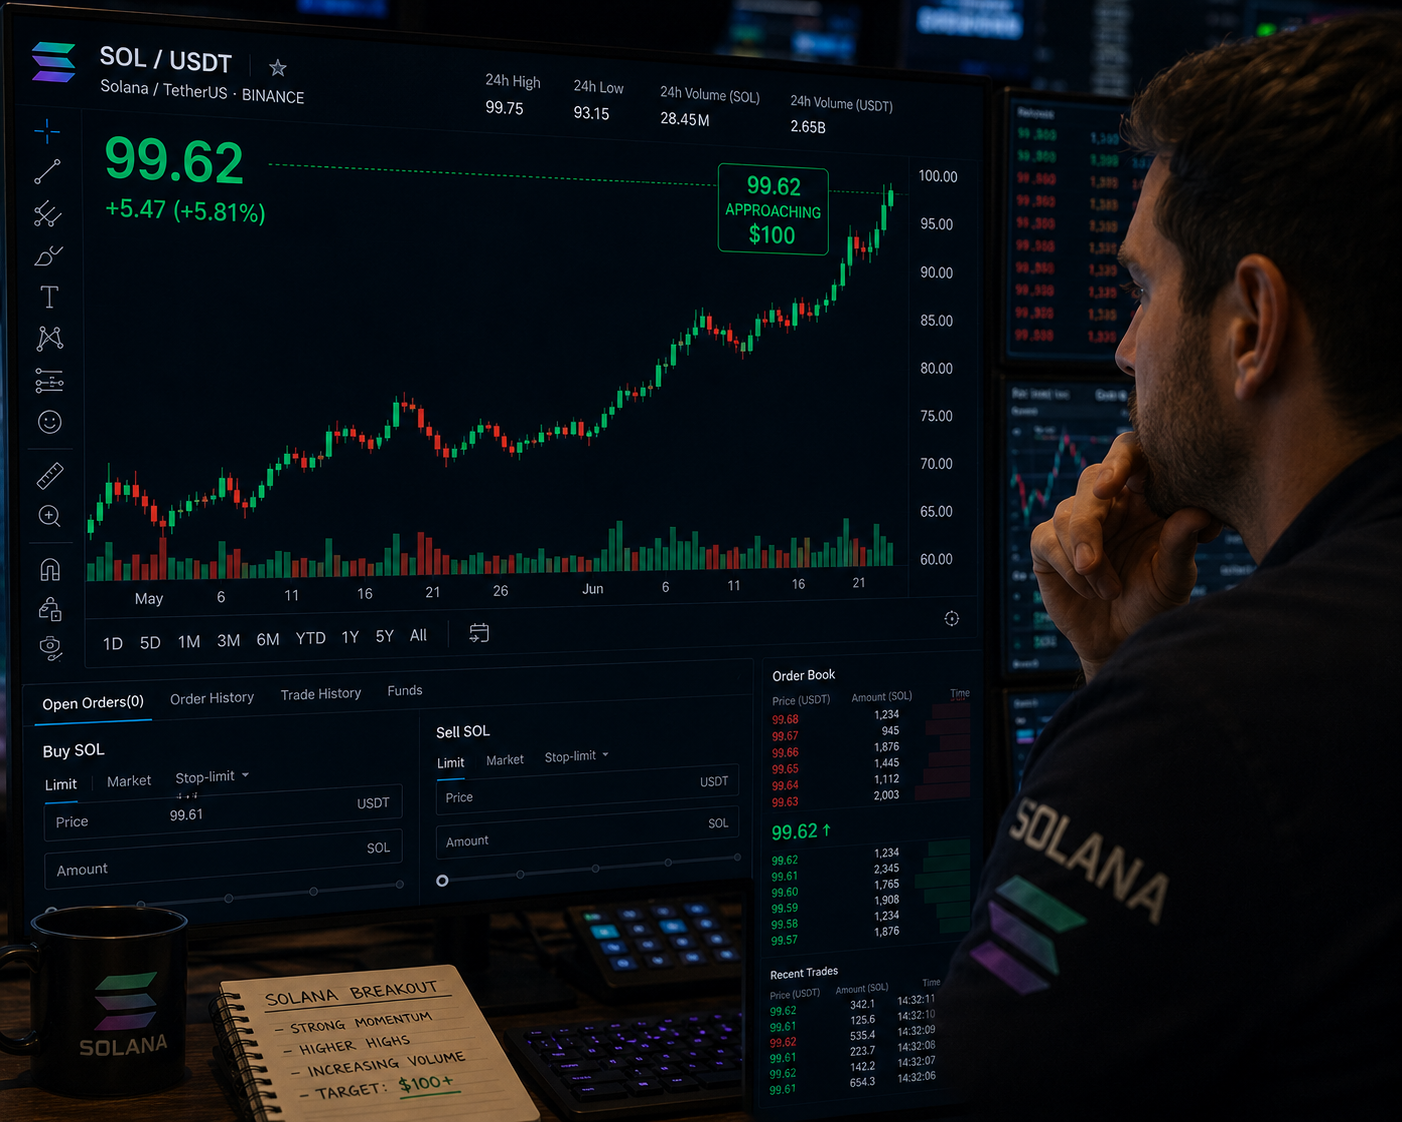
Solana (SOL) is trading just above $95 on Monday after rallying nearly 15% over the past week, with bullish momentum supported by strong institutional demand, improving on-chain activity, and rising derivatives participation.
Institutional demand pushes SOL above $90
Institutional appetite for Solana strengthened sharply last week, with spot Solana Exchange Traded Funds (ETFs) recording net inflows of $39.23 million, according to CoinGlass data.
The figure marked the strongest weekly inflow since mid-January, signaling renewed investor confidence in the asset. Continued inflows could provide additional upside support for SOL in the near term.
On-chain and derivatives metrics also point to a constructive outlook. CryptoQuant data indicates cooling conditions across both spot and futures markets while showing buy-side dominance in futures activity — a combination that often precedes further upside.
Although several metrics remain neutral, overall sentiment has improved considerably compared to previous weeks.
In the derivatives market, Solana’s funding rates turned positive on Sunday before climbing to 0.0067% on Monday, showing that long traders are now paying shorts to maintain positions.
Historically, similar flips from negative to positive funding rates have coincided with strong upward price moves for SOL.
Open Interest (OI) in Solana futures has also surged. CoinGlass data shows total OI rising to $6.46 billion on Monday from $4.83 billion on May 5.
The steady increase since early May suggests fresh capital continues to enter the market, reinforcing bullish momentum and signaling growing trader participation.
Solana technical forecast: Bulls target the $100 psychological level
The SOL/USD 4-hour chart is bullish thanks to Solana’s recent rally. SOL is now trading above both the 100-day Exponential Moving Average (EMA) at $93.87 and the 50-day EMA at $87.51, strengthening the bullish case.
Momentum indicators also remain supportive. The Relative Strength Index (RSI) sits at 69, reflecting strong but not yet overextended momentum.
Meanwhile, the Moving Average Convergence Divergence (MACD) indicator remains firmly positive and continues to rise.
If the rally persists, immediate resistance is seen near the 38.2% Fibonacci retracement level at $98.53.
A daily candle close above this resistance could open the door toward the $108.12–$110.62 range, where the 50% retracement level and the 200-day EMA converge.
Additional resistance levels stand near $117.71 and $120.00, while an extended rally could target the 78.6% retracement level around $131.35.

However, if the market undergoes a correction, immediate support sits near the former channel resistance around $92.11, followed by the 100-day EMA at $93.87 and the 50-day EMA at $87.52.
Losing these levels could expose the support near $86.67, while deeper pullbacks could revisit the channel floor around $77.12 and the broader cycle low area near $67.50.

Want Driving Simulator Feedback? Make The Robot Do It
Family pay tribute to ‘loving father’ who died in crash with lorry
Crypto and AI Could Be Dirty Words on 2026 Campaign Trail
Manchester United reach agreement with Casemiro over contract clause amid transfer speculation

US brings back mandatory military draft registration

Steven Gerrard disagrees with Gary Neville over ‘shock’ Chelsea and Arsenal claim | Football


-
 Crypto World3 days ago
HarrisX Poll Found 52% of Registered Voters Support the CLARITY Act
-

 Fashion3 days ago
Weekend Open Thread: Marianne Dress
-

 Crypto World4 days ago
Upbit adds B3 Korean won pair as Base token gains Korea access
-

 Tech7 days ago
Image AI models now drive app growth, beating chatbot upgrades
-
 NewsBeat4 days ago
NCP car park operator enters administration putting 340 UK sites at risk of closure
-

 Tech1 day ago
Auto Enthusiast Carves Functional Two-Stroke Engine from Solid Metal
-

 Politics2 days ago
Politics Home Article | Starmer Enters The Danger Zone
-
 Business2 days ago
Ignore market noise, India’s long-term story intact, say D-Street bulls Ramesh Damani and Sunil Singhania
-

 Crypto World6 days ago
UAE Free Zone Deploys Blockchain IDs to Verify Registered Firms
-

 Tech9 hours ago
GM Agrees To Pay $12.75 Million To Settle California Lawsuit Over Misuse Of Customers’ Driving Data
-

 Crypto World4 days ago
Robinhood says Wall Street is building onchain
-

 Crypto World5 days ago
BlackRock CEO Larry Fink Discusses a New Asset Class
-
Entertainment7 days ago
Serena Williams hits Met Gala in metallic dress after GLP-1 reveal
-

 Tech6 days ago
Apple and Samsung are dominating smartphone sales so thoroughly that only one other company makes the top 10
-

 Tech5 days ago
I tested the Xiaomi 17 Ultra’s camera and I don’t think I’ll ever go back to an iPhone
-

 Politics6 days ago
Met Gala 2026: Madonna’s Dramatic Red Carpet Look Steals The Show
-

 Fashion5 days ago
The Best Work Pants for Women in 2026
-
 Tech4 days ago
AI agents are missing all the discussions your team is having. SageOX has an answer: agentic context infrastructure
-
 Sports7 days ago
Everton v Man City LIVE: Haaland’s two-word response as visitors collapse to hand Arsenal advantage in Premier League title race
-
Crypto World4 days ago
The FOMO Is Back: Why Bitcoin’s Latest Rally Has Analysts Flashing Warning Signs
You must be logged in to post a comment Login