
Crypto World
BTC price retreats from monthly high as overbought conditions persist: Crypto Markets Today


Bitcoin consolidated Tuesday after hitting $76,000, the highest level since Feb. 4, in early trading. The largest cryptocurrency fell back to just below $73,500, down 1.5% since midnight UTC.
It’s not the only cryptocurrency to have cooled. Ether (ETH) lost 1.5%, solana (SOL) dropped by 2.5% and 4.5%.
Nasdaq 100 and S&P 500 futures, in contrast, rose by 0.6% despite oil trading above $100 per barrel and the war in Iran continuing to rage.
Despite the decline in crypto markets, the average relative strength index (RSI) remains firmly in “overbought” territory, suggesting further drops toward $72,000 may be on the cards.
However, such a move would resemble a period of consolidation after bitcoin rose by more than 15% from $65,000 since March 8.
A bounce between $72,000 and $74,000 would indicate a fresh level of support being formed, potentially serving as a platform for an ascent to above $80,000.
Derivatives positioning
- Bitcoin futures open interest (OI) has increased 2% to a three-week high of 685.2K BTC. This, coupled with positive cumulative volume delta (CVD), indicates a bias for bullish long bets.
- Ether’s futures activity also exhibits bitcoin-like bullishness.
- SOL’s market is flashing mixed signals. An upswing in OI is accompanied by negative funding rates and near-zero CVD, indicative of a bearish tinge.
- ADA and BCH stand out with slight declines in OI, a sign of capital outflows.
- Options traders seem more bearish on bitcoin than ether. On Deribit, bitcoin puts expiring in the near-term trade at a greater premium to calls than ether puts.
- Volatility strategies such as straddles dominated bitcoin block flows. Ether traders chased call spreads and straddles.
- In BTC’s case, two of the most popular options positions are the $60,000 put and the $75,000 call. Volatility picked up early Tuesday as prices neared $75,000.
Token talk
- The altcoin market suffered a deeper pullback than the major cryptocurrencies since midnight, with some corners of the market dropping more than 5% after a ferocious rally on Monday.
- CoinMarketCap’s “altcoin season” indicator remains at 49/100 — its highest point since the turn of the year — reflecting risk-on altcoin sentiment.
- The U.S. president-themed memecoin TRUMP lost more than 6% of its value over the past 24 hours as traders locked in profits from last week’s “gala luncheon” announcement.
- There was a similar tumble for pepe (PEPE) after the frog-themed memecoin led the broader crypto market with a move to the upside on Monday.
- The CoinDesk Memecoin Index (CDMEME) has been the worst performing benchmark over the past 24 hours, losing around 1% while the CoinDesk 80 (CD80), an index made up of a wide array of altcoins, is up by 1.35%.

Crypto World
Risk assets surge in pre-market trading as cease fire drives gains across crypto and equities


Bitcoin climbed to as high as $72,750 following news of a two-week ceasefire between the U.S. and Iran, before easing back to just below $72,000.
The move came alongside a broader risk on rally in pre-market trading for equities, with the Invesco QQQ gaining more than 3.3% and the iShares Expanded Tech Software ETF (IGV) posting similar strength. Gold also moved higher, rising over 2% to $4,800 per ounce.
In contrast, oil markets sold off sharply. WTI crude dropped to $92 before rebounding to $96 per barrel, still down more than 12.5%, while Brent crude is lower by over 7.5% in the past 24 hours.
Volatility has compressed across both traditional and crypto markets. The VIX is down 20%, while the Bitcoin Volmex Implied Volatility Index (BVIV) has fallen more than 6% to 46, pointing to calmer conditions.
Crypto-linked equities are also advancing, with Strategy (MSTR), Galaxy Digital (GLXY), Coinbase (COIN) and Circle (CRCL) all showing healthy gains in pre-market trading. Similarly. AI and HPC data centre firms such as IREN (IREN) and Cipher Digital (CIFR) have gained 7% and 9%, respectively.
Bond markets have stabilised, with the U.S. 10-year Treasury yield falling 1.5% to 4.2%.

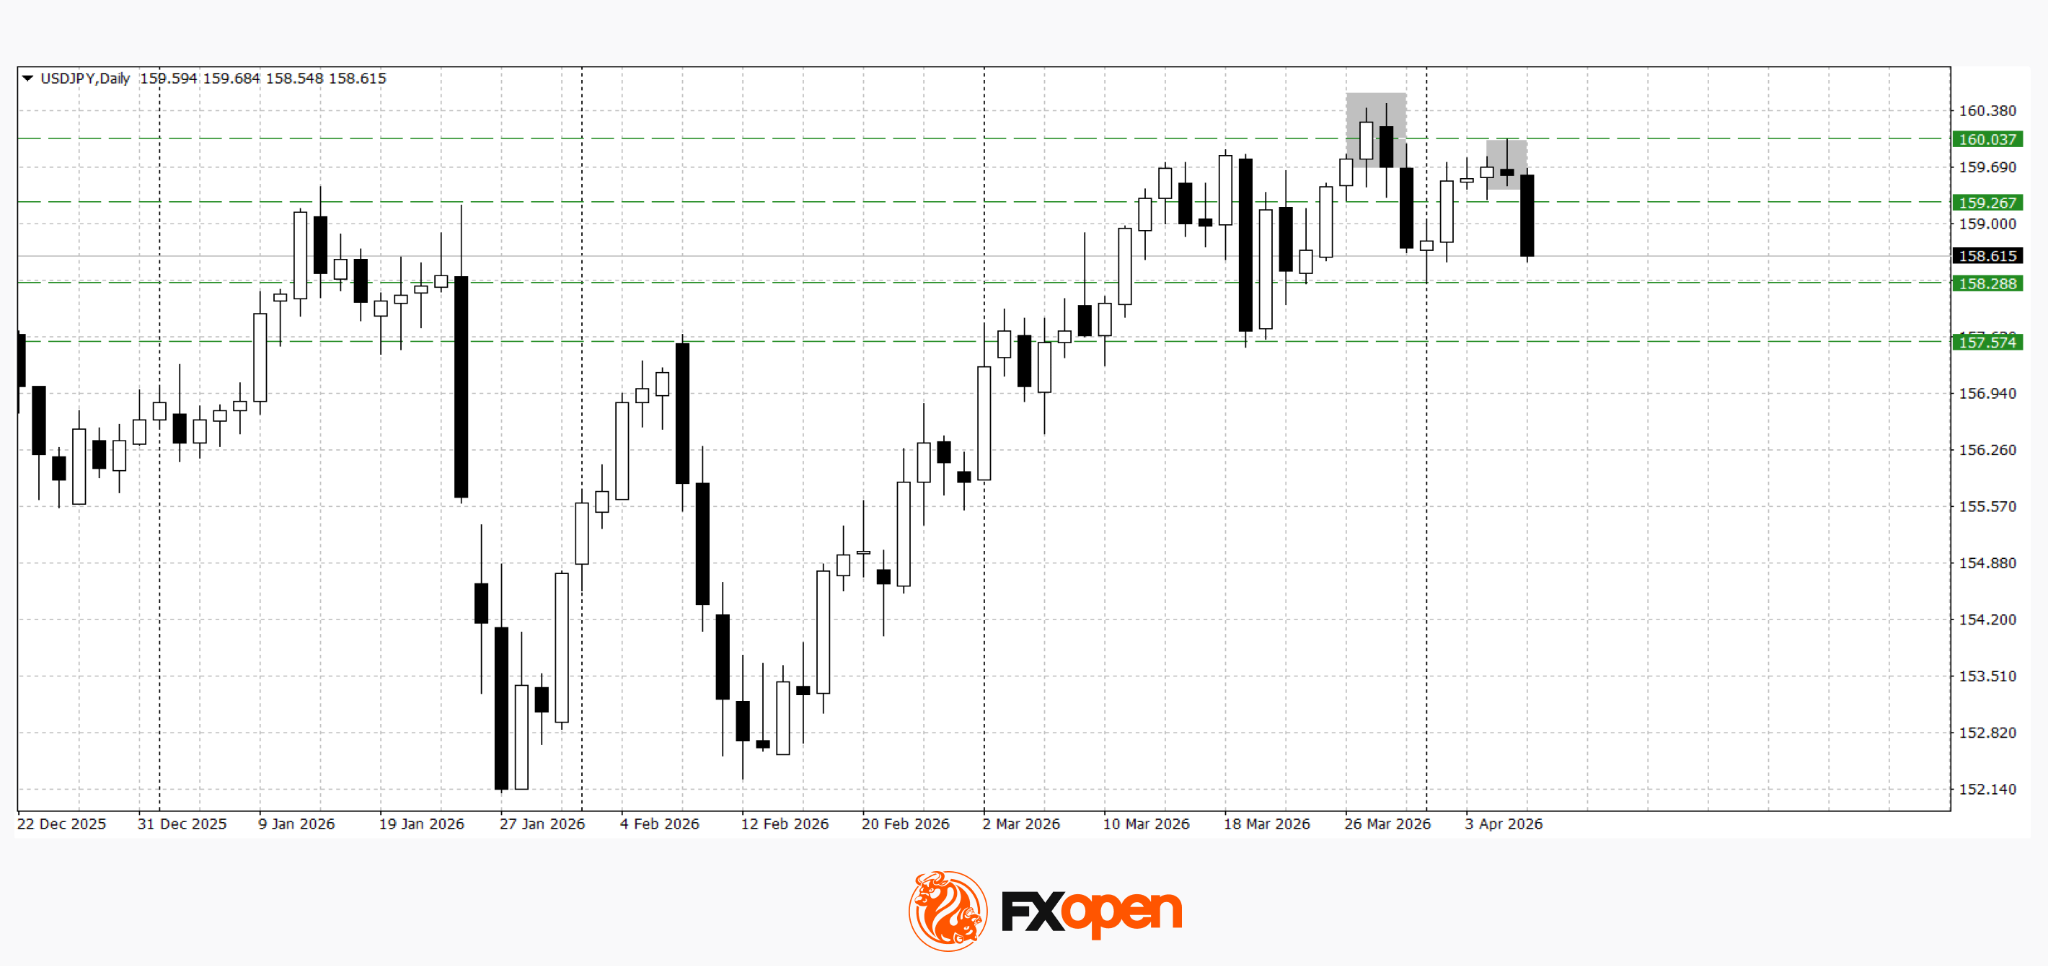
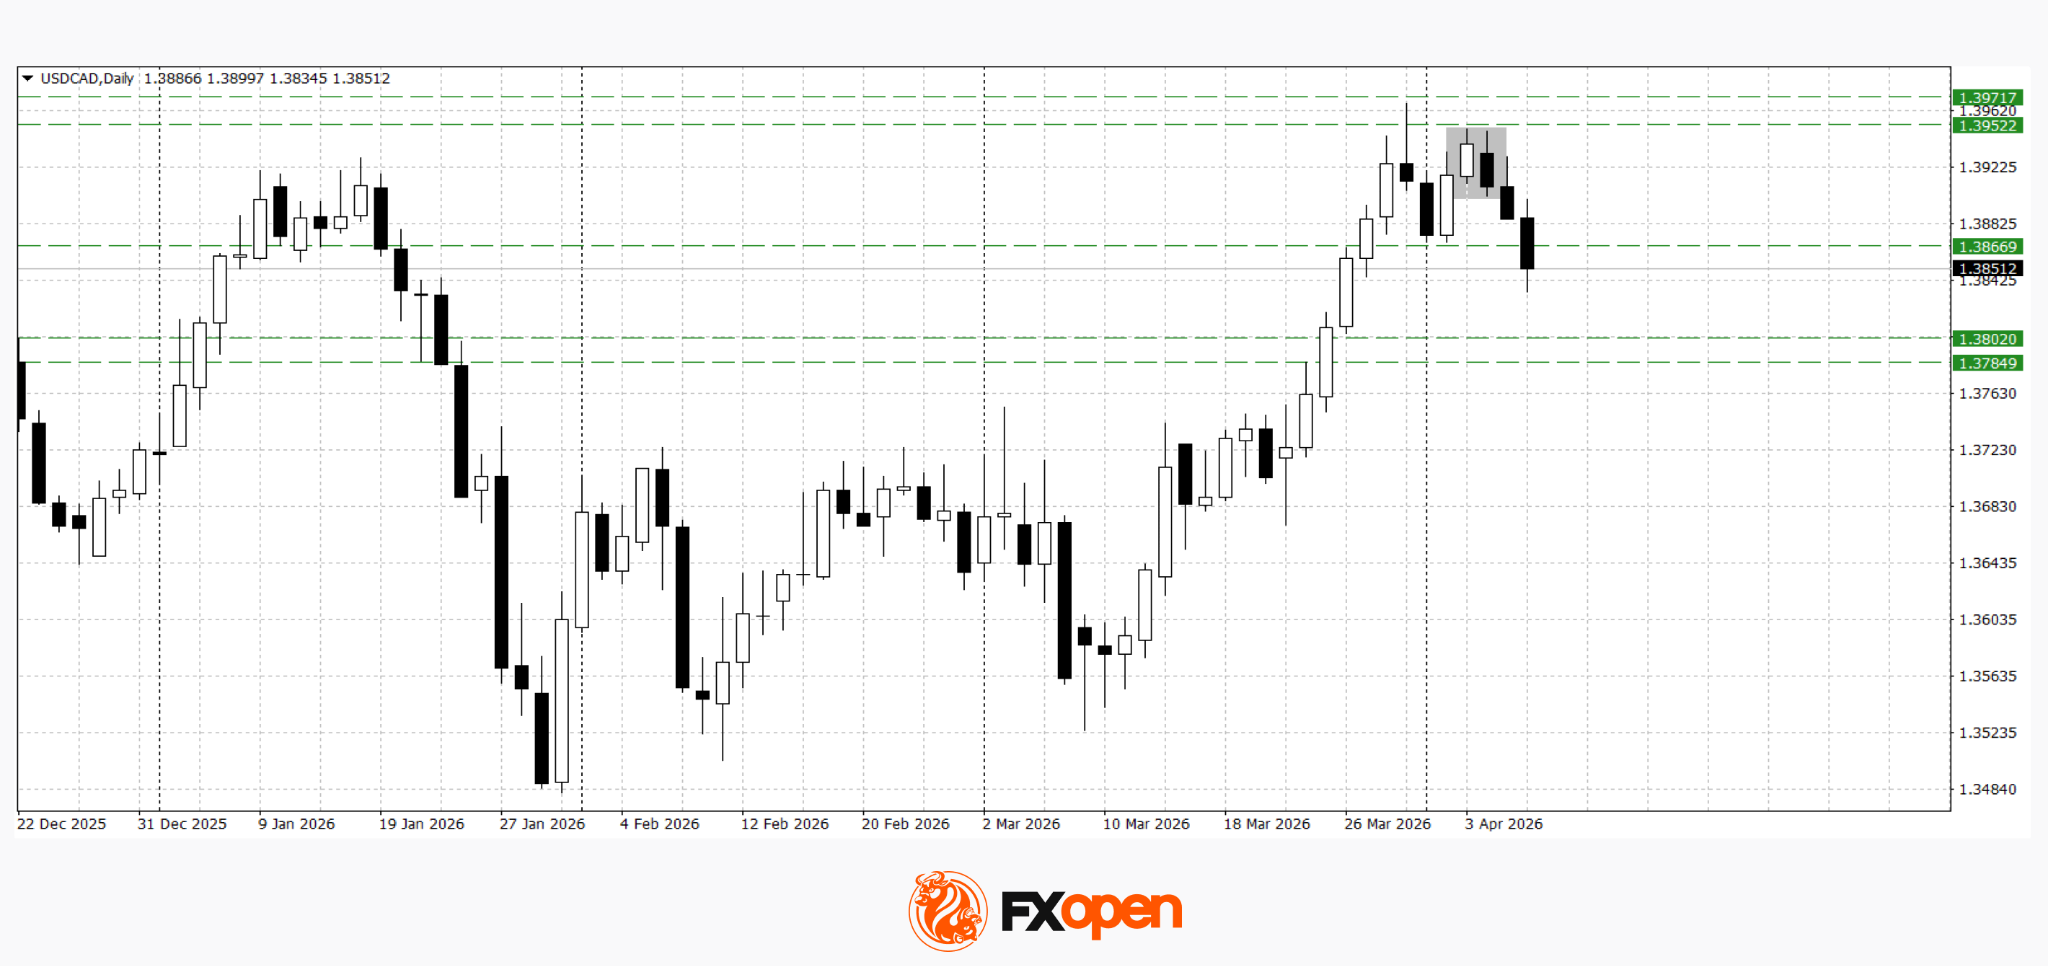
The US dollar has shifted into a corrective phase following its previous rally, while market participants adopt a wait-and-see approach ahead of the release of the Federal Reserve’s meeting minutes. The weakening of the dollar has already led to a moderate pullback in USD/JPY and USD/CAD from recent highs, reflecting profit-taking and reduced activity ahead of a key event.
An additional factor influencing the market remains geopolitical tensions, which continue to affect global financial flows. Fluctuations in energy prices and persistent escalation risks are limiting the formation of устойчивых trends, increasing the dependence of currency pairs on incoming macroeconomic data.
Today, investor focus will be on the Federal Reserve minutes, which may help clarify the regulator’s stance on the future path of interest rates. The market will assess the tone of policymakers’ comments, particularly the balance between inflation risks and signs of economic slowdown. Depending on the tone, the market may either extend the dollar’s corrective move or revive demand for the US currency.
USD/JPY
Following a test of the key psychological resistance level at 160.00, USD/JPY has formed an “evening star” candlestick pattern. Technical analysis suggests a potential continuation of the downward correction if the pair holds below 159.20. If buyers manage to secure a move above 160.00, a retest of the yearly highs may follow.
Key events for USD/JPY:
- Today at 14:00 (GMT+3): US Mortgage Market Index
- Today at 21:00 (GMT+3): FOMC Minutes
- Today at 21:35 (GMT+3): Speech by Fed’s Christopher Waller
USD/CAD
USD/CAD has formed a “dark cloud cover” pattern after a repeated test of the 1.3950 level. If the pair consolidates below 1.3880, the decline may extend towards 1.3780–1.3800. A break above 1.3970 would invalidate the bearish scenario.
Key events for USD/CAD:
- Today at 13:00 (GMT+3): Canada Leading Economic Index
- Today at 17:30 (GMT+3): US Crude Oil Inventories
- Today at 18:00 (GMT+3): Canada Thomson Reuters/Ipsos PCSI
The market remains in a corrective and anticipatory phase ahead of the release of the FOMC minutes. The current weakening of the dollar may continue if the Fed adopts a softer tone, while more hawkish signals could restore demand for the US currency and limit the extent of the pullback.
Trade over 50 forex markets 24 hours a day with FXOpen. Take advantage of low commissions, deep liquidity, and spreads from 0.0 pips (additional fees may apply). Open your FXOpen account now or learn more about trading forex with FXOpen.
This article represents the opinion of the Companies operating under the FXOpen brand only. It is not to be construed as an offer, solicitation, or recommendation with respect to products and services provided by the Companies operating under the FXOpen brand, nor is it to be considered financial advice.

Fresh on-chain analytics show that three newly created wallets pocketed a combined $484,575 from Polymarket’s “US x Iran ceasefire by April 7” market, intensifying scrutiny over insider trading risks in prediction markets. Lookonchain highlighted that these wallets had no prior on-chain activity before placing their bets, suggesting rapid, opportunistic participation around a geopolitical event that drew intense attention.
Polymarket’s public activity feed confirms the three profits—$200,525, $158,600 and $125,450—were realized as trading continued during the period around the ceasefire news. The bets were placed at modest odds, with “yes” positions priced between roughly 2.9% and 10.3%. The payout occurred after the United States and Iran agreed to a two-week ceasefire on Tuesday, though both sides left room for the possibility of renewed action. The timing of the trades is notable: the earliest bet was placed at 1:59 pm UTC on Tuesday, roughly eight and a half hours before a Truth Social post by President Donald Trump at 10:32 pm UTC confirming a ceasefire. The other two positions opened at 10:01 am UTC on Tuesday and 8:50 pm UTC on Monday, according to blockchain-trace data.
The sequence of bets and the subsequent payout underscore a broader conversation about how prediction markets operate during geopolitical flux. As the market settled on a ceasefire timeline, participants with little or no on-chain history reportedly benefited significantly, prompting questions about information asymmetry, liquidity, and whether such patterns reflect legitimate hedging strategies or exploitative activity. While the event resolved into a temporary pause in hostilities, the underlying dynamics have sparked ongoing debate about how to monitor and regulate speculative markets tied to real-world events.
Prediction markets have emerged as a rapidly expanding niche within the crypto landscape. Industry observers note that prediction markets have become one of the fastest-growing uses for crypto, often surpassing $10 billion in monthly trading volume. The trend has drawn attention from policymakers who worry about insider trading and market manipulation that could undermine market integrity and consumer trust.
Key takeaways
- Three new Polymarket wallets earned a combined $484,575 from the US x Iran ceasefire by April 7 market, with wallets showing no prior on-chain activity before placing bets.
- The profits break down as $200,525, $158,600 and $125,450, with yes bets priced between 2.9% and 10.3% odds.
- One trader placed the first bet at 1:59 pm UTC on Tuesday—about eight and a half hours before the ceasefire confirmation—while the others opened at 10:01 am UTC Tuesday and 8:50 pm UTC Monday, according to on-chain records.
- Prediction markets continue to attract high volumes (often exceeding $10 billion per month), but they face increasing regulatory scrutiny and calls for stronger market-surveillance measures.
- Polymarket and Kalshi have started implementing safeguards to deter insider trading, including Kalshi’s independent advisory committee and a partnership with Solidus Labs for market abuse detection.
Geopolitics, markets and the regulatory glare
The episode sits at the intersection of rapid geopolitical news, crypto trading innovation and regulatory pushback. In January, U.S. lawmakers introduced a bill to curb officials from trading on prediction platforms after a Polymarket user reportedly profited more than $400,000 on a market tied to Nicolás Maduro. The proposal aims to reduce potential conflicts of interest and information leakage in sensitive bets, highlighting how policy makers view prediction markets as both open financial experiments and potential governance risks.
Meanwhile, international authorities have pursued legal action against traders seen as abusing information channels. In February, Israeli authorities arrested and indicted two individuals for allegedly using confidential information to place bets on a Polymarket event related to Israel’s potential strike on Iran, with one suspect reportedly connected to the Israeli military. These cases emphasize the stakes for traders and platforms alike, and they have spurred exchanges to bolster their surveillance and compliance programs.
To address the risk of market abuse, Polymarket has pursued ongoing improvements in oversight, while Kalshi has taken notable steps. Kalshi announced the formation of an independent advisory committee and a collaboration with Solidus Labs to enhance detection and investigation of market abuse. These measures are part of a broader push across prediction markets to balance innovation with responsible governance and user protection.
As coverage of these developments has shown, the debate over how to regulate prediction markets is shaping product design and market structure. Regulators are weighing how to preserve legitimate hedging and information discovery functions while curbing manipulation and unfair advantages. For traders and developers alike, the question now is how quickly platforms can operationalize robust surveillance without stifling legitimate participation or curtailing beneficial liquidity.
In the meantime, industry observers and investors will watch how policymakers translate sentiment into concrete guidance. The evolving regulatory backdrop, coupled with high-profile insider-trading concerns, could influence where liquidity flows, which markets gain credibility, and how quickly new participants ramp up their activity in this niche of crypto markets.
As the sector digests these developments, watchers should keep an eye on public disclosures from prediction-market platforms, updates to anti-manipulation tooling, and any new legislation or regulatory guidance that could shape how users access and interact with event-based markets in the months ahead.
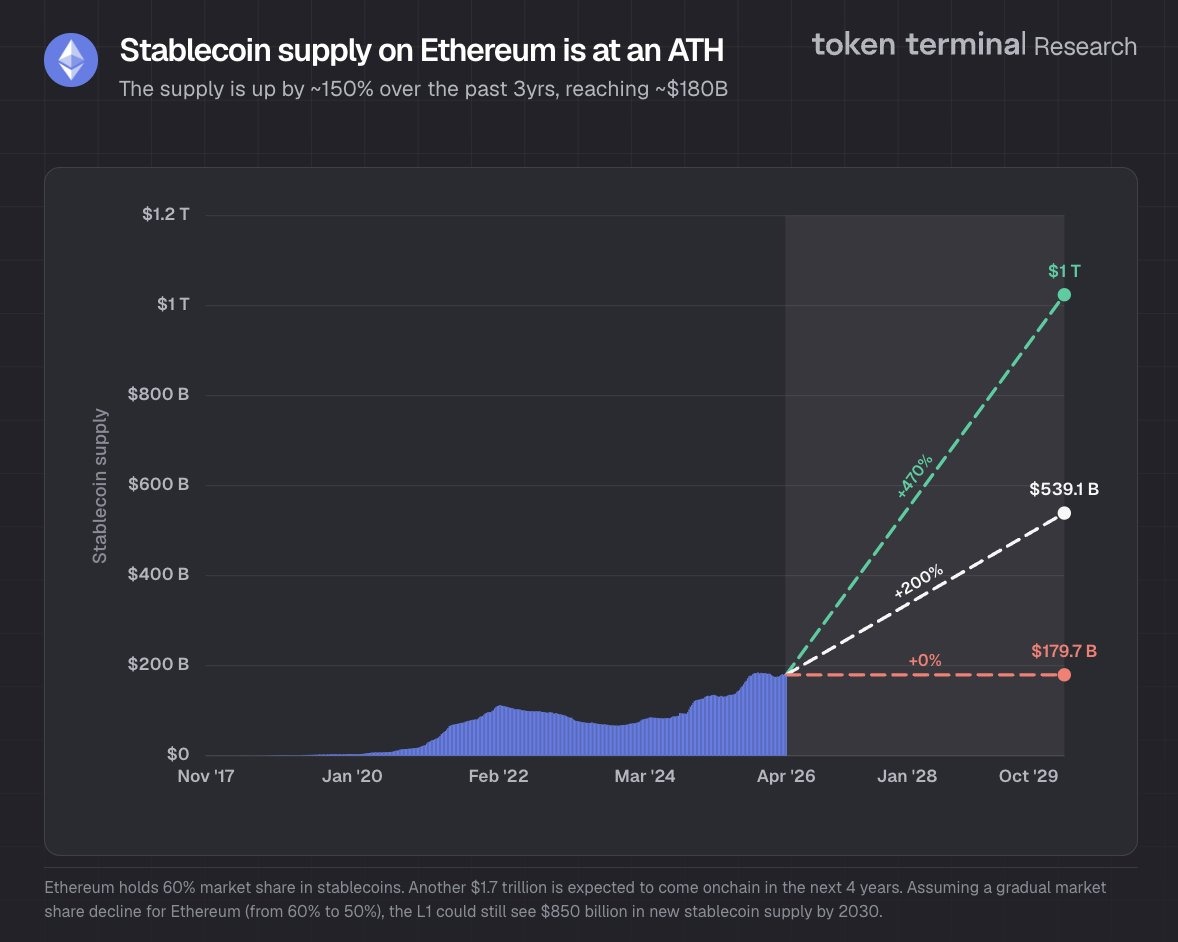
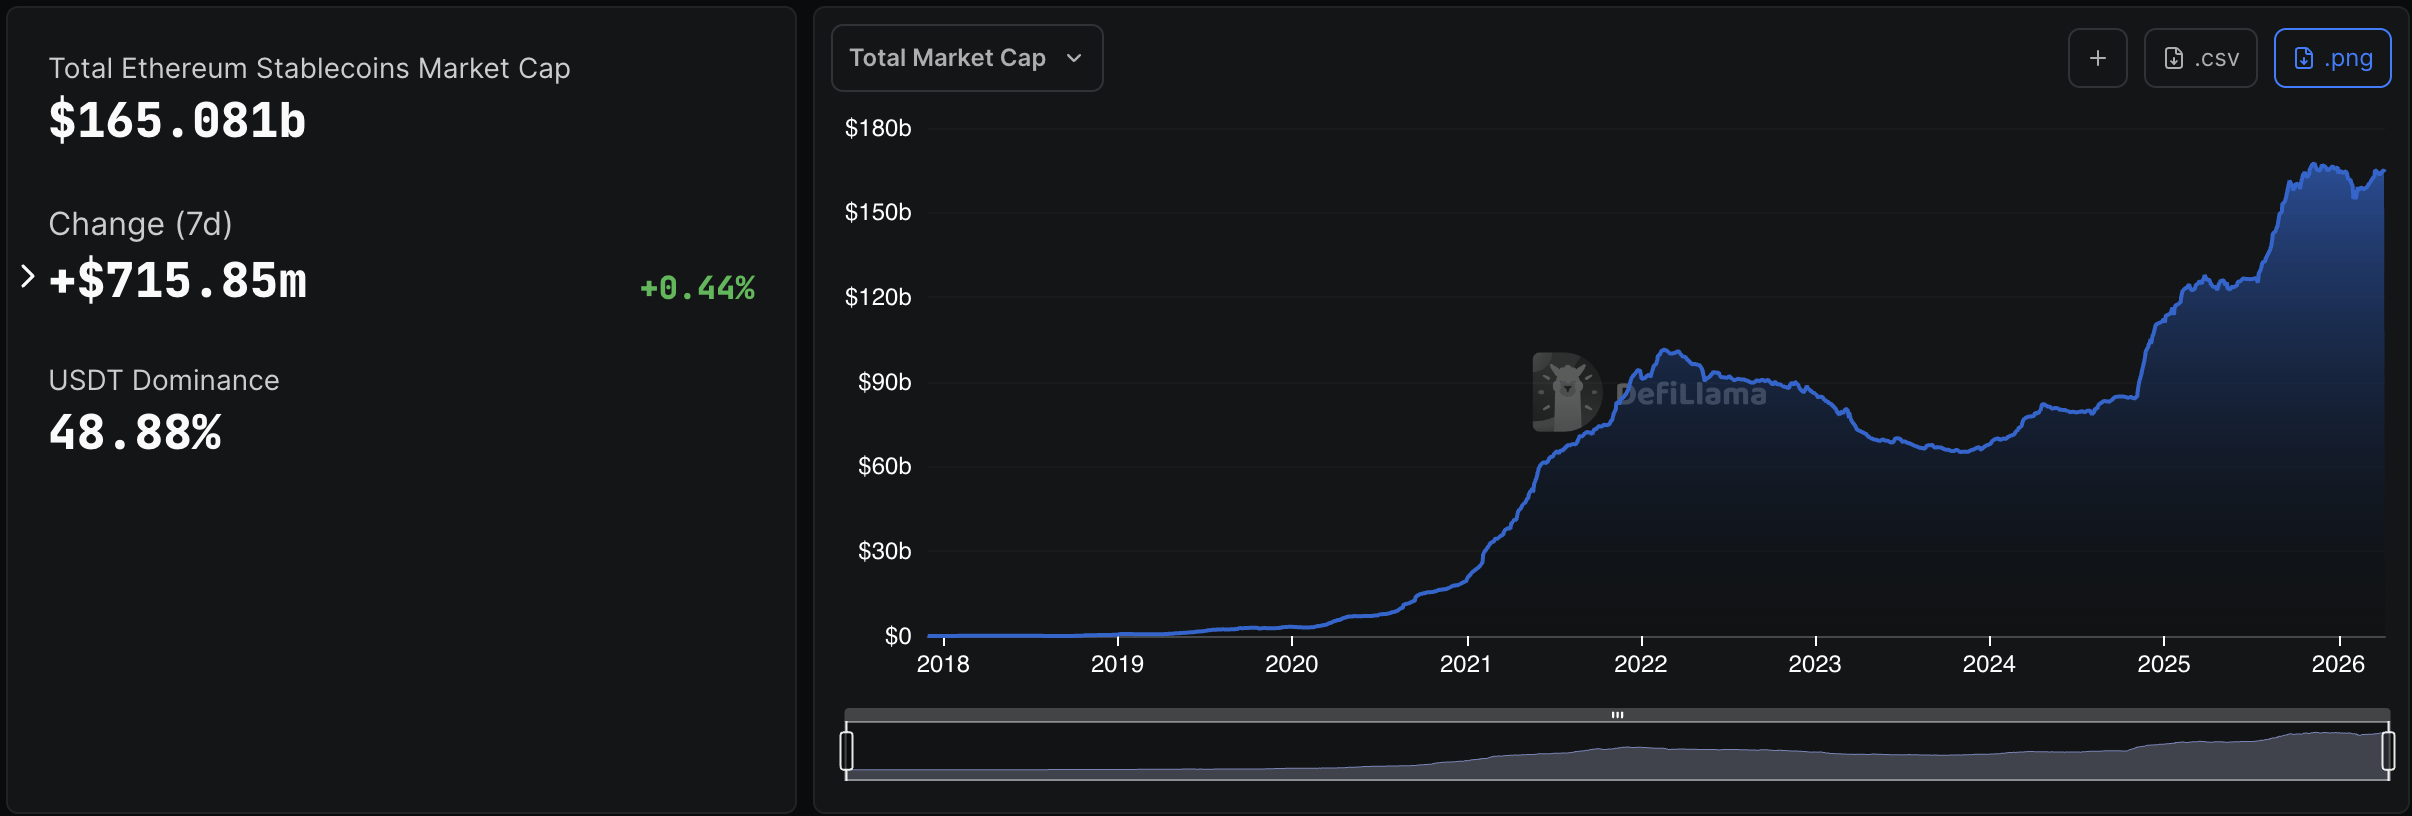
The onchain value of stablecoins on the Ethereum network has reached an all-time high of $180 billion, according to blockchain analytics firm Token Terminal.
Ethereum holds 60% of the stablecoin supply at $180 billion, which is up 150% over the past three years, the firm reported Tuesday.
The company projected that around $1.7 trillion is expected to come onchain across all networks over the next four years and that Ethereum could see $850 billion in “new flows” by 2030, if it grows 470% in that time.
Standard Chartered predicted in late 2025 that more than $1 trillion may exit banks and flow into stablecoins by 2028.
Ethereum has been the dominant network for stablecoins and tokenized real-world assets (RWAs), with major financial institutions such as BlackRock, JPMorgan and Amundi launching tokenized funds on the network as the total stablecoin supply across all networks reached a record $315 billion in the first quarter.

Momentum supports bull cycle driven by tokenized assets
Real-world asset metrics provider RWA.xyz reports a slightly lower figure of $168 billion in stablecoin value on Ethereum.
It also confirms that Ethereum is the industry leader with a market share of 56%. This increases to over 65% when EVM (Ethereum Virtual Machine) and layer-2 networks such as Arbitrum, ZKsync Era, and Base are included.
Related: Stablecoin supply reaches $315B in Q1 as USDC rises, USDT declines
The data highlights Ethereum’s dominance in stablecoins and onchain liquidity, “fueling strong positive sentiment and crypto’s recent rally,” Nick Ruck, director of LVRG Research, told Cointelegraph on Wednesday.
“This momentum strongly supports a sustained long-term bull cycle driven by tokenized assets and institutional adoption, though competition from rival chains, regulatory hurdles, and macro volatility remain key roadblocks to further upside,” he added.
JPMorgan CEO touts tokenization
JPMorgan CEO Jamie Dimon acknowledged that a “whole new set of competitors is emerging based on blockchain, which includes stablecoins, smart contracts, and other forms of tokenization,” in the annual shareholder letter released on Tuesday.
The Wall Street bank launched its first tokenized money market fund (MONY) on Ethereum in December.
“The world’s largest bank is live on Ethereum, and its CEO is publicly saying they’re still not moving fast enough,” stated Ethereum infrastructure startup Etherealize on Tuesday.
Magazine: No more 85% Bitcoin collapses, Taiwan needs BTC war reserve: Hodler’s Digest

AUD/USD started a fresh increase above 0.6970 and 0.7000. NZD/USD is also rising and might aim for more gains above 0.5850.
Important Takeaways for AUD USD and NZD USD Analysis Today
· The Aussie Dollar started a steady increase above 0.7000 against the US Dollar.
· There was a break above a rising channel with resistance at 0.6960 on the hourly chart of AUD/USD at FXOpen.
· NZD/USD is consolidating gains above the 0.5755 pivot zone.
· There was a break above a key contracting triangle with resistance at 0.5710 on the hourly chart of NZD/USD at FXOpen.
AUD/USD Technical Analysis
On the hourly chart of AUD/USD at FXOpen, the pair started a fresh increase from 0.6860. The Aussie Dollar was able to clear 0.6900 to move into a positive zone against the US Dollar.
There was a break above a rising channel with resistance at 0.6960. There was a close above 0.7000 and the 50-hour simple moving average. Finally, the pair tested 0.7080. A high was formed near 0.7084 and the pair recently started a consolidation phase. There was a minor decline below 0.7075.
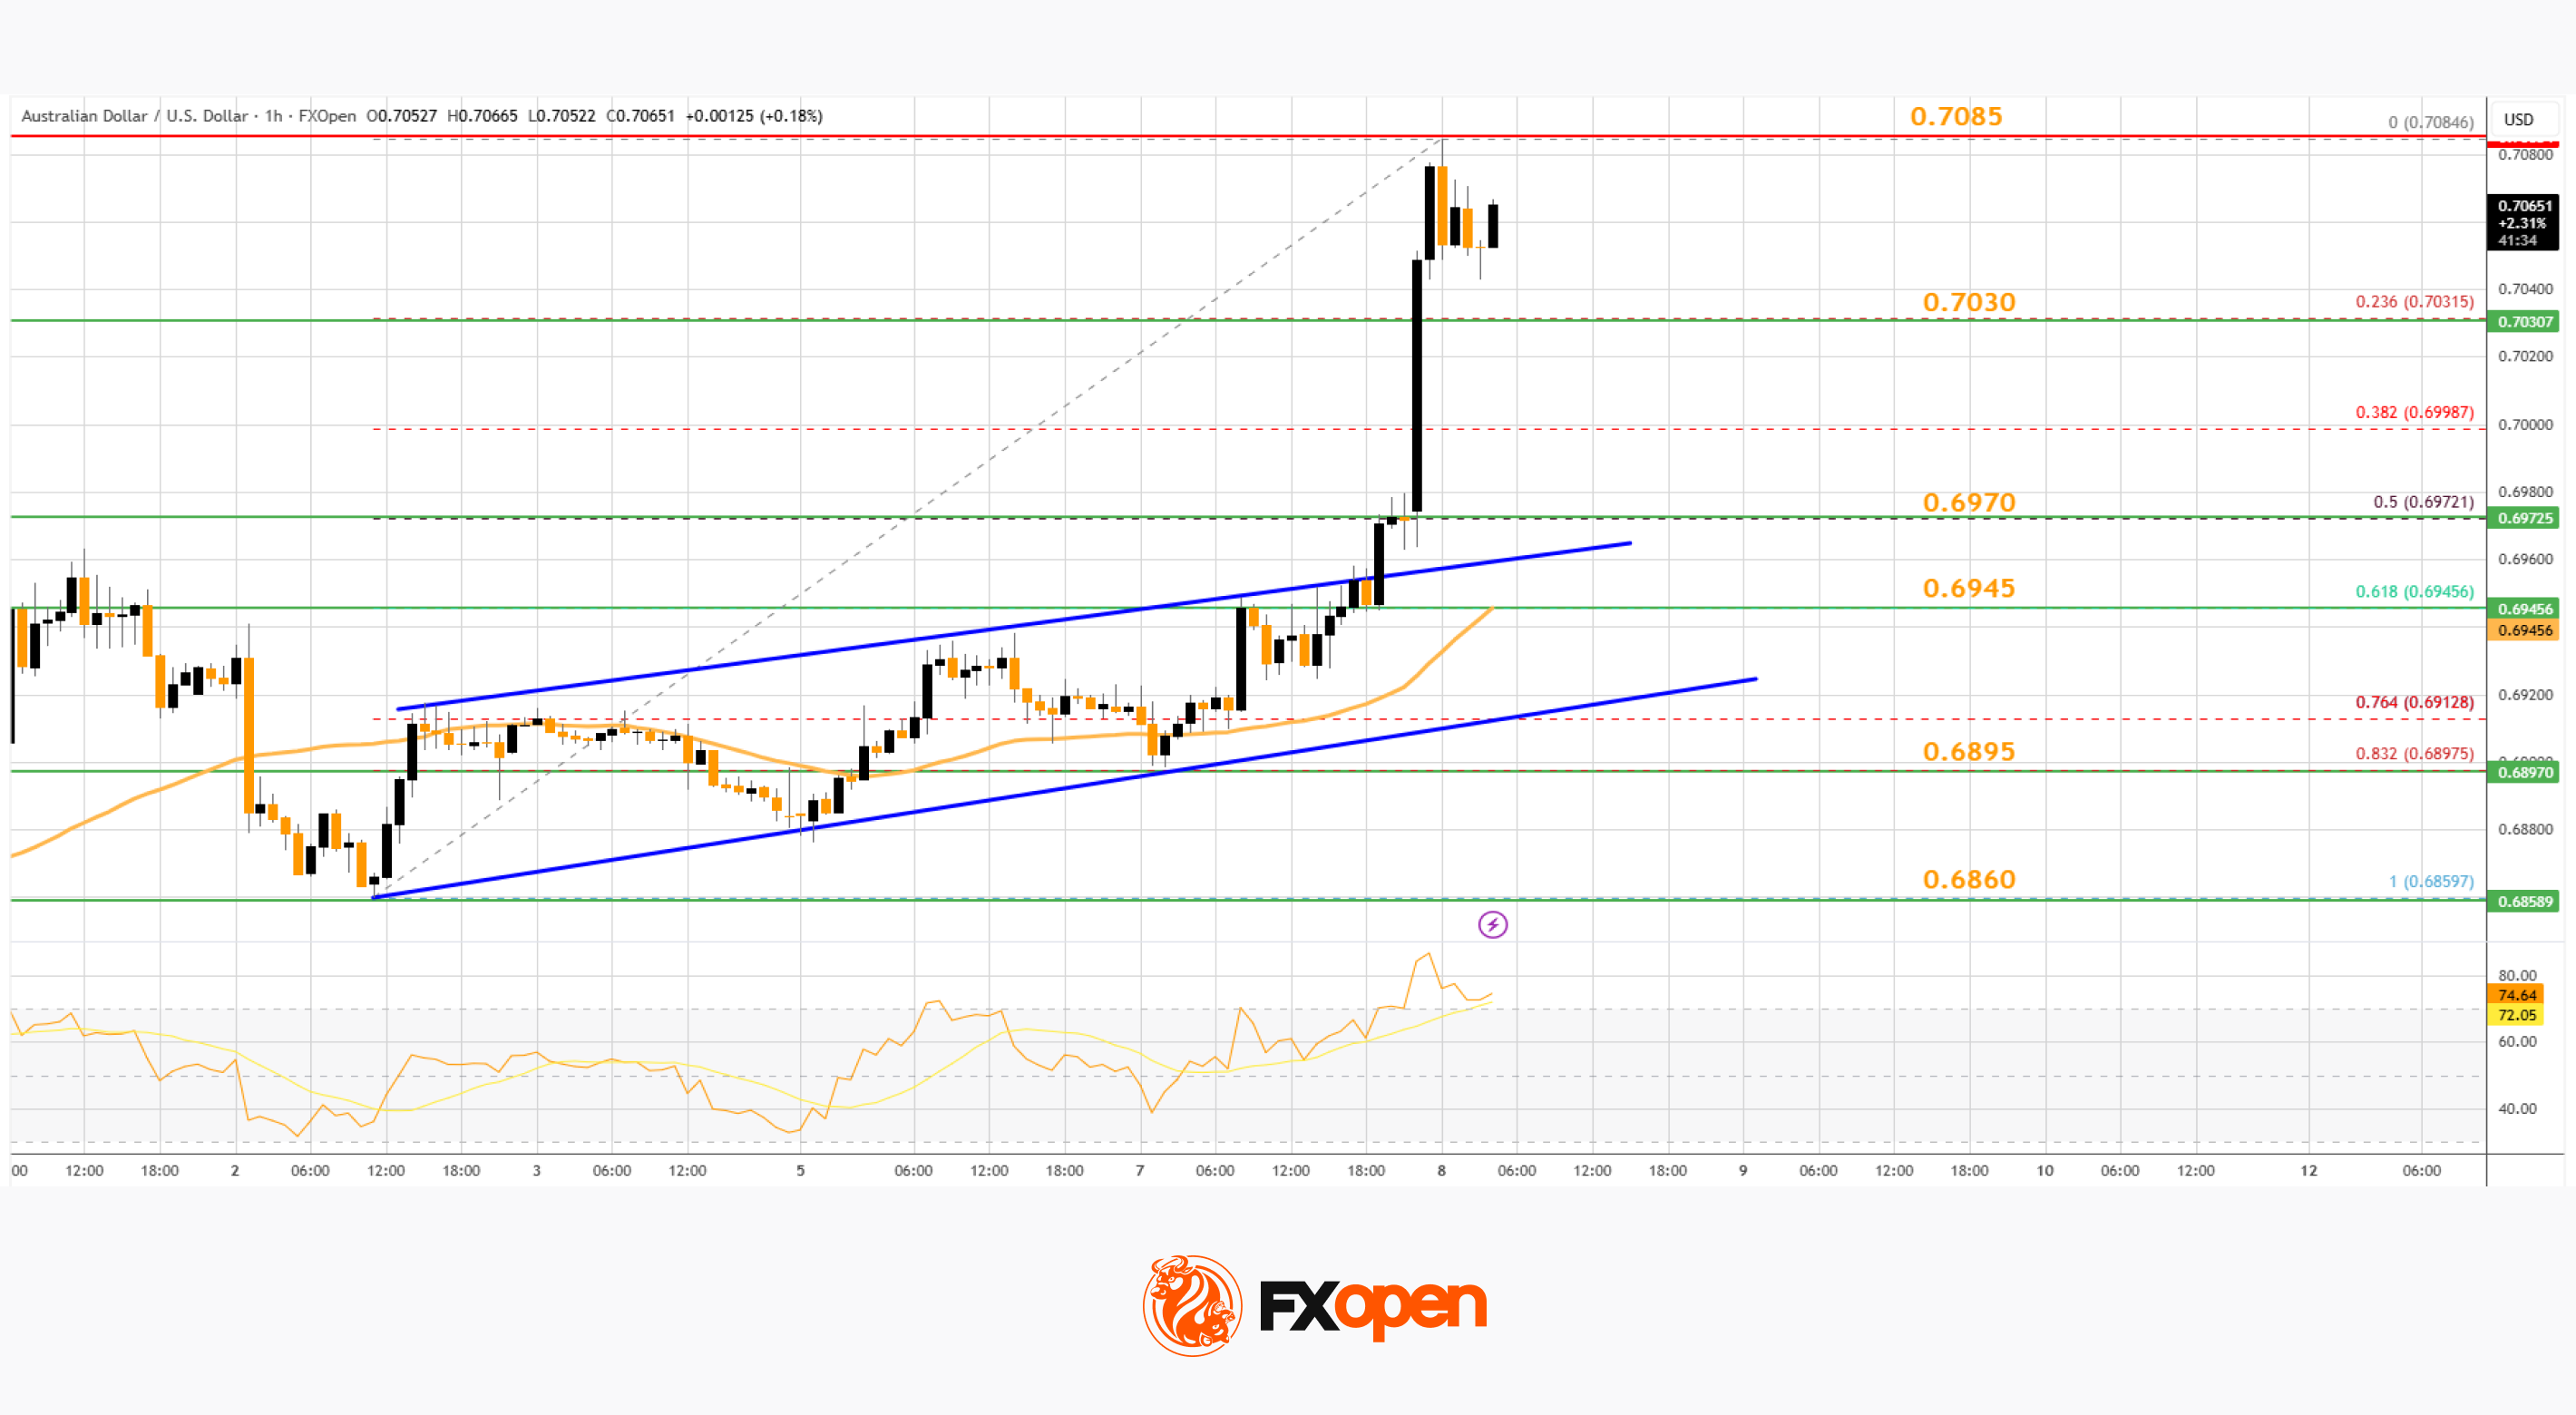
On the downside, initial support is near the 23.6% Fib retracement level of the upward move from the 0.6859 swing low to the 0.7084 high. The next area of interest could be near 0.6970 and the 50% Fib retracement.
If there is a downside break below 0.6970, the pair could extend its decline toward the 0.6945 zone and the 50-hour simple moving average. Any more losses might signal a move toward 0.6895.
On the upside, the AUD/USD chart indicates that the pair is now facing resistance near 0.7085. The first major hurdle for the bulls might be 0.7120. An upside break above 0.7120 might send the pair further higher. The next stop is near 0.7200. Any more gains could clear the path for a move toward 0.7320.
NZD/USD Technical Analysis
On the hourly chart of NZD/USD on FXOpen, the pair started a fresh increase from 0.5675. The New Zealand Dollar broke the 0.5720 barrier to start the recent rally against the US Dollar.
More importantly, there was a break above a key contracting triangle with resistance at 0.5710. The pair settled above 0.5755 and the 50-hour simple moving average.
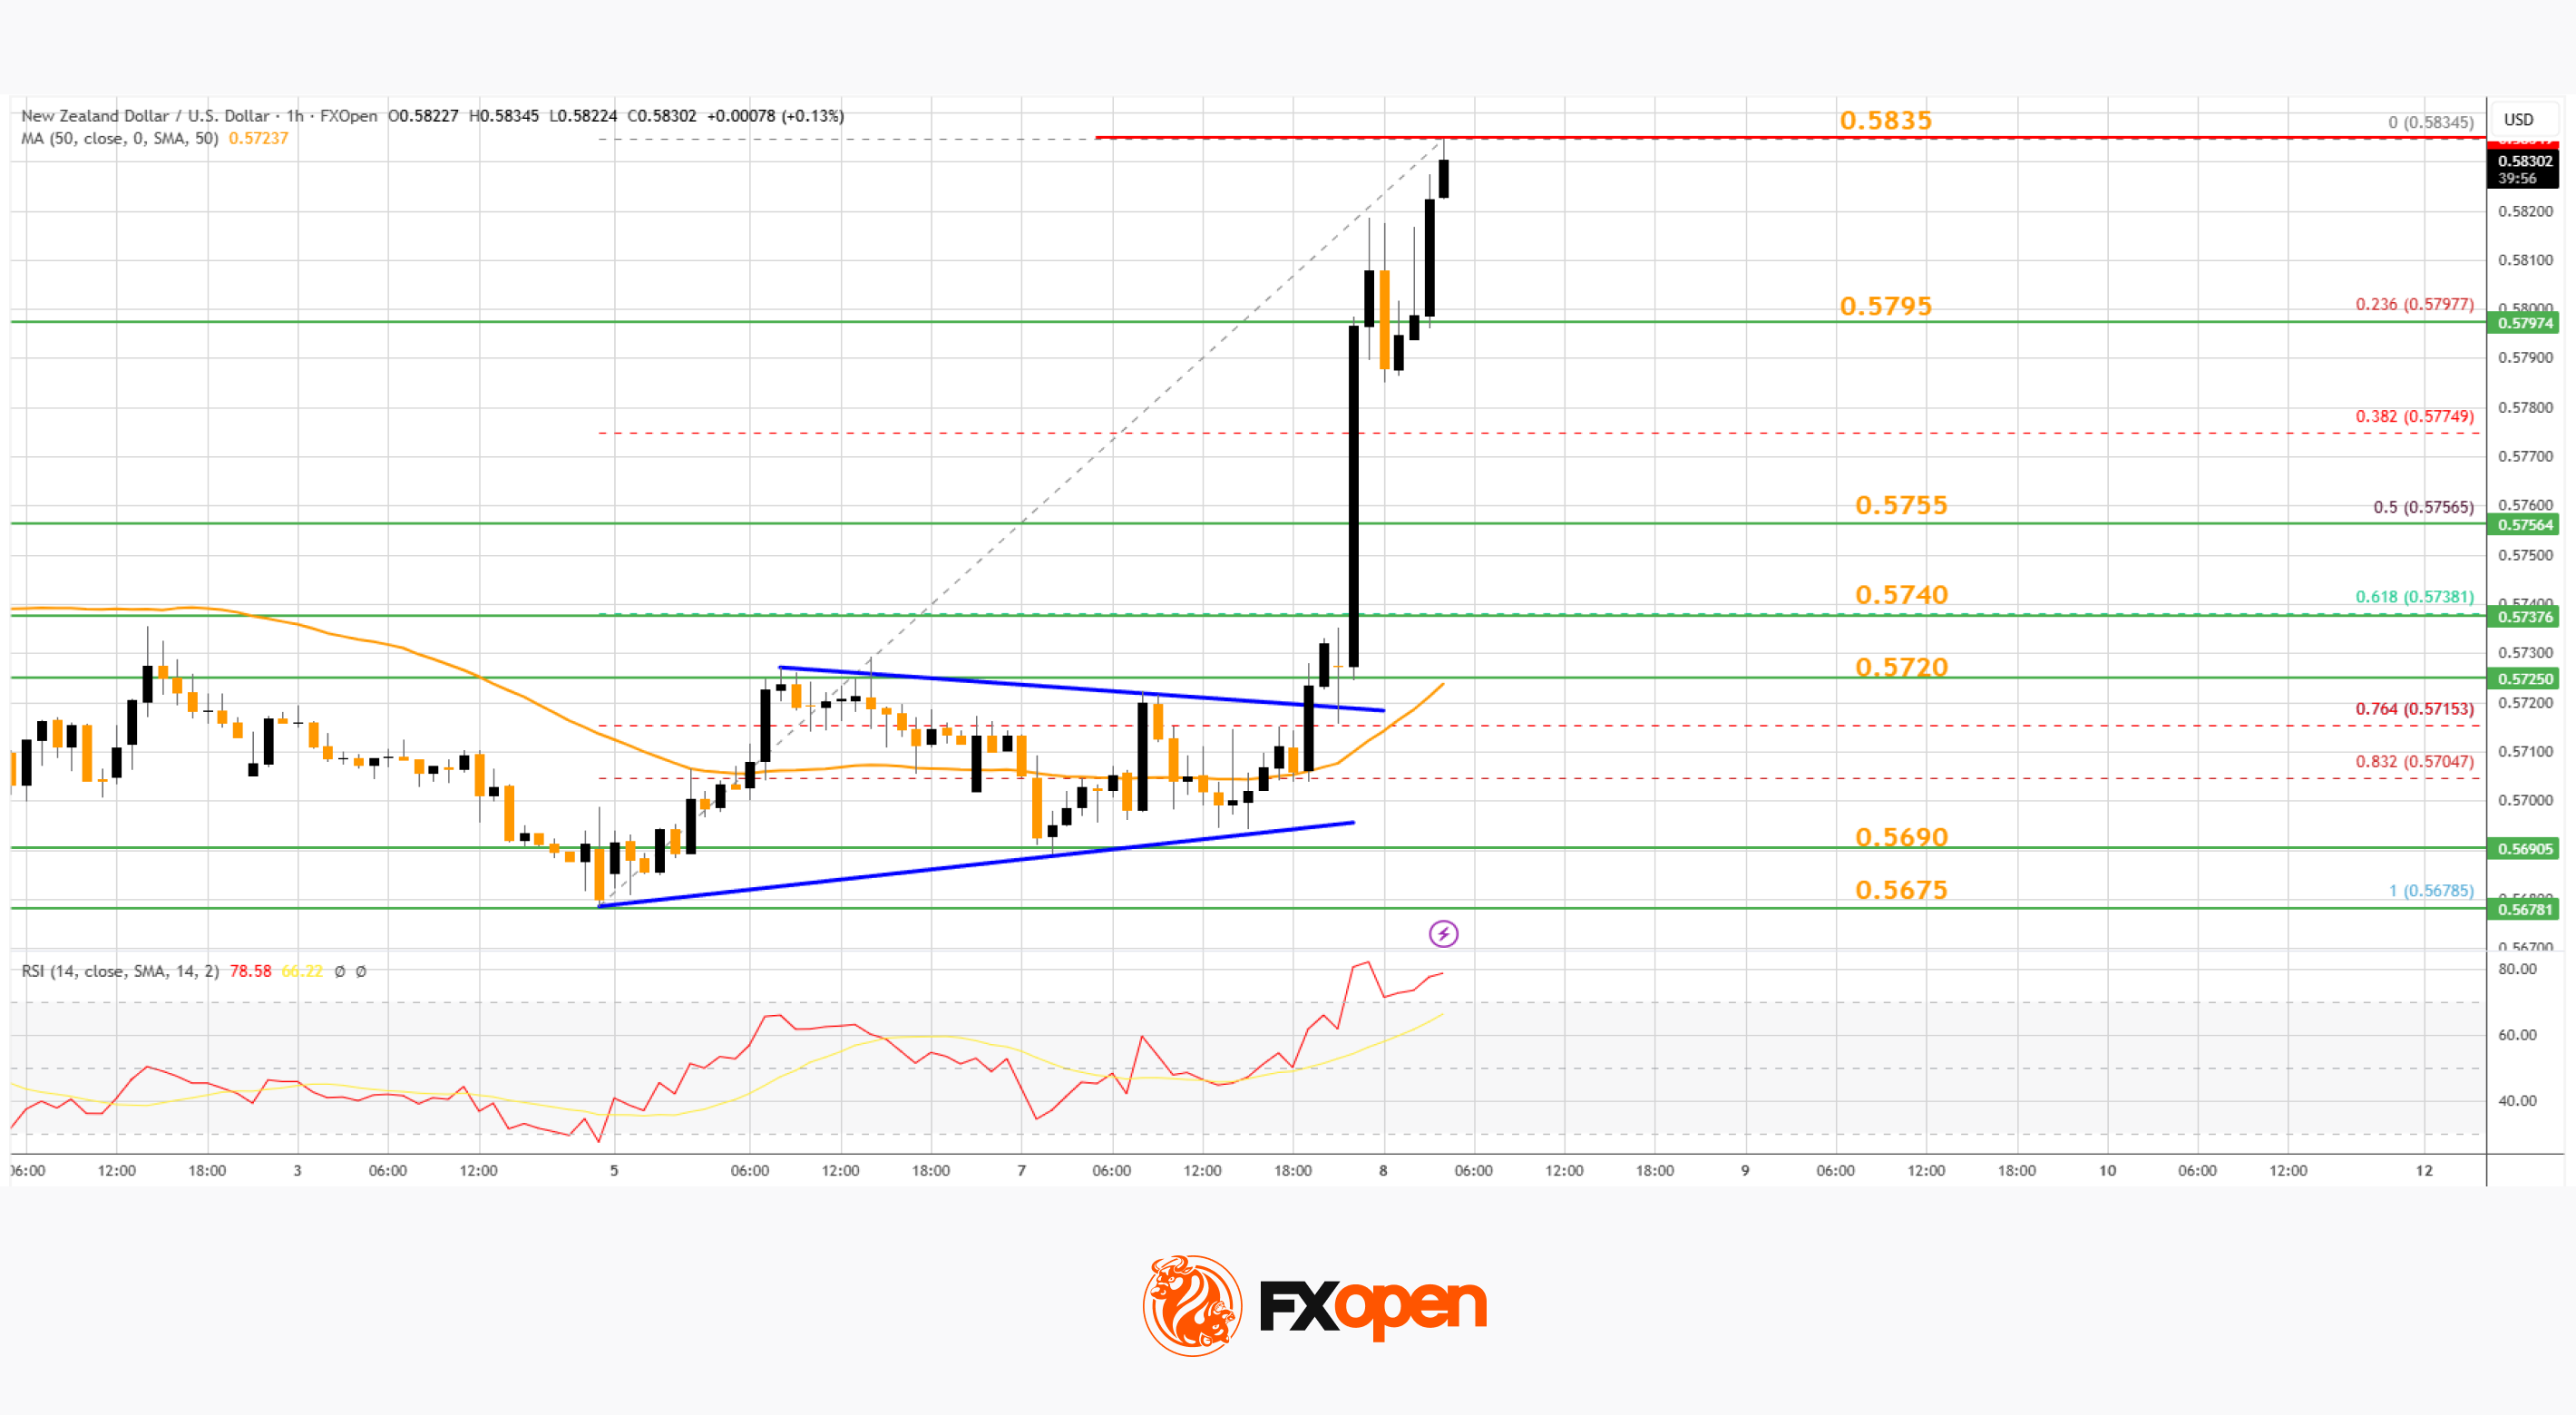
It tested 0.5835 and is currently consolidating gains. There was a minor pullback below 0.5820. The NZD/USD chart suggests that the RSI is now just above 70. On the upside, the pair might struggle near 0.5835. The next major hurdle is near the 0.5880 pivot level.
A clear move above 0.5880 might even push the pair toward 0.6950. Any more gains might clear the path for a move toward the 0.7000 zone in the coming days.
On the downside, immediate support is near the 0.5795 level and the 23.6% Fib retracement level of the upward move from the 0.5678 swing low to the 0.5834 high.
The first key zone for the bulls sits at 0.5755 and the 50% Fib retracement. The next important level is 0.5720 and the 50-hour simple moving average. If there is a downside break below 0.5720, the pair might slide toward 0.5690. Any more losses could lead NZD/USD into a bearish zone to 0.5650.
Trade over 50 forex markets 24 hours a day with FXOpen. Take advantage of low commissions, deep liquidity, and spreads from 0.0 pips (additional fees may apply). Open your FXOpen account now or learn more about trading forex with FXOpen.
This article represents the opinion of the Companies operating under the FXOpen brand only. It is not to be construed as an offer, solicitation, or recommendation with respect to products and services provided by the Companies operating under the FXOpen brand, nor is it to be considered financial advice.


A crypto whale walked away with a huge profit early Wednesday after U.S.-Iran ceasefire news sent oil prices crashing.
The trader “Loracle” had shorted $5 million in crude oil perpetual futures on Hyperliquid last week. As oil prices cratered over 15% below $100 per barrel early Wednesday, Loracle squared off the bearish bet, pocketing $2 million, per Arkham Intelligence.
Loracle’s crypto holdings, comprising USDT, USDC, ETH, and others, total over $8 million as of this writing.
This shows how traditional markets on decentralized platforms like Hyperliquid are helping crypto traders mint fortunes akin to the memecoin mania of 2020-21 that created degen millionaires.
The recent war has established established Hyperliquid as a go-to platform for crypto traders to bet on traditional assets, especially on weekends when legacy markets are closed.
Hyperliquid’s latest activity figures make it clear: WTI crude oil perpetual futures racked up $2.45 billion in trading volume over the past 24 hours, outpacing perpetuals tied to ether (ETH), the world’s second-largest cryptocurrency by market value. Bitcoin holds the top spot, while Brent oil sits fourth with $1.3 billion in volume.


Alchemy, a cryptocurrency infrastructure provider used by many blockchains and firms in the space, has released a new tool, AgentPay , that lets different AI payment systems, from companies like Coinbase, Stripe, Visa, Mastercard, and Circle, work together.
The new tool addresses the problem that agentic payment systems currently coming online aren’t “interoperable”, or in other words, don’t talk to one another, meaning a merchant that wants AI agents as customers has to build a separate integration for every protocol.
“That’s not sustainable, and it’s only going to get more fragmented as more systems launch,” said Alchemy CTO Guillaume Poncin in an email. “AgentPay fixes that. A merchant registers their existing API with us, we give them a new endpoint, and any agent on any supported protocol can pay them through it.”
Alchemy is widely seen as the “AWS of Web3,” as it provides the infrastructure, developer tools, and node services needed to build blockchain applications.
AgentPay promises one integration for every protocol, citing the likes of x402, MPP, A2P, L402. “We sit in the middle as the translation layer, where AgentPay routes instructions, and Alchemy never touches the funds,” Poncin said.
So-called agentic finance, which is expected to become a major pillar of all payments activity on the internet, can involve micro-transactions, or nano-payments, some of which take place between AI agents with humans somewhere in the background.
Alchemy has carried out a private beta soft launch for now, and is aiming for a general release in the coming weeks.
Crypto World
Ethereum Price Prediction: ETH Buyers Back as Stablecoin Supply Hit $180 Billion Record

Ethereum buyers are back while the price rallies with 7% gain. But not just the Ethereum price; stablecoins are also posting record-breaking milestones, signaling structural demand.
Ethereum’s on-chain stablecoin supply hit a fresh all-time high of $180 billion, a 150% surge from $72 billion just three years ago. That eclipses the prior peak of $166 billion set in September 2025, an 8.4% jump in seven months achieved despite persistently bearish broader sentiment.
— CW (@CW8900) April 8, 2026
 BULLISH: Stablecoin supply on Ethereum has hit an ATH of $180B, up 150% in 3 years, per Token Terminal. pic.twitter.com/4mNy70583N
Ethereum commands 60% dominance of global stablecoin supply, ahead of Tron and Solana, driven by USDT at almost 50%. Analyst projects total on-chain stablecoin flows reaching $1.7 trillion by 2030, with Ethereum capturing roughly $850 billion at a 50% market share assumption.
That projection reframes the ETH price conversation entirely, from short-term chart patterns to long-term settlement layer dominance. Upcoming scalability upgrades and ETF-related catalysts are amplifying the setup heading into Q2.
Is today a genuine inflection point? Or just another head-fake in a bruising market cycle?
Discover: The best pre-launch token sales
Ethereum Price to Break $2,400 Resistance
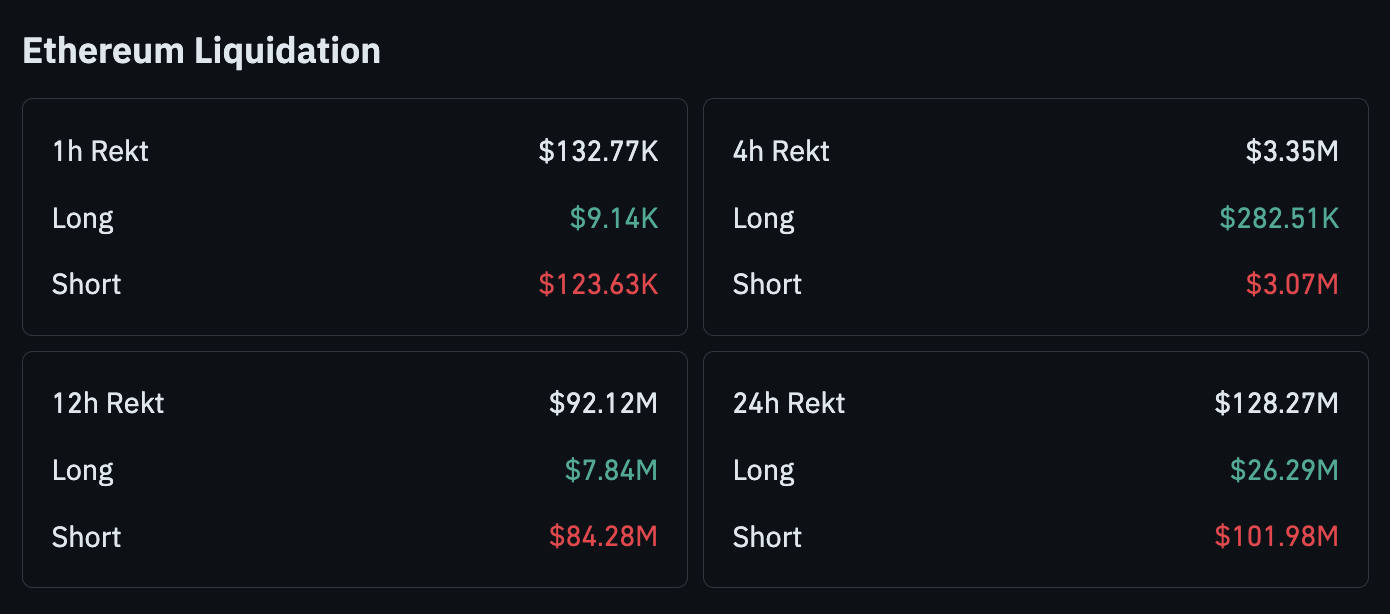
ETH’s 7% single-day recovery carries weight given the context; $100 million in short liquidations were flushed in the move toward $2,120 before price extended higher, establishing a post-liquidation base that analysts now treat as near-term support.
For ETH, Resistance clusters at $2,400, a zone coinciding with prior peaks. Volume, however, remains a sticking point. The bounce has been directionally clean but lacks the aggressive follow-through that would confirm institutional accumulation rather than short covering.
Market sentiment is also fragile, with geopolitical risk capable of disrupting any recovery at any moment.
The stablecoin data builds a compelling structural floor. The price chart, though, still demands confirmation.
Discover: The best crypto to diversify your portfolio with
Maxi Doge Targets Early Mover Upside as Ethereum Breaking Records
ETH at $2,250 and 7% day gain is genuinely strong. But capturing more than 100% from a $270 billion market cap asset requires either exceptional patience or outsized conviction. Liquidity is rotating across the crypto stack, and early-stage plays on Ethereum’s own rails are drawing attention from traders hunting asymmetric setups.
Maxi Doge ($MAXI) is one such project currently in presale, an ERC-20 meme token built around what it describes as the “1000x leverage trading mentality,” embodied by a 240-lb canine juggernaut.
The presale has raised more than $4.7 million at a current price of $0.00028, with 66% staking APY available to early participants. Features include holder-only trading competitions with leaderboard rewards, a Maxi Fund treasury for liquidity and partnerships, and meme-first viral marketing built around the tagline: Never skip leg-day, never skip a pump.
Research Maxi Doge and join the gang.
The post Ethereum Price Prediction: ETH Buyers Back as Stablecoin Supply Hit $180 Billion Record appeared first on Cryptonews.
In a market still obsessed with flashy token launches and unsustainable farming yields, most serious crypto holders quietly face the same frustration: their assets sit idle or locked up in rigid staking positions while network unbonding periods drag on for weeks. FortisX.fi quietly solves that problem with a hybrid model that combines managed staking across major PoS networks and internal liquidity pools that deliver competitive, variable yields without the usual headaches.
Launched as an infrastructure play back in 2018 and now managing over $156 million in allocated assets, FortisX isn’t chasing retail hype. It’s built for long-term holders who want their Bitcoin, Ethereum, Solana, XRP, stablecoins, and a dozen other major assets to actually work—while still being able to access capital when they need it.
Two Paths, One Powerful Engine
FortisX offers two complementary products that run on the exact same data-driven risk and allocation framework. The choice comes down to your time horizon and liquidity preference.
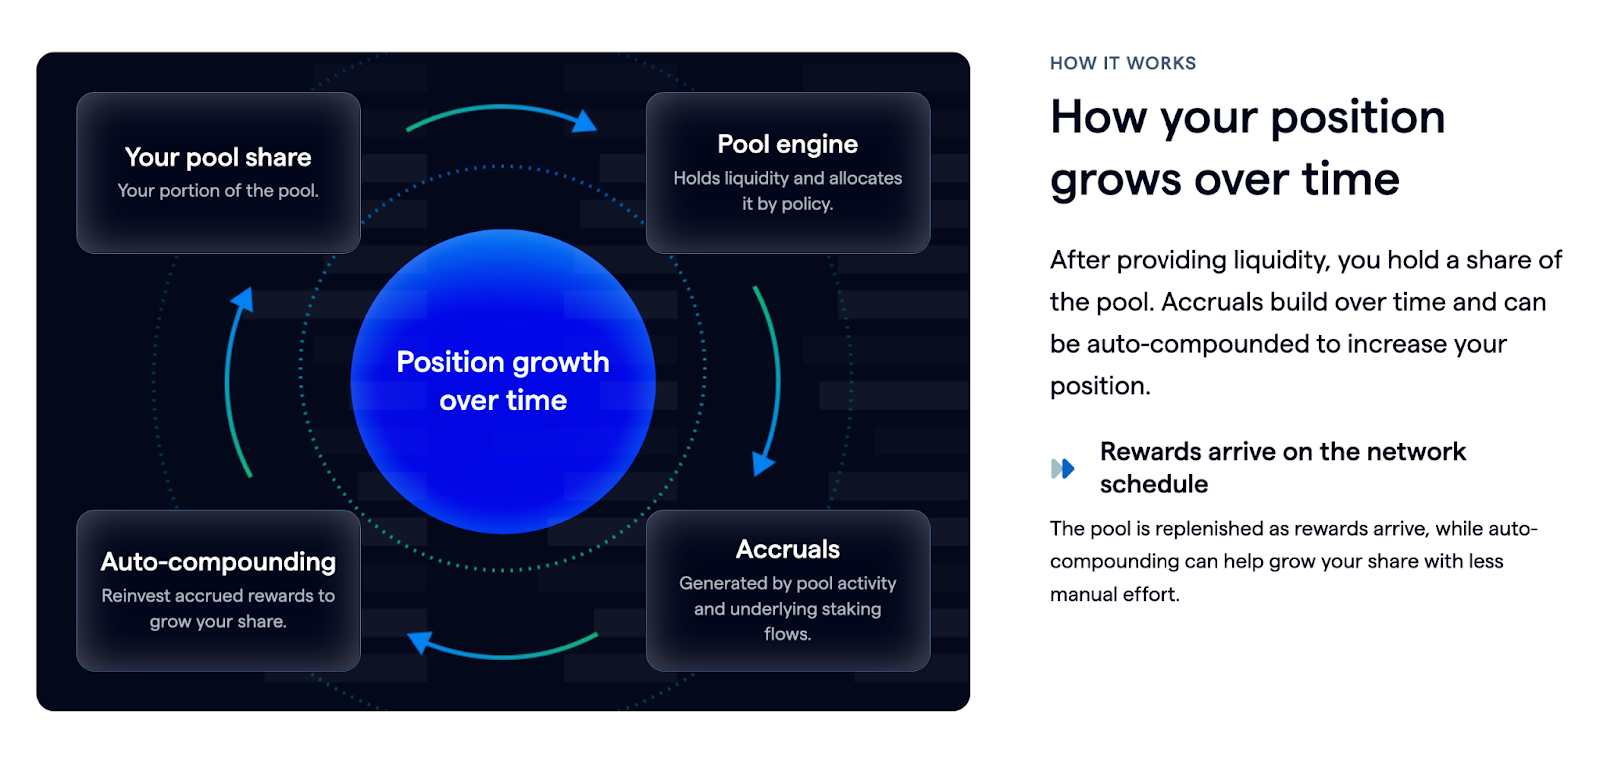
Liquidity Pools are the more dynamic option. You provide liquidity into FortisX’s internal pools, which sit directly on top of the platform’s native staking engine. These pools absorb the timing friction that plagues most Proof-of-Stake networks—Ethereum’s exit queues, Solana epochs, Polkadot’s 28-day unbonding, Cosmos slashing risks, and so on.
The result? Variable yields currently estimated between 8.3% and 27.1% APY (with a median hovering around 18%), paid out from a combination of underlying staking rewards plus operational economics like spreads and fast-exit premiums.
What makes these pools stand out is transparency and flexibility. Yields fluctuate with real pool activity under clearly documented rules rather than opaque black-box mechanics. Withdrawals are available anytime within available liquidity—no forced lock-ups on the platform side.
Popular pools right now include USDT, XRP, ETH, SOL, and several others across 23 supported assets. If you’re a holder who likes the idea of their capital staying productive but doesn’t want to wake up to a 21-day wait to sell during a market move, this is the product designed for you.
Managed Staking, by contrast, targets those who prefer a more passive, network-native approach. The platform allocates your stake across carefully vetted validators using strict diversification policies, real-time on-chain analytics, and continuous risk monitoring.
Current estimated APRs range from 3.8% to 20% depending on the network (Ethereum around 3.76%, Solana ~6.72%, Cosmos up to 19%, etc.), with a median around 6.1%. The engine handles validator performance, concentration risks, slashing probabilities, and network-specific quirks so you don’t have to. An internal liquidity layer still smooths entry, reward payouts, and partial exits where possible, giving it a meaningful edge over raw native staking.
Both products share the same under-the-hood infrastructure: Fireblocks MPC-grade custody (keys never touch the staking operations directly), two independent audits (CertiK and Cyberscope) with all medium and low findings remediated, and a public policy engine that anyone can review.
Built Like Infrastructure, Not Another DeFi Experiment
What separates FortisX from the sea of liquid staking tokens and centralized exchange staking programs is its obsessive focus on operational transparency and risk management. The same analytics engine that powers allocations is exposed via API for developers and institutions. Validator metrics, network fees, block times, active set concentration—everything is visible and rules-based rather than “trust us.”
This isn’t marketing fluff. The platform has been operating since 2018 as a staking infrastructure provider before expanding into user-facing products. In an era where many DeFi protocols have collapsed under the weight of over-leveraged incentives or hidden smart-contract risks, FortisX’s conservative, data-first approach feels refreshingly institutional without being boring.
Compare it side-by-side:
- Native staking: High effort, full network risk exposure, long unbonding periods.
- Exchange staking: Convenient but you’re trusting the platform’s terms and often centralized custody.
- Liquid staking tokens: Great for composability but variable slippage, protocol-specific risks, and sometimes diluted yields.
- FortisX: Combines professional validator management with built-in liquidity and full visibility into the rules.
Why This Matters in 2026
PoS networks now dominate the blockchain landscape for good reason—energy efficiency, real economic security, and sustainable yields. But the average holder still struggles with the practical realities of participation. FortisX removes those friction points without turning yield into a speculative game.
Whether you’re parking stablecoins for steady income, rotating through blue-chip assets like SOL or XRP for higher variable returns, or simply diversifying a long-term portfolio, the platform gives you options that actually match how professional investors think about capital efficiency.
Yields will always fluctuate with market conditions and network activity—that’s the nature of real DeFi. But the combination of audited security, transparent policies, instant-ish liquidity where networks allow it, and a battle-tested team makes FortisX one of the more credible yield solutions available today.
If you’ve been sitting on idle crypto wondering how to put it to work without sacrificing sleep, FortisX.fi deserves a serious look. Head over to the site, explore the pools or staking dashboard, and see how the numbers stack up against your current setup. In a market that rewards patience and infrastructure over hype, this is the kind of quiet utility that actually compounds.
The post FortisX.fi: Where Professional-Grade Staking Finally Meets Real Liquidity appeared first on BeInCrypto.


More than two years after the first 11 spot bitcoin ETFs began trading in the U.S., a 12th, issued by a top-10 Wall Street bank with $1.9 trillion in assets under management, could debut Wednesday.
The Morgan Stanley Bitcoin Trust could start trading NYSE Arca under the ticker MSBT, Bloomberg’s ETF Analyst Eric Balchunas said on X, an NYSE listing notice that points to an April 8 launch.
The ETF hold actual bitcoin and tracks the CoinDesk Bitcoin Benchmark 4 PM NY Settlement Rate. It does not use leverage, derivatives, or active trading to beat bitcoin’s price swings. BNY and Coinbase Custody will handle bitcoin storage, and the fund is launching with about $1 million in initial capital (seed) and 50,000 shares ready for trading.
Like its peers, the fund gives investors exposure to the cryptocurrency without having to own or safeguard it themselves.
Where it stands out is on cost: the trust charges a 0.14% annual fee, undercutting BlackRock’s iShares Bitcoin Trust at 0.25% and most rivals.
The impending launch marks a milestone for the market, signaling the first time a major U.S. bank is bringing a spot bitcoin ETF to investors. It underscoring the surging demand for exposure to alternative assets like bitcoin.
Morgan Stanley is pushing deeper into digital assets, having filed earlier this year for spot Solana ETFs and planning to roll out trading in bitcoin, ethereum and solana on E*Trade in the first half of 2026 via a collab with Zero Hash.
Spot ETFs have become a go-to vehicle for institutions seeking exposure to the cryptocurrency. Since the first 11 funds debuted in January 2024, they have collectively drawn more than $56 billion in net inflows, according to data source SoSoValue.
Activity in derivatives linked to these products has surged as well, with the mechanics of options tied to iShares Bitcoin Trust widely seen as amplifying bitcoin’s price slide in early February.
These alternative investment vehicles have driven the mainstream financialization of Bitcoin, helping to dampen its volatility. Market dynamics have evolved, with BTC’s implied volatility increasingly mirroring Wall Street’s fear gauge, the VIX – rising during price declines and falling during rallies.
Morgan Stanley’s upcoming ETF is likely to reinforce these trends.
Deontay Wilder offered immediate title shot after Chisora win: “We’re ready”
Google’s Pixel 10A Is Coming to Japan With an Exclusive Blue Edition and Special Wallpaper

Mr. Raccoon Just Breached Another Major Company


-

 NewsBeat6 days ago
Steven Gerrard disagrees with Gary Neville over ‘shock’ Chelsea and Arsenal claim | Football
-

 Business5 days ago
No Jackpot Winner and $194 Million Prize Rolls Over
-

 Fashion5 days ago
Weekend Open Thread: Spanx – Corporette.com
-

 Crypto World7 days ago
Gold Price Prediction: Worst Month in 17 Years fo Save Haven Rock
-

 Business2 days ago
Three Gulf funds agree to back Paramount’s $81 billion takeover of Warner, WSJ reports
-

 Sports4 days ago
India men’s 4x400m and mixed 4x100m relay teams register big progress | Other Sports News
-

 Business4 days ago
Expert Picks for Every Need
-

 Business6 days ago
Login and Checkout Issues Spark Merchant Frustration
-

 Tech12 hours ago
How Long Can You Drive With Expired Registration? What Florida Law Says
-
Business3 days ago
No Jackpot Winner, Prize to Climb to $231 Million
-

 Tech6 days ago
Commonwealth Fusion Systems leans on magnets for near-term revenue
-

 Crypto World7 days ago
Ripple rolls out enterprise crypto treasury platform for corporates
-

 Tech7 days ago
Drawing Tablet Controls Laser In Real-Time
-
Politics5 days ago
Wings Over Scotland | The quality of mercy
-

 Fashion2 days ago
Massimo Dutti Offers Inspiration for Your Summer Mood Board
-

 Crypto World7 days ago
Why It’s Partnering, Not Issuing
-
 Sports7 days ago
Steal Gary Woodland’s subtle power move for longer drives
-
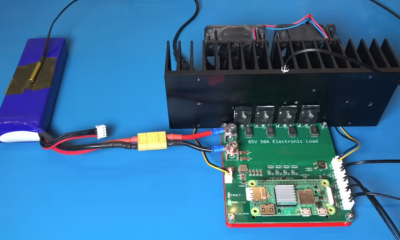
 Tech7 days ago
Battery Tester Outperforms Cheaper Options
-

 Business3 days ago
Akebia Therapeutics, Inc. (AKBA) Discusses Pipeline Progress and Strategic Focus on Kidney Disease Treatments at R&D Day – Slideshow
-

 Sports7 days ago
Mohsin Naqvi-Led Pakistan Cricket Board Blasted By Younis Khan After 20 Million Rupees Fine On Naseem Shah
You must be logged in to post a comment Login