
Crypto World
Buterin Offloads ETH, Bitcoin Unable to Push Past $70K, XRP Spot Buying Increases: This Week’s Crypto Recap
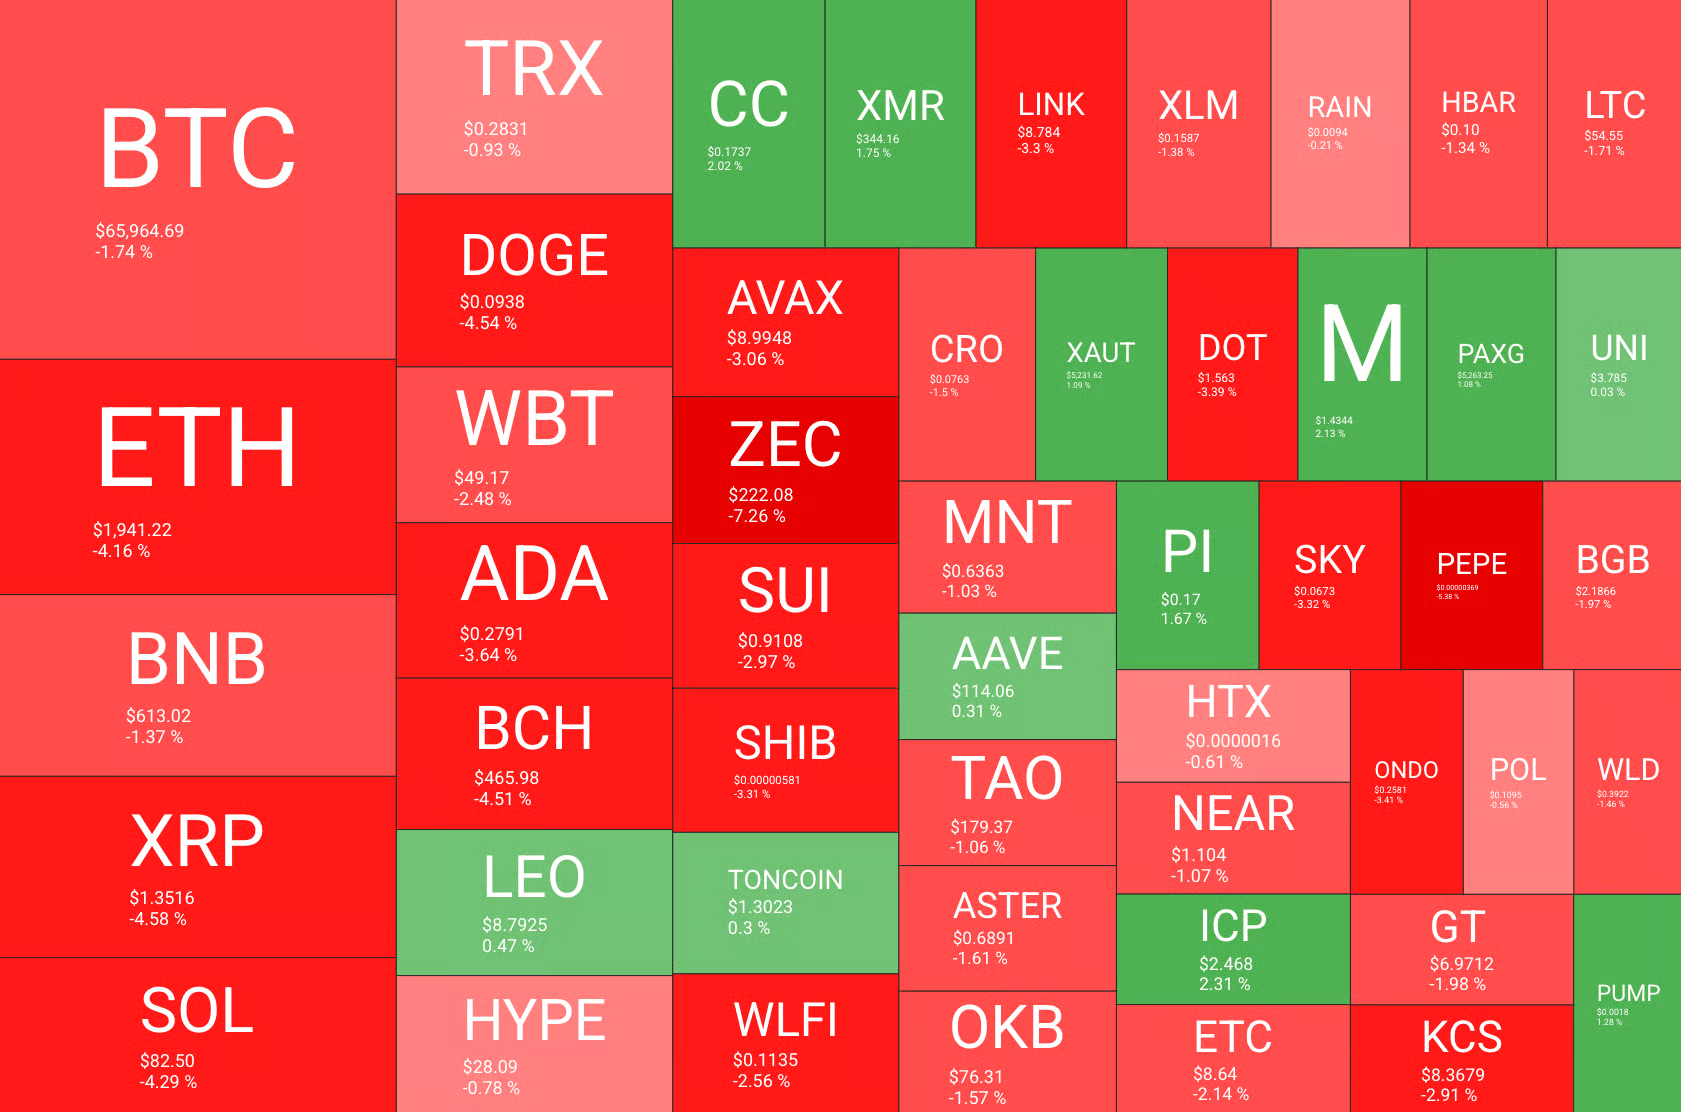
Bitcoin played a trick on us this week, making us believe that a recovery is inbound but the positivity was for not.
It’s been a relatively dynamic week within the cryptocurrency industry. The total market capitalization currently stands at around $2.36 trillion, which is more or less where it was last Friday when we did the previous weekly recap, but this doesn’t paint the whole picture.
You see, BTC started the week as anyone would expect – chopping to the downside, which inevitably led to an abrupt crash on Monday, when it dropped from above $67K to around $64K. This was followed by an intraday dead cat bounce and an immediate continuation to below $63,000. Sentiment was down bad, as was most of Crypto Twitter, but what followed raised a few eyebrows.
Bitcoin actually started recovering… notably. It soared from $63K to $70K in less than two days. And then came yet another sign that we are amidst the depths of crypto winter – the recovery was put to a halt, and the bears once again took control, pushing the price down to where we currently sit at slightly above $66K. In case you are wondering, we are still in a state of “extreme fear,” according to the popular Crypto Fear and Greed index, meaning that the masses are definitely not convinced that the worst is behind us. In fact, the most recent bounce did very little to improve the overall sentiment.
Meanwhile, the co-founder of Ethereum, Vitalik Buterin, continues selling ETH. So far, his total disposals reached around 18,700 ETH, even though he previously stated that he plans to sell 16,384 ETH to fund open-source software and hardware development, privacy tools, and security-critical infrastructure projects.
Elsewhere, we have some light at the end of the tunnel for XRP holders, with spot buying seemingly on the rise. While it has done little for the price so far, this could be a sign of a structural shift in XRP’s market dynamics. Bitrue reported a 212% surge in spot buying on February 26th, most of which was linked to ETF inflows, suggesting steady demand from funds.
All in all, the week started off as depressing, turned bullish, and then went back exactly to where it was in the beginning. Strength is being dissolved quickly as negative sentiment prevails, which is incredibly indicative of bear markets. That also makes it quite exciting to see what the next seven days have in store for us.
Market Data
Market Cap: $2.35T | 24H Vol: $113B | BTC Dominance: 56.1%
You may also like:
BTC: $66,097 (-1.5%) | ETH: $1,947 (+0.2%) | XRP: $1.35 (-3.2%)
This Week’s Crypto Headlines You Can’t Miss
Bitwise CIO Matt Hougan Rejects Jane Street Blame for Bitcoin Dip. Matt Hougan, the chief investment officer at Bitwise, has dismissed claims that Jane Street is orchestrating Bitcoin’s ongoing downturn. Instead, he said that the current price action is typical of a “classic crypto winter.” Read more.
BSC Fees Hit Multi-Month Lows as History Signals Bitcoin Rebound Ahead. The Binance Smart Chain (BSC) saw its total fees paid drop to $593,000, which pretty much marks the network’s lowest usage cost since at least August 2025. Read more.
2026 US Midterms Emerge as Potential Turning Point for Crypto Markets. The 2026 US midterm elections are closing in. Many view them as a potential catalyst that’s tied to liquidity cycles in traditional financial markets, as well as a recovery in the broader cryptocurrency market. Read more.
Bitcoin’s Recovery Isn’t Here Yet – Here’s What Still Needs to Flip. Data shows that BTC remains trapped in a structurally defensive consolidation. This happens as the price oscillates between $60K and $90K. Therefore, for a recovery to start shaping, the price needs to push above the upper boundary. Read more.
Vitalik Buterin Exceeds 16,384 ETH Selling Target with $38M in Total Disposals. The co-founder of Ethereum (and likely the most prominent person behind it), Vitalik Buterin, is dumping ETH. In fact, he has exceeded his previously stated plan to sell 16,384 ETH by almost 20%. Read more.
Wall Street Is Going On-Chain, And Investors Still Don’t Get It, Says Bitwise CIO. According to the CIO of Bitwise, investors often misinterpret what is truly happening in the market due to behavioural biases and think that Wall Street is already going on-chain. Read more.
Charts
This week, we have a chart analysis of Ethereum, Ripple, Cardano, Binance Coin, and Hyperliquid – click here for the complete price analysis.
Binance Free $600 (CryptoPotato Exclusive): Use this link to register a new account and receive $600 exclusive welcome offer on Binance (full details).
LIMITED OFFER for CryptoPotato readers at Bybit: Use this link to register and open a $500 FREE position on any coin!


In early 2026, a wave of layoffs across the crypto industry has raised concerns about the reasons behind the job cuts. While some companies cite macroeconomic factors, such as weak token prices, others frame their workforce reductions as part of a broader shift toward integrating AI into their operations.
Summary
- Major crypto firms, including Algorand and Gemini, cut staff due to market downturn and AI adoption.
- AI adoption in crypto companies leads to workforce reductions, with claims of increased efficiency.
- Job cuts across the industry mirror the challenges faced during the 2022 crypto winter.
Several major crypto firms, including Algorand, Gemini, Crypto.com, and Messari, have laid off staff in recent weeks. Algorand, for instance, announced it would cut 25% of its fewer than 200 employees, citing “the uncertain global macro environment” and the ongoing crypto downturn.
Similarly, Gemini Space Station (GEMI) announced it would eliminate roughly 200 positions in February, increasing to 30% by mid-March. Crypto.com also joined the list, trimming 12% of its workforce, about 180 employees.
In addition to these major companies, OP Labs, the team behind the Optimism layer-2 blockchain, laid off 20 employees, while PIP Labs, the team behind Story Protocol, reduced its staff by 10%. Messari, a crypto data provider that now emphasizes AI, made its third round of layoffs since 2023, though the number of affected employees was not disclosed.
Reasons for layoffs: Macro conditions or AI integration?
The official explanations for these layoffs vary. Algorand attributed its staff cuts to the broader economic conditions and weak token prices, such as its ALGO token trading at $0.09, down 98% from its 2019 peak.
However, many companies framed their layoffs as a pivot towards AI integration. Gemini, for instance, emphasized the necessity of AI, stating, “AI is now too powerful not to use at Gemini,” and warned that not adopting AI would soon be akin to using a typewriter instead of a laptop.
Crypto.com echoed this sentiment, stating that integrating AI into their processes resulted in increased efficiency, requiring fewer workers. CEO Kris Marszalek argued that companies not pivoting toward AI would fail. The shift towards AI adoption is seen as part of a broader trend in the industry, with AI being increasingly incorporated into workflows to reduce costs and improve productivity.
Consolidation and industry shrinkage
Industry observers pointed to broader trends of consolidation and cost-cutting. Entire sectors within crypto, such as restaking, decentralized physical infrastructure networks (DePIN), and layer-2s, which once boasted abundant talent, have experienced significant contraction. The reduction in these sectors’ activities has led companies to downsize and adjust to new market conditions.
Dan Escow, founder of crypto recruitment agency Up Top, noted,
“I see no real indication that these layoffs have anything to do with AI workforce replacement at scale.”
Instead, he suggested that the layoffs were primarily driven by the need for companies to cut costs and survive amidst ongoing challenges in the market.
The broader job market in crypto also reflects this downturn. New job postings on major crypto job boards dropped significantly, running at only 6.5 per day in January 2026, down approximately 80% from the previous year.
In addition, the job cuts from the companies mentioned in this article alone account for about 450 layoffs. This recent surge in layoffs follows the trend of the 2022 crypto winter, when over 26,000 job losses were tracked throughout the year.

In a development that underscores the heightened scrutiny around India’s crypto sector, CoinDCX co-founders Sumit Gupta and Neeraj Khandelwal were reportedly detained by Thane Police over allegations tied to a crypto investment fraud case. The Economic Times reported the arrest, citing local officials, while other outlets indicated the founders were summoned for questioning rather than formally arrested, illustrating the evolving and sometimes contradictory nature of the case.
The centerpiece of the case is a website alleged to imitate the CoinDCX platform and a first information report filed by a 42-year-old insurance consultant who claims to have lost about 71 lakh Indian rupees (roughly $75,000) after being lured to invest via the fake site. In a post on X, CoinDCX said the FIR was false and filed as a conspiracy by impersonators who redirected funds to third-party accounts with no connection to the exchange. The company said it is fully cooperating with law enforcement and stressed that brand impersonation and cyber fraud are growing issues for India’s digital-finance ecosystem.
Key takeaways
- Alleged arrest tied to a branded impersonation fraud case; local reporting varies on whether Gupta and Khandelwal were arrested or summoned for questioning.
- The FIR centers on a counterfeit CoinDCX site and a loss claim of about 71 lakh INR (~$75,000) from a 42-year-old insurance consultant.
- CoinDCX asserts the FIR is a conspiracy by impersonators and that funds were moved to third-party accounts unrelated to the exchange; the firm says it is cooperating with authorities.
- Scale of brand impersonation: CoinDCX said more than 1,212 impersonation websites targeting its coindcx.com domain were reported between April 1, 2024, and January 5, 2026.
Impersonation case and alleged fraud
The core allegations hinge on a counterfeit CoinDCX website designed to mislead investors and divert them to fraudulent destinations. The FIR, reportedly filed by a 42-year-old insurance consultant, claims losses of approximately 71 lakh INR. While media coverage varies on whether the founders were arrested or questioned, the episode highlights a persistent vulnerability in India’s crypto landscape: brand impersonation and fraudulent schemes that prey on users seeking mainstream platforms.
CoinDCX’s response and ongoing investigation
CoinDCX issued a statement via X denying the FIR as false and described as “a conspiracy by impersonators” the attempt to pin wrongdoing on its founders. The exchange emphasized that the funds in question were diverted to third-party accounts without any connection to CoinDCX. The firm reiterated its cooperation with law enforcement and framed the incident as part of a broader wave of impersonation and cyber fraud targeting digital finance users. The company also signaled a broader commitment to user education and awareness as part of its response strategy.
Phishing and security challenges in India’s crypto landscape
The incident arrives against a backdrop of growing concern about phishing and brand impersonation in India’s crypto space. CoinDCX has warned that impersonation and domain-squatting attacks have become increasingly common as criminals attempt to capitalize on public trust in recognizable platforms. The company said it has logged thousands of impersonation attempts, with more than 1,212 fake sites impersonating its coindcx.com domain reported across a period spanning 2024 to early 2026. The episode reflects a broader, ongoing problem of deceptive online schemes that target crypto users in India.
Broader risk environment for investors and Web3
Experts note that the Indian market is contending with a surge in online investment scams. Data cited by Insights IAS from India’s Ministry of Home Affairs indicate that investment scams accounted for about 76% of all financial losses in 2025. On a global scale, Web3 platforms faced substantial losses from hacks and exploits in 2025—reported at around $3.95 billion—underscoring the risk environment facing users and operators alike.
CoinDCX’s trajectory amid growth and scrutiny
Founded in 2018 and based in Mumbai, CoinDCX has established itself as one of India’s leading crypto exchanges. Its valuation rose to about $2.45 billion following a funding round that included Coinbase Ventures in October 2025, marking a high-profile milestone for Indian crypto infrastructure. The exchange has also faced its share of security incidents; in July 2025, attackers reportedly stole roughly $44 million from an internal operational account, a breach that CoinDCX described as one of the month’s largest losses, while stressing that customer assets remained unaffected. The episode added to concerns about internal controls and security governance within crypto firms, even as the platform continued to push for mainstream adoption and regulatory clarity.
As authorities continue to investigate the latest allegations, observers will be watching for official statements from Thane Police and any subsequent charges or clarifications. The case could influence how regulators in India approach exchange transparency, user protection, and branding risks, particularly as the country charts its path toward broader crypto participation and governance.
What remains uncertain is how the investigation will unfold and what it could mean for CoinDCX’s brand and user trust in the near term. Investors, users, and builders should monitor regulatory responses, updates from law enforcement, and how exchanges reinforce anti-impersonation measures as part of a broader push for safer digital finance in India.


Brazil’s new Finance Minister, Dario Durigan, has decided to delay a public consultation on crypto taxation.
Summary
- Brazil’s Finance Minister halts crypto tax consultation to avoid election-year controversy.
- Durigan shifts focus to tech regulation and financial reforms, postponing crypto tax issues.
- Brazil remains the largest crypto market in Latin America despite tax consultation delay.
At the same time, this move comes as the government shifts its focus toward the October presidential election. Durigan, who took office last Friday, aims to avoid controversial tax measures during this politically sensitive period.
Durigan’s decision to pause the consultation on crypto taxation is seen as part of a broader fiscal delay strategy. The consultation was expected to address the tax treatment of crypto flows, particularly those involving stablecoins.
The Brazilian central bank had recently finalized rules that brought crypto service providers under financial sector regulations, requiring them to obtain operational authorization. These rules also placed stablecoin transactions and virtual assets used for international transfers under foreign exchange market oversight.
The Finance Ministry consultation was seen as the next step in Brazil’s evolving crypto framework, but Durigan’s decision to shelve it signals that tax measures will not be a priority during an election year. The sources close to the matter indicated that Durigan aims to conserve political capital and avoid potentially divisive issues in Congress.
Instead of crypto-related taxation, Durigan’s legislative priorities will center around big tech regulation, financial institution crisis management, and the Redata data center investment program. These issues align with his broader goal of driving economic development and fostering a favorable business environment in Brazil.
The delay in the crypto tax consultation is also part of a wider pause on fiscal proposals, including a previous plan to end tax exemptions on investment securities. This proposal, which failed to gain traction in Congress last year, may be postponed until after the 2026 presidential mandate.
Moreover, Brazil remains the largest crypto market in Latin America, ranking fifth globally in the Chainalysis Global Crypto Adoption Index. The country has seen increased institutional interest in crypto, with major investments such as Paradigm’s $13.5 million Series A funding for the stablecoin startup Crown.
Despite the tax consultation being on hold, crypto service providers must still meet the compliance deadline set for November 2026.


A stablecoin linked to the crypto project Resolv Labs, Resolv USR (USR), has lost its peg to the US dollar after an attacker exploited the token’s contract.
Summary
- Resolv USR lost its peg after an attacker minted millions of unbacked tokens.
- The hacker quickly converted the minted tokens into stablecoins and Ether.
- Resolv Labs has paused operations and is investigating the exploit, with a recovery plan underway.
Meanwhile, the attacker was able to mint millions of tokens without backing, leading to a sharp devaluation of the token. Resolv Labs has paused the protocol to prevent further damage and is working on a recovery plan.
Resolv Labs confirmed the exploit on Sunday, explaining that an attacker had minted 50 million USR tokens using $100,000 worth of the stablecoin USDC. Crypto security company PeckShield later reported that the attacker also managed to mint an additional 30 million USR tokens. The vulnerability in USR’s contract allowed the attacker to create unbacked tokens, contributing to the token’s depeg from the US dollar.
According to D2 Finance, the minting function in the contract was compromised. The company suspects that either the oracle was manipulated, the off-chain signer was compromised, or the amount validation process was flawed, enabling the minting of excess tokens.
After the exploit, the attacker moved the newly minted USR tokens to various crypto protocols, swapping them for stablecoins like USDC and USDt, and then converting them into Ether (ETH). This aggressive exit strategy caused USR’s value to plummet. The token fell as low as 50 cents, and liquidity issues and slippage worsened across protocols. On Curve Finance, the token briefly crashed to 2.5 cents.
At the time of writing, USR was trading around 87 cents, still approximately 13% below its intended $1 peg. The token had a rapid price recovery on Curve Finance, climbing to 84.5 cents after hitting its low point at 2:38 am UTC.
Resolv Labs has paused all protocol functions to prevent further malicious activity. The team is actively investigating the exploit and working on a recovery plan.
The exploit comes at a time when crypto-related hacks have decreased, with $49 million lost in February compared to $385 million in January. However, the attack highlights the continued risks and vulnerabilities within the crypto space, especially in decentralized finance protocols.


The U.S. Commodity Futures Trading Commission (CFTC) has provided more details on its pilot program that allows cryptocurrencies to be used as collateral in derivatives markets. The new guidance was issued in response to frequently asked questions about the program that began last year.
Summary
- CFTC allows crypto as collateral in derivatives, following a pilot program.
- FCMs must apply a 20% capital charge for Bitcoin and Ether positions.
- Crypto cannot be used for uncleared swaps, but is allowed for cleared transactions.
The CFTC’s recent notice outlines the procedures for futures commission merchants (FCMs) wishing to participate in the pilot program. FCMs are required to file a notice with the Market Participants Division and specify the date they will begin accepting crypto assets as margin collateral. This development is part of the CFTC’s ongoing efforts to integrate crypto assets into traditional financial markets.
The CFTC’s pilot allows for the use of crypto as collateral in derivatives transactions, a move that aligns with the crypto industry’s push for 24/7 trading and immediate settlement. The guidance issued in December clarified which tokenized assets can be used as collateral and how they should be valued and calculated for trading positions.
Capital Charges and Aligning with SEC Guidelines
The CFTC made it clear that its guidance on capital charges would align with the Securities and Exchange Commission (SEC). Futures commission merchants must apply a 20% capital charge for positions in Bitcoin and Ether, while stablecoins will carry a 2% charge. This move is aimed at ensuring that both agencies maintain consistent regulatory approaches to crypto.
During the first three months of the pilot, FCMs can only accept Bitcoin, Ether, and stablecoins as collateral. They are also required to file weekly reports detailing the total amount of crypto held across customer account types. After three months, other cryptocurrencies can be accepted as collateral, and the reporting requirements will be lifted.
The CFTC also specified that proprietary payment stablecoins are the only ones that can be deposited as residual interest in customer segregated accounts. Additionally, the use of crypto and stablecoins as collateral for uncleared swaps is prohibited.
Crypto assets cannot be used as collateral for uncleared swaps. However, derivatives clearing organizations can accept Bitcoin, Ether, and stablecoins as initial margin for cleared transactions if the assets meet CFTC’s credit, market, and liquidity risk requirements.


Kalshi, a prediction market company, has faced a temporary setback in Nevada. A state judge issued a temporary restraining order, blocking the company from operating for 14 days. The decision follows concerns that Kalshi’s event contracts might violate Nevada’s gambling laws.
Summary
- Kalshi faces a 14-day ban in Nevada after violating the state’s gambling regulations.
- Nevada regulators claim Kalshi’s event contracts are unlicensed gambling under state law.
- Kalshi fights back in multiple states, including Arizona and Massachusetts, over illegal gambling accusations.
On Friday, Carson City District Court Judge Jason Woodbury granted a temporary restraining order, siding with the Nevada Gaming Control Board’s motion to block Kalshi. This comes after the company offered event contracts related to sports, elections, and entertainment, which Nevada regulators view as a form of unlicensed gambling.
The court ruling states that Kalshi is prohibited from offering such contracts in Nevada, as these are considered “sports pools” under state law. Kalshi, however, has not responded to the ruling.
Nevada Gaming Control Board Chair Mike Dreitzer emphasized the state’s responsibility to protect the public, asserting that prediction markets like Kalshi could facilitate illegal gambling.
“Prediction markets, to the extent they facilitate unlicensed gambling, are illegal in Nevada,” Dreitzer said in a statement to Reuters.
Kalshi had argued that its contracts fall under the jurisdiction of the Commodity Futures Trading Commission (CFTC), not Nevada’s gaming regulations. The company has fought similar accusations in other states, asserting that its activities are federally regulated.
However, Judge Woodbury rejected Kalshi’s defense, stating that the legal authority currently favors Nevada’s stance. The court’s decision sets a precedent for ongoing legal battles regarding prediction markets and their regulation across state lines.
Moreover, Kalshi is currently engaged in multiple legal disputes with state regulators. This includes a case in Massachusetts, where a state judge banned the company from offering sports event contracts, though this ban was later lifted on appeal.
Additionally, Arizona has filed criminal charges against Kalshi, accusing the company of running an illegal gambling operation. Kalshi CEO Tarek Mansour has labeled these charges as “total overstep.”


CoinDCX, an Indian cryptocurrency exchange backed by Coinbase, is embroiled in a fraud case involving its founders, Sumit Gupta and Neeraj Khandelwal.
Summary
- CoinDCX founders questioned over a $75K fraud involving fake websites impersonating the platform.
- Over 1,200 websites impersonating CoinDCX were reported, highlighting rising cyber fraud in India.
- Investment scams accounted for 76% of all financial losses in India in 2025, according to reports.
Meanwhile, the founders were questioned by authorities following allegations of their involvement in a crypto investment scam. However, CoinDCX denies the accusations and attributes the fraud to impersonators using its brand for fraudulent activities.
The controversy started after a complaint from a 42-year-old insurance consultant, who claimed to have lost around 71 lakh rupees (roughly $75,000) after investing in a fake website posing as CoinDCX. The Thane Police reportedly arrested Gupta and Khandelwal on allegations of criminal breach of trust. However, other reports suggested that the founders were merely questioned by the authorities rather than arrested.
CoinDCX responded to the claims, stating that the complaint was part of a broader scheme by fraudsters who impersonated the exchange. The company clarified that it had no connection to the fake website and assured the public that funds were diverted by external parties unrelated to the exchange.
CoinDCX has emphasized that brand impersonation and cyber fraud are growing issues in India’s digital finance sector. The exchange stated that it is fully cooperating with law enforcement authorities in their investigation and stressed the importance of educating users about online fraud.
The company revealed that between April 2024 and January 2026, over 1,200 websites had impersonated its domain. This highlights the increasing risks of phishing attacks targeting crypto users in India, with CoinDCX working to combat such fraud.
A Broader Issue of Investment Scams
The case comes amid a rise in investment scams in India, which accounted for 76% of all financial losses in 2025, according to data from the Ministry of Home Affairs. Globally, Web3 platforms also faced significant losses due to hacking and exploitation, amounting to nearly $4 billion in 2025.
CoinDCX, founded in 2018, is one of India’s leading crypto exchanges, with a valuation of $2.45 billion after an investment from Coinbase Ventures in 2025. Despite the recent controversy, the platform remains committed to maintaining user security and combating fraudulent activities.

A prominent crypto influencer is speaking out about the fallout from promoting a memecoin that unraveled just days after its 2024 launch. Hailey Welch, popularly known as the Hawk Tuah girl, says the HAWK memecoin episode left lasting scars after a rapid rise and a dramatic collapse, and she stresses she did not profit from the project or help launch it.
Welch told Channel 5 in a recent interview that she fully cooperated with a Federal Bureau of Investigation (FBI) probe conducted in 2025, which she says cleared her of any wrongdoing. She also emphasized that she did not possess any of the memecoin’s funds and lacked the technical expertise to launch the coin herself. The experience, she says, took a toll on her mental health as she faced intense scrutiny and threats in the wake of the controversy.
“I was starting to get death threats and everything else. People telling me I owe them all this money, and I’m like, ‘I didn’t do this.’ I’m sitting here, and I’m the one getting hit for this. It’s rough. It’s one of those things where if you come out of the house, you put your head down.”
Despite Welch’s portrayal of the episode as a case of mistaken involvement, not everyone in crypto’s investigative community is sympathetic. On-chain sleuth ZachXBT criticized the backlash, arguing that promoters should bear responsibility when they publicly endorse meme coins that turn out to be high-risk bets. “No one should feel bad for the ‘trauma,’” he wrote, pointing to Welch’s decision to promote the token despite warnings from crypto Twitter, and later stepping away from social media as followers lost funds.
Key takeaways
- HAWK launched in December 2024 and quickly surged to a market cap north of $490 million within hours of going live, according to market trackers.
- The following day, the project collapsed by more than 91%, bringing its market cap down to about $41 million and sparking characterizations of a rug pull.
- An investor lawsuit was filed in December 2024 against the teams behind the memecoin, alleging the sale of unregistered securities; Welch was not named in the suit.
- Welch says she cooperated with a 2025 FBI inquiry that cleared her of wrongdoing, and that she neither owned funds from the launch nor had the technical capability to create the token.
- Despite the claims of broad investor losses, Welch’s legal team characterized the total dollar losses by retail investors as around $200,000, while she described the impact as disproportionately harsh on her personally due to threats and public scrutiny.
- Crypto observers remain divided: supporters say the episode underscores risks of influencer endorsements in memecoin hype, while critics argue that promoters should be accountable for the consequences of their campaigns.
The rise, collapse, and aftermath of the HAWK meme
The HAWK memecoin’s December 2024 debut drew immediate attention, with the token vaulting to a multi-hundred-million-dollar valuation in a matter of hours. Market trackers subsequently show the project losing momentum at a breathtaking pace, delivering a dramatic fall from grace as investor confidence eroded and liquidity questions surfaced. Within 24 hours of launch, the market capitalization had receded to roughly $41 million, a drop of more than 90% from its peak. The episode has since been widely described as a rug pull by observers who tracked the token’s early performance and post-mortem discussions in the community.
The public fallout extended beyond market data. In December 2024, an investor lawsuit was filed against the entities behind the memecoin’s launch, alleging the sale of unregistered securities. Welch, who had publicly promoted the token, was not named in the suit, but the case underscored the broader regulatory and legal risks tied to promoter-backed memes amid a crowded field of similar campaigns. The case added to a growing chorus calling for greater scrutiny of token offerings that hinge on celebrity or influencer endorsements rather than foundational project fundamentals.
Context, accountability, and what to watch next
Welch’s account highlights the ethical and personal stakes around influencer involvement in meme coins. She contends that she did not profit from the project and did not facilitate its launch, while still bearing the social and mental health consequences of the episode. The FBI’s involvement—according to Welch—yielded a clearing conclusion, though the broader debate about due diligence and disclosure remains active in crypto circles.
From a market dynamics perspective, the HAWK episode illustrates several enduring tensions in the meme-coin niche: how quickly hype can translate into astronomical valuations, how swiftly sentiment can reverse, and how investor protections lag behind the speed of social media-driven campaigns. For investors, the episode reinforces the importance of scrutinizing promoters’ claims, the provenance of a token, and the clarity of regulatory disclosures before participating in a launch. For builders and platforms, it underscores the necessity of clear governance and compliance frameworks to mitigate the risk of similar episodes undermining trust in the ecosystem.
As regulators and the crypto community continue to grapple with these questions, readers should watch for developments around enforcement actions tied to promoter-led token launches, potential updates to how unregistered securities are treated in meme-powered campaigns, and whether more empirical data will emerge on the real-world losses borne by retail participants in such episodes.
Readers should stay tuned to further statements from involved parties and to updates on any legal proceedings, as the broader narrative around influencer-led memecoins continues to evolve and shape the conversation about accountability in the space.


Hailey Welch, known as the “Hawk Tuah girl,” recently spoke about the fallout from the failed launch of the “HAWK” memecoin in 2024, which she promoted.
Summary
- Hailey Welch was cleared of wrongdoing after promoting HAWK memecoin despite facing backlash and death threats.
- The HAWK memecoin, valued at $490M, collapsed to $41M in hours, triggering legal action.
- Despite FBI clearance, Welch faced emotional struggles and continued public criticism after the memecoin’s failure.
Despite cooperating fully with an FBI investigation that cleared her of wrongdoing, Welch faced immense social backlash and personal distress following the memecoin’s collapse.
In December 2024, the HAWK memecoin launched with great fanfare, quickly surging to a market capitalization of over $490 million. However, within hours, the coin’s value dropped sharply, losing over 90% of its value. By the following day, the market cap had fallen to about $41 million. The event was widely described as a rug pull, where investors were left with significant losses.
Welch, who had publicly promoted the token, said that she was unaware of the technical details behind the launch and had no control over the funds. She added that the financial losses for investors were relatively small, estimating the total at around $200,000. However, the social and emotional toll was much greater.
Following the HAWK memecoin’s collapse, Welch received death threats and experienced heightened public scrutiny.
“I was starting to get death threats and everything else. People telling me I owe them all this money, and I’m like, ‘I didn’t do this,’” Welch explained.
She admitted that the backlash took a significant toll on her mental health, causing her to retreat from social media and try to maintain a low profile for months.
Welch’s lawyer emphasized that she had fully cooperated with the FBI investigation, which ultimately found no evidence of fraud or intentional wrongdoing on her part. Despite this, the public backlash continued, with many in the crypto community blaming her for promoting the memecoin.
Legal action and public reactions
After the HAWK memecoin’s collapse, an investor lawsuit was filed against the team behind the launch. The lawsuit accused the entities of selling unregistered securities, but Welch was not named as a defendant. The legal action pointed to the alleged mismanagement and fraudulent nature of the memecoin’s promotion.
Despite Welch’s claims of being a victim of the situation, not all observers were sympathetic. Onchain investigator ZachXBT criticized her involvement in the project, stating,
“She starts posting about meme coins. The entirety of [crypto Twitter] tells her ‘do not launch a token.’ She launches a memecoin anyway, and after, she blames partners and disappears off social media, with followers losing funds.”

Indian crypto exchange CoinDCX co-founders Sumit Gupta and Neeraj Khandelwal have reportedly been arrested in India following a police complaint alleging their involvement in a crypto investment fraud.
The Economic Times reported Saturday that the pair were arrested by the Thane Police on allegations of criminal breach of trust, citing local officials. Other local media, including Entrackr, reported that the founders had been called for questioning rather than arrested.
The case reportedly centers on a website that allegedly posed as the CoinDCX platform and stemmed from a first information report (FIR) filed by a 42-year-old insurance consultant who claimed to have lost about 71 lakh Indian rupees (roughly $75,000) after being lured to invest via the fake site, according to an earlier report by the Times of India.
In a statement on X, CoinDCX said the FIR was “false and filed as a conspiracy” by impersonators posing as its founders and diverting funds to third-party accounts that it said had no connection to the exchange.

The company described brand impersonation and cyber fraud as growing problems in India’s digital finance sector and stressed that it was “fully cooperating with the relevant law enforcement authorities,” while remaining focused on user education and awareness.
Related: Hong Kong retiree loses $840K in triple ‘crypto expert’ scam
CoinDCX added that between April 1, 2024, and Jan. 5, 2026, it had reported more than 1,212 websites impersonating its coindcx.com domain, highlighting the scale of phishing and impersonation attacks that have increasingly plagued Indian crypto users.
Investment scams and Web3 losses
The case comes amid a broader rise in online investment scams in India. According to data from the Ministry of Home Affairs cited in Insights IAS, investment scams accounted for 76% of all financial losses in 2025. Globally, Web3 platforms lost around $3.95 billion to hacks and exploits in 2025.
Founded in 2018 and based in Mumbai, CoinDCX is one of India’s best-known crypto trading platforms and was valued at about $2.45 billion after an investment from Coinbase Ventures in October 2025.
The exchange has also faced questions over security after a July 2025 breach in which attackers stole roughly $44 million from an internal operational account, an incident that made CoinDCX one of that month’s largest hacking victims by losses, though the company said customer assets were not affected.
Big Questions: Is China hoarding gold so yuan becomes global reserve instead of USD?

Bitcoin Update
Who is wealthier – US or Eurozone?

Cyclist Debora Silvestri breaks five ribs in horror Milan-San Remo crash


-

 Tech7 days ago
Your Legally Registered ‘Motorcycle’ Might Not Count Under Proposed US Law
-

 Fashion2 days ago
Weekend Open Thread: Adidas – Corporette.com
-

 Politics2 days ago
Jenni Murray, Long-Serving Woman’s Hour Presenter, Dies Aged 75
-
 Tech5 days ago
Are Split Spacebars the Next Big Gaming Keyboard Trend?
-

 Crypto World13 hours ago
Best Crypto to Buy Now: Strategy Just Spent $1.57 Billion on Bitcoin During Fear While Early Investors Quietly Enter Pepeto for 150x Potential
-

 News Videos4 days ago
RBA board divided on rate cut, unusually buoyant share market | Finance Report | ABC NEWS
-

 Crypto World14 hours ago
Bitcoin Price News: Bhutan Sells $72 Million in BTC Under Fiscal Pressure, but the Smart Money Entering Pepeto Sees What the Market Does Not
-

 Business7 days ago
Search for Savannah Guthrie’s Mother Enters Seventh Week with No Arrests
-
 Crypto World2 days ago
NIO (NIO) Stock Plunges 6.5% as Shelf Registration Sparks Dilution Worries
-

 Business6 days ago
Australian shares drop as Iran war enters third week
-

 Crypto World6 days ago
Crypto Lender BlockFills Enters Chapter 11 with Up to $500M in Liabilities
-

 Politics4 days ago
The House | The new register to protect children from their abusers shows Parliament at its best
-

 Fashion6 days ago
25 Celebrities with Curly Hair That Are Naturally Beautiful
-

 Tech2 days ago
inKONBINI Lets You Spend Summer Days Behind the Register
-

 Crypto World4 days ago
Canada’s FINTRAC revokes registrations of 23 crypto MSBs in AML crackdown
-
 Politics5 days ago
Real-time pollution monitoring calls after boy nearly dies
-
 NewsBeat4 days ago
Residents in North Lanarkshire reminded to register to vote in Scottish Parliament Election
-

 Business6 days ago
Meta planning major layoffs as AI spending and automation reshape workforce
-

 News Videos4 days ago
PARLIAMENT OF MALAWI – PAC MEETING WITH REGISTRAR OF FINANCIAL ON AMARYLLIS HOTEL – INQUIRY LIVE
-
 Crypto World7 days ago
U.S. Oil Companies Post Record Profits as Oil Prices Break $100
You must be logged in to post a comment Login