
Crypto World
Buying Bitcoin? Hold at least 3 years to avoid losses, data shows

Bitcoin (CRYPTO: BTC) has repeatedly tested patient investors, and a long-hold thesis appears increasingly robust when examined through multi-year price histories. A Bitwise Europe study looking at BTC’s price data from mid-2010 through early 2026 finds that the odds of ending a multi-year position in the red shrink dramatically as the holding window extends. In particular, three-year holders show a loss probability of just 0.70%, with even smaller risk over longer horizons. The findings map onto a broader narrative: while near-term volatility and macro headwinds persist, the longest-dated exposure has historically delivered favorable outcomes for those who ride out cycles. The debate around price targets for 2026–2027 remains lively among analysts and researchers, with forecasts ranging widely.
Key takeaways
- A three-year BTC holding has a 0.70% chance of ending in loss; five-year horizons drop to 0.2%, and ten-year horizons sit at 0% based on the Bitwise Europe dataset covering July 2010–Feb. 11, 2026.
- Shorter horizons carry higher risk: intraday BTC positions were 47.1% underwater, with the probability staying elevated at 44.7% over one week, 43.2% over one month, and 24.3% over a one-year window.
- As of a recent Saturday, BTC traded near $65,000 after a roughly 50% decline from the October 2025 peak; the three-to-five year realized price sits around $34,780, meaning long-hold investors in that window remain roughly 90% in profit.
- Cost-basis insights show the depth of drawdowns varied by holding period: those in the 6–12 month band carried a cost basis near $101,250, while the 1–2 year cohort hovered around $78,150, illustrating how longer horizons dampen drawdowns during corrections.
- Forecasts for 2026–2027 remain divergent. Bernstein has kept a bullish target of $150,000 for 2026, while Standard Chartered warns of potential downside toward $50,000 amid weak ETF flows before a recovery toward $100,000 by year-end. Timothy Peterson’s framework points to around $122,000 by early 2027, with odds skewing toward a level above that mark. Some analysts even flag a scenario where a drop toward $30,000 could intensify, should negative forces persist.
Tickers mentioned: $BTC
Market context: The analysis arrives as the macro backdrop and spot-Bitcoin ETF dynamics shape liquidity and sentiment. While near-term moves remain volatile, the data emphasize a structural resilience for long-duration exposure, complicating calls that rely solely on short- or medium-term price actions.
Why it matters
The central takeaway for investors weighing risk and time horizons is that holding Bitcoin for longer stretches has historically reduced downside risk. The Bitwise Europe analysis synthesizes decades of price history to illustrate a simple trade-off: time in the market tends to smooth out volatility and limit losses, even as drawdowns occur along the way. For market participants who favor patient exposure over quick wins, the results reinforce the strategic value of a multi-year horizon when assessing BTC’s risk profile.
But the narrative is nuanced. While long-hold cohorts show impressive downside resistance, shorter-term traders faced meaningful drawdowns during correction cycles. The intraday and weekly metrics underscore that market timing remains a challenging game. Investors who entered positions within the last year or two found themselves under considerable pressure during bear-market rallies and capitulation phases. The realized-price framework adds another layer: even as Bitcoin’s price dips, the difference between current levels and multi-year realized prices can offer a proxy for whether a given entry remains profitable on a longer horizon.
What to watch next
- Track ETF flows and price action around key levels: Bernstein notes modest net outflows from spot Bitcoin ETFs (around 7%), a dynamic that could influence near-term price action.
- Watch for potential downside catalysts: some scenarios point to BTC testing the $30,000 region if macro and ETF dynamics worsen further, which would compress the cushion for long-term holders.
- Observe longer-horizon projections evolving: Peterson’s model suggests roughly $122,000 by early 2027, while other analysts maintain targets near six figures or higher depending on liquidity conditions and risk sentiment.
- Monitor realized-price indicators as a gauge of profitability across aging cohorts: data from Glassnode’s realized-price-by-age charts help contextualize whether current prices justify holding or adding to positions over time.
Sources & verification
- Bitwise Europe research lead Andre Dragosch’s data referencing BTC price history from July 17, 2010, to February 11, 2026, showing loss probabilities by holding period. Link: X post.
- Glassnode data on BTC realized price by age, used to illustrate realized-profit dynamics across holding windows: Realized price by age.
- Bernstein’s price target for Bitcoin at $150,000 in 2026: Bernstein analysis.
- Standard Chartered commentary on ETF flows and BTC price implications, including a potential move toward $50,000 and a recovery toward $100,000 by end-2026: Standard Chartered note.
- Timothy Peterson’s historical price-metric projection of around $122,000 by early 2027: Peterson model.
- Analyses discussing a potential price bottom around $30,000: BTC to $30k discussion.
Market reaction and key details
Bitcoin’s long-hold resilience narrative sits at the intersection of empirical price histories and forward-looking forecasts. The Bitwise Europe findings underscore a fundamental principle of risk management in crypto: time can be a mitigating factor against pronounced drawdowns, particularly for assets with long and volatile price trajectories like BTC. As of the latest data points, the price remains well above the 3–5 year realized-price band, suggesting investors who carried positions across that horizon stayed financially advantaged despite recent declines. Yet, with near-term price action vulnerable to ETF flow shifts and macro surprises, the timing of new entries or additions warrants careful consideration.
What this means for investors and the market
For builders and institutions, the message is clear: a multi-year exposure approach continues to be a meaningful risk management lever, provided entrants understand that near-term volatility can erase short-term gains. For traders and retail participants, the findings reinforce the importance of horizon management—knowing when to trim, when to accumulate, and how to interpret realized-price signals that contextualize profitability over time. As the debate over BTC’s fair value stretches into 2027, the balance between outflows from ETF products, macro momentum, and the technical price regime will increasingly shape the space. The data do not guarantee outcomes, but they do illuminate how holding patterns have historically influenced risk and reward in one of crypto’s most scrutinized markets.
What to watch next
- ETF flow dynamics and their impact on spot BTC liquidity (watch for updates on net inflows/outflows and price correlation).
- Key downside risk scenarios, including any approach toward the $30,000 level and the subsequent implications for longer-term holders.
- Updated price targets for 2026–2027 from major analysts, including revisions to mid- or high-five-figure forecasts.
- New data from realized-price analyses that track aging cohorts, offering updated insight into profitability by holding window.
Rewritten article: Understanding the enduring appeal of patience in BTC
Bitcoin (CRYPTO: BTC) has long been framed as a volatile asset class that tests the nerves of investors seeking quick profits. Yet, a synthesis of long-run price history and contemporary market dynamics suggests that the most durable gains may accrue to those who commit to time rather than timing. The Bitwise Europe analysis, which combs through BTC’s price journey from 2010 to early 2026, indicates a striking pattern: the longer you ride the cycle, the less likely you are to sit on losses. Specifically, a three-year holding period yields a loss probability of just 0.70%, while five-year and ten-year windows reduce the risk even further to 0.2% and 0%, respectively.
To put those figures into perspective, the risk calculus for traders who enter BTC positions with shorter horizons is markedly more precarious. Intraday entries show nearly half the time ending underwater, with 47.1% of positions in negative territory. The risk persists, albeit at different magnitudes, over one week (44.7%), one month (43.2%), and even a year (24.3%). These numbers illuminate a pattern: the shorter the time frame, the greater the exposure to abrupt price moves and regime shifts. It helps explain why many seasoned crypto investors emphasize patience and disciplined risk management as essential components of a successful strategy in this space.
The price action context is equally important. As of a recent Saturday, BTC traded around $65,000, roughly half its October 2025 high. Yet the longer-term perspective remains constructive when contrasted with realized-prices: the 3–5 year realized price sits near $34,780, implying that participants who bought around that window and held through the recent drawdown were still sitting on about a 90% profit. This contrast between current market price and multi-year realization offers a tangible signal for investors evaluating whether to add to positions or hold steady through volatility. The historical frame invites readers to consider not just where Bitcoin is today, but where it has been over the last decade and how those cycles tested the resilience of long-term holders.
Forecasts for the 2026–2027 horizon remain divergent, reflecting the many moving parts that drive crypto markets. Bernstein has maintained a bold target of $150,000 for Bitcoin in 2026, arguing that relatively modest outflows from spot-Bitcoin ETFs could sustain a price trajectory higher, even as the asset retrenched by roughly 50% from its prior peak. The analysts characterized the current price action as a “crisis of confidence,” suggesting that sentiment rather than fundamentals is a primary swing factor in the near term. On the other side of the ledger, Standard Chartered has warned of a possible “final capitulation” phase that could pull BTC toward $50,000, driven by weak ETF flows and a softer macro backdrop, before restoring momentum toward the $100,000 mark by year-end 2026. Timothy Peterson’s framework, which leverages a historical average-return approach, points to around $122,000 by early 2027, with a substantial likelihood of trading above that level.
Beyond these headlines, a broader data story centers on the aging of holders and the corresponding realized-price dynamics. Glassnode’s charts of realized price by age underscore a recurring pattern: the cost basis and drawdown profiles depend heavily on how long investors have held their BTC. The 6–12 month cohort, for instance, shows a cost basis near $101,250, translating to about a 35% unrealized loss at a given snapshot, while the 1–2 year cohort sits closer to $78,150, implying roughly a 15% unrealized loss. The practical takeaway is that longer holding horizons tend to dampen the severity of corrections, a trend that aligns with the three-year risk reductions highlighted in the Bitwise analysis. For readers tracking the macro picture, the conversation about ETF flows, risk sentiment, and regulatory signals remains essential, as these factors are likely to influence whether the market shakes off or sustains the next leg higher.
Looking ahead, the path for Bitcoin remains as much about risk management as about price discovery. The consensus between long-hold data and bearish risk scenarios suggests a bifurcated market: patient investors could ride out volatility and exit with meaningful gains, while shorter-term traders might face amplified drawdowns if macro or policy dynamics tilt unfavorably. As with prior cycles, the market’s future hinges on how liquidity, sentiment, and structural demand—whether via ETFs or institutional participation—interact with the entrenched volatility that has defined BTC since its inception. In that context, the discipline of holding—paired with vigilant risk assessment—appears to be the most durable approach for navigating Bitcoin’s evolving landscape.


As platforms such as Polymarket gain mainstream visibility during U.S. election cycles and major geopolitical events, their prices are increasingly cited as real-time signals of truth. The pitch is seductive: let people put money behind beliefs, and the market will converge on reality faster than polls or pundits. But that promise collapses when a contract creates a financial incentive for someone to change the very outcome it claims to measure.
The problem is not volatility. It is design.
When a forecast becomes a plan
The most extreme example is the assassination market, a contract that pays if a named individual dies by a certain date. Most major platforms do not list anything so explicit. They do not have to. The vulnerability does not require a literal bounty.
It only requires an outcome that a single actor can realistically influence.
Consider a sports-adjacent case: a prop market on whether there will be a pitch invasion during the Super Bowl. A trader takes a large position on “yes,” then runs onto the field. It is not hypothetical. It has happened. That is not a prediction. It is execution.
The same logic extends well beyond sports. Any market that can be resolved by one person taking one action, filing one document, placing one call, triggering one disruption or staging one stunt embeds an incentive to interfere. The contract becomes a script. The trader becomes the author.
In those cases, the platform is not aggregating dispersed information about the world. It is pricing the cost of manipulating it.
Political and event markets carry a higher risk
This vulnerability is not evenly distributed across the prediction universe. It concentrates on thinly traded, event-based or ambiguously resolved contracts. Political and cultural markets are especially exposed because they often hinge on discrete milestones that can be nudged at relatively low cost.
A rumor can be seeded. A minor official can be pressured. A statement can be staged. A chaotic but contained incident can be manufactured. Even when no one follows through, the mere existence of a payout changes incentives.
Retail traders understand this instinctively. They know a market can be correct for the wrong reasons. If participants begin to suspect that outcomes are being engineered, or that thin liquidity allows whales to push prices for narrative effect, the platform stops being a credibility engine and starts looking like a casino with a news overlay.
Trust erodes quietly, then all at once. No serious capital operates in markets where outcomes can be cheaply forced.
“All markets are manipulable” misses the point
The standard defense is that manipulation exists everywhere. Match fixing happens in sports. Insider trading happens in equities. No market is pure.
That confuses possibility with feasibility.
The real question is whether a single participant can realistically manipulate the outcome they are betting on. In professional sports, results depend on dozens of actors under intense scrutiny. Manipulation is possible but costly and distributed.
In a thin event contract tied to a minor trigger, one determined actor may be enough. If the cost of interference is lower than the potential payout, the platform has created a perverse incentive loop.
Discouraging manipulation is not the same as designing against it.
Sports as a structural template
Sports markets are not morally superior. They are structurally harder to corrupt at the individual level. High visibility, layered governance, and complex multi-actor outcomes raise the cost of forcing a result.
That structure should be the template.
It is product integrity
Prediction platforms that want long-term retail trust and eventual institutional respect need a bright-line rule: do not list markets whose outcomes can be cheaply forced by a single participant, and do not list contracts that function as bounties on harm.
If a contract’s payout can reasonably finance the action required to satisfy it, the design is flawed. If resolution depends on ambiguous or easily staged events, the listing should not exist. Engagement metrics are not a substitute for credibility.
The first scandal will define the category
As prediction markets gain visibility in politics and geopolitics, the risks are no longer abstract. The first credible allegation that a contract was based on non-public information, or that an outcome was directly engineered for profit, will not be treated as an isolated incident. It will be framed as proof that these platforms monetize interference with real-world events.
That framing matters. Institutional allocators will not deploy capital into venues where the informational edge may be classified. Skeptical lawmakers will not parse the difference between open-source signal aggregation and private advantage. They will regulate the category as a whole.
The choice is simple. Either platforms impose listing standards that exclude easily enforceable or easily exploitable contracts, or those standards will be imposed externally.
Prediction markets claim to surface the truth. To do that, they must ensure their contracts measure the world rather than reward those who try to rewrite it.
If they fail to draw that line themselves, someone else will draw it for them.

The current Bitcoin (BTC) bear market can be explained by the four-year cycle and long-term BTC holders selling at the $100,000 psychological level, according to Anthony Scaramucci, managing partner of the SkyBridge investment firm.
Bitcoin’s four-year market cycle has been “muted” by institutional investors and inflows from BTC exchange-traded funds (ETFs) that have cushioned volatility, Scaramucci said, but the altered market dynamics have not fully erased BTC’s traditional cycles. He said:
“We’re in a four-year cycle, and there were some traditional whales, some OG’s, that believe in the four-year cycle, and guess what happens in life when you believe in something? You create a self-fulfilling prophecy.”
BTC will continue to see choppy price action for most of the year, until the fourth quarter of 2026, when prices will start to rise again in a new bull market cycle, he said.

Scaramucci said that market participants, including himself, were widely expecting BTC to climb to $150,000 in 2025, driven by US President Donald Trump’s pro-crypto agenda and US regulators warming up to the digital asset industry.
However, the October market crash, which dragged BTC down from an all-time high of about $126,000 to a low of $60,000, completely shattered the widely held consensus.
Markets often move in opposite ways to the prevailing investor sentiment, Scaramucci said, citing Bitcoin’s price action in the early months of 2023, following the November 2022 collapse of the FTX exchange, as an example.

“It was at a period of great disinterest and great apathy that the bull market started again,” he said, adding that the current BTC bear market is a “garden variety” correction in line with previous downturns.
To be sure, crypto industry executives, analysts, and market participants continue to debate whether Bitcoin’s four-year cycle theory is still valid after BTC ended 2025 in the red or if changing market dynamics have permanently altered how the price of BTC moves.
Related: Bitcoin price aims to hold $70K amid rising inflation concerns
Could Iran war and geopolitical turmoil bring BTC more pain?
The price of BTC fell below $69,000 on Saturday as the war in Iran entered its third week, jolting risk assets across the board.

Stock market investors saw the S&P 500 index extend its decline on Friday, dropping by about 1.3%. A day earlier the gauge closed below its 200-day moving average, a key technical indicator closely watched to assess the overall trend of equities markets, for the first time in 10 months.
Some analysts now forecast a potential 50% drop in BTC’s price in 2026 if it continues to exhibit a positive correlation with the S&P 500 index.
Magazine: The debate over Bitcoin’s four-year cycle is over: Benjamin Cowen
Crypto World
Bitcoin Holds as Gold Nears Bear Market: What the Divergence Says About Capital in 2026

TLDR:
- Gold has fallen nearly 20% from its highs, putting it close to official bear market territory in 2026.
- Bitcoin outperformed gold by roughly 20% since the Iran conflict started, per Whale Factor’s analysis.
- On an M2 liquidity basis, gold is trading near historical peak levels, signaling a long-term caution flag.
- Bitcoin remains in a consolidation range that mirrors pre-breakout patterns observed in previous market cycles.
Bitcoin is holding steady as gold slides toward bear market territory, raising fresh questions among traders. Gold has dropped nearly 20% from its recent peaks, while Bitcoin has held within its consolidation range.
This divergence is playing out against a backdrop of rising oil prices and persistent inflation pressures. The contrast is drawing attention to how capital behaves differently across asset classes during macro stress.
Gold Faces Macro Pressure From Rates and Rising Oil
Gold is now close to a technical bear market, down nearly 20% from its recent highs. This drop has persisted even as geopolitical tensions have remained elevated in recent months.
Higher-for-longer interest rates and rising oil prices have combined to weigh heavily on the metal. The issue appears rooted in macroeconomic conditions rather than in any single geopolitical event.
Crypto analyst CryptosRus pointed directly to macro conditions as the source of gold’s trouble. “Rates are staying higher for longer, and rising oil is pushing inflation expectations back up,” the analyst wrote.
That environment reduces demand for non-yielding assets like gold, as traders adjust their positions accordingly.
The liquidity picture is also working against gold on a longer-term basis. CryptosRus noted that gold, when measured against M2 money supply, is trading near historical peak levels.
That reading serves as a caution signal for investors tracking long-term price cycles. Meanwhile, elevated rates continue to offer competing returns that diminish gold’s relative appeal.
A recent trading session gave a concrete look at gold’s current vulnerabilities. Gold fell 5% as oil hit $100 per barrel and stocks touched new 2026 lows. Despite the risk-off environment, gold failed to draw the safe-haven demand traders typically expect.
Bitcoin Tracks Liquidity While Capital Behavior Shifts
Bitcoin has responded to the same environment in a markedly different manner. The asset has stayed within a consolidation range that resembles patterns seen in past market cycles.
Analysts tracking long-term Bitcoin behavior describe this phase as consistent with pre-breakout consolidation. That pattern, if sustained, could place Bitcoin in a more favorable position as macro conditions evolve.
Whale Factor, a market observer, noted the performance gap on one of gold’s worst recent sessions. “Gold crashed 5% today… Bitcoin? Down 1%,” the account wrote, pointing to the contrast directly. Bitcoin also outperformed gold by roughly 20% since the start of the Iran conflict.
On an M2-adjusted basis, Bitcoin is currently retesting its prior highs without a confirmed breakout. CryptosRus framed this as a liquidity retest, noting that a full breakout has not yet occurred. Still, the current setup mirrors historical patterns that preceded larger moves in prior cycles.
Bitcoin and gold are clearly absorbing the same macro conditions in very different ways. Gold is struggling under rate pressure, while Bitcoin continues to track long-term liquidity. The data, for now, shows Bitcoin holding ground in an environment where gold has not.

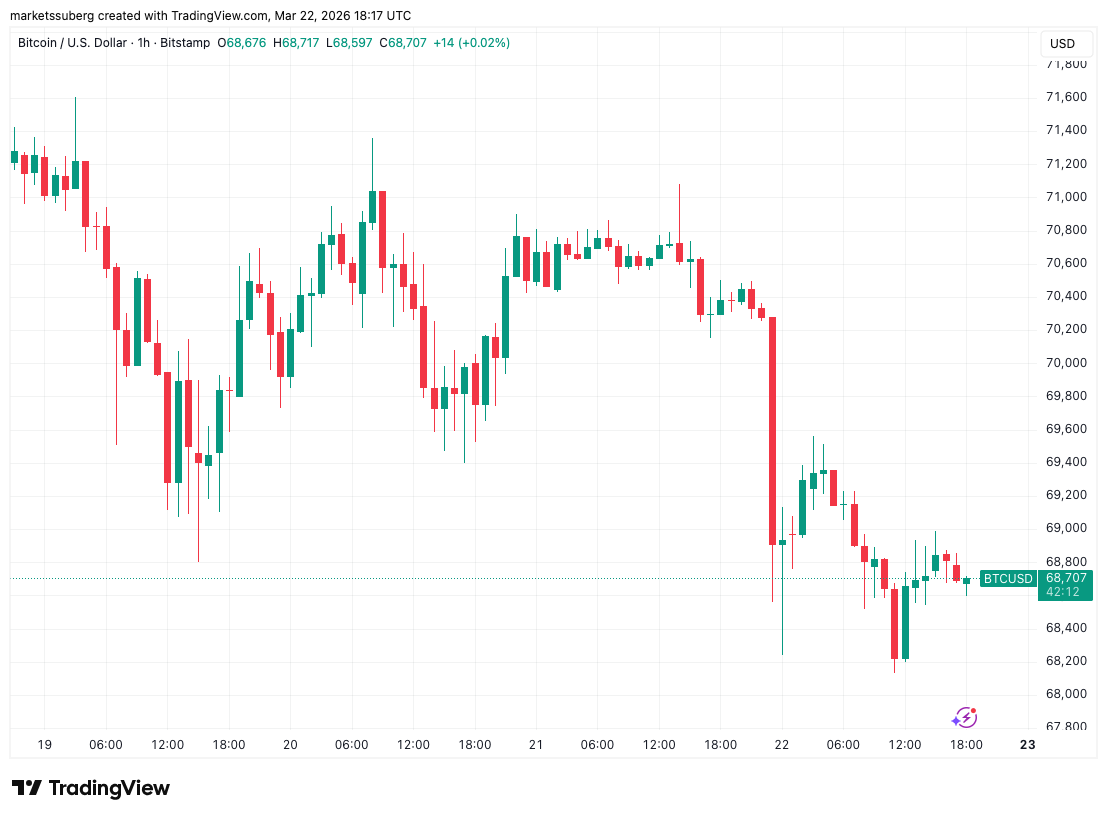
Bitcoin (BTC) traded below $69,000 on Sunday as the market faced a critical weekly candle close.
Key points:
-
Bitcoin approaches its 200-week trend line after sinking throughout the weekend.
-
BTC price action leaves traders firmly bearish on the immediate and long-term outlook.
-
A golden cross on the daily chart may provide some relief, analysis says.
Bitcoin returns to “unreliable” support
Data from TradingView showed BTC price action circling a key trend line after a weekend dip to near $68,000.

Bearish momentum entered into Saturday’s daily close and crypto longs suffered. Over $300 million in longs and nearly $100 million in shorts were liquidated in the 24 hours to the time of writing, per data from CoinGlass.

In so doing, BTC/USD set up a fresh showdown around its 200-week exponential moving average (EMA) near $68,300.
As Cointelegraph reported, the 200-week EMA was of major importance in prior BTC price cycles, but has become “unreliable” in 2026 due to failing to offer support.
Last week, trader and analyst Rekt Capital said that price should retest the 200-week trend line as support from above in order for it to provide the foundation for upside continuation.
“More, there’s also a chance that Bitcoin could simply meander in and around the 200-week EMA for a while, never really turning it into convincing resistance, never really turning it into convincing support, before ultimately breaking down into additional Macro Downside over time anyway,” he noted on X.

Others also retained bearish predictions, including trader Roman, who reiterated his $50,000 target.
“There are still 0 signs of bear market exhaustion on HTF. No divs, no bear PA exhaustion, no momentum loss, etc,” he told X followers on Sunday, referring to higher time frames.
“I still have high confidence in seeing 50k and likely a bit lower.”

BTC price “range game continues”
A potential silver lining on the day came from a “golden cross” involving two other moving averages.
Related: Bitcoin RSI signals potential bottom as analysts flag key setup
Here, the 21-day simple moving average (SMA) crossed over its 50-day equivalent, signalling stronger recent price momentum.

Commenting, Keith Alan, cofounder of trading resource Material Indicators, was cautiously optimistic.
“The Golden Cross will likely deliver some short term bullish momentum. Must watch to see if it develops into something durable,” he acknowledged in an X post.
“For now…the range game continues.”

Earlier in March, the BTC/USD chart produced two “death crosses,” a structure that typically implies more downside pressure to come. These in turn sparked warnings of a collapse below $40,000.
This article does not contain investment advice or recommendations. Every investment and trading move involves risk, and readers should conduct their own research when making a decision. While we strive to provide accurate and timely information, Cointelegraph does not guarantee the accuracy, completeness, or reliability of any information in this article. This article may contain forward-looking statements that are subject to risks and uncertainties. Cointelegraph will not be liable for any loss or damage arising from your reliance on this information.
TLDR:
- Crypto market cap has grown from billions to $2.34T, showing strong long-term upward trends.
- Adoption may reach 4 billion users by 2030, surpassing early internet growth rates.
- Tokenization and stablecoins integrate crypto into global financial systems daily.
- $100T market cap projection depends on continued adoption and partial on-chain asset migration.
Crypto Market Cap continues to expand despite volatility, with projections suggesting adoption could reach billions, pushing valuation toward $100 trillion over the next decade.
Adoption Trends Driving Crypto Market Cap
Crypto Market Cap has steadily grown from billions to trillions over the last decade, reaching about $2.34 trillion today. Despite sharp corrections, the long-term trend remains upward.
Each market cycle introduces new users, infrastructure improvements, and institutional involvement. Corrections reset valuations while strengthening underlying networks, showing that volatility is a natural part of this emerging asset class.
Adoption is a key driver of long-term growth. Raoul Pal, former hedge fund manager and Real Vision CEO, forecasts that crypto could reach 4 billion users by 2030.
Wallet numbers have grown at an average of 137% per year since 2014, outpacing early internet adoption, which expanded at 76% annually after reaching 5 million users.
While growth is expected to slow to 43% next year, projections indicate the industry could surpass one billion users before 2030.
Some analysts caution that wallet metrics may overstate real adoption due to multiple addresses per user and project-driven wallets. Pal countered that early internet metrics faced similar challenges yet still accurately tracked network expansion.
Conservative estimates, such as those from Triple-A and Andreessen Horowitz, suggest 560 million users by 2024, with monthly active users ranging between 30 and 60 million.
Even with lower estimates, the adoption curve remains strong, supporting the potential for continued crypto market cap growth.
Path Toward $100 Trillion Market Cap
Projections for Crypto Market Cap suggest a potential rise to $100 trillion by 2032, driven by adoption, tokenization, and macroeconomic trends.
Currency debasement is cited as a primary factor influencing asset appreciation, while widespread adoption strengthens long-term growth.
Pal notes that adoption explains performance relative to debasement, which accounts for most of the price action historically.
Tokenization of real-world assets could significantly increase valuation if even 10–20% of global assets move on-chain. Combined with stablecoins facilitating billions in daily transactions, crypto is increasingly integrating into financial infrastructure.
Networks such as Bitcoin serve as digital reserve assets, Ethereum enables decentralized finance and applications, and stablecoins support cross-border settlements.
Global financial markets collectively hold hundreds of trillions in equities, bonds, real estate, and gold. Crypto does not need to replace these assets; capturing a fraction could propel the market toward tens of trillions.
Each cycle, marked by drawdowns, strengthens the ecosystem as weaker participants exit and infrastructure improves. The market’s exponential nature indicates most growth occurs after broader attention, suggesting that today’s $2.34 trillion could resemble early internet phases in hindsight.
TLDR:
- Bittensor’s top 10 subnets reached a combined $550M valuation, reflecting strong ecosystem growth.
- Templar SN3 finished Covenant-72B using 72B parameters and 1.1T tokens without any central cluster.
- TAO token demand rises directly with subnet activity, as purchasing subnet tokens requires TAO first.
- Grayscale’s ETF filing and Jensen Huang’s comments signal rising institutional interest in TAO’s future.
Bittensor subnets have collectively reached a valuation of $550 million, drawing fresh attention to the TAO ecosystem.
Templar SN3 completed Covenant-72B, the largest decentralized large language model pre-training in history. The run used 72 billion parameters and 1.1 trillion tokens, with no centralized cluster involved.
This milestone has strengthened investor interest in both TAO and the growing subnet economy beneath it.
Covenant-72B Sets a New Standard for Decentralized AI Training
The Templar SN3 subnet trained Covenant-72B on 72 billion parameters and 1.1 trillion tokens. No centralized computing cluster was used throughout the entire training process.
The model’s performance is competitive with Meta’s LLaMA-2-70B in published benchmarks. This places decentralized pre-training on par with established open-source AI infrastructure.
Crypto analyst @ElCryptoDoc called the achievement “Bittensor’s DeepSeek moment” in a widely circulated post. NVIDIA CEO Jensen Huang also commented on the development, adding further visibility.
The comparison to DeepSeek reflects growing confidence in cost-efficient, distributed training methods. Industry observers have described the run as concrete proof point for decentralized AI.
Beyond Templar, Targon SN4 stands out as the highest-revenue subnet in the ecosystem. The subnet, operated by Manifold Labs, recently raised a $10.5 million Series A.
It serves real companies seeking confidential GPU compute through decentralized infrastructure. Chutes SN64, meanwhile, is expanding as a serverless inference and GPU compute option for developers.
These subnets operate across different layers of the Bittensor network but serve complementary purposes. Together, they show the ecosystem’s capacity for commercial use beyond speculative activity.
Developers are increasingly turning to decentralized alternatives for production AI workloads. This trend supports the credibility behind the $550 million combined valuation figure.
TAO Token Demand Strengthens as Subnet Activity Expands
A key mechanic in the TAO ecosystem ties subnet token purchases directly to TAO demand. Acquiring any subnet token requires TAO, making it the base currency across all subnets.
As subnet usage grows, so does the structural demand for TAO itself. This creates a compounding relationship between subnet performance and token value.
@ElCryptoDoc noted that one viral post about Templar drove TAO’s price up nearly 20% in a single day. That reaction shows how sensitive the market is to subnet-level progress.
Investors are treating individual subnet milestones as direct catalysts for the TAO token. The connection between the two layers is concrete and increasingly well-understood.
Grayscale has filed an ETF application tied to TAO, pointing to growing institutional interest. Jensen Huang’s public mention of Bittensor has also drawn attention from a wider investor base.
These external developments are positioning TAO within a broader AI-native asset conversation. TAO’s staking utility for subnets remains central to discussions around its long-term value.
As subnet competition intensifies, analysts are watching which networks will scale most effectively. Covenant-72B has established a measurable precedent for distributed model training at scale.
The $550 million valuation reflects current momentum alongside anticipated growth. The ecosystem now has tangible benchmarks to guide its next phase of development.

The U.S. Securities and Exchange Commission and Commodity Futures Trading Commission published interpretive guidance explaining how they might define what is or isn’t a security in crypto; the CFTC also issued a no-action letter for a non-custodial wallet provider to facilitate derivatives and prediction markets transactions; Arizona is filing criminal charges against a prediction market provider; and by the way we kind-of-sort-of have hints of movement on market structure legislation.
What a week, huh?
You’re reading State of Crypto, a CoinDesk newsletter looking at the intersection of cryptocurrency and government. Click here to sign up for future editions.
The narrative
The U.S. Securities and Exchange Commission published interpretive guidance this week — joined by the Commodity Futures Trading Commission — laying out how it approached the question of what in crypto it will deem a security.
Why it matters
What is, and isn’t, a security has long bedeviled the industry. We had efforts at somewhat defining this from the SEC in the past — Bill Hinman’s “When Howey met Gary (plastics)” speech, for example — but this week’s interpretative guidance is one of the most specific efforts to define this for the industry.
Breaking it down
The SEC laid out several categories it saw in the crypto space, with one of these categories being digital securities. These are cryptocurrencies that meet the definition of a security under any other context, but happen to be tokenized, the guidance said. For example, if a crypto asset meets the prongs of the Howey Test, it’s a security.
This is the category of tokens the SEC will oversee.
Other categories include payment stablecoins, digital tools, digital collectibles and digital commodities, which are generally not securities unless the issuers or operators take actions that might meet securities regulations, such as fractionalizing the tokens in question.
“We establish a straightforward taxonomy of crypto assets — most of which are not securities — and clarify how the Supreme Court’s Howey test applies when a crypto asset is part of an investment contract,” SEC Chair Paul Atkins and Commissioners Hester Peirce and Mark Uyeda wrote in an oped for CoinDesk.
The CFTC said it would sign on to the guidance and administer it under the Commodities Exchange Act.
“Market participants — from innovators and issuers to individual investors — should review this interpretation to better understand the regulatory jurisdiction between the SEC and CFTC,” the CFTC said in a press release. “The interpretation will be published on CFTC.gov and in the Federal Register.”
Congressman Troy Downing (R-Mont.) called the guidance “very positive,” but said Congress still needed to pass market structure legislation as a future administration could undo the interpretative guidance.
“Just having another two or three years of this and then having ambiguity out there doesn’t make most people comfortable on doing any kind of big investment,” he told CoinDesk. “But it’s a great start because this is exactly what the industry wants, and it allows some people to move forward.”
Chris LaVigne, a partner at the law firm Withers, said the guidance “predictably concludes that most crypto assets and many common crypto activities are not securities,” though the agency kept some discretion to being an enforcement action in this area.
“The guidance moves the securities inquiry away from the asset or activity itself (which are mostly deemed digital commodities not within the purview of the SEC) and re-centers the analysis on the transactions and representations in which these assets or activities arise or are marketed,” he said. “By doing so, the SEC did not completely eliminate uncertainty or its enforcement role, because it concludes that a crypto asset that is not a security can nonetheless be sold as part of an investment contract if it is marketed with promises of profit derived from the issuer’s essential managerial efforts.”
A crypto that was marketed as a security may eventually be deemed something else “once those promises are fulfilled or no longer operative,” he said. This might affect securities more broadly than just crypto assets.
It’s less clear what may constitute a commodity under the guidance.
Jason Gottlieb, a partner at Morrison Cohen, said the Commodity Exchange Act defines commodities as a list of products (excluding onions and motion picture box office receipts), services and other issues “in which contracts for future delivery are presently or in the future dealt in.”
This legal definition diverges from the definition seemingly being used in the guidance. The CFTC’s approach to crypto over the past decade has evolved since some early lawsuits, where it claimed jurisdiction over bitcoin , leading it to seemingly have jurisdiction over non-security cryptocurrencies. But this definition needs to be codified by market structure legislation, he told CoinDesk.
“People need to understand that jurisdiction is still uncertain. The SEC is clearly saying ‘we don’t have jurisdiction if the token does not meet these criteria,’” he said. “Just because the SEC does not have jurisdiction does not mean the CFTC does.”
Gottlieb said he was part of a case before the Seventh Circuit Court of Appeals seeking to gain clarity on this question, but market structure legislation would be needed to cleanly grant the CFTC jurisdiction over all non-security cryptocurrencies.
The status of that legislation also remains up in the air. Senator Cynthia Lummis (R-Wyo.), speaking at the DC Blockchain summit earlier this week, said she anticipated a markup may happen in the final weeks of April. The issue of stablecoin yield may be resolved with an agreement that stablecoin issuers and their partner firms would not describe their products using bank terminology, though she cautioned that she hadn’t seen any specific language yet.
The flip side, several individuals told me, is that the Clarity Act might require the SEC to go back to the drawing board on how it’s defining securities in crypto. But this falls under the category of bridges that can be crossed when they’re reached.
Senator Tim Scott (R-S.C.), the chair of the Senate Banking Committee, said lawmakers are also close to agreements on issues like ethics and quorums on the regulatory agencies — some of the outstanding areas of disagreement on the bill.
Downing said he saw an April time frame as doable for advancing market structure legislation. The closer lawmakers get to the end of the year, however, the less likely it would be that anything could be passed, he said, pointing to the midterm election. “But I don’t think it’s impossible.”
Senator Kirsten Gillibrand (D-N.Y.) said on stage at the DC summit that she was “optimistic” there would be a markup soon, which would then lead to the Banking and Agriculture Committee’s bills combining.
The combined bill would need to incorporate areas of bipartisan agreement, she said.
“One of the issues that I think is very important that people should be aware of is the Senate wants an ethics provision,” she said. “I think the House would have had even more support on the Democratic side if they had retained their ethics provisions in their bill. It’s very important that members of Congress do not get rich off of this industry, because they have access to non-public information, because they have positions of power and authority.”
Downing said the market structure bill needed to address consumer protections and money laundering, without being so restrictive that companies would be scared to do anything.
“Nobody wants bad actors in their space and nobody wants that reputation of bad actors using this as a tool to do bad things,” he said. “… If you bring those [provisions] in too narrow, nobody’s going to do anything innovative.”
He said he understood why banks might be concerned about the yield issues.
“Community lenders, community banks are worried about depositors all exiting the market, in which case you’re not doing mortgages on small farms in Montana, right?” he said.
Late Friday, Senators Angela Alsobrooks and Thom Tillis told Politico they had reached an agreement on the yield issue, though the details had not been shared with the banking or crypto industries as of press time.
Kalshi was just ordered to cease offering most of its prediction markets in the state of Nevada for at least two weeks, pending a hearing on April 3.
The order came after an appeals court refused to grant an administrative motion that could have blocked the state court’s action. Earlier in the week, the state of Arizona filed criminal charges against Kalshi, alleging some of its election and other contracts violate state law.
In Nevada, a judge ruled that Kalshi can’t offer sports, election or entertainment-related event contracts at least temporarily.
According to the order by Judge Jason Woodbury, the record in Nevada’s case against Kalshi so far suggests that it offers products defined by state law, making its conduct subject to Nevada’s gaming regulators.
“The question of federal preemption in this regard is nuanced and rapidly evolving,” the judge wrote. “At the moment, the balance of convincing legal authority weighs against federal preemption in this context.”
The Arizona action goes further, alleging misdemeanor violations on small bets placed on professional football and college basketball games, upcoming elections and on whether bills become law and whether public figures will show up to sporting events.
“Arizona law prohibits operating an unlicensed wagering business, and separately bans betting on elections outright,” Arizona Attorney General Kris Mayes’ office said in a press release.
Kalshi co-founder Tarek Mansour called the charges a “total overstep” that “have nothing to do with gambling or the merits.”
There’s a broader growing backlash to prediction markets. Senator Catherine Cortez-Masto, who represents Nevada, wrote an opinion piece saying prediction markets “blatantly violate state and tribal laws and regulations.”
“To ensure responsible gaming, casinos, sportsbooks and online gaming sites have to follow minimum age requirements, participate in integrity monitoring and support critical consumer protections, like programs that help people with gambling addictions,” she said. “Yet, this past year, emboldened by limp and overly permissive federal regulators like the Commodity Futures Trading Commission (CFTC), so-called ‘prediction markets’ have transformed themselves into illegal sportsbooks, offering their users illicit sports wagers.”
This week
- There are no hearings or public meetings scheduled (at least pertaining to crypto).
If you’ve got thoughts or questions on what I should discuss next week or any other feedback you’d like to share, feel free to email me at [email protected] or find me on Bluesky @nikhileshde.bsky.social.
You can also join the group conversation on Telegram.
See ya’ll next week!
Crypto World
Blackstone’s BCRED Posts First Monthly Loss in Over Three Years as Investor Withdrawals Hit $3.7B
TLDR:
- BCRED reported a 0.4% loss in February 2025, its first monthly decline since September 2022’s 1.3% drop.
- Investors withdrew $3.7 billion from BCRED in Q1 2025, surpassing the fund’s typical quarterly redemption volume.
- Blackstone wrote down loans for select borrowers, including software firm Medallia, per a letter to financial advisers.
- Blackstone shares have dropped over 28% this year as banks tighten lending and rivals cap investor withdrawals.
Blackstone’s private credit fund, BCRED, recorded its first monthly loss in over three years in February 2025. The $82 billion fund reported a total loss of 0.4%, drawing attention to growing pressures across the private credit sector.
Investor concerns around liquidity, credit quality, and withdrawal surges have grown steadily this year. This development marks a turning point for one of the largest private credit vehicles in the world.
BCRED Reports February Loss as Withdrawals Surge
BCRED’s last recorded monthly loss before February was in September 2022, when it posted a decline of 1.3%. The February 2025 loss of 0.4% comes as investor sentiment around private credit has noticeably shifted.
For context, the Morningstar LSTA index of publicly traded leveraged loans fell 0.8% in February, per Morningstar’s website.
During the first quarter of this year, Blackstone’s fund faced a larger-than-usual wave of redemption requests. Investors pulled $3.7 billion from BCRED, a figure that exceeded typical quarterly withdrawal volumes.
The fund allows investors to withdraw a portion of their holdings every quarter, which adds a layer of liquidity pressure.
Financial news reporter Kristen Shaughnessy shared the development on social media, drawing wider public attention. The post referenced a Financial Times report citing a letter sent to financial advisers by Blackstone. According to that report, customer service software firm Medallia was among the companies whose loans were written down.
BCRED wrote down the value of a “select” number of loans during February, per the Financial Times report. Despite this, Blackstone maintained that the fund has delivered a 9.5% annualized total return since inception for Class I shares. The firm also noted that BCRED has outperformed the leveraged loan market by 100 basis points so far this year.
Private Credit Sector Faces Growing Scrutiny From Banks and Investors
Private credit funds have come under growing scrutiny due to weakening credit quality across the sector. Their high exposure to vulnerable sectors such as software has raised concerns among analysts and investors. Additionally, a lack of transparency has made it harder for market participants to assess underlying risks.
These concerns have spilled over onto Wall Street, where some major U.S. banks have tightened lending to the private credit industry.
JPMorgan Chase marked down the value of certain loans to private credit players earlier this month. That move is expected to reduce available lending to funds operating in the space.
Morgan Stanley and BlackRock were among the firms that moved to limit withdrawals from their own funds. Both firms acted following a surge in redemption requests from investors. This pattern across multiple funds points to a broader trend of tightening liquidity across private credit markets.
Shares of Blackstone, the world’s largest alternative asset manager, have lost more than 28% of their value so far this year.
That decline mirrors the broader unease investors have expressed toward the alternative asset space. As the sector navigates these pressures, fund managers are being watched more closely than at any point in recent years.
TLDR:
- XRP open interest is falling across major exchanges, with Binance still holding the largest derivatives market share.
- Liquidation spikes and soft taker volume confirm that leveraged XRP positions are actively being unwound market-wide.
- XRP has gained dual commodity classification from the SEC and CFTC, marking a turning point in regulatory clarity.
- ETF inflows of $1.44B and Ripple’s $2.7B in acquisitions reflect rising institutional confidence heading into 2026.
XRP open interest continues to contract across major derivatives exchanges, reflecting an ongoing deleveraging trend in the market.
Despite this broad decline, Binance maintains the largest share of XRP open interest among top platforms. At the same time, a growing set of regulatory and institutional developments is taking shape in 2026.
Analysts are watching closely to see whether these catalysts can reverse the current market structure.
Binance Dominates as Leveraged Positioning Unwinds
Binance remains the primary venue for XRP leveraged trading, holding the most open interest across major exchanges.
However, the exchange’s own 24-hour data shows continued weakness in positioning, with no strong recovery in sight.
Net taker volume on Binance also remains soft, which points to limited aggressive demand from new buyers. This combination suggests the market is still in a reset phase rather than entering a fresh expansion.
Liquidation data adds further weight to this view. Recent liquidation spikes show that forced leverage cleanup has played a role in driving open interest lower.
Rather than reflecting fresh long conviction, the current structure points to position unwinding. Speculative appetite across XRP derivatives continues to fade as a result.
The overall trend across exchanges mirrors what Binance is showing internally. Open interest is falling in a broad and sustained manner, not in isolated bursts.
This pattern typically follows periods of elevated speculation and leverage buildup. For open interest to recover, the market would need stronger directional participation from both retail and institutional traders.
Until that recovery arrives, the market structure for XRP derivatives remains under pressure. Binance will likely continue to lead the space by volume and open interest.
However, the gap between Binance and other exchanges may shift if conditions improve on other platforms. Traders are watching these metrics carefully as a leading signal for XRP’s next move.
Regulatory and Institutional Catalysts Are Aligning in 2026
On the fundamental side, a series of developments are converging that some analysts say could drive a major move.
XRP has been officially classified as a digital commodity by both the SEC and the CFTC, bringing long-awaited regulatory clarity.
The CLARITY Act markup is targeting April, and Ripple CEO Brad Garlinghouse has placed the odds of passage at 80 to 90 percent. Additionally, a stablecoin yield compromise is reportedly near completion.
Institutional interest is also building at a fast pace. XRP-related ETFs have pulled in $1.44 billion in inflows, while Evernorth has filed its S-4 for a Nasdaq listing.
Ripple has also made over $2.7 billion in acquisitions and is expanding its global footprint. A Ripple National Trust Bank application is currently under review as well.
Crypto analyst X Finance Bull noted on X that in 2024, XRP ran from $0.49 to $3.60 on news alone. The analyst argued that the 2026 setup carries heavier weight, with regulation, infrastructure, and institutional capital aligning together. That framing has drawn attention from traders reassessing their positions.
Whether the derivatives market responds to these catalysts remains to be seen. Open interest recovery alongside stronger volume would signal a shift in market sentiment. For now, XRP sits at a crossroads between fading speculative leverage and growing structural support.
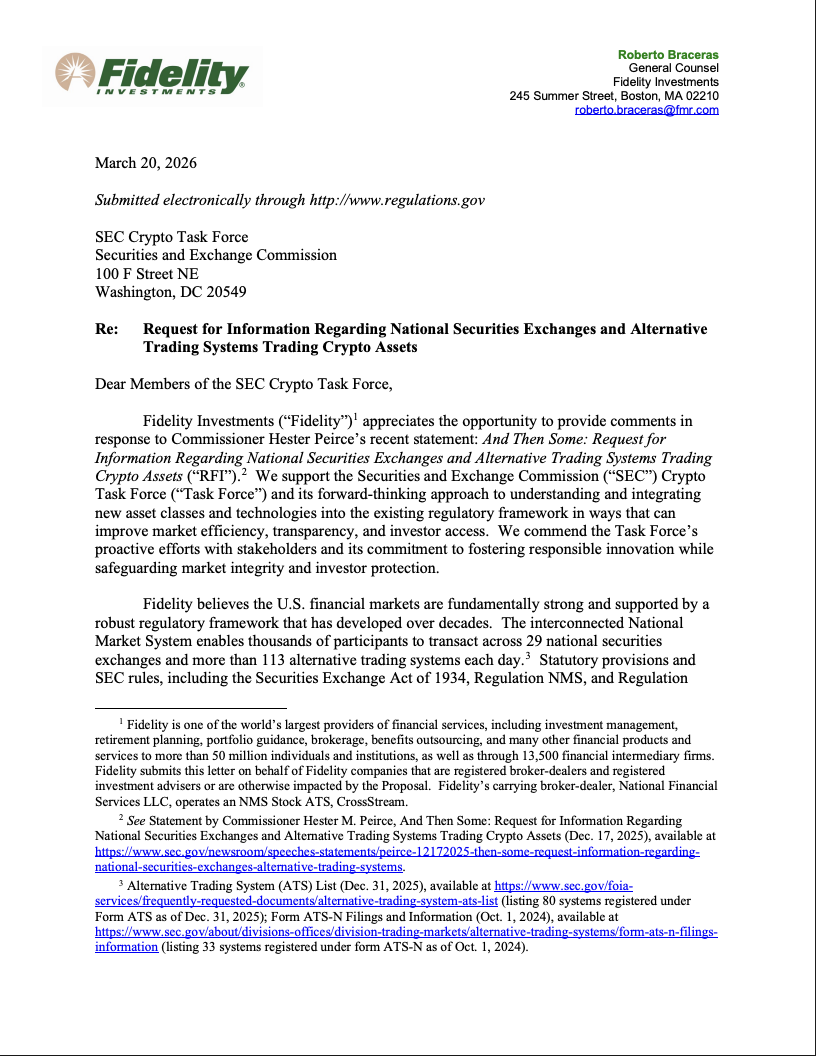
Fidelity Investments told the US Securities and Exchange Commission (SEC) on Friday that it should continue to develop the regulatory framework for broker-dealers to offer, custody and trade crypto assets on alternative trading systems (ATS).
The letter from the US’ third-largest asset manager was in reply to a call for comments earlier this month by the regulator’s Crypto Task Force.
Fidelity said it is “critical” for the SEC to develop a comprehensive regulatory framework and clear rules of the road for tokenized securities trading, including rules for trading tokenized securities issued by third parties.

Tokenized instruments have different issuance structures, legalities, and valuation models, the letter said. For example, tokenized real-world assets (RWAs) span entirely different asset classes like equities, real estate, bonds, or private credit.
“Tokenization models vary significantly in structure and in the rights afforded to holders,” the letter said. The company explained:
“In some models, the crypto asset represents a holder’s indirect interest in the underlying security through a securities entitlement, while in others, the crypto asset may constitute a securities‑based swap, which may be offered only to eligible contract participants.”
Fidelity also urged the SEC to bridge the regulatory gap between centralized and decentralized trading systems to “consider how intermediated and disintermediated trading venues can evolve and coexist,” the company’s general counsel, Roberto Braceras, wrote.

This includes overhauling existing reporting rules to reflect that decentralized finance (DeFi) trading platforms and other “disintermediated” systems cannot produce the detailed financial reporting required by the SEC because there is no central authority.
Additionally, Fidelity recommended that the SEC issue guidance permitting broker‑dealers to use distributed ledger technology for ATS and other recordkeeping purposes.
Overhauling reporting requirements to reflect this technological reality removes “undue burden” from decentralized systems, the letter said.
The Securities and Exchange Commission, under the leadership of Chairman Paul Atkins, has repeatedly signaled support for 24/7 capital markets and has given the regulatory approval for financial companies to experiment with tokenized trading.
Related: SEC interpretation on crypto laws ‘a beginning, not an end,’ says Atkins
US regulators say tokenized securities are subject to the same capital rules as underlying assets
Tokenized securities, which include equities, debt instruments, real estate investment trusts (REITs) and other securitized assets, are subject to the same banking capital requirements as the underlying assets they hold.
This view was shared in a joint policy statement published in March from the Federal Reserve, the Federal Deposit Insurance Corporation (FDIC) and the Office of the Comptroller of the Currency (OCC).
“The technologies used to issue and transact in a security do not generally impact its capital treatment,” according to the agencies.
Magazine: When privacy and AML laws conflict: Crypto projects’ impossible choice
Deputy Resigns Amid Foot-Fetish Account Scandal

XRP I CAN’T BELIEVE WHAT I AM SEEING!

Man City dominates Arsenal to win English League Cup 2-0


-

 Tech7 days ago
Your Legally Registered ‘Motorcycle’ Might Not Count Under Proposed US Law
-

 Fashion2 days ago
Weekend Open Thread: Adidas – Corporette.com
-

 Politics2 days ago
Jenni Murray, Long-Serving Woman’s Hour Presenter, Dies Aged 75
-
 Tech5 days ago
Are Split Spacebars the Next Big Gaming Keyboard Trend?
-

 Crypto World21 hours ago
Best Crypto to Buy Now: Strategy Just Spent $1.57 Billion on Bitcoin During Fear While Early Investors Quietly Enter Pepeto for 150x Potential
-

 News Videos4 days ago
RBA board divided on rate cut, unusually buoyant share market | Finance Report | ABC NEWS
-

 Crypto World22 hours ago
Bitcoin Price News: Bhutan Sells $72 Million in BTC Under Fiscal Pressure, but the Smart Money Entering Pepeto Sees What the Market Does Not
-
 Crypto World2 days ago
NIO (NIO) Stock Plunges 6.5% as Shelf Registration Sparks Dilution Worries
-

 Business6 days ago
Australian shares drop as Iran war enters third week
-

 Crypto World6 days ago
Crypto Lender BlockFills Enters Chapter 11 with Up to $500M in Liabilities
-

 Politics4 days ago
The House | The new register to protect children from their abusers shows Parliament at its best
-

 Fashion6 days ago
25 Celebrities with Curly Hair That Are Naturally Beautiful
-

 Tech3 days ago
inKONBINI Lets You Spend Summer Days Behind the Register
-
 Politics5 days ago
Real-time pollution monitoring calls after boy nearly dies
-

 Crypto World4 days ago
Canada’s FINTRAC revokes registrations of 23 crypto MSBs in AML crackdown
-
 NewsBeat4 days ago
Residents in North Lanarkshire reminded to register to vote in Scottish Parliament Election
-

 Business6 days ago
Meta planning major layoffs as AI spending and automation reshape workforce
-

 News Videos4 days ago
PARLIAMENT OF MALAWI – PAC MEETING WITH REGISTRAR OF FINANCIAL ON AMARYLLIS HOTEL – INQUIRY LIVE
-
Entertainment6 days ago
Oscars reunite Rob Reiner supergroup of 17 stars for emotional tribute: Here's who appeared on stage
-

 Business4 days ago
Who Was Alex Pretti? 5 Key Facts About the ICU Nurse Killed by Federal Agents in Minneapolis
You must be logged in to post a comment Login