
Crypto World
Buying Bitcoin? Hold at least 3 years to avoid losses, data shows

Bitcoin (CRYPTO: BTC) has repeatedly tested patient investors, and a long-hold thesis appears increasingly robust when examined through multi-year price histories. A Bitwise Europe study looking at BTC’s price data from mid-2010 through early 2026 finds that the odds of ending a multi-year position in the red shrink dramatically as the holding window extends. In particular, three-year holders show a loss probability of just 0.70%, with even smaller risk over longer horizons. The findings map onto a broader narrative: while near-term volatility and macro headwinds persist, the longest-dated exposure has historically delivered favorable outcomes for those who ride out cycles. The debate around price targets for 2026–2027 remains lively among analysts and researchers, with forecasts ranging widely.
Key takeaways
- A three-year BTC holding has a 0.70% chance of ending in loss; five-year horizons drop to 0.2%, and ten-year horizons sit at 0% based on the Bitwise Europe dataset covering July 2010–Feb. 11, 2026.
- Shorter horizons carry higher risk: intraday BTC positions were 47.1% underwater, with the probability staying elevated at 44.7% over one week, 43.2% over one month, and 24.3% over a one-year window.
- As of a recent Saturday, BTC traded near $65,000 after a roughly 50% decline from the October 2025 peak; the three-to-five year realized price sits around $34,780, meaning long-hold investors in that window remain roughly 90% in profit.
- Cost-basis insights show the depth of drawdowns varied by holding period: those in the 6–12 month band carried a cost basis near $101,250, while the 1–2 year cohort hovered around $78,150, illustrating how longer horizons dampen drawdowns during corrections.
- Forecasts for 2026–2027 remain divergent. Bernstein has kept a bullish target of $150,000 for 2026, while Standard Chartered warns of potential downside toward $50,000 amid weak ETF flows before a recovery toward $100,000 by year-end. Timothy Peterson’s framework points to around $122,000 by early 2027, with odds skewing toward a level above that mark. Some analysts even flag a scenario where a drop toward $30,000 could intensify, should negative forces persist.
Tickers mentioned: $BTC
Market context: The analysis arrives as the macro backdrop and spot-Bitcoin ETF dynamics shape liquidity and sentiment. While near-term moves remain volatile, the data emphasize a structural resilience for long-duration exposure, complicating calls that rely solely on short- or medium-term price actions.
Why it matters
The central takeaway for investors weighing risk and time horizons is that holding Bitcoin for longer stretches has historically reduced downside risk. The Bitwise Europe analysis synthesizes decades of price history to illustrate a simple trade-off: time in the market tends to smooth out volatility and limit losses, even as drawdowns occur along the way. For market participants who favor patient exposure over quick wins, the results reinforce the strategic value of a multi-year horizon when assessing BTC’s risk profile.
But the narrative is nuanced. While long-hold cohorts show impressive downside resistance, shorter-term traders faced meaningful drawdowns during correction cycles. The intraday and weekly metrics underscore that market timing remains a challenging game. Investors who entered positions within the last year or two found themselves under considerable pressure during bear-market rallies and capitulation phases. The realized-price framework adds another layer: even as Bitcoin’s price dips, the difference between current levels and multi-year realized prices can offer a proxy for whether a given entry remains profitable on a longer horizon.
What to watch next
- Track ETF flows and price action around key levels: Bernstein notes modest net outflows from spot Bitcoin ETFs (around 7%), a dynamic that could influence near-term price action.
- Watch for potential downside catalysts: some scenarios point to BTC testing the $30,000 region if macro and ETF dynamics worsen further, which would compress the cushion for long-term holders.
- Observe longer-horizon projections evolving: Peterson’s model suggests roughly $122,000 by early 2027, while other analysts maintain targets near six figures or higher depending on liquidity conditions and risk sentiment.
- Monitor realized-price indicators as a gauge of profitability across aging cohorts: data from Glassnode’s realized-price-by-age charts help contextualize whether current prices justify holding or adding to positions over time.
Sources & verification
- Bitwise Europe research lead Andre Dragosch’s data referencing BTC price history from July 17, 2010, to February 11, 2026, showing loss probabilities by holding period. Link: X post.
- Glassnode data on BTC realized price by age, used to illustrate realized-profit dynamics across holding windows: Realized price by age.
- Bernstein’s price target for Bitcoin at $150,000 in 2026: Bernstein analysis.
- Standard Chartered commentary on ETF flows and BTC price implications, including a potential move toward $50,000 and a recovery toward $100,000 by end-2026: Standard Chartered note.
- Timothy Peterson’s historical price-metric projection of around $122,000 by early 2027: Peterson model.
- Analyses discussing a potential price bottom around $30,000: BTC to $30k discussion.
Market reaction and key details
Bitcoin’s long-hold resilience narrative sits at the intersection of empirical price histories and forward-looking forecasts. The Bitwise Europe findings underscore a fundamental principle of risk management in crypto: time can be a mitigating factor against pronounced drawdowns, particularly for assets with long and volatile price trajectories like BTC. As of the latest data points, the price remains well above the 3–5 year realized-price band, suggesting investors who carried positions across that horizon stayed financially advantaged despite recent declines. Yet, with near-term price action vulnerable to ETF flow shifts and macro surprises, the timing of new entries or additions warrants careful consideration.
What this means for investors and the market
For builders and institutions, the message is clear: a multi-year exposure approach continues to be a meaningful risk management lever, provided entrants understand that near-term volatility can erase short-term gains. For traders and retail participants, the findings reinforce the importance of horizon management—knowing when to trim, when to accumulate, and how to interpret realized-price signals that contextualize profitability over time. As the debate over BTC’s fair value stretches into 2027, the balance between outflows from ETF products, macro momentum, and the technical price regime will increasingly shape the space. The data do not guarantee outcomes, but they do illuminate how holding patterns have historically influenced risk and reward in one of crypto’s most scrutinized markets.
What to watch next
- ETF flow dynamics and their impact on spot BTC liquidity (watch for updates on net inflows/outflows and price correlation).
- Key downside risk scenarios, including any approach toward the $30,000 level and the subsequent implications for longer-term holders.
- Updated price targets for 2026–2027 from major analysts, including revisions to mid- or high-five-figure forecasts.
- New data from realized-price analyses that track aging cohorts, offering updated insight into profitability by holding window.
Rewritten article: Understanding the enduring appeal of patience in BTC
Bitcoin (CRYPTO: BTC) has long been framed as a volatile asset class that tests the nerves of investors seeking quick profits. Yet, a synthesis of long-run price history and contemporary market dynamics suggests that the most durable gains may accrue to those who commit to time rather than timing. The Bitwise Europe analysis, which combs through BTC’s price journey from 2010 to early 2026, indicates a striking pattern: the longer you ride the cycle, the less likely you are to sit on losses. Specifically, a three-year holding period yields a loss probability of just 0.70%, while five-year and ten-year windows reduce the risk even further to 0.2% and 0%, respectively.
To put those figures into perspective, the risk calculus for traders who enter BTC positions with shorter horizons is markedly more precarious. Intraday entries show nearly half the time ending underwater, with 47.1% of positions in negative territory. The risk persists, albeit at different magnitudes, over one week (44.7%), one month (43.2%), and even a year (24.3%). These numbers illuminate a pattern: the shorter the time frame, the greater the exposure to abrupt price moves and regime shifts. It helps explain why many seasoned crypto investors emphasize patience and disciplined risk management as essential components of a successful strategy in this space.
The price action context is equally important. As of a recent Saturday, BTC traded around $65,000, roughly half its October 2025 high. Yet the longer-term perspective remains constructive when contrasted with realized-prices: the 3–5 year realized price sits near $34,780, implying that participants who bought around that window and held through the recent drawdown were still sitting on about a 90% profit. This contrast between current market price and multi-year realization offers a tangible signal for investors evaluating whether to add to positions or hold steady through volatility. The historical frame invites readers to consider not just where Bitcoin is today, but where it has been over the last decade and how those cycles tested the resilience of long-term holders.
Forecasts for the 2026–2027 horizon remain divergent, reflecting the many moving parts that drive crypto markets. Bernstein has maintained a bold target of $150,000 for Bitcoin in 2026, arguing that relatively modest outflows from spot-Bitcoin ETFs could sustain a price trajectory higher, even as the asset retrenched by roughly 50% from its prior peak. The analysts characterized the current price action as a “crisis of confidence,” suggesting that sentiment rather than fundamentals is a primary swing factor in the near term. On the other side of the ledger, Standard Chartered has warned of a possible “final capitulation” phase that could pull BTC toward $50,000, driven by weak ETF flows and a softer macro backdrop, before restoring momentum toward the $100,000 mark by year-end 2026. Timothy Peterson’s framework, which leverages a historical average-return approach, points to around $122,000 by early 2027, with a substantial likelihood of trading above that level.
Beyond these headlines, a broader data story centers on the aging of holders and the corresponding realized-price dynamics. Glassnode’s charts of realized price by age underscore a recurring pattern: the cost basis and drawdown profiles depend heavily on how long investors have held their BTC. The 6–12 month cohort, for instance, shows a cost basis near $101,250, translating to about a 35% unrealized loss at a given snapshot, while the 1–2 year cohort sits closer to $78,150, implying roughly a 15% unrealized loss. The practical takeaway is that longer holding horizons tend to dampen the severity of corrections, a trend that aligns with the three-year risk reductions highlighted in the Bitwise analysis. For readers tracking the macro picture, the conversation about ETF flows, risk sentiment, and regulatory signals remains essential, as these factors are likely to influence whether the market shakes off or sustains the next leg higher.
Looking ahead, the path for Bitcoin remains as much about risk management as about price discovery. The consensus between long-hold data and bearish risk scenarios suggests a bifurcated market: patient investors could ride out volatility and exit with meaningful gains, while shorter-term traders might face amplified drawdowns if macro or policy dynamics tilt unfavorably. As with prior cycles, the market’s future hinges on how liquidity, sentiment, and structural demand—whether via ETFs or institutional participation—interact with the entrenched volatility that has defined BTC since its inception. In that context, the discipline of holding—paired with vigilant risk assessment—appears to be the most durable approach for navigating Bitcoin’s evolving landscape.

Crypto World
XRP Ledger Votes on Native Lending Protocol While ETH Breaks Out and Pepeto Targets 100x
The best crypto to buy now just got a fresh signal after XRP Ledger validators began voting on a native lending protocol that brings DeFi directly onto the chain. At the same time, CoinDesk reported that the ETH/BTC ratio bounced to a three-month high as Ethereum added 284,000 new users in Q1.
Capital is rotating back into crypto. Pepeto leads with more than $9.21 million raised, a confirmed Binance listing, and 100x targets backed by a live exchange.
XRP Ledger validators started voting on amendments XLS-65 and XLS-66 on April 16, a pair of proposals that would add on-chain lending and single-asset vaults to the ledger for the first time according to CoinMarketCap.
XRP jumped 8% on the week and led every major token in performance per CoinDesk, while Ethereum’s ratio against Bitcoin climbed to 0.0313 on the back of record Q1 network activity. Both moves point to the same thing: money is flowing back into crypto, and the best crypto to buy now is the entry that turns this rotation into the biggest return.
Ethereum, XRP, Pepeto, and the Best Crypto to Buy Now Before Listings Reprice Everything
Pepeto: The Live Exchange That Makes Every Other Presale Look Like a Promise
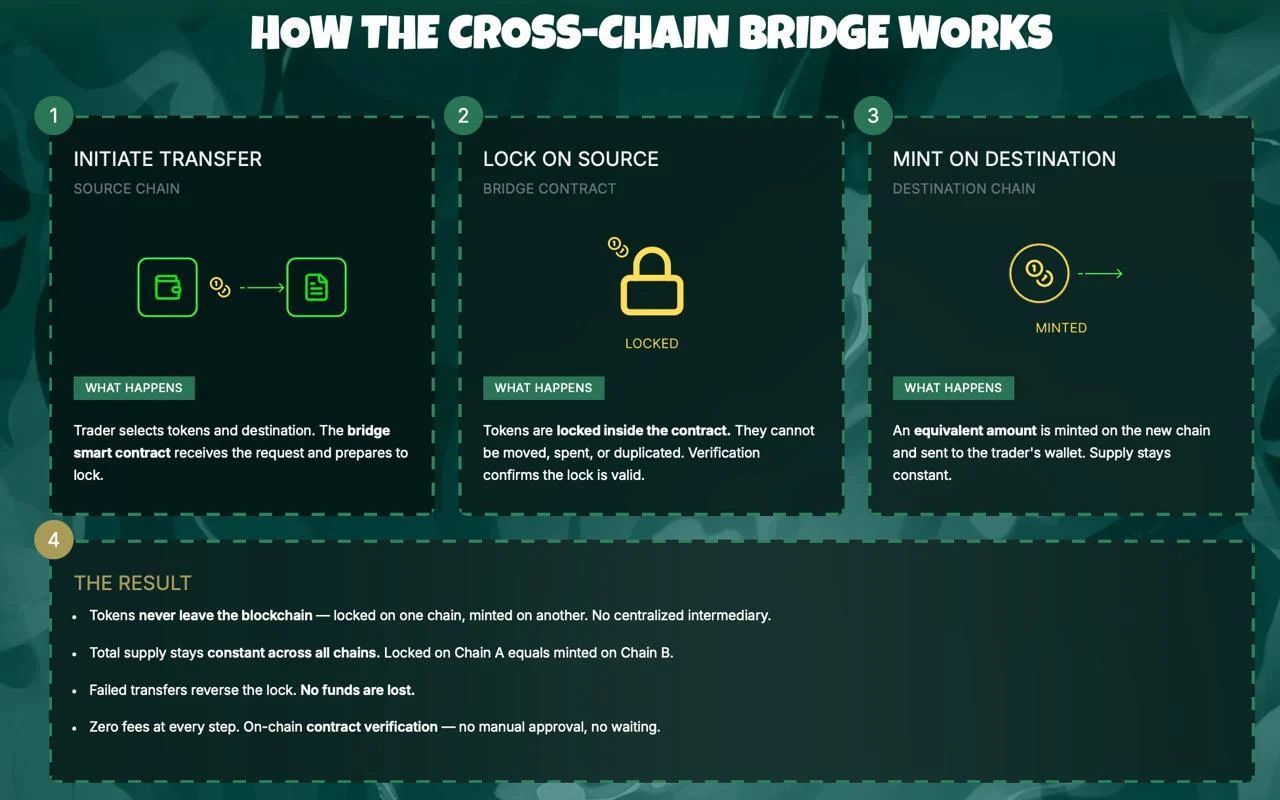
Headlines about wars and oil prices grab attention, but the threat that actually drains wallets every cycle sits inside the contracts. Hidden permissions, fake liquidity, and token traps cost billions, and most traders find out after their money is gone.
Pepeto built a scanner that catches all of it first. Before you commit capital, the tool reads the contract code, spots admin overrides and exit traps, and shows the risk in plain words. Zero-fee trading through PepetoSwap means the entry price is the real price with nothing skimmed, and a cross-chain bridge handles transfers between Ethereum, BNB Chain, and Solana at no gas cost.
The best crypto to buy now is where your capital stays protected while it compounds. ETH and XRP need billions and months to recover. Pepeto needs one listing. The Pepe ecosystem cofounder who turned a meme token into $11 billion built this exchange with a former Binance executive, and SolidProof signed off on every contract before the presale opened.
Capital committed has passed $9.21 million at $0.0000001865, staking at 181% APY compounds around the clock, and the CoinMarketCap preview page is live. The gap between today’s presale cost and the listing price is where the biggest return in this cycle sits.
Ethereum (ETH) Price at $2,330 as ETH/BTC Ratio Hits Three-Month High
Ethereum (ETH) trades near $2,330 per CoinMarketCap, up roughly 5.12% on the week after clearing the $2,330 ascending triangle resistance that held the price down for weeks.
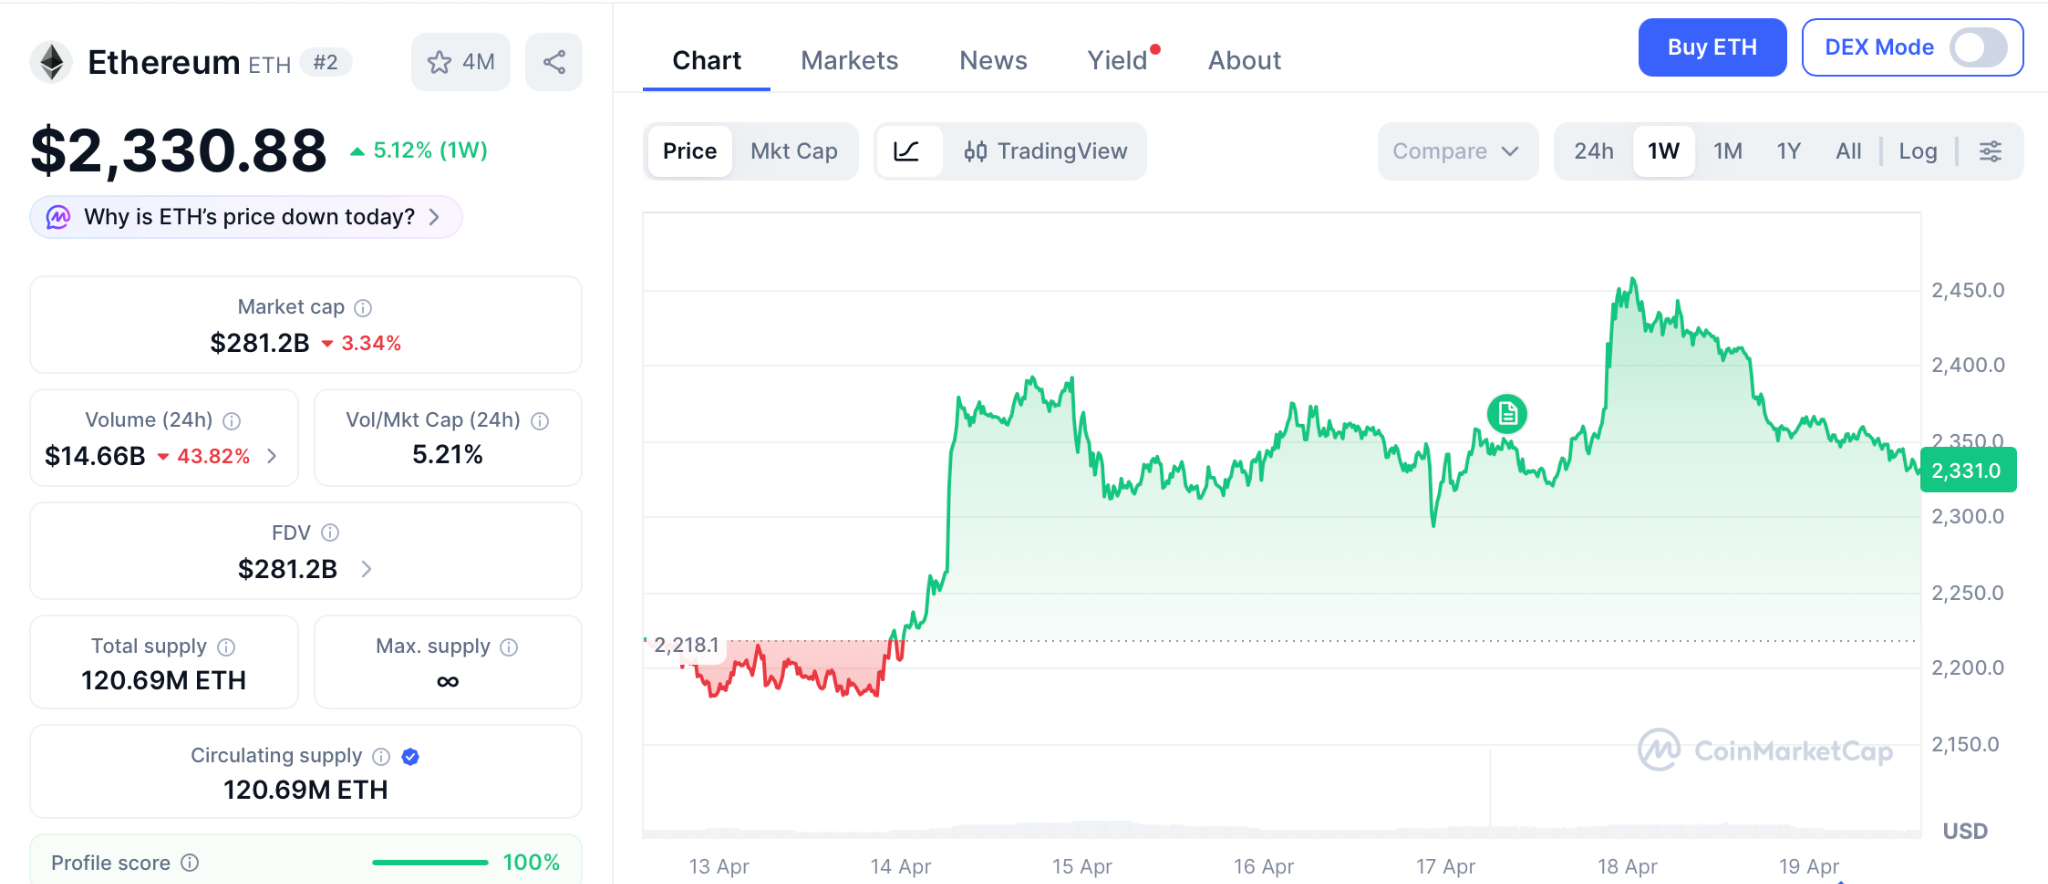
The ETH/BTC ratio climbed to 0.0313, its highest reading since January, as 284,000 new wallets joined the network in Q1 and stablecoin supply on Ethereum hit $180 billion.
Standard Chartered still targets $12,000 by year-end. A move back to $3,000 returns roughly 25% over months, but the best crypto to buy now at presale pricing delivers that in a single listing session.
XRP Price at $1.42 as Validators Vote on Native Lending Protocol
XRP trades near $1.42 per CoinMarketCap, climbing 8% on the week and leading both Bitcoin and Ethereum in performance. Validators began voting on XLS-65 and XLS-66, which would bring lending and vault features directly onto the XRP Ledger.
Spot XRP ETFs hold $1.08 billion in total assets with $11.87 million in daily inflows on April 17. Even a push to $2.00 is only a 39% gain from here, and the best crypto to buy now at presale pricing carries 100x from one exchange launch.
Conclusion
ETH is climbing. XRP is leading the market. And the one token that sits below all of them in price but above all of them in upside is still open at $0.0000001865. That will not last. The Binance listing is confirmed and the date moves closer every day. When it hits, the presale closes and this price is gone for good.
The people who bought SHIB and PEPE early did not wait for perfect conditions. They saw the setup, they moved, and the listing did the rest. Pepeto has $9.21 million in committed capital, a live exchange, and the same Binance path those tokens walked. Missing this entry is the kind of mistake you remember every time you open a chart for the rest of 2026.
Click To Visit Pepeto Website To Enter The Presale

FAQs
What makes Pepeto the best crypto to buy now while ETH and XRP recover?
Pepeto carries 100x analyst targets backed by a confirmed Binance listing with $9.21 million already committed. Ethereum targets 25% from $2,330 and XRP targets 39% from $1.42, both over months.
How does the XRP Ledger lending vote affect the best crypto to buy now?
The XLS-65 and XLS-66 vote adds DeFi to the XRP Ledger for the first time. Pepeto at presale pricing delivers the return that XRP needs quarters to match from a single listing event.
Disclaimer: This is a Press Release provided by a third party who is responsible for the content. Please conduct your own research before taking any action based on the content.

Crypto World
FanDuel Alternative Searches Keep Climbing and ZunaBet Is at the Center of the Conversation

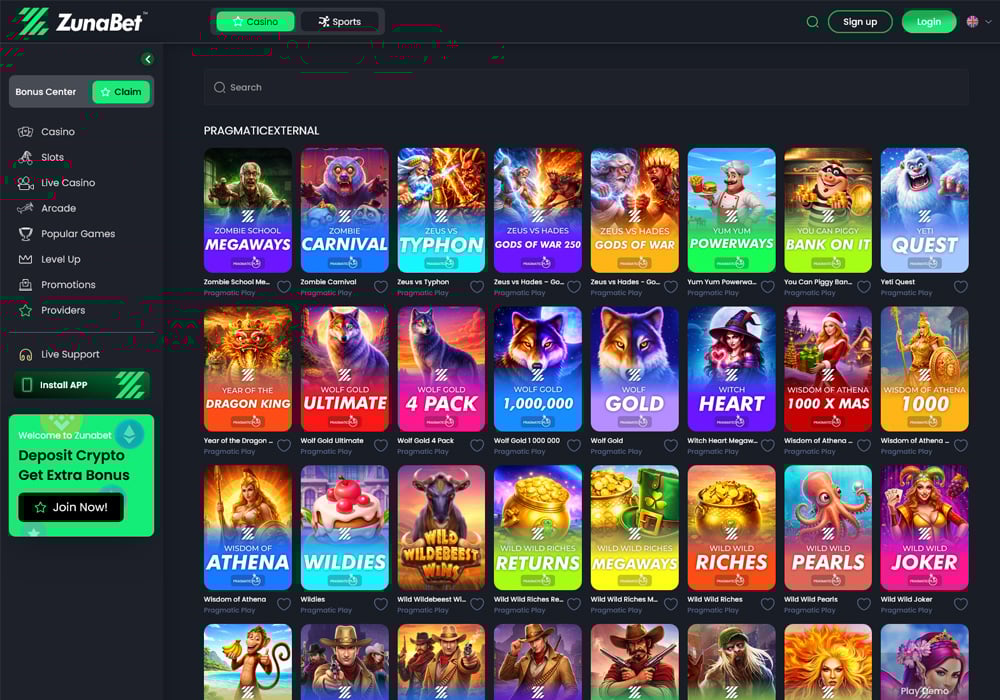
There is a pattern forming in the online gambling market that is difficult to ignore. Players are searching for alternatives to the platforms they already know, and they are doing it in increasing numbers. FanDuel, long considered one of the pillars of the industry, is one of the brands most frequently appearing alongside the word “alternative” in search queries. This does not indicate that FanDuel has suddenly become a bad product. It indicates that the market around it has expanded and that players now have access to options that challenge the assumptions FanDuel was built on. Chief among those options is ZunaBet, a crypto-native casino and sportsbook that entered the market in 2026 with a platform so feature-rich that it immediately inserted itself into the conversation about where online gambling is heading next.
FanDuel: A Brand That Defined an Era
FanDuel helped shape what modern online gambling looks like in the United States. Its origin in daily fantasy sports gave it a head start in building a massive, engaged user base before the sports betting wave hit. When state-by-state legalization began opening the door to real-money wagering, FanDuel was ready. It expanded into sports betting and online casino gaming with speed and confidence, securing licenses across multiple states and locking in partnerships with some of the biggest names in professional sports.
Today, FanDuel operates a sportsbook that covers the full spectrum of American professional and college sports alongside international events in football, tennis, golf, motorsports, and more. Its casino section provides a solid collection of slots, table games, and live dealer experiences. The mobile app performs reliably and ranks consistently among the top gambling downloads in app stores. Brand awareness is extraordinarily high thanks to years of sustained advertising investment.
The payment experience on FanDuel reflects the era in which the platform matured. Bank transfers, debit cards, credit cards, PayPal, Venmo, and other established methods handle the movement of funds. These are familiar options that work without confusion for most users, even if they come with the processing times and transaction fees that are inherent to traditional financial systems.
FanDuel built a strong product for the conditions that existed when it grew. It optimized for US regulatory compliance, traditional payment accessibility, and broad mainstream appeal. Those were the right priorities at the time. But conditions have changed. Players now hold crypto. They expect instant transfers. They want game libraries that seem bottomless. They want loyalty programs that feel personal and exciting. The platforms meeting those new expectations do not look much like FanDuel, and that divergence is what is driving the search trend.
ZunaBet: A Platform That Arrived Ready
ZunaBet did not launch as a work in progress. When it went live in 2026, the platform presented a fully realized product that rivaled operators with years of additional runway. It is owned by Strathvale Group Ltd, managed by a team carrying more than two decades of collective industry experience, and licensed through an Anjouan gaming authority with registration in Belize. Every element of the platform reflects a deliberate decision to build for the crypto-native audience first and expand from there.
The game library is the most immediate evidence of that ambition. ZunaBet opened with 11,294 games drawn from 63 separate providers. That is not a goal or a projection. That is the number available to players from the first day. The providers contributing to this catalog include Pragmatic Play, Evolution, Hacksaw Gaming, Yggdrasil, BGaming, and a long list of additional studios that collectively ensure there is no gap in the offering. Slots naturally dominate the count, but the library extends meaningfully into RNG table games covering blackjack, roulette, baccarat, and poker variants, as well as a live dealer section that delivers the kind of real-time, studio-quality experience that has become essential for modern casino platforms.
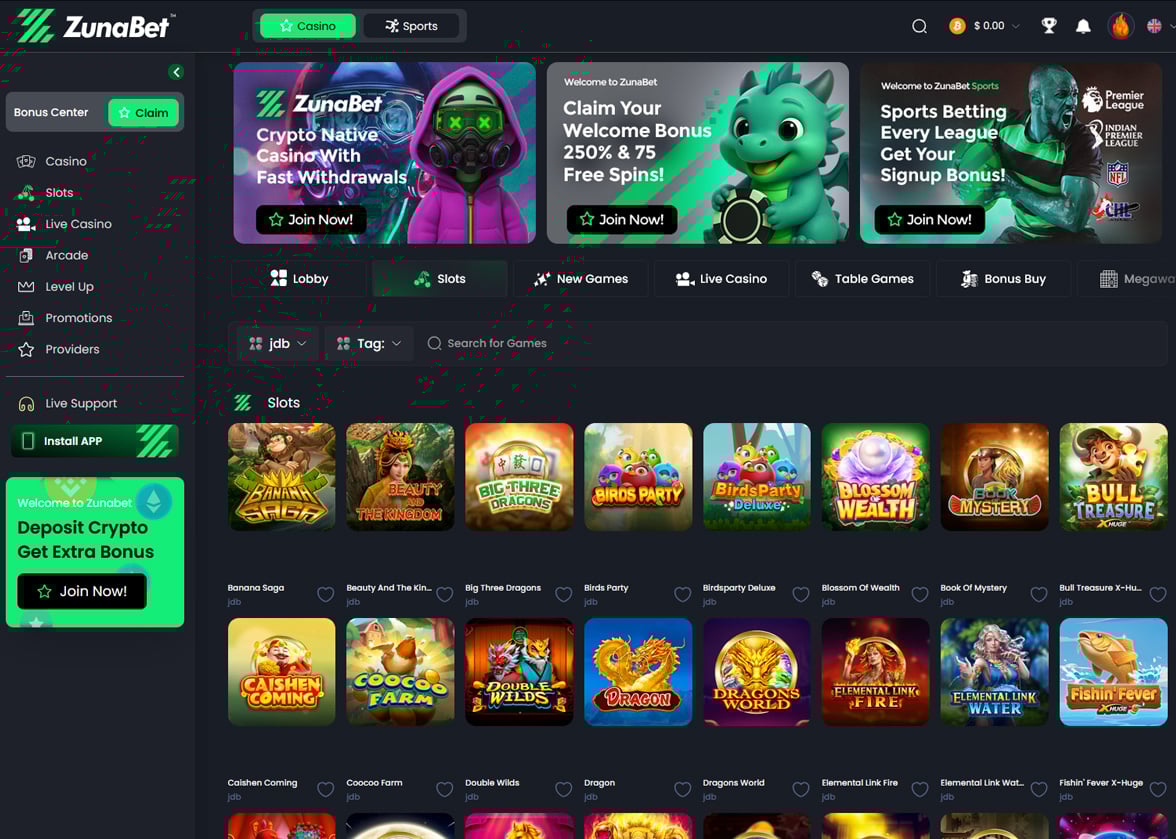
The practical effect of having over 11,000 games is that players never hit a wall. Discovery remains part of the experience for weeks and months rather than days. New providers and titles keep the catalog fresh, and the sheer volume means that even players with very specific preferences — whether that is a particular slot mechanic, a niche table game, or a specific live dealer format — are likely to find exactly what they want without compromise.
ZunaBet pairs this casino depth with a sportsbook that stands on its own merits. Coverage extends across football, basketball, tennis, NHL, combat sports, and virtual sports. Esports receives dedicated and comprehensive treatment with betting markets on CS2, Dota 2, League of Legends, and Valorant. This is a meaningful distinction from traditional platforms that either overlook esports entirely or offer a token handful of markets. Competitive gaming is not a passing trend. It is a global entertainment category with an audience that overlaps heavily with the demographic most likely to gamble online using cryptocurrency. ZunaBet recognized this overlap and built accordingly.
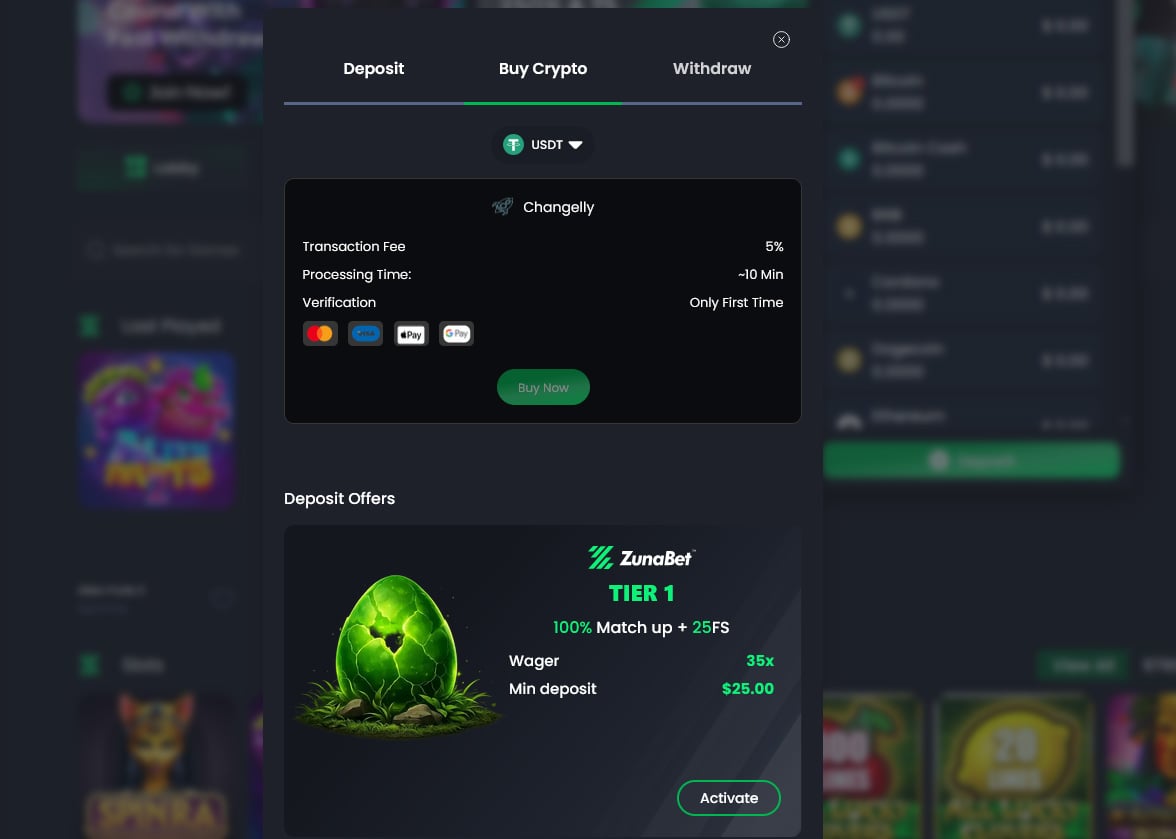
Cryptocurrency sits at the center of the payment experience. The platform accepts more than 20 coins and tokens including Bitcoin, Ethereum, USDT on multiple blockchain networks, Solana, Dogecoin, Cardano, and XRP. No processing fees are charged by the platform on any deposit or withdrawal. Speed is a defining feature — blockchain settlement means funds move in minutes rather than days, without the dependency on banking hours that traditional systems impose. Because ZunaBet was conceived as a crypto platform from its earliest design stages, there is no friction between the payment layer and the rest of the user experience. Everything flows from the same foundational logic.
The welcome offer provides up to $5,000 plus 75 free spins split across three deposits. The first deposit qualifies for a 100% match up to $2,000 and 25 free spins. The second delivers a 50% match up to $1,500 with another 25 spins. The third closes the package with a 100% match up to $1,500 and a final 25 spins. The multi-deposit structure serves a practical purpose beyond generosity. It gives players a reason to return after their first session, explore more of the library, and develop a relationship with the platform over time rather than treating it as a one-visit destination.
Technically, ZunaBet operates on HTML5 with a dark interface theme, fast load times, and responsive design that adapts seamlessly across screen sizes. Native applications are available for iOS, Android, Windows, and MacOS. Live chat support runs continuously, covering every hour of every day without interruption.
Crypto Infrastructure vs Traditional Payment Systems
The difference between crypto and traditional payment platforms in online gambling is not a minor technical detail. It is a core experience differentiator that affects how players interact with a platform during every single session.
Traditional payment infrastructure routes money through banks, card networks, and digital wallet services. Each intermediary in that chain introduces potential delays and costs. Deposit processing can be near-instant for some methods but slower for others. Withdrawals almost universally involve waiting periods that range from hours to several business days depending on the method selected, the day of the week, and any verification requirements the platform imposes. Transaction fees appear at various points — some charged by the platform, some by the payment provider, some by the player’s bank.
Crypto infrastructure operates on fundamentally different principles. Transactions settle on decentralized blockchain networks that run continuously. There are no business hours. There are no intermediary banks holding funds in pending status. When a player deposits Bitcoin or Solana into their ZunaBet account, the transaction confirms on the blockchain and the funds become available in minutes. Withdrawals follow the same path in reverse with comparable speed. The platform adds no fees of its own to any transaction.
This is not just faster. It is structurally different in ways that compound over time. A player who makes fifty deposits and fifty withdrawals over the course of a year saves meaningful amounts of both time and money on a crypto platform compared to a traditional one. Those savings are not theoretical. They accumulate in real terms with every transaction.
ZunaBet’s decision to build entirely on crypto infrastructure rather than bolting it onto a traditional system means the experience is consistent from end to end. There is no secondary payment path creating a disjointed experience. Every player interacts with the same streamlined, fee-free, fast-settlement system regardless of which specific cryptocurrency they choose to use.
Dragon Evolution vs Points Collection
The standard online casino loyalty program has not changed in any meaningful way in well over a decade. The formula is simple and universal — wager money to earn points, accumulate enough points to claim a reward, repeat indefinitely. It works as a basic retention mechanism, but it generates almost no emotional engagement. Players participate because the rewards exist, not because the process of earning them is interesting or enjoyable in any way.
ZunaBet designed its loyalty program to be an experience in itself. The dragon evolution system includes six progression tiers that each carry their own identity and reward structure. Squire begins at 1% rakeback. Warden increases to 2%. Champion reaches 4%. Divine climbs to 5%. Knight jumps significantly to 10%. Ultimate reaches the ceiling at 20% rakeback. At each tier, additional benefits unlock — free spins that scale from modest allocations at lower levels to 1,000 at the top, VIP club access, and double wheel spins. Tying the entire system together is Zuno, a dragon mascot that visually transforms as the player progresses upward through the ranks.
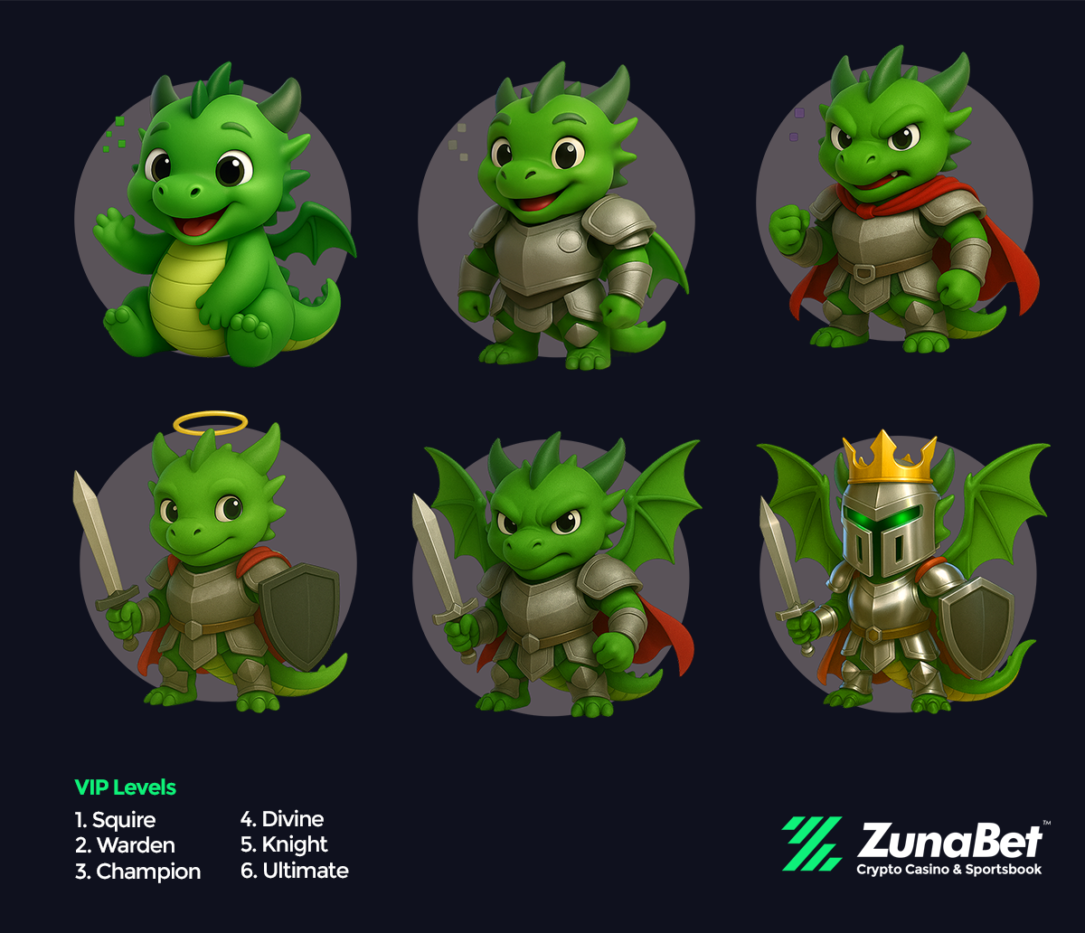
The structure mirrors the progression systems found in modern video games. There are defined levels with visible thresholds. Advancing feels like an achievement rather than an arbitrary accounting milestone. The rewards escalate meaningfully enough that reaching the next tier always feels worthwhile. And the visual evolution of the Zuno character gives players a tangible representation of their journey that a number on a screen simply cannot replicate.
This approach works because it aligns with how a large and growing portion of the gambling audience already thinks about engagement. Players who grew up with leveling systems, achievement badges, and progression-based unlocks in games understand this structure intuitively. It feels natural. It feels rewarding. And it gives them a reason to remain engaged with the platform beyond any individual session or bet.
What the Numbers Are Saying
The continued growth in searches for FanDuel alternatives tells a straightforward story about a market in transition. FanDuel built its position during a specific phase of the industry’s development and it built well. That position is not under immediate threat. The brand, the licenses, the user base, and the financial backing ensure that FanDuel will remain relevant for years.
But relevance and momentum are different things. The momentum in online gambling right now belongs to platforms that are solving the problems players actually talk about — slow payments, limited game variety, uninspiring loyalty programs, and a lack of crypto integration. ZunaBet addresses every one of those issues with solutions that are not incremental improvements but fundamental rethinks of how each element should work.
The players driving the search trend are not nostalgic for something old. They are looking forward. They want a platform that matches the speed, variety, and digital fluency they experience in every other area of their online lives. ZunaBet was built from the ground up to be that platform. It arrived with the game library of a veteran operator, the payment infrastructure of a blockchain-native fintech company, and a loyalty system that finally makes progression feel like something worth caring about. Every week, more players discover it. Every week, the search numbers confirm that discovery is accelerating. The trajectory is clear, and ZunaBet is riding it.
Disclaimer: This is a Press Release provided by a third party who is responsible for the content. Please conduct your own research before taking any action based on the content.


Aave just watched $6.6 billion walk out the door, and it’s not because anyone hacked Aave.
The protocol’s total value locked dropped from $26.4 billion on April 18 to nearly $20 billion in U.S. morning hours on Sunday, per DefiLlama. The AAVE token fell 16% to $92, and daily fees spiked to $1.99 million as liquidations ripped through the weekend.
Depositors are running because Aave is carrying a hole it did not create. When attackers drained 116,500 rsETH from Kelp’s bridge on Saturday, they dumped the stolen tokens on Aave V3 as collateral and borrowed wrapped ether against them.
On-chain trackers put the Aave-specific borrow at roughly $196 million, with total positions across Aave, Compound and Euler around $236 million.
Aave is the largest lending protocol in DeFi, where users deposit crypto to earn yield and other users borrow against collateral. Kelp is a liquid restaking protocol, which takes ether that has already been staked on Ethereum and routes it through a separate yield-generating system called EigenLayer, issuing a receipt token called rsETH in exchange.
That rsETH is what users trade and, critically, what some users posted on Aave as collateral to borrow against.
On Saturday, attackers tricked Kelp’s cross-chain bridge into releasing 116,500 rsETH, about $292 million worth, to an address they controlled. They then deposited that stolen rsETH onto Aave V3 as collateral and borrowed wrapped ether against it.
A bridge is a blockchain-based took that transfers tokens between different networks, where they may not be originally supported.
Aave first said the Umbrella reserve would cover any deficit. By Saturday afternoon the language had softened to “explore paths to offset the deficit.” That is not how a protocol talks when it knows how much it owes and has the money to pay it.
The concentration explains why the damage lands here. Aave’s loan book spans 22 chains, but Ethereum alone holds $14.24 billion of the $17.82 billion in outstanding borrows. WETH is 39.49% of all loans on the protocol, meaning the attack hit the exact collateral-to-WETH pair that dominates Aave’s book.
Stani Kulechov, Aave’s founder, said the exploit was external and the protocol’s contracts were not compromised. But Aave accepted a liquid restaking token as collateral, and that token’s backing vanished on a bridge Aave does not control. The depositors lose either way.
Liquid restaking tokens were whitelisted across every major lending protocol because they carried yield and represented growing share of Ethereum’s locked value.
The risk models priced them as if they would hold peg under normal conditions. However, none of them priced a scenario where the collateral goes to zero because a bridge on a chain Aave does not touch got exploited on a Saturday.
“AAVE is the backbone of DeFi, has billions in there, and pretty much every single new DeFi infrastructure on new chains is a fork of it,” trader Altcoin Sherpa wrote on X. “When AAVE has contagion risk, it shows the fragility of the entire system.”
What the token price is trying to answer now is whether Umbrella is big enough to cover the hole, and whether stkAAVE holders who back that reserve are about to eat the loss.

Key Takeaways
- AbbVie delivered 2025 revenues of $61.16 billion with 8.6% year-over-year growth and boosted its dividend by 5.5% heading into 2026
- Chevron achieved unprecedented production volumes in 2025 alongside a 158% reserve replacement ratio, maintaining strong analyst support
- Shell’s operations produced $26.1 billion in free cash flow during 2025, leveraging its position as a global LNG leader
- Enterprise Products Partners maintains a robust 1.7x distribution coverage ratio while offering nearly 6% yield
- Realty Income delivered Q4 2025 adjusted funds from operations of $1.08 per share with monthly dividend distributions
Income-focused investors seeking dependable returns through 2028 are examining five dividend-paying equities: AbbVie, Chevron, Shell, Enterprise Products Partners, and Realty Income.
These companies all deliver yields exceeding 3%, supported by fundamentals that extend well beyond their dividend distributions. The strategy centers on identifying enterprises with consistent cash generation, sustainable leverage levels, and distributions supported by actual profitability.
AbbVie
AbbVie stands out as the premier selection among these dividend stocks. Trading with approximately a 3.3% yield, the pharmaceutical giant posted 2025 revenues totaling $61.16 billion, representing an 8.6% increase year-over-year.
The company’s immunology drugs Skyrizi and Rinvoq have successfully offset revenue declines from Humira, which encountered biosimilar competition. This product transition has exceeded expectations across the analyst community.
For 2026, AbbVie announced a 5.5% dividend increase. Wall Street sentiment tracked by MarketBeat reveals 16 buy recommendations, 9 hold ratings, and zero sell calls, establishing a Moderate Buy consensus. The absence of any sell ratings demonstrates notable analyst confidence.
Chevron
Chevron achieved peak production volumes throughout 2025 while posting a 158% reserve replacement ratio, indicating the energy giant added substantially more reserves than it extracted during the period.
The company elevated its quarterly distribution to $1.78 per share. MarketBeat data shows analyst sentiment averaging a Hold, with 14 buy ratings, 6 holds, and 4 sell recommendations.
This tempered Wall Street enthusiasm could present opportunity. When analyst excitement remains moderate, stocks often have greater appreciation potential—particularly if commodity prices stabilize and shareholder returns continue.
Shell
Shell extends beyond traditional petroleum operations. The company ranks among the world’s foremost liquefied natural gas operators, providing diversification versus typical U.S. energy majors.
During 2025, Shell produced $42.9 billion in operating cash flow and $26.1 billion in free cash flow. Management maintains a policy of distributing 40% to 50% of operating cash flow to shareholders.
MarketBeat tracking shows 6 buy ratings, 13 holds, and zero sell recommendations. The company’s LNG operations provide exposure that traditional oil-focused competitors cannot match.
Enterprise Products Partners
Enterprise Products Partners delivers the strongest yield among these five stocks at approximately 6%. The partnership recently reported 1.7x distribution coverage, demonstrating that cash flow substantially exceeds payout obligations.
Coverage ratios carry significant weight in evaluating high-yield investments. While a 6% yield might raise sustainability concerns, robust coverage indicates the distribution faces no immediate risk.
MarketBeat consensus stands at Moderate Buy with 10 buy ratings, 6 holds, and 2 sells. Prospective investors should note that partnership ownership generates K-1 tax documentation, standard for master limited partnerships.
Realty Income
Realty Income markets itself as “The Monthly Dividend Company,” distributing payments to shareholders twelve times annually. The REIT reported fourth-quarter 2025 adjusted funds from operations of $1.08 per share, maintaining a net debt to EBITDAre ratio of 5.4x.
The stock demonstrates sensitivity to interest rate movements, with performance closely tracking monetary policy changes. Should rates decline over the coming years, Realty Income stands to benefit through both its yield appeal and potential multiple expansion.
Analyst perspectives remain measured, with MarketBeat showing 6 buys, 9 holds, and 1 sell rating, while StockAnalysis consensus leans toward Hold.
Bottom Line
Among these five dividend opportunities, AbbVie leads based on its combination of income generation and earnings expansion. Chevron and Shell provide energy sector exposure supported by substantial cash returns. Enterprise Products ranks fourth for investors prioritizing current income, while Realty Income places fifth with its monthly payment structure and potential interest rate tailwinds.


Monero (XMR) has reached its 12-year milestone since its launch in 2014.
Summary
- Monero celebrates 12 years since launch in 2014 as leading privacy-focused cryptocurrency network.
- Network hides sender, receiver, and amount using cryptographic tools like Ring Confidential Transactions.
- Despite over 70 exchange delistings, Monero maintains active users and steady market participation.
The project has positioned itself as a privacy-focused cryptocurrency designed to hide transaction details on a public blockchain.
On April 18he project marked the occasion with a public message shared on X. The team stated “we’re celebrating our 12th birthday today” while thanking users for continued support of privacy-focused transactions.
Monero has maintained its position as one of the leading privacy coins in the digital asset sector over the years, focusing on confidentiality in transfers.
Monero was built to address transparency found in other blockchain networks. Unlike Bitcoin, where transactions are publicly visible, Monero hides sender, receiver, and transaction amounts.
The network uses technologies such as Ring Confidential Transactions and stealth addresses. These tools are designed to prevent linking transactions to specific users or wallet balances.
The system also ensures that coins cannot be traced through transaction history. This design aims to prevent tracking of individual units across the network.
Moreover, Monero has faced ongoing regulatory scrutiny due to its privacy features. Over the years, several exchanges have removed the token from their platforms.
Reports suggest the token has experienced more than 70 delistings across different jurisdictions. Despite this, trading activity and user participation have continued across alternative platforms and peer-to-peer markets.
The project has remained active through a global developer and user community that continues to maintain and update the protocol.
Development Activity and Market Performance
Monero developers are currently working on upgrades, including a planned FCMP++ update aimed at improving network performance and privacy features.
Interest in privacy coins has shown periodic changes in market cycles. Monero experienced renewed attention earlier this year alongside movements in other privacy-focused assets such as Zcash.
At the time of reporting, Monero trades near $351 with a market capitalization of about $6.47 billion (per CoinGecko’s data). The asset has recorded short-term gains over recent trading sessions, with modest increases in both daily and weekly performance.

TLDR:
- A $292M rsETH exploit enabled massive borrowing on Aave, leaving the protocol with unbacked collateral exposure.
- Aave’s ETH pool reached full utilization, restricting withdrawals as panic-driven outflows exceeded $5.4 billion.
- Technical indicators show AAVE weakening after rejection near $120, with momentum still favoring downside pressure.
- Critical support near $90 remains under watch as markets assess stability following one of 2026’s largest DeFi events.
Aave’s lending markets faced acute stress after a large exploit tied to Kelp DAO triggered a liquidity crunch. The incident drained hundreds of millions in assets and pushed Aave’s ETH pool to full utilization, limiting withdrawals across the protocol.
Liquidity Crunch Follows Kelp DAO Exploit
A sudden exploit involving Kelp DAO’s rsETH token triggered widespread concern across decentralized finance markets.
The attacker reportedly drained 116,500 rsETH, valued at about $292 million, from a LayerZero bridge. The stolen assets were then deployed in a strategy that strained Aave’s liquidity.
According to Coin Bureau, the attacker deposited the compromised rsETH as collateral on Aave V3. This move allowed the borrowing of nearly $236 million in wrapped ETH.
However, the rsETH backing those positions is now considered invalid, leaving the loans without proper collateral support.
As a result, Aave is facing an estimated $280 million in unrecoverable debt. The protocol’s ETH pool reached 100% utilization, meaning nearly all available liquidity has been borrowed. Users attempting to withdraw ETH encountered delays or were unable to exit positions.
Market reaction was swift, with large-scale withdrawals reported across the platform. Data suggests over $5.4 billion in ETH outflows occurred خلال the panic phase. High-profile withdrawals added to the pressure, including a reported 65,584 ETH withdrawal by Justin Sun.
This situation marks a major stress event for Aave’s risk management systems. It also serves as a real-time test for its Umbrella safety module, which is designed to handle extreme conditions. The unfolding events continue to draw attention across the crypto sector.
AAVE Price Faces Pressure After Failed Rally
Market data shows that AAVE experienced a sharp rejection after attempting a breakout toward the $115–$120 range. The price has since retreated to around $93.90 on the 4-hour chart. Despite a modest recovery within the session, broader momentum remains weak.
Earlier price action reflected a steady decline from the $120 region toward $90 levels. This phase was followed by a period of sideways consolidation between $92 and $102. The recent rally attempt failed to hold, leading to renewed selling pressure.
Technical indicators show a bearish short-term structure. The Relative Strength Index is currently at 34.55, approaching oversold territory but not fully there. Its position below the moving average suggests continued downward momentum.
At the same time, the MACD indicator remains in negative territory. The widening histogram signals sustained selling activity, with no clear crossover indicating a reversal yet. This aligns with the broader price rejection seen on the chart.
Key support is now concentrated around the $90 level, with $89.50 acting as a critical breakdown point. If this zone fails, the next downside targets could fall between $85 and $80. On the upside, resistance remains firm near $100 and higher around $110.
Traders are closely monitoring whether the price can stabilize above the current support levels. A rebound would require improving momentum signals and renewed buying activity. Until then, the market structure continues to reflect caution following the recent exploit.
TLDR:
- PEPE remains within a strong weekly demand zone, signaling possible accumulation despite an 88% correction from highs.
- A breakout above $0.000006 resistance could confirm trend reversal and open room for major upside targets.
- Historical fractal patterns suggest potential for explosive rallies if the current support structure holds steady.
- Failure to hold above $0.0000017 may invalidate the bullish setup and extend consolidation further.
PEPE traded near a major support zone after a steep correction, with price stabilizing around $0.00000376. The weekly structure showed a potential re-accumulation phase forming, as traders monitored whether the current demand area could sustain a recovery.
Weekly Accumulation Zone Draws Market Attention
The latest chart showed PEPE sitting within a high-confluence support region formed by a fair value gap, order block, and horizontal demand. This area ranged between $0.0000030 and $0.0000018, where price activity remained steady.
A tweet from Crypto Patel described this setup as a rare fractal structure, noting similarities with a previous accumulation phase. The post referenced a past 4,515% move that followed a similar pattern during the earlier cycle.
Price data confirmed that the current level aligned with historical consolidation zones before large upward expansions. The chart also showed price maintaining position above the lower boundary, which remained critical for structural stability.
At the same time, the analysis noted that invalidation would occur below $0.0000017. Holding above this level kept the accumulation structure intact, while a breakdown could shift the market into a deeper consolidation phase.
Resistance Levels and Price Structure Define Next Move
The chart marked a key resistance zone near $0.000006 to $0.000007123, where previous support turned into resistance. Price attempts to reclaim this level, which had failed during earlier retests following the breakdown.
Trendline analysis showed that two ascending supports were broken before the decline accelerated. Each breakdown was followed by rejection, forming a consistent pattern of lower highs across the weekly timeframe.
The chart also presented projected upside targets if the price breaks and holds above resistance. These targets ranged between $0.000028 and $0.0001, based on earlier expansion patterns.
At the same time, historical data showed projected moves of 3,079% and 5,592% during bullish cycles. These projections aligned with prior market behavior observed during strong upward phases.
Current price action remained below resistance, keeping the structure within a defined range. Short-term movement showed minor upward attempts, although no confirmed breakout had formed.
The chart also showed an 88.99% correction into the current zone, reflecting deep pullbacks seen in previous cycles. This retracement brought the price back into a demand area where accumulation had occurred before.
Traders continued to watch whether the price could reclaim the resistance level and confirm a shift in structure. Until then, the market remained within a consolidation phase defined by support holding and resistance capping upward movement.


Three wallets, one denial, and $5.7 billion in market cap gone in 48 hours.
RaveDAO’s RAVE crashed 90% over 24 hours as crypto exchanges Binance and Bitget opened investigations into the trading activity that catapulted the token to a $6 billion market cap last week.
Bitget CEO Gracy Chen confirmed the probe on X, and Binance co-CEO Richard Teng subsequently said the exchange was reviewing the matter and would “always” do its part to examine signs of market misconduct. Gate.io was also named in the original allegations from onchain investigator ZachXBT, who has offered a $25,000 bounty for whistleblowers with evidence of the parties involved.
The collapse accelerated after the project’s Saturday denial rather than stabilizing on it.
RaveDAO posted a six-part X thread stating the team “is not engaged in, nor responsible for, recent price action.”
The thread did not address any of the specific onchain allegations that prompted the scrutiny, including the concentration of roughly 90% of the 1 billion RAVE supply across three Gnosis Safe multi-signature wallets attributed to the team, or the millions of tokens transferred to exchanges shortly before the rally began.
The original rally took RAVE from about $0.25 to $27.33 in nine days, a 10,800% move that triggered $44 million in liquidations on Friday, just behind bitcoin and ether, with the bulk of them from short sellers positioned against the token.
Investigators flagged a “bait and liquidate” pattern in which visible token transfers to exchanges suggested incoming sell pressure, drawing traders into short positions before those tokens were withdrawn and prices ripped higher, forcing shorts to cover at progressively worse levels.
RaveDAO presents itself as a Web3 entertainment platform offering onchain ticketing for electronic music events, tracing its origins to a 2023 Istanbul afterparty. The project reported about $3 million in 2025 revenue and lists partnerships with Binance, OKX, Bitget, and Polygon.
RaveDAO’s thread did confirm the team plans to “liquidate portions of unlocked tokens” when appropriate to fund operations and marketing, and said it was “exploring appropriate models, including price-triggered or performance-triggered locks, that tie team incentives to ecosystem growth.”
It did not commit to any specific lockup mechanism or timeline, however.
Crypto World
Grayscale Files Spot TAO ETF as Bittensor Network Rebounds from Covenant AI Exit and 38% Drawdown
TLDR:
- Grayscale raised TAO weighting to 43.06% in its AI fund, its largest single-asset reallocation ever made.
- Community miners restored SN3, SN39, and SN81 from open-source code with no central operator involvement needed.
- Bitwise and Grayscale both filed TAO ETF applications on April 2, with an SEC decision tracked for August 2026.
- Teutonic targets a 1-trillion-parameter training run in May, timed with the ETF’s peak SEC review window.
Bittensor proved antifragile after a 38% drawdown triggered by Covenant AI’s sudden exit from three major subnets. Community miners restored SN3, SN39, and SN81 entirely from open-source code, with no central operator involved.
Around 70% of supply remained staked throughout the disruption. Spot outflows exceeded $70 million on multiple consecutive days after the crash.
Grayscale’s spot TAO ETF filing and a series of protocol upgrades are now drawing renewed attention to $TAO’s recovery case.
Grayscale’s ETF Filing and Institutional Moves Signal Confidence in Bittensor
Grayscale raised its TAO weighting to 43.06% inside its AI fund on April 7. That move marked the largest single-asset reallocation the fund has ever executed.
It came three days before the Covenant crash became public. The timing led observers to conclude that Grayscale had been running independent structural analysis on the network.
On April 2, Grayscale filed an S-1 Amendment for a spot TAO ETF on NYSE Arca. Bitwise filed a parallel TAO strategy ETF on the same day.
The SEC decision window is currently tracked for August 2026. However, market analysts note the repricing may not wait for formal approval.
Crypto analyst @Karamata2_2 pointed to Bitcoin and Ethereum as precedents for pre-approval price movement. Both assets moved significantly during their respective SEC review windows.
That pattern places the current filing period as a meaningful near-term catalyst. The $218–$240 demand zone remains the key structural level for $TAO to hold.
Supporting the institutional picture, GeneralTensor closed a $5 million funding round in March. The round was anchored by a Goldman-backed fund, with DCG also participating.
The TAO Institute launched on April 15 with a dedicated subnet risk index. Together, these moves reflect sustained institutional engagement despite the recent network turbulence.
Protocol Upgrades and Active Subnets Reinforce Bittensor’s Antifragile Case
BIT-0011, the Conviction Mechanism, is a core protocol upgrade shaping Bittensor’s next phase. Subnet founders and stakers lock alpha tokens to earn conviction scores across 30-day intervals.
The staker holding the highest score gains ownership of the subnet. Tokens locked during the active period cannot exit until the interval concludes.
The community restart of SN3, SN39, and SN81 without founder intervention served as a real stress test. Chain emissions and ownership routing continued without interruption throughout that period.
Karamata2_2 described the outcome as the best live demonstration of antifragility the network could have produced. BIT-0011 formalizes that model at the protocol level going forward.
Teutonic, formerly Templar, is targeting a 1-trillion-parameter decentralized training run for mid-to-late May. Should that milestone land during the ETF application’s most visible SEC review window, attention may return sharply.
The narrative shifts from a network that survived its biggest blowup to one that is still actively scaling. That framing matters most precisely because Covenant’s exit raised doubts about the technology’s depth.
Active subnets continue producing measurable output across the ecosystem. Chutes AI accounts for 14.39% of daily emissions and processes over 50 billion tokens per day, with a revenue-funded buyback already live.
TargonCompute co-authored an Intel TDX whitepaper and projects $10.4 million in ARR. With 128 active subnets expanding toward 256 and a subnet alpha market cap near $1.03 billion, Bittensor’s operational picture remains intact.
Crypto World
President Trump accuses Iran of ceasefire breach as Bitcoin reacts to market uncertainty


U.S. President Donald Trump has accused Iran of breaching a ceasefire agreement.
Summary
- Trump accused Iran of ceasefire violation following reports of activity in Strait of Hormuz.
- Iran denied allegations and claimed United States actions breached agreement under international law frameworks.
- Bitcoin price showed volatility, dropping from recent highs amid rising geopolitical uncertainty and market caution.
The claim follows reports that Iran opened fire in the Strait of Hormuz during the truce period.
Trump described the situation as a “serious violation” and warned that further action could follow if negotiations fail. He stated ”it will happen, one way or another” while referring to ongoing efforts to reach a resolution.
Despite the tension, Trump indicated that discussions are still active. He expressed confidence that a deal could be reached before the ceasefire deadline set for April 22.
Iranian officials responded by rejecting the accusations and placing blame on the United States. A spokesperson from Iran’s Ministry of Foreign Affairs stated that U.S. actions had breached the terms of the ceasefire.
The spokesperson said ”the blockade of ports is unlawful and violates international law” in a statement shared publicly. The response also referenced international legal frameworks, including provisions under the United Nations Charter.
Iran’s statement described the situation as escalating tensions rather than a one-sided breach. Both sides have continued to exchange claims, adding to uncertainty around the ceasefire status.
Bitcoin Price Reacts to Geopolitical Developments
Bitcoin has shown price movement in response to the developments. The asset declined from around $76,300 to near $75,500 as reports of renewed tension emerged.
Market data indicates that Bitcoin had earlier risen above $78,000 after initial reports suggested progress in negotiations. The reversal followed conflicting updates from both sides regarding the ceasefire.
Crypto markets often react to geopolitical events, with price swings linked to investor sentiment and risk perception during uncertain periods.
Moreover, the broader crypto market has also experienced volatility during the same period. Traders have adjusted positions as new information continues to emerge from diplomatic discussions.
Bitcoin remains sensitive to external developments, especially those linked to global stability and economic outlook. Market participants are monitoring updates related to the ceasefire and any potential policy response.
Price fluctuations have remained within a narrow range over the past sessions, reflecting cautious trading behavior. The situation continues to evolve as negotiations between the United States and Iran remain ongoing.
Disclosure: This article does not represent investment advice. The content and materials featured on this page are for educational purposes only.

XRP Ledger Votes on Native Lending Protocol While ETH Breaks Out and Pepeto Targets 100x

Campaigners condemn GMP’s “despicable” “extreme violence” vs anti-fascist protesters

How Antony Taylor can referee Man City vs Arsenal despite Manchester roots as rule explained


-
 NewsBeat7 days ago
Pep Guardiola and Gary Neville agree over Arsenal title problem that benefits Man City
-

 Crypto World6 days ago
The SEC Conditionalises DeFi Platforms to Be Avoided for Broker Registration
-

 Fashion2 days ago
Weekend Open Thread: Theodora Dress
-

 Crypto World6 days ago
SEC Signals Exemption for Crypto Interfaces From Broker Registration
-

 News Videos4 days ago
Secure crypto trading starts with an FIU-registered
-

 Sports2 days ago
NWFL Suspends Two Players Over Post-Match Clash in Ado-Ekiti
-

 Crypto World5 days ago
SEC Proposes Certain Crypto Interfaces Don’t Need to Register as Brokers
-

 NewsBeat5 days ago
Trump and Pope Leo: Behind their disagreement over Iran war
-

 Politics2 days ago
Palestine barred from entering Canada for FIFA Congress
-

 Crypto World2 days ago
Russia Pushes Bill to Criminalize Unregistered Crypto Services
-

 Sports6 days ago
NWFL opens Pathway for new Clubs ahead of 2026 Season
-
 Business3 days ago
Creo Medical agree sale of its manufacturing operation
-

 Crypto World6 days ago
Trump whales load up ahead of Mar-a-Lago luncheon.
-
 Entertainment6 days ago
Brand New Day’ Footage Reveals the Devastating Impact of ‘Now Way Home’
-

 Politics5 hours ago
Zack Polanski demands ‘council homes not luxury flats for foreign investors’
-
Business6 days ago
Kering slides after Morgan Stanley downgrade, Gucci woes loom
-

 Tech6 days ago
Google adds E2E encryption to Gmail for iOS and Android enterprise users
-
Crypto World7 days ago
Sei Network Enters Quiet Reset Phase as On-Chain Metrics Signal a Slowdown in 2026
-

 Tech6 days ago
Apple glasses won’t go brand shopping like Meta did with Ray-Ban and Oakley
-
Entertainment6 days ago
How Euphoria Season 3 Premiere Paid Tribute to Eric Dane After Death
You must be logged in to post a comment Login