
Crypto World
can Pi escape its range in 2026?
Pi has morphed from a hyped IOU into a battered $0.18 L1; 2026’s open mainnet will decide whether it earns real usage or just fuels another round of unlocked sell pressure.
Summary
- Pi now trades near $0.18 with a roughly $1.7–1.8 billion market cap after an 80–90% rally toward $0.30 faded, as unlocks and miner distribution keep it pinned near cycle lows.
- The 2026 “open mainnet” pivot — stricter KYC, biometric checks and migrating 2.5 million users into a compliant, transferable environment — is the only real catalyst beyond more supply hitting order books.
- External forecasts mostly cluster around range‑bound outcomes, with 2026 levels near $0.20 and best‑case 2030 targets in the low single digits if, and only if, Pi proves real usage, listings and on‑chain activity.
Pi Network (PI) has moved from a hyped IOU narrative to a battered, liquid L1 asset trading around the mid‑$0.17–$0.18 range, with its next leg entirely dependent on whether the 2026 open mainnet phase actually delivers real usage instead of just unlocked sell pressure. Treat it like any other high‑beta alt: structurally cheap on optics, structurally dangerous on tokenomics and execution risk.
Where Pi Trades Now
Pi sits near $0.18 with a market cap around $1.7–1.8 billion, down sharply from its speculative IOU blow‑off in 2022 when prices briefly printed triple‑digit wicks on thin order books. Recent price action tells you everything: the token rallied roughly 80–90% into late February–mid March 2026 toward $0.30, then faded back toward $0.20 as momentum stalled and RSI divergences flashed. Unlocks are biting – the token has logged several sessions near its all‑time low area as supply from long‑time “miners” meets underwhelming demand on centralized venues. Liquidity is decent but not deep enough to absorb aggressive distribution from a 10‑figure fully diluted supply without persistent slippage.
What Actually Changes In 2026
The core fundamental catalyst is the move toward an “open mainnet” with real transactions, dApps and stricter KYC/security, after years of closed‑ecosystem promises. The team is rolling out enhanced verification (KYC, palm‑print, AI checks) and has cleared roughly 2.5 million users for migration, crucial to get coins off the grey zone and into a compliant, transferable state. A broader 2026 roadmap ties this to supporting real‑world finance integrations and payments, but so far the market has treated each technical milestone (like the Pi Launchpad testnet) as a sell‑the‑news event rather than a re‑rating trigger.
Price Scenarios: 2026–2030
External models cluster Pi’s fair‑value band for the next few years somewhere between “modest grind” and “permanent underperformance.” Gate.io’s internal work sees an average near $0.20 for 2026, with a rough range between about $0.16 and $0.27 – effectively where it is already trading. Other forecasters project that, if the ecosystem scales and listings proliferate, Pi could grind into the low single digits by 2030, with some estimates around $2.50–$3.50 under constructive conditions. Those paths assume three things that are not yet proven: successful open mainnet, sustained user activity beyond mining, and a crypto macro environment that rewards L1 risk instead of choking it.
Verdict: Trade The Range, Don’t Worship The Narrative
For now, Pi looks like a liquid, range‑bound beta play rather than a structural compounder. Bulls get a clear technical invalidation: hold above the mid‑$0.17 pivot and reclaim the $0.23–$0.25 resistance band, and the market can start repricing toward the psychological $0.30–$0.40 area on any mainnet or listing surprise. Bears lean on the opposite logic: continued unlocks plus weak on‑chain usage send Pi into a slow bleed, with each rally sold by early miners finally getting exit liquidity. In this tape, smart money treats Pi as an event‑driven trade around roadmap milestones and macro risk cycles, not as a religion – position small, respect liquidity, and assume volatility is the rule, not the exception.

Crypto World
Adam Back denies he’s Satoshi Nakamoto after a new report claims he’s Bitcoin’s (BTC) creator


Adam Back has denied claims that he is Satoshi Nakamoto after a New York Times story argued that the British cryptographer is the strongest candidate yet for Bitcoin’s pseudonymous creator.
In a post on X after the article was published, Back said his long record in cryptography, privacy tools and electronic cash research explains why reporters keep finding links between his work and Bitcoin’s design.
“I’m not satoshi,” Back wrote. He said he had been “early in laser focus on the positive societal implications of cryptography, online privacy and electronic cash,” and that his work from about 1992 onward, including discussions on the cypherpunks mailing list, led to Hashcash and other ideas later echoed in Bitcoin.
Back, said NYT reporter John Carreyrou, had found “many interesting bitcoin analogs in early attempts to create a decentralized ecash,” adding that early researchers explored concepts such as peer-to-peer systems, proof-of-work, and routing models that looked like prototypes for Bitcoin.
He also disputed one line in the story that treated a comment he made in an interview as a possible slip. Back’s remark — “I’m not saying I’m good with words, but I sure did a lot of yakking on these lists actually” — referred to confirmation bias. Because he wrote so often about electronic cash, he said, his old comments are easier to match with Satoshi’s than those of others who posted far less.
“The rest is a combination of coincidence and similar phrases from people with similar experience and interests,” Back wrote.
He added that he does not know who Satoshi is and said that it may be good for Bitcoin. In his view, the mystery helps frame Bitcoin as “a new asset class, the mathematically scarce digital commodity.”
Others also questioned the conclusions. Joe Weisenthal, a Bloomberg columnist and co-host of the Odd Lots podcast, said he was “not 100% convinced by the evidence or the conclusion.”
“The stylometry is interesting, but on content, ofc all the cypherpunks had similar thoughts on politics and privacy and the architecture of the internet,” he wrote on X. He also questioned why Back would speak openly about earlier work like Hashcash under his real name but use strict anonymity for Bitcoin.
“None of us are that consistent with hyphenization,” Weisenthal added, arguing that shared writing quirks may not be meaningful. He noted that Back was already among those closest to assembling Bitcoin-like ideas before its launch, which could explain his later involvement.
The question of Satoshi’s identity has drawn speculation for years. Several books, documentaries and articles have claimed to have solved it, only for those cases to unravel or fail to persuade the wider Bitcoin community. In 2024, one high-profile documentary pointed to developer Peter Todd, who denied the claim.
Nicholas Gregory, a U.K.-based early Bitcoin participant, also pushed back on the latest theory.
“I don’t believe Adam Back is Satoshi based on my personal interactions with him,” Gregory said. “However, if he were, we would have to respect the extraordinary lengths he has gone to in order to ensure no one thinks it’s him. In that case, we should honor his clear desire for privacy.”
Gregory said the longer the search continues, the more extreme the theories become. He added that many reporters miss key parts of Bitcoin’s early history and make avoidable errors.
He also warned that publicly identifying Satoshi could put that person and their family at risk.


Key takeaways
- BTC is up 4% and is now trading above $71k.
- The rally could push Bitcoin’s price above $76k for the first time since March 16.
Bitcoin and crypto market surge following U.S.-Iran ceasefire announcement
Bitcoin (BTC), Ethereum (ETH), and the broader cryptocurrency market experienced a significant rise over the last 24 hours after the U.S. and Iran reached a ceasefire agreement.
At press time, Bitcoin was trading at approximately $71,640, up 4.3% in the last 24 hours. Earlier in the day, the cryptocurrency briefly surpassed $72,700, marking its highest value since March 18.
Ethereum gained 6.7%, reaching $2,257, while XRP increased 5.8% to $1.37. Solana surged 6.5%, hitting $84.81. The overall crypto market was up 3.95% during the same period.
The surge coincided with President Donald Trump’s announcement that the U.S. and Iran had agreed to a two-week “double-sided ceasefire.” Trump, who had previously warned of a possible military response if Iran failed to reopen the Strait of Hormuz, emphasized that the ceasefire was a result of having met all military objectives and being close to a long-term peace agreement.
Iran’s official statement confirmed its commitment to allowing safe passage through the Strait of Hormuz, the world’s most vital oil trade route. This had previously caused significant volatility in global oil prices and disrupted supply chains.
BTC eyes $76k as bullish momentum persists
The BTC/USD 4-hour chart remains bearish and efficient despite the recent rally. The leading cryptocurrency has surpassed the $69,200 resistance level and could challenge the swing high of $76,000 over the next few hours or days.
The momentum indicators show that the bulls are currently in control of the market. The Relative Strength Index (RSI) on the 4-hour chart reads 70, approaching the overbought condition, indicating that the bulls are in control.

The MACD lines are also within the positive territory, reaffirming the bullish bias. If the rally persists, BTC could retest the $76,000 resistance level for the first time since March 16. Surpassing this resistance level would pave the way for Bitcoin to surge toward the $80k psychological zone.
However, if the bulls fail to capitalize on this rally, Bitcoin will find immediate support around the Tuesday low of $67,719.

Key Highlights
- Japanese regulators authorize SBI Ripple Asia’s XRPL Token Platform
- Platform facilitates regulated token creation under Japanese financial legislation
- Businesses gain blockchain access through streamlined API connectivity
- System operates within Japan’s prepaid payment regulatory structure
- Strategic focus includes real-world applications and international payment corridors
Following regulatory authorization from Japanese financial authorities, SBI Ripple Asia has officially introduced its XRPL Token Platform. This blockchain-based infrastructure enables organizations to issue digital tokens while maintaining full compliance with Japan’s financial regulatory framework. The development represents a significant milestone in merging distributed ledger technology with traditional payment ecosystems.
Blockchain Platform Debuts with Enterprise API Capabilities
SBI Ripple Asia has finalized its XRPL Token Platform utilizing the XRP Ledger as its foundational technology. This infrastructure provides organizations with capabilities to create and administer digital tokens through on-chain mechanisms. Enterprise clients can integrate blockchain functionality into their existing systems via application programming interfaces without disrupting end-user experiences.
The platform architecture facilitates smooth incorporation with established digital services and customer-facing applications. End users gain access to tokenized financial instruments while maintaining familiar interaction patterns. Proprietary wallet management technology embedded in the system delivers robust security protocols for digital asset custody.
Compliance with Japan’s Payment Services Act forms a core component of the XRPL Token Platform’s operational framework. Organizations can launch tokenized prepaid financial products within established regulatory boundaries. The infrastructure supports enterprise-grade scalability across diverse operational contexts.
Official Registration Unlocks Compliant Digital Payment Products
On March 26, 2026, SBI Ripple Asia obtained official registration as an authorized issuer of third-party prepaid payment instruments. This regulatory milestone empowers the XRPL Token Platform to launch compliant digital financial offerings. The company now operates as a legitimate bridge connecting blockchain innovation with supervised financial services.
This official status reinforces the legal infrastructure supporting the XRPL Token Platform within Japan’s financial sector. The authorization permits issuance of prepaid payment products underpinned by blockchain tokens. Regulatory oversight mechanisms remain fully integrated throughout the operational framework.
Through this positioning, SBI Ripple Asia establishes itself within Japan’s regulated digital asset landscape. The platform supports expanded utilization of blockchain-powered payment solutions. This framework demonstrates increasing institutional commitment toward compliant tokenization strategies.
Strategic Roadmap Emphasizes Practical Implementation and Regional Payment Networks
SBI Ripple Asia intends to implement the XRPL Token Platform across geographically focused economic areas including tourism-intensive regions. The infrastructure will connect consumer transactions with digital reward mechanisms and payment processing systems. Novel approaches to customer loyalty initiatives and transaction-based incentives become feasible through this framework.
The platform aims to enhance operational scalability and reduce transaction costs throughout collaborative business networks. Strategic partnerships with regional businesses and municipal organizations form a central component of the expansion strategy. These alliances will accelerate implementation in tangible commercial settings.
SBI Ripple Asia maintains active research initiatives focused on XRPL applications within Asian payment channels. Collaborative investigation with South Korea’s DSRV targets improvements in international money transfer systems. The XRPL Token Platform holds potential to optimize transaction speed and cost-effectiveness for Japan-South Korea payment flows.

Crypto World
Quantum threat to Bitcoin is real, but manageable, according to Wall Street broker Bernstein


Wall Street broker Bernstein said the rise of quantum computing poses a credible but manageable threat to Bitcoin and the broader crypto ecosystem, as recent breakthroughs compress timelines for potential attacks on modern cryptography.
Advances such as Google Quantum AI’s reported reduction in qubit requirements suggest the risk is no longer a distant, decade-long concern, the broker noted. Still, the firm cautioned that scaling quantum systems to the level needed to break widely used encryption remains a complex, multi-step challenge.
“Quantum should be seen as a medium to long term system upgrade cycle rather than a risk,” analysts led by Gautam Chhugani said in the Wednesday report.
Quantum computing uses the principles of quantum mechanics rather than classical physics. Instead of binary bits, it relies on qubits that can exist in multiple states at once, a property known as superposition, allowing many possibilities to be processed simultaneously.
Combined with entanglement, this enables quantum systems to solve certain problems, such as breaking encryption, far more efficiently than classical computers.
Quantum computers could eventually weaken cryptographic systems like elliptic curve encryption, which underpin crypto wallets, by solving problems beyond the reach of classical machines. However, the report said the threat spans industries from finance to defense and should be viewed as a manageable, long-term risk rather than an existential one for Bitcoin.
Exposure is concentrated in roughly 1.7 million BTC held in older, “legacy” wallets, while newer practices and protocols reduce vulnerability. Bitcoin mining, which relies on SHA-based hashing, remains effectively secure even in advanced quantum scenarios, the broker said.
Bernstein expects the crypto industry to have sufficient time, around three to five years, to transition toward post-quantum cryptography, with upgrades such as new wallet standards, reduced address reuse and key rotation already under discussion.
One recent academic paper said that attacking the Bitcoin blockchain through quantum mining would demand the energy output of a star.
Read more: Attacking bitcoin mining with a quantum computer would require the energy of a star, academics say

Bitget CEO Gracy Chen posted on X on April 7, calling Hyperliquid ‘immature, unethical, and unprofessional’ – and branded the platform an overmarketed fake crypto DEX that poses ‘FTX 2.0’ risks to users. The post landed like a grenade on Crypto Twitter, igniting one of the sharpest CEX vs DEX exchanges the industry has seen in years.
This isn’t background noise. Hyperliquid has been pulling serious volume – consistently above $1B in daily perp trades, directly cannibalising the perpetuals business of mid-tier and top-tier centralised exchanges, including Bitget.
- The accusation: Gracy Chen, Bitget CEO, publicly called Hyperliquid an ‘overmarketed’ fake DEX on April 7, warning of systemic risks comparable to FTX and describing it as an ‘offshore CEX with no KYC/AML.’
- The trigger: Hyperliquid’s small validator set unanimously delisted the JELLY memecoin perp market on March 26 and force-settled positions at $0.0095 after an attacker used a $6M short to exploit the HLP vault – exposing the platform’s centralized emergency override capability.
- The structural critique: Chen argued that Hyperliquid’s mixed vaults expose all users to collective risk from individual manipulators, and that foundation-level intervention in open markets sets a ‘dangerous precedent.’
- The volume context: Hyperliquid’s HYPE token and platform growth represent a direct threat to CEX perp revenue – making Chen’s critique land somewhere between principled concern and competitive self-interest.
- Industry split: BitMEX co-founder Arthur Hayes echoed decentralization concerns but downplayed long-term damage; Hyperliquid’s community pushed back hard, accusing Chen of conflating valid critique with CEX protectionism.
- What’s next: Hyperliquid has flagged validator expansions and HLP upgrades post-JELLY; Bitget’s Q2 2026 volume numbers will tell whether the controversy moved any market share.
Discover: The Best Crypto Exchanges for Active Traders
What Chen Actually Said and Why It Hit a Nerve With Hyperliquid
Chen’s post was direct: Hyperliquid operates like an ‘offshore CEX with no KYC/AML’ dressed in DeFi branding, and the JELLY incident proved it. Her core charge – that the decision to close the JELLY market and force-settle positions ‘sets a dangerous precedent’ – targeted the exact mechanism Hyperliquid uses to separate itself from traditional finance: on-chain, non-custodial execution with validator consensus.
Update: Bitget CEO Gracy Chen calls out Hyperliquid saying it operates more like an offshore CEX than a true DEX. — OGAudit
She pointed to the 2025 JELLY token incident where the platform closed the market and forcibly settled positions, causing major user losses.
This reignites the… pic.twitter.com/uy1zxCgLK2
 Crypto Reviews (@OGAudit) April 7, 2026
The JELLY incident on March 26 gave Chen’s critique its teeth. An attacker opened a $6M short on the newly listed JELLY memecoin perp – a token launched in January 2025 by Venmo co-founder Iqram Magdon-Ismail – then pumped the token’s on-chain price to trigger self-liquidation, threatening over $10M in losses for the HLP vault.
Hyperliquid’s validators responded by unanimously delisting the market and forcing settlement at $0.0095, shielding the vault but overriding open user positions in the process.
That intervention is the live evidence Chen is working with. Hyperliquid has built its brand – and its HYPE token valuation on the decentralization claim. Force-settling user positions via coordinated validator action isn’t what decentralized looks like. And Chen said so, loudly, with FTX in the headline.
Explore: The best pre-launch token sales with asymmetric upside potential
Why Bitget Is Really Swinging – and What Hyperliquid Crypto Has to Lose
The real story isn’t just executive-level beef. It’s volume. Hyperliquid has been consistently running $1B+ in daily perpetual volume – the core product category that CEXs, such as Bitget, depend on for fee revenue.
As centralized exchange dynamics shift and traders grow more comfortable with on-chain execution, every dollar that moves to Hyperliquid is a dollar not clearing through a CEX order book.
Chen’s timing matters. Her post came roughly two weeks after the JELLY incident gave her a concrete structural failure to point at.
That isn’t a coincidence, it’s the competitive calculus of a CEO watching market share migrate on-chain and identifying the moment the migration narrative cracks.
AP Collective founder Abhi had already detailed the $6M short self-liquidation tactic publicly; Chen amplified the structural critique to a broader audience with FTX-level stakes framing attached.
The HYPE token is also part of this. Hyperliquid’s native token had become a proxy bet on the platform’s continued volume growth and its positioning in the expanding DeFi infrastructure landscape. Attacking the platform’s decentralization credentials directly attacks the thesis behind HYPE’s valuation – and every holder in the community knows it.
Is Hyperliquid Actually Decentralized?
Hyperliquid runs on a purpose-built L1 using HyperBFT consensus, with on-chain order matching and a non-custodial settlement model via its HyperLiquidity Provider vault.
On paper, that’s meaningfully different from a CEX, no withdrawal risk, no opaque internal matching. But the validator set is small, permissioned, and operated by a tight group – and the Hyper Foundation retains emergency intervention capability that it exercised in the JELLY case without a community governance vote.
BitMEX co-founder Arthur Hayes stated the community should ‘stop pretending Hyperliquid is decentralized’ – echoing Chen’s framing from a less commercially conflicted position.
Hayes walked back the severity, later arguing that initial reactions overestimated the reputational damage and urged focus on the platform’s resilience.
But the structural question didn’t go away with his reassessment.
Discover: The Best Crypto Presales Live Right Now
The post Bitget Boss Gracy Chen Calls Hyperliquid a Fake DEX And Crypto Twitter Explodes appeared first on Cryptonews.
Crypto World
Crypto inflows slowed sharply in first quarter as investor demand weakened, says JPMorgan


Wall Street investment bank JPMorgan (JPM) said the pace of capital flowing into digital assets slowed markedly in the first quarter of 2026, with total inflows estimated at around $11 billion.
That implies an annualized run rate of roughly $44 billion, about one-third of the pace seen in 2025, according to the report published last week.
“Investor flows, either retail or institutional, have been small or even negative YTD with the bulk of the digital asset flow in Q1’26 stemming from Strategy’s (MSTR) bitcoin purchases and concentrated crypto VC funding,” wrote analysts led by Nikolaos Panigirtzoglou.
Crypto markets had a volatile and broadly negative first quarter, with prices and market value retreating sharply amid a risk-off backdrop. Total crypto market capitalization fell roughly 20% over the period, while bitcoin dropped around 23% and ether (ETH) declined more than 30%, marking one of the weakest first-quarter performances in years.
The selloff was driven by macroeconomic and geopolitical pressures, triggering liquidations and a broad pullback in risk assets, with altcoins hit even harder.
Despite the downturn, prices stabilized toward the end of the quarter, with bitcoin consolidating near the $70,000 level as ETF demand improved and some pockets of the market, such as select altcoins and onchain activity, showed resilience.
The bank’s estimate aggregates crypto fund flows, Chicago Mercantile Exchange (CME) futures positioning, venture capital fundraising and corporate treasury activity, including bitcoin purchases by firms such as Strategy.
The analysts said investor-driven flows were notably weak. Positioning in bitcoin and ether CME futures softened versus 2024 and 2025, suggesting institutional demand may have turned slightly negative year-to-date. Spot bitcoin and ether exchange-traded funds (ETFs) also saw net outflows during the quarter, concentrated in January, before a modest rebound in bitcoin ETF inflows in March.
The bank’s analysts attributed most of the quarter’s inflows to corporate treasury activity and venture funding. Strategy remained a dominant buyer, funding bitcoin purchases largely through equity issuance, while signaling continued reliance on stock and preferred issuance to finance accumulation. Other corporate holders were more defensive, with some selling bitcoin to fund buybacks.
Bitcoin miners were net sellers during the quarter, the report said, as firms sold holdings or used them as collateral to shore up liquidity, fund capital expenditures or manage liabilities. The analysts characterized the selling as driven by tighter financing conditions and balance sheet discipline rather than distress.
Crypto venture capital was a relative bright spot. Funding tracked an annualized pace above the prior two years, though activity was increasingly concentrated in fewer, larger deals led by established firms. Capital continued to rotate toward infrastructure, stablecoins, payments and tokenization, with less interest in gaming, non-fungible tokens (NFTs) and exchange-related projects, the report added.
Read more: Bitcoin holds ground as gold, silver slide on ETF outflows and liquidity strains: JPMorgan

Diplomatic Signals Revive Cheer in the Market
Authorities on both sides, as well as regional mediators, are still negotiating conditions of a temporary truce. In addition, the suggested ceasefire would open significant trade routes and take the strain off world markets. These news items favored returns in risk assets, such as cryptocurrencies and US stock futures. The US President Donald Trump spoke about the situation at a regular press conference, pointing to continuing negotiations. Moreover, he also prolonged a deadline concerning possible military intervention, which indicated the possibility of further negotiations. There was a response by market participants to these updates as de-escalation expectations rose.
The decrease in oil prices was caused by the expectation of a ceasefire, which reduced worries about supply disruption. Prices were on a downward swing, with energy markets showing improved mood. Therefore, the fall in oil prices helped the recovery of Bitcoin and the subsequent rise of the market. The surge in the value of Bitcoin to over 70,000 caused a run-up in the values of other leading digital currencies such as Ethereum, XRP, Solana and Cardano. Also, the wider crypto market saw high buying behaviour with prices rising accordingly. This collaborative action emphasised the impact of Bitcoin on the general market trend.
Due to the price explosion, there was a dramatic short sale in the derivatives market within a short time. Additionally, the volume of trading was high, indicating that more traders were involved. Statistics also revealed that there was an increase in futures open interest, meaning that more people are taking leveraged positions. The Strait of Hormuz remains a focal point of developments in the markets because of its significance in the oil supply in the world market. Also, any advancement in the negotiations can affect the energy market and financial market in the short term. This relationship continues to bind geopolitical events to crypto price changes.


South Korea’s ruling Democratic Party is reportedly preparing a draft bill that would classify stablecoins as foreign exchange payment instruments and require tokenized real-world assets (RWAs) to be backed by assets held in trust.
Citing an integrated draft of the proposed Digital Asset Basic Act, the Seoul Economic Daily reported on Wednesday that stablecoins used in cross-border transactions would be treated as “means of payment” under the Foreign Exchange Transactions Act, placing related businesses under oversight even without separate registration.
The draft bill would also require issuers of tokenized RWAs to place underlying assets in managed trusts under the Capital Markets Act.
If implemented, the changes would bring stablecoins and tokenized RWAs under existing financial rules, tightening oversight of cross-border flows and setting custody requirements for underlying assets.
Cointelegraph could not independently verify the draft provisions through a public National Assembly filing as of Wednesday.
Stablecoin draft targets cross-border use, bans interest
The Seoul Economic Daily also reported that the draft would exempt certain stablecoin payments for goods and services from foreign exchange reporting requirements within a defined scope.
The draft also reportedly bars issuers from paying interest to holders of value-stable digital assets, regardless of how the incentive is labeled. It would also require the Financial Services Commission to establish technical standards aimed at ensuring interoperability across digital asset networks, the report said.
Related: Crypto exchange Bithumb to delay IPO until after 2028: Report
The reported approach aligns with earlier concerns raised by South Korea’s central bank.
On Jan. 27, Bank of Korea Governor Lee Chang-yong warned that Korean won-denominated stablecoins could complicate capital-flow management and foreign exchange stability, adding to the debate over how domestic stablecoins should be regulated.
New draft would move tokenization into existing structures
On the RWA side, the draft would reportedly require issuers to place linked assets in managed trusts under the Capital Markets Act. The requirement would tie tokenized asset issuance to existing custody frameworks, according to the report.
According to the report, key issues like exchange ownership limits and bank-related requirements for stablecoin issuers were not included in the draft.
The omissions come amid broader disagreements over how the bill should regulate stablecoins. On Dec. 31, disagreements over stablecoin oversight and issuer requirements had delayed the Digital Asset Basic Act.
Magazine: ‘Phantom Bitcoin’ checks, Drift hack linked to North Korea: Asia Express


Pharos Network raises $44m to build institutional RWA rails across Asia and beyond, pushing its EVM Layer 1 toward a near‑$1b valuation.
Summary
- Pharos Network closes a $44 million Series A, lifting total funding to $52 million.
- Asian institutions and strategic corporates back its RWA-focused Layer 1.
- Funds will scale infrastructure in Asia and globally ahead of its public testnet.
Layer 1 blockchain Pharos Network has raised $44 million in a Series A round to build institutional-grade infrastructure for tokenized real-world assets (RWAs), bringing its total funding to $52 million after an $8 million seed round in November 2024.
The EVM-compatible chain, which targets regulated finance and large asset managers, plans to use the capital to expand RWA rails across Asia and key global markets, with a public testnet launch scheduled for May 2025.
The latest round follows a strategic deal that valued Pharos at roughly $950 million after Hong Kong–listed GCL New Energy subscribed about $24.7 million in equity.
Backers in the fresh raise include Asian private equity funds, renewable energy firms listed in Hong Kong, regulated financial institutions from the city, a subsidiary of Japan’s Sumitomo Corporation, crypto-native investor SNZ Holding, oracle provider Chainlink, and trading firm Flow Traders, underscoring the project’s bid to sit at the junction of traditional finance and DeFi.
Pharos positions itself as “a high‑throughput, EVM‑compatible Layer‑1 blockchain built to connect TradFi, DeFi, and real‑world assets,” aiming to “bridge over $50 trillion in RWAs and cross‑chain capital into a modular, on‑chain economy at internet scale,” as the team describes in its technical materials.
Pharos has spent the past year stitching together an institutional RWA stack that goes beyond this funding round. In February, it launched the RealFi Alliance with partners including Chainlink and Centrifuge to “standardize the development of RWA infrastructure for institutional players” and close what it calls the “trust gap” around onchain asset data. The network has also announced a partnership with Centrifuge to distribute tokenized U.S. Treasuries and AAA-rated credit products onchain, positioning Pharos as a liquidity and distribution layer for assets such as JTRSY and JAAA.
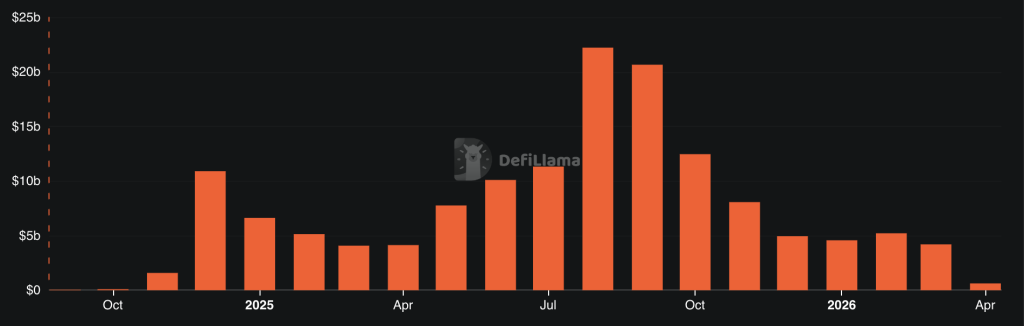
The raise lands as tokenized real-world assets accelerate, with sector reports projecting RWA outstanding to approach $60 billion in 2026 amid growing interest from banks and asset managers. In March alone, crypto startups secured more than $4.28 billion across 129 funding rounds, signaling that capital is still flowing aggressively into infrastructure plays despite volatile token markets. Against that backdrop, Pharos’ near‑$1 billion valuation and $52 million war chest place it among the more heavily funded RWA‑focused Layer 1s, as it races to convert institutional interest into actual onchain issuance and secondary liquidity.
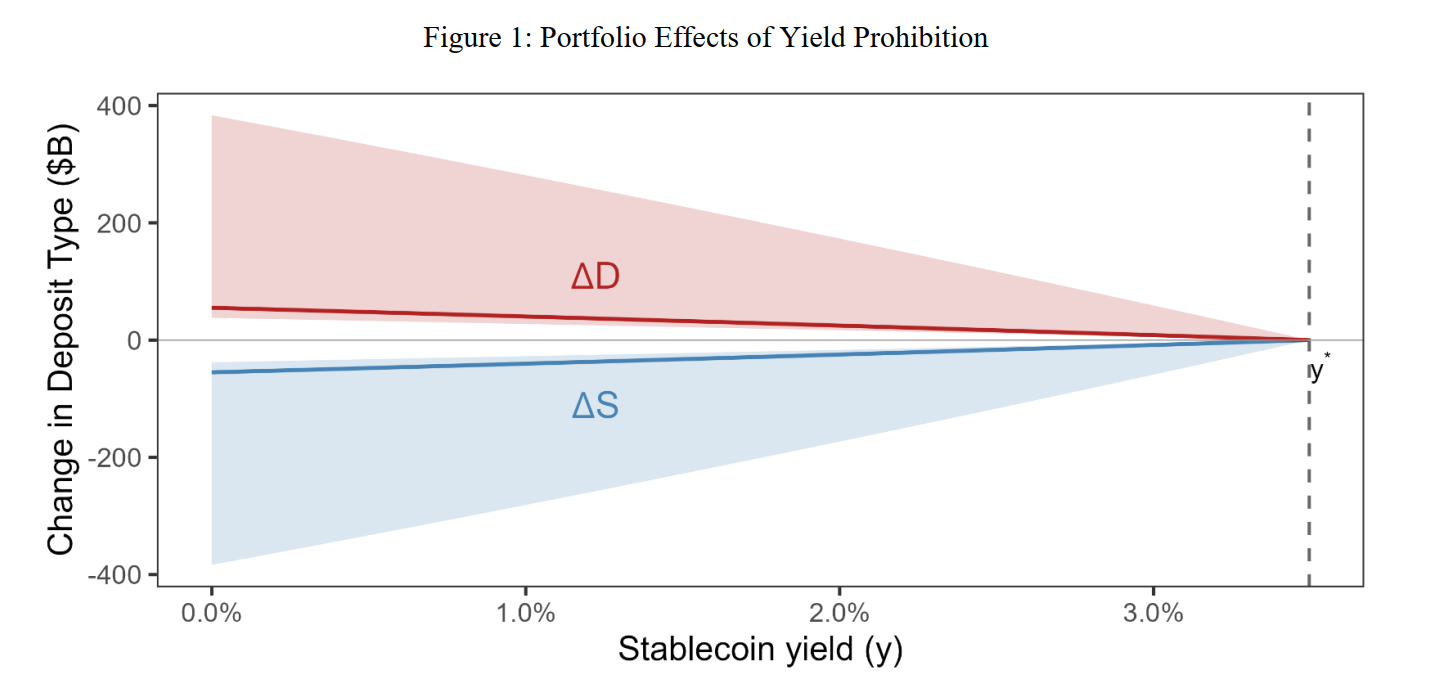
A White House report found that banning yield on stablecoins would have a marginal impact on bank lending while creating clear economic downsides.
According to the Council of Economic Advisers, a three-member agency within the Executive Office of the President tasked to offer the president economic advice, moving funds from stablecoins back into bank deposits would not translate into significant new lending. Under its baseline scenario, total bank lending would increase by about $2.1 billion, roughly 0.02% of the $12 trillion loan market.
The report, published Wednesday, says that community banks would see even smaller gains. Lending at these institutions would increase by roughly $500 million, or about 0.026%.
The findings come amid an ongoing clash between banks and the crypto industry over stablecoin yields. Banking organizations, including the Independent Community Bankers of America, have warned that stablecoin yields could significantly reduce bank lending, while crypto groups have rejected the claim.
Related: CLARITY Act 2026 odds ‘extremely low’ if not passed before April: Exec
Stablecoin lending ban could cost $800 million per year
However, banning stablecoin rewards could carry a greater cost. The report estimates a net welfare loss of around $800 million per year, mainly because users would lose access to yield on stablecoins. The cost-benefit ratio is about 6.6, meaning the economic costs would far exceed any gains in lending.
“Producing lending effects in the hundreds of billions requires simultaneously assuming the stablecoin share sextuples, all reserves shift into segregated deposits, and the Federal Reserve abandons its ample-reserves framework,” the report concludes.

In July 2025, President Donald Trump signed the GENIUS Act into law. The law prohibits stablecoin issuers from paying interest or yield to holders, but third-party platforms (like exchanges) can still offer yield on stablecoins. The proposed Digital Asset Market Clarity Act could close that gap by clarifying whether yield should be restricted across the board or allowed under certain conditions.
Related: Crypto investor sentiment will rise once CLARITY Act is passed: Bessent
CLARITY Act nearing Senate markup hearing
The US House of Representatives passed the CLARITY Act on July 17, 2025. In January, Senate Banking Committee Chair Tim Scott delayed a planned markup, which has yet to be rescheduled.
Last week, Coinbase chief legal officer Paul Grewal said the CLARITY Act could be nearing a markup hearing in the US Senate Banking Committee, with lawmakers close to agreement on key provisions. He noted that progress hinges on resolving disagreements over stablecoin yield.
Magazine: Bitcoin may take 7 years to upgrade to post-quantum — BIP-360 co-author

Government profiting from rising costs 'not right'

Adam Back denies he’s Satoshi Nakamoto after a new report claims he’s Bitcoin’s (BTC) creator

Netflix’s Fantastical Mystery Adaptation Just Got a Magical New Trailer


-

 NewsBeat6 days ago
Steven Gerrard disagrees with Gary Neville over ‘shock’ Chelsea and Arsenal claim | Football
-

 Business6 days ago
No Jackpot Winner and $194 Million Prize Rolls Over
-

 Fashion5 days ago
Weekend Open Thread: Spanx – Corporette.com
-

 Crypto World7 days ago
Gold Price Prediction: Worst Month in 17 Years fo Save Haven Rock
-

 Business4 days ago
Expert Picks for Every Need
-

 Business3 days ago
Three Gulf funds agree to back Paramount’s $81 billion takeover of Warner, WSJ reports
-

 Sports4 days ago
India men’s 4x400m and mixed 4x100m relay teams register big progress | Other Sports News
-

 Business6 days ago
Login and Checkout Issues Spark Merchant Frustration
-

 Tech17 hours ago
How Long Can You Drive With Expired Registration? What Florida Law Says
-
Business3 days ago
No Jackpot Winner, Prize to Climb to $231 Million
-

 Tech6 days ago
Commonwealth Fusion Systems leans on magnets for near-term revenue
-

 Fashion2 days ago
Massimo Dutti Offers Inspiration for Your Summer Mood Board
-

 Crypto World7 days ago
Ripple rolls out enterprise crypto treasury platform for corporates
-

 Tech7 days ago
Drawing Tablet Controls Laser In Real-Time
-
Politics5 days ago
Wings Over Scotland | The quality of mercy
-

 Crypto World7 days ago
Why It’s Partnering, Not Issuing
-

 Fashion21 hours ago
Let’s Discuss: DEI in 2026
-
 Sports7 days ago
Steal Gary Woodland’s subtle power move for longer drives
-
 Tech7 days ago
Battery Tester Outperforms Cheaper Options
-

 Business4 days ago
Akebia Therapeutics, Inc. (AKBA) Discusses Pipeline Progress and Strategic Focus on Kidney Disease Treatments at R&D Day – Slideshow
You must be logged in to post a comment Login