
Crypto World
Candlestick Reversal Patterns in Forex Trading
Candlestick reversal patterns are formations that signal a potential shift in price direction as an existing trend begins to lose momentum. They typically appear at the end of trends, where buying or selling pressure starts to weaken, offering traders an early indication of a possible turning point.
There are many ways to spot a trend reversal, including momentum indicators, trend-following tools, and chart and candlestick patterns. Candle patterns, in particular, have been widely used by traders for decades due to their clear structure and well-defined signals, which have been tested and applied across various financial markets.
Depending on the data source, the total number of candlestick patterns ranges from 30 to more than 100, when niche formations are included. Since it may be challenging to remember and recognise all of them, we have selected 10 of the most popular reversal candlestick patterns that traders with any level of experience can implement in their trading strategies.
Definition and Market Function
Candlestick reversal patterns are formations on a price chart that signal a potential trend change after an extended move. Each candle captures the open, high, low, and close for a set period. The shape of the formation reflects the balance between buyers and sellers at that moment.
Reversal differs from retracement. A reversal points to a change in the dominant trend. A retracement is a counter-move within a trend that quickly resumes. Context matters. A pattern carries weight when it forms at a tested support or resistance level and aligns with recent market structure. In the middle of a range, the same shape means little.
This article covers 10 reversal candlestick patterns:
Market Interpretation of Reversals
Market structure shifts when sustained move exhausts and the opposing side quietly builds conviction. The turn often shows in price action before lagging indicators like moving averages or oscillators react.
Three forces cluster around a change in market structure:
- Liquidity pools build near trend extremes, where stop orders sit above swing highs or below swing lows.
- Positioning becomes one-sided, exposing the weaker side to a squeeze.
- Volatility often expands at the turn, producing wide-range candles with long wicks.
Reading the signal requires trend context and level alignment, not shape alone.
Classification of Reversal Patterns
Candlestick reversal patterns in forex fall into three groups by candle count. Single-candle patterns form in one candle. The hammer, hanging man, inverted hammer, and shooting star belong here. Their signal rests on wick-to-body ratio and trend position.
Double-candle patterns involve two consecutive candles. Bullish engulfing, bearish engulfing, piercing line, and dark cloud cover sit in this group. The second candle is opposite and usually overwhelms the first.
Triple-candle patterns need three candles to complete. Three white soldiers and three black crows form this category. They develop slowly but show directional pressure.
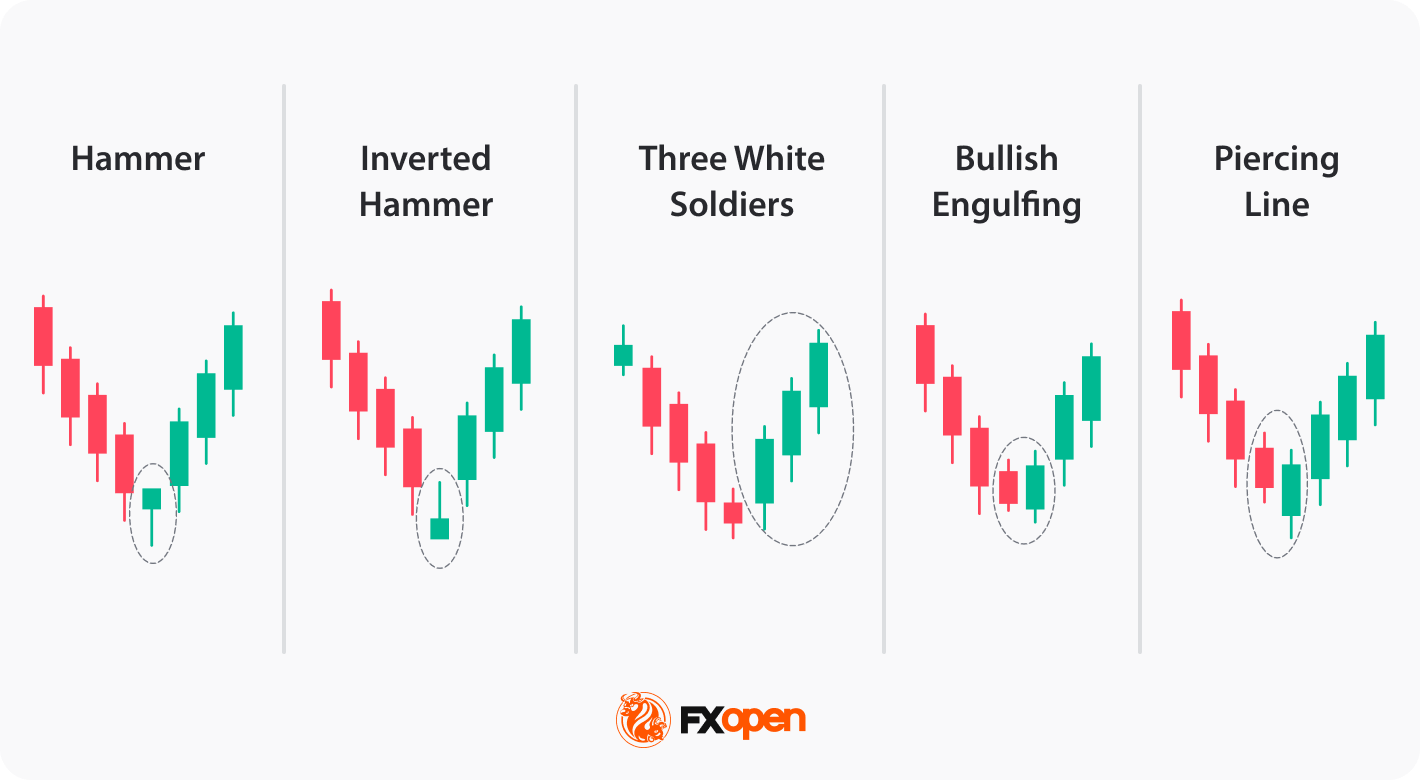
Bullish Reversal Patterns
Bullish reversal patterns form at the end of downtrends. Selling momentum fades as buyers regain control.

Hammer
The hammer candlestick pattern has a small body, a lower wick at least twice the body length, and little to no upper wick. It appears at the end of a downtrend after sustained selling pressure. A close above the hammer’s high on the following candle supports the signal.
Inverted Hammer
The inverted hammer has a small body, an upper wick at least twice the body length, and little to no lower wick. It forms after a prolonged downtrend, often near a tested support zone. Traders often look for the next session to close above the candle’s body before acting.
Three White Soldiers
The three white soldiers pattern consists of three consecutive bullish candles, each opening within the prior body and closing at a new high with short upper wicks. It develops after a downtrend, typically following a stall near the low. The third candle closing above a recent resistance level adds weight to the pattern.
Bullish Engulfing
The bullish engulfing forms when a bullish candle’s body fully covers the prior bearish candle’s body. It appears at the end of a downtrend, with the bearish candle often marking the final push lower. Confirmation is found when a close is seen above the engulfing pattern, meaning the reversal likely has more weight.
Piercing Line
The piercing line pairs a long bearish candle with a bullish candle that opens below the prior low and closes above the bearish body’s midpoint. It forms at the end of a downtrend, often at a tested support zone. Another bullish candle forming after the pattern reinforces the signal.
Bearish Reversal Patterns
These bearish reversal patterns form at the end of uptrends. Buying momentum fades as sellers regain control.
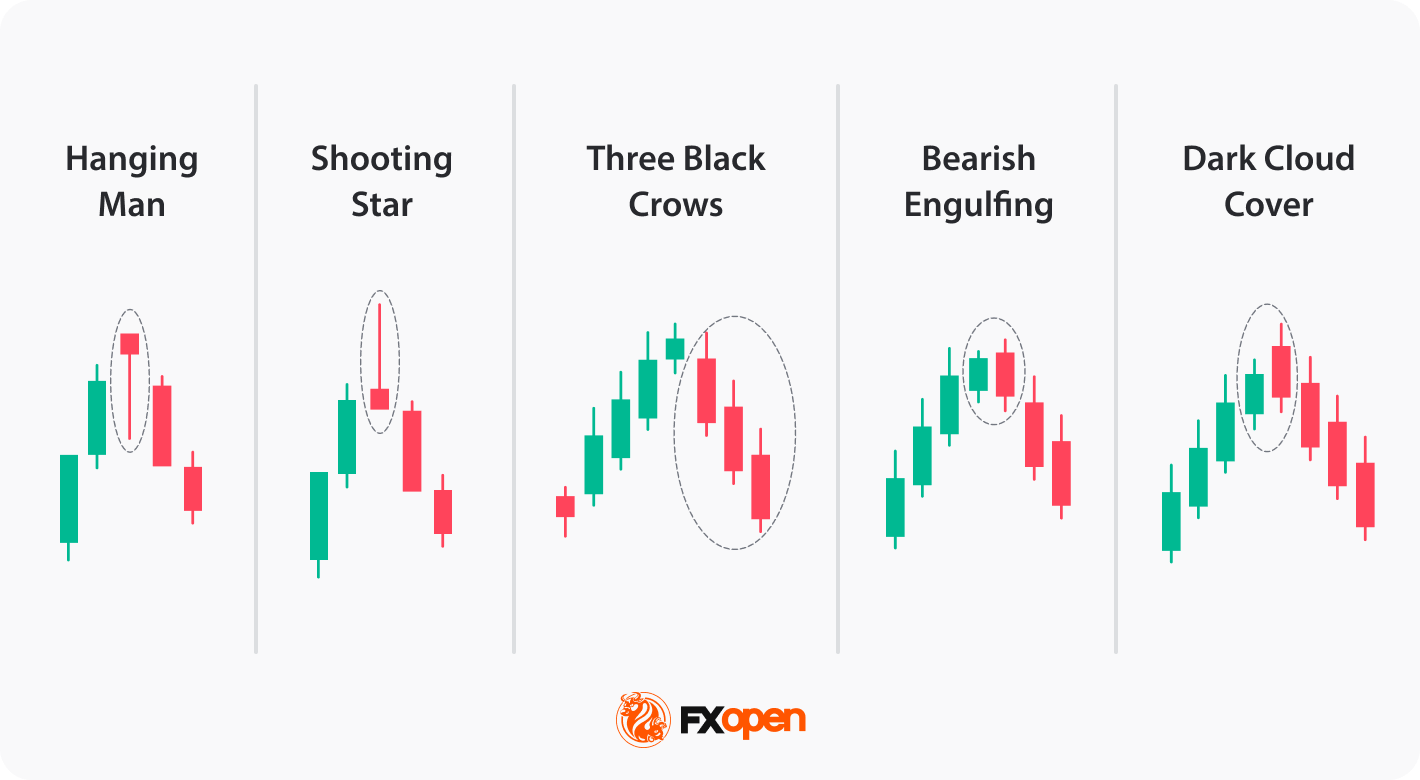
Hanging Man
The hanging man has a small body, a lower wick at least twice the body length, and little to no upper wick. This candlestick pattern structure appears at the end of an uptrend after sustained buying pressure. A close below the hanging man’s low on the following candle supports the signal.
Shooting Star
The shooting star has a small body, an upper wick at least twice the body length, and little to no lower wick. It forms after a prolonged uptrend, often near a tested resistance zone. Traders often look for the next candle to close below the candle’s body before acting.
Three Black Crows
The three black crows formation consists of three consecutive bearish candles, each opening within the prior body and closing at a new low with short lower wicks. It develops after an uptrend, typically following a stall near the high. The third candle closing below a recent support level adds weight to the pattern.
Bearish Engulfing
The bearish engulfing forms when a bearish candle’s body fully covers the prior bullish candle’s body. It appears at the end of an uptrend, with the bullish candle often marking the final push higher. A close below the engulfing candle’s low session supports the reversal.
Dark Cloud Cover
The dark cloud cover setup pairs a long bullish candle with a bearish candle that opens above the prior high and closes below the bullish body’s midpoint. It forms at the end of an uptrend, often at a tested resistance zone. Another bearish candle forming after the pattern reinforces the signal.
How Traders Identify Reversal Candles
Identifying a candlestick reversal pattern involves four observable checks. Each one either confirms or filters the signal before it carries weight.
- Trend presence: the pattern forms at the end of a clear uptrend or downtrend. Shapes that appear inside a range or consolidation carry little meaning.
- Key level alignment: the pattern aligns with a tested support or resistance zone, a prior swing point, or a known supply or demand area.
- Candle structure: wick-to-body ratios, close position, and body size match the pattern’s definition. Loose approximations dilute the signal.
- Confirmation: the next candle closes in the reversal direction, or a second pattern, indicator reading, or price-action event aligns with the signal before action.
Skipping any of the four reduces the pattern to a shape on the chart rather than a usable signal. Platforms such as TickTrader let traders explore, identify, and trade these patterns across multiple instruments.
Application in Trading Context
Candlestick reversal patterns sit inside a wider decision process rather than drive trades on their own. Position sizing, stop placement, and volatility conditions shape how traders interpret and act on any signal.
Risk context matters at the trade level. A pattern at a major resistance zone in a quiet market carries different weight than the same pattern ahead of an important economic release. Traders often scale position size based on volatility, recent range, or proximity to liquidity levels. Broader risk management frameworks often define stop placement based on the pattern’s structure rather than arbitrary price offsets.
Volatility expansion around reversal patterns cuts both ways. Wider price ranges can make candlestick patterns more visually distinct, but they also increase the likelihood of false breakouts and unreliable signals. False signals appear more often around news releases, low-liquidity hours, and transitions between major trading windows.
Limitations and Market Risks
Candlestick reversal patterns in technical analysis have consistent limitations worth naming directly.
- Low-liquidity conditions distort pattern formation. Thin order books produce wider spreads, longer wicks, and candles that look like patterns but lack the participation to drive a reversal. Exotic currency pairs during off-peak hours often show this behaviour.
- News releases override technical structure. A hammer printed seconds before a non-farm payrolls release may face volatility that ignores the pattern entirely. Scheduled events and surprise headlines both reset short-term price structure.
- Timeframe dependency shapes signal weight. The same pattern on a 1-hour chart often carries less weight than on a daily or weekly chart, where each candle represents more participation and more information.
Takeaway
Bullish vs bearish candlestick patterns are tools for identifying shifts in market direction across forex, stocks, indices, and commodities. They carry weight when structure, trend context, and key levels align.
In practice, traders treat them as early signals and rely on confirmation before acting. Combined with sound risk management, they may help refine timing.
Traders who want to test candlestick patterns and develop their own strategies can consider opening an FXOpen account today and access over 700 instruments with tight spreads and low commissions (additional fees may apply). Good luck!
FAQ
What Are Candlestick Reversal Patterns?
Candlestick reversal patterns are single candles or short sequences that form at the end of a trend and mark a potential change in market direction. They reflect a shift in the balance between buyers and sellers, visible through the candle’s open, close, high, and low. Common examples include the hammer, shooting star, engulfing patterns, and three black crows. Their weight depends on where they form, not just their shape.
Which Candlestick Patterns Signal a Reversal?
Ten patterns commonly appear in reversal analysis: hammer, hanging man, inverted hammer, shooting star, three white soldiers, three black crows, bullish engulfing, bearish engulfing, piercing line, and dark cloud cover. Each pattern carries weight only when it appears at a tested level in a clear trend.
What Is the Difference Between Bullish and Bearish Reversal Patterns?
Bullish reversal patterns form at the end of a downtrend and point to a potential move higher. Hammer, inverted hammer, bullish engulfing, three white soldiers, and piercing line sit in this group. Bearish reversal patterns form at the end of an uptrend and point to a potential move lower. Hanging man, shooting star, bearish engulfing, three black crows, and dark cloud cover belong here. Shapes often mirror across the pair.
Do Candlestick Reversal Patterns Require Confirmation?
Confirmation matters when trading candlestick patterns. A pattern on its own shows a shift in the last candle or two, but not whether the broader trend has turned. Traders often wait for the next candle to close in the reversal direction, or for a second signal from price action, a technical indicator, or a break of a key level. Patterns that form without confirmation produce more false signals, especially in low-liquidity or high-news conditions.
Are Reversal Patterns Popular in Forex Trading?
In forex, reversal signals are widely used, and for reasons tied to the market’s structure. Forex runs 24 hours on weekdays across overlapping sessions, producing clear trending and reversal behaviour around liquidity transitions. The patterns work across major, minor, and exotic pairs, and across all timeframes from intraday to weekly. Traders often combine them with support and resistance zones, moving averages, or momentum readings to filter signals.
This article represents the opinion of the Companies operating under the FXOpen brand only. It is not to be construed as an offer, solicitation, or recommendation with respect to products and services provided by the Companies operating under the FXOpen brand, nor is it to be considered financial advice.

Crypto World
NYC Mayor Mamdani knocked Ken Griffin in pied-a-terre tax promo. His firm calls the move ‘shameful’

Citadel CEO Ken Griffin speaks during the Semafor World Economy Summit 2025 at Conrad Washington on April 23, 2025 in Washington, DC.
Kayla Bartkowski | Getty Images
Citadel rebuked New York City Mayor Zohran Mamdani for singling out Chief Executive Officer Ken Griffin in a push for a new pied-à-terre tax, escalating a public dispute over how aggressively New York should target wealthy non-resident homeowners.
In a social media video filmed outside Griffin’s residence at 220 Central Park South and timed to tax day, Mamdani unveiled a proposed levy that would impose an annual surcharge on one- to three-family homes, condominiums and co-ops valued above $5 million when the owner’s primary residence is outside New York City.
Citadel denounced the mayor’s move with Chief Operating Officer Gerald Beeson saying in an internal memo obtained by CNBC that targeting Griffin showed “ignorance and disdain” toward contributors to the city’s economy.
“It is shameful that he used Ken’s name as the example of those who supposedly aren’t carrying their fair share of the burdens associated with New York City’s often costly and wasteful spending,” Beeson wrote. “In doing so, the mayor has once again manifested the ignorance and disdain of the elite political class towards those who have been consistently committed to building one of the greatest cities in the world.”
Beeson said Citadel’s principals and employees — including non-residents — have paid nearly $2.3 billion in New York city and state taxes over the past five years. He also pointed to the firm’s planned redevelopment of 350 Park Avenue, a project expected to generate about 6,000 construction jobs and more than 15,000 permanent roles, with spending projected to exceed $6 billion.
Griffin moved Citadel headquarters from Chicago to Miami in 2022 and he has made Florida his primary residence.
The memo also highlighted that nearly 200 Citadel employees serve on boards of New York charitable institutions, while Griffin himself has directed roughly $650 million in philanthropic donations to the city.
“We understand that our hard work and success will, on occasion, make us targets for political rhetoric. But it should not diminish the pride we take in building firms that will continue to help New York City thrive for decades ahead,” Beeson wrote.
The Wall Street Journal first reported on the memo earlier Thursday.

mostbet Azerbaycan və ya Mostbet AZ saytı, Azerbaycanın mütənasib məsafədəki en populyar və en qızgın kazino saytıdır. Mostbet.com saytı, Azerbaycanın məntiqindən rahatlıqla istifadə edilə bilən və 24 saatlik xidmət verən bir platformadır. Mostbet AZ qeydiyyat prosesinin ən kolay və sürətli olmaq üçün, saytda qeydiyyatdan keçmək üçün sadə bir formada birləşdirilmiş bütün məlumatlar yer alır.
Mostbet giriş saytına keçirə bilərsiniz və əlaqə saxlamaq üçün bir hesab yaradaraq məlumatları daxil edə bilərsiniz. Mostbet Azerbaycan və ya Mostbet saytı, Azerbaycanın mütənasib məsafədəki digər kazino saytlarından əsas məqsədlərindən fərqli olan və tələbələrin əlaqəsindən əvvəl əlaqə saxlamaq üçün tələb olunan bütün məlumatları təqdim edir.
Mostbet AZ casino, Azerbaycanın mütənasib məsafədəki en geniş və en müraciətli qazanma şansları olan bir platformadır. Mostbet az saytı, Azerbaycanın mütənasib məsafədəki digər kazino saytlarından əsas məqsədlərindən fərqli olan və tələbələrin əlaqəsindən əvvəl əlaqə saxlamaq üçün tələb olunan bütün məlumatları təqdim edir.
Mostbet AZ casino-nun xidmətləri və funksionalləri
Mostbet AZ casino-nun xidmətləri və funksionalləri ən yüksək standartda təmin edilir. Bu sayt, oyunları, bonuslar və qeydiyyat prosesini əgər Azerbaycanın məqsədində oyun oynamanıza uyğunlaşdırmaq üçün hazırlanmışdır. Mostbet.az və mostbet azerbaijan saytları, Azerbaycanın məsləhətçilərinin və oyunçuların istifadəsi üçün təhlükəsiz və müraciətli bir platforma təqdim edir. Bu saytların xidmətləri arasında oyun seçimi, bonuslar, qeydiyyat prosesinin basqa bir şeydən daha kolay olması və 24 saatlik müraciət xidməti yerləşir.
Mostbet AZ casino-da oynanmaq üçün ilk adımda mostbet az qeydiyyat prosesini yerinə yetirin. Bu proses, sizi əgər Azerbaycanın məqsədində oyun oynamanıza uyğunlaşdırmaq üçün təhlükəsiz və müraciətli bir şəkildə təqdim edilir. Qeydiyyat prosesində sizi təhlükəsizliklə təmin edən şərtlər və xidmətlər təqdim olunur. Mostbet azerbaycan saytlarında oyun oynamanıza uyğunlaşdırmaq üçün təhlükəsiz və müraciətli bir platforma təqdim edilir. Bu saytların xidmətləri arasında oyun seçimi, bonuslar, qeydiyyat prosesinin basqa bir şeydən daha kolay olması və 24 saatlik müraciət xidməti yerləşir.
Mostbet AZ casino-da oyun oynamanıza uyğunlaşdırmaq üçün təhlükəsiz və müraciətli bir platforma təqdim edilir. Bu saytların xidmətləri arasında oyun seçimi, bonuslar, qeydiyyat prosesinin basqa bir şeydən daha kolay olması və 24 saatlik müraciət xidməti yerləşir. Mostbet.az və mostbet azerbaijan saytları, Azerbaycanın məsləhətçilərinin və oyunçuların istifadəsi üçün təhlükəsiz və müraciətli bir platforma təqdim edir. Bu saytların xidmətləri arasında oyun seçimi, bonuslar, qeydiyyat prosesinin basqa bir şeydən daha kolay olması və 24 saatlik müraciət xidməti yerləşir.
Mostbet AZ casino-da qazanmaq üçün nəzərə alınmalıdırı xassələr
Mostbet AZ casino-da qazanmaq üçün nəzərə alınmalıdırı xassələrə dair məlumat veririk. Birinci xassə, qazanmaq üçün təhlükəsiz və mürəkkəb bir platforma qədər gəlməkdir. Mostbet giriş, mostbet az, mostbet.az və mostbet.com saytları kimi, bu platformaların təhlükəsiz və mürəkkəb strukturası qazanmaq üçün nəzərə alınmalıdır. Daha sonra, qazanmaq üçün maliyyə planı təyin etmək lazımdır. Mostbet AZ casino-da qeydiyyat prosesini tamamilə təqdim edən mostbet az qeydiyyat saytı vasitəsilə maliyyə planınızı təyin edə bilərsiz. Bu plan, qazanmaq üçün nəzarət etmək üçün maliyyəli tələblərinizi dəyişdirə bilər. Sonra, qazanmaq üçün dəstəklənən bankalar və qazanmaq üçün maliyyə sistemlərini təqdim edən mostbet azerbaycan saytlarından istifadə etmək lazımdır. Bu saytlar, qazanmaq üçün maliyyə sistemlərinizi təqdim edir və maliyyəni təmin etmək üçün nəzərə alınmalıdır xassələrə malikdir.
Əlavə xassələr
- Mostbet AZ casino-da qazanmaq üçün maliyyəni təmin etmək üçün maliyyəli tələblərinizi dəyişdirə bilərsiz.
- Qazanmaq üçün maliyyə planınızı təyin etmək lazımdır.
- Mostbet azerbaycan saytlarından istifadə etmək, qazanmaq üçün maliyyə sistemlərinizi təqdim edir.
- Mostbet AZ casino-da qazanmaq üçün təhlükəsiz və mürəkkəb bir platforma gəlmək lazımdır.
- Qazanmaq üçün dəstəklənən bankalar və qazanmaq üçün maliyyə sistemlərini təqdim edən mostbet.az saytlarından istifadə etmək lazımdır.

Lido is the first service provider to publicly announce its participation in the relief fund via a governance proposal requesting up to 2,500 stETH.
Aave is rallying the DeFi ecosystem under a coordinated effort it’s calling “DeFi United” to help make users whole after the April 18 Kelp bridge exploit left rsETH — a liquid restaking token — underbacked, putting funds at risk across multiple lending markets.
Aave announced on X today, April 23, that “multiple strong indicative commitments are now in place” to join the recovery effort, with Lido Finance named as the first public participant.
The announcement came just after Lido contributors submitted a governance proposal to contribute up to 2,500 Lido Staked Ether (STETH), worth appoximately $5.7 million, to the dedicated relief fund “to be used solely to reduce the rsETH deficit.”
Per Lido’s proposal, the total deficit exceeds 100,000 ETH, and both Aave and Lido noted that there are already indicative commitments from other service providers for the fund.
Without full coverage, Lido warns that EarnETH vault depositors could face losses of up to approximately 9,000 ETH.
Earlier today, Aave also announced on X that it had paused rsETH reserves across Ethereum Core, Arbitrum, Base, Mantle, and Linea to support recovery efforts.
Aave said in its X post that further commitments will be announced as they are formalized.
This article was written with the assistance of AI workflows. All our stories are curated, edited and fact-checked by a human.


Pi Network has introduced PiRC1, a new token issuance framework launched under Protocol 22 on April 22, that bars projects from issuing tokens unless they can first demonstrate a functioning application with real user demand, a direct attempt to filter out speculation-driven launches from the ecosystem.
Summary
- Pi Network launched PiRC1 on April 22 under Protocol V22, requiring any project seeking to issue ecosystem tokens to demonstrate a real, functioning application with genuine user demand before launch.
- Token proceeds under PiRC1 are routed to permanent liquidity pools rather than directly to project teams, adding a structural safeguard against misuse of raised funds.
- The framework arrives alongside an April 27 node upgrade deadline for Protocol 22, with full smart contract functionality expected to follow under Protocol 23 in May.
Pi Network launched PiRC1, its Token Design Framework, on April 22 as part of the Protocol V22 upgrade. As HOKANEWS.COM reported, the core principle of PiRC1 is straightforward: only applications that demonstrate genuine use cases and tangible user demand within the Pi ecosystem will be eligible to participate in token issuance. The framework is designed to address one of the crypto industry’s most persistent problems, the proliferation of low-value tokens created primarily as speculative instruments rather than functional components of a real digital economy.
Pi Network PiRC1 Token Issuance Framework Sets a New Standard for Ecosystem Projects
Under PiRC1, no project can launch a token without first having a working application. Token proceeds do not go directly to project teams but are instead routed into permanent liquidity pools, anchored to Pi Coin as the ecosystem’s foundational currency. This design separates fundraising from direct project control, introducing a structural safeguard that prevents teams from pulling liquidity after launch, a pattern that has caused widespread losses across Web3. Pi’s network of KYC-verified users adds an additional accountability layer, since developers and users operate under verified identities rather than anonymously. As crypto.news reported, PiRC1 was released alongside a new PiRC2 document opening the subscription smart contract model to technical review and community feedback. PI traded at approximately $0.1687 as of April 23, with a $1.73 billion market cap and a 24-hour volume of $11.17 million.
How PiRC1 Fits the Broader Protocol Upgrade Roadmap
PiRC1 was introduced under Protocol V22 as a direct follow-on to the V21 and V21.2 network upgrades that strengthened Pi’s infrastructure and prepared it for smart contract readiness. Protocol 22 also carries an urgent node deadline: as crypto.news tracked, Mainnet node operators must upgrade to Protocol 22 by April 27 to remain connected to the network. The next major milestone is Protocol 23, expected in May 2026, which will introduce full smart contract functionality for developers. Together, the PiRC1 token framework and Protocol 23 smart contract tools represent what Pi Network is framing as the transition from a mining-focused network to a structured Web3 ecosystem capable of supporting real commercial applications.
What PiRC1 Means for PI’s Market Position
Pi co-founder Chengdiao Fan first introduced PiRC1 as a proposal in late February, emphasizing that tokens should function as tools within applications rather than as stand-alone financial instruments. The framework’s open review period on GitHub and Google Forms gave the developer community a chance to shape the final design before it launched. As crypto.news documented, PI’s market trajectory in 2026 has been heavily dependent on whether the network’s technical milestones translate into actual on-chain usage. Each prior roadmap release has been treated largely as a sell-the-news event by the market. Whether PiRC1 changes that dynamic will depend on how many developers build functioning applications under the framework and how quickly user engagement on those apps becomes measurable.
Pi Network said it plans to continue expanding the PiRC1 framework with feedback from its developer community, and has flagged Protocol 23 smart contract support as the next major technical deliverable expected in May.
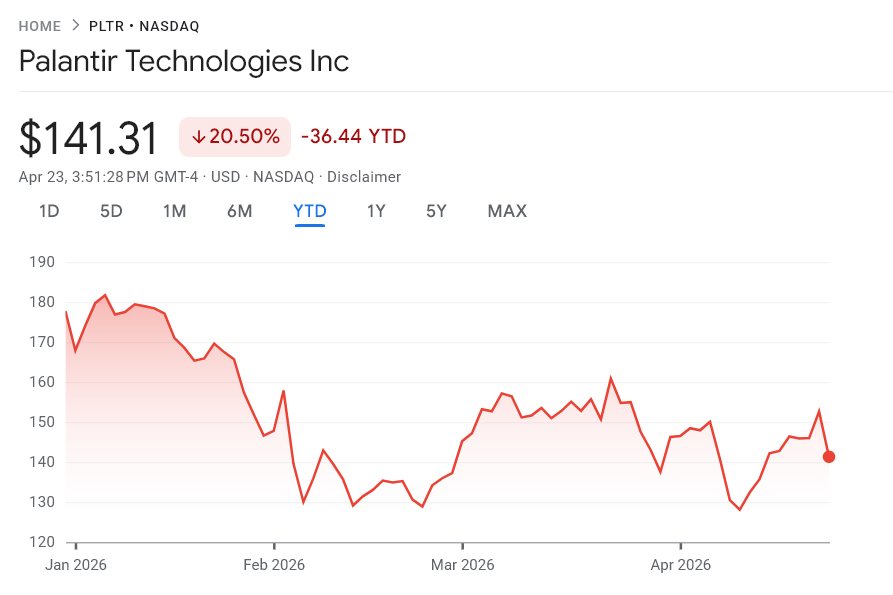
One AI stock reports earnings on May 4, three weeks before Nvidia prints, and the technical setup is the most oversold it has looked in a year.
Palantir (PLTR) closed above $143 on April 23, down about 30% from its November peak and roughly 15% year-to-date. The stock has been stuck inside a falling channel since early November, rejected at every bounce. But under the surface, the signals are flipping.
A bullish divergence has played out, institutional money has turned positive, and options traders are quietly setting up for a squeeze. Here is why the May 4 print matters more than Nvidia’s, and where the price has to go.

Palantir Shares are Deeply Oversold
The calendar is the first edge. Palantir (PLTR) reports Q1 2026 earnings on Monday, May 4, 2026, after the close. Nvidia (NVDA) does not report until late May.
That three-week gap makes Palantir the first major enterprise AI stock to print earnings this season. Whatever number it delivers sets the tone that carries into Nvidia’s report. It also shapes how the entire AI trade is priced through mid-May.
The setup is oversold. PLTR is down 30% from its November high and still stuck inside a falling channel on the daily chart. Part of that pressure stems from investor Michael Burry’s April 9 post, in which he claimed AI startup Anthropic was “eating Palantir’s lunch,” citing its surge from $9 billion to roughly $30 billion in annual recurring revenue.
Shares dropped as much as 7% that day. But the Anthropic scare is now priced in, and the bigger picture has not changed.
Want more insights like this? Sign up for Editor Harsh Notariya’s Daily Newsletter here.
Wall Street has not blinked. Morgan Stanley analyst Sanjit Singh flagged on April 16 that this AI stock could “modestly accelerate growth and raise its full-year guidance” on the May 4 call.
In plain terms, that means posting numbers better than promised AND raising the forecast for the rest of the year, the combination investors reward most.
They are pricing a re-rating that a clean May 4 print would unlock. That oversold price, combined with a likely beat-and-raise, is the first half of the setup. The second half is what the chart already shows.
Chart Signals Say the PLTR’s Oversold Setup Is Turning
Nvidia looks stronger on the surface. The stock trades near $201, and its Chaikin Money Flow (CMF), an indicator of institutional money flow, is 0.30.
Palantir’s CMF just crossed back above zero at 0.04. The simple read says Nvidia has heavier buying. The deeper read says Nvidia is overheated.
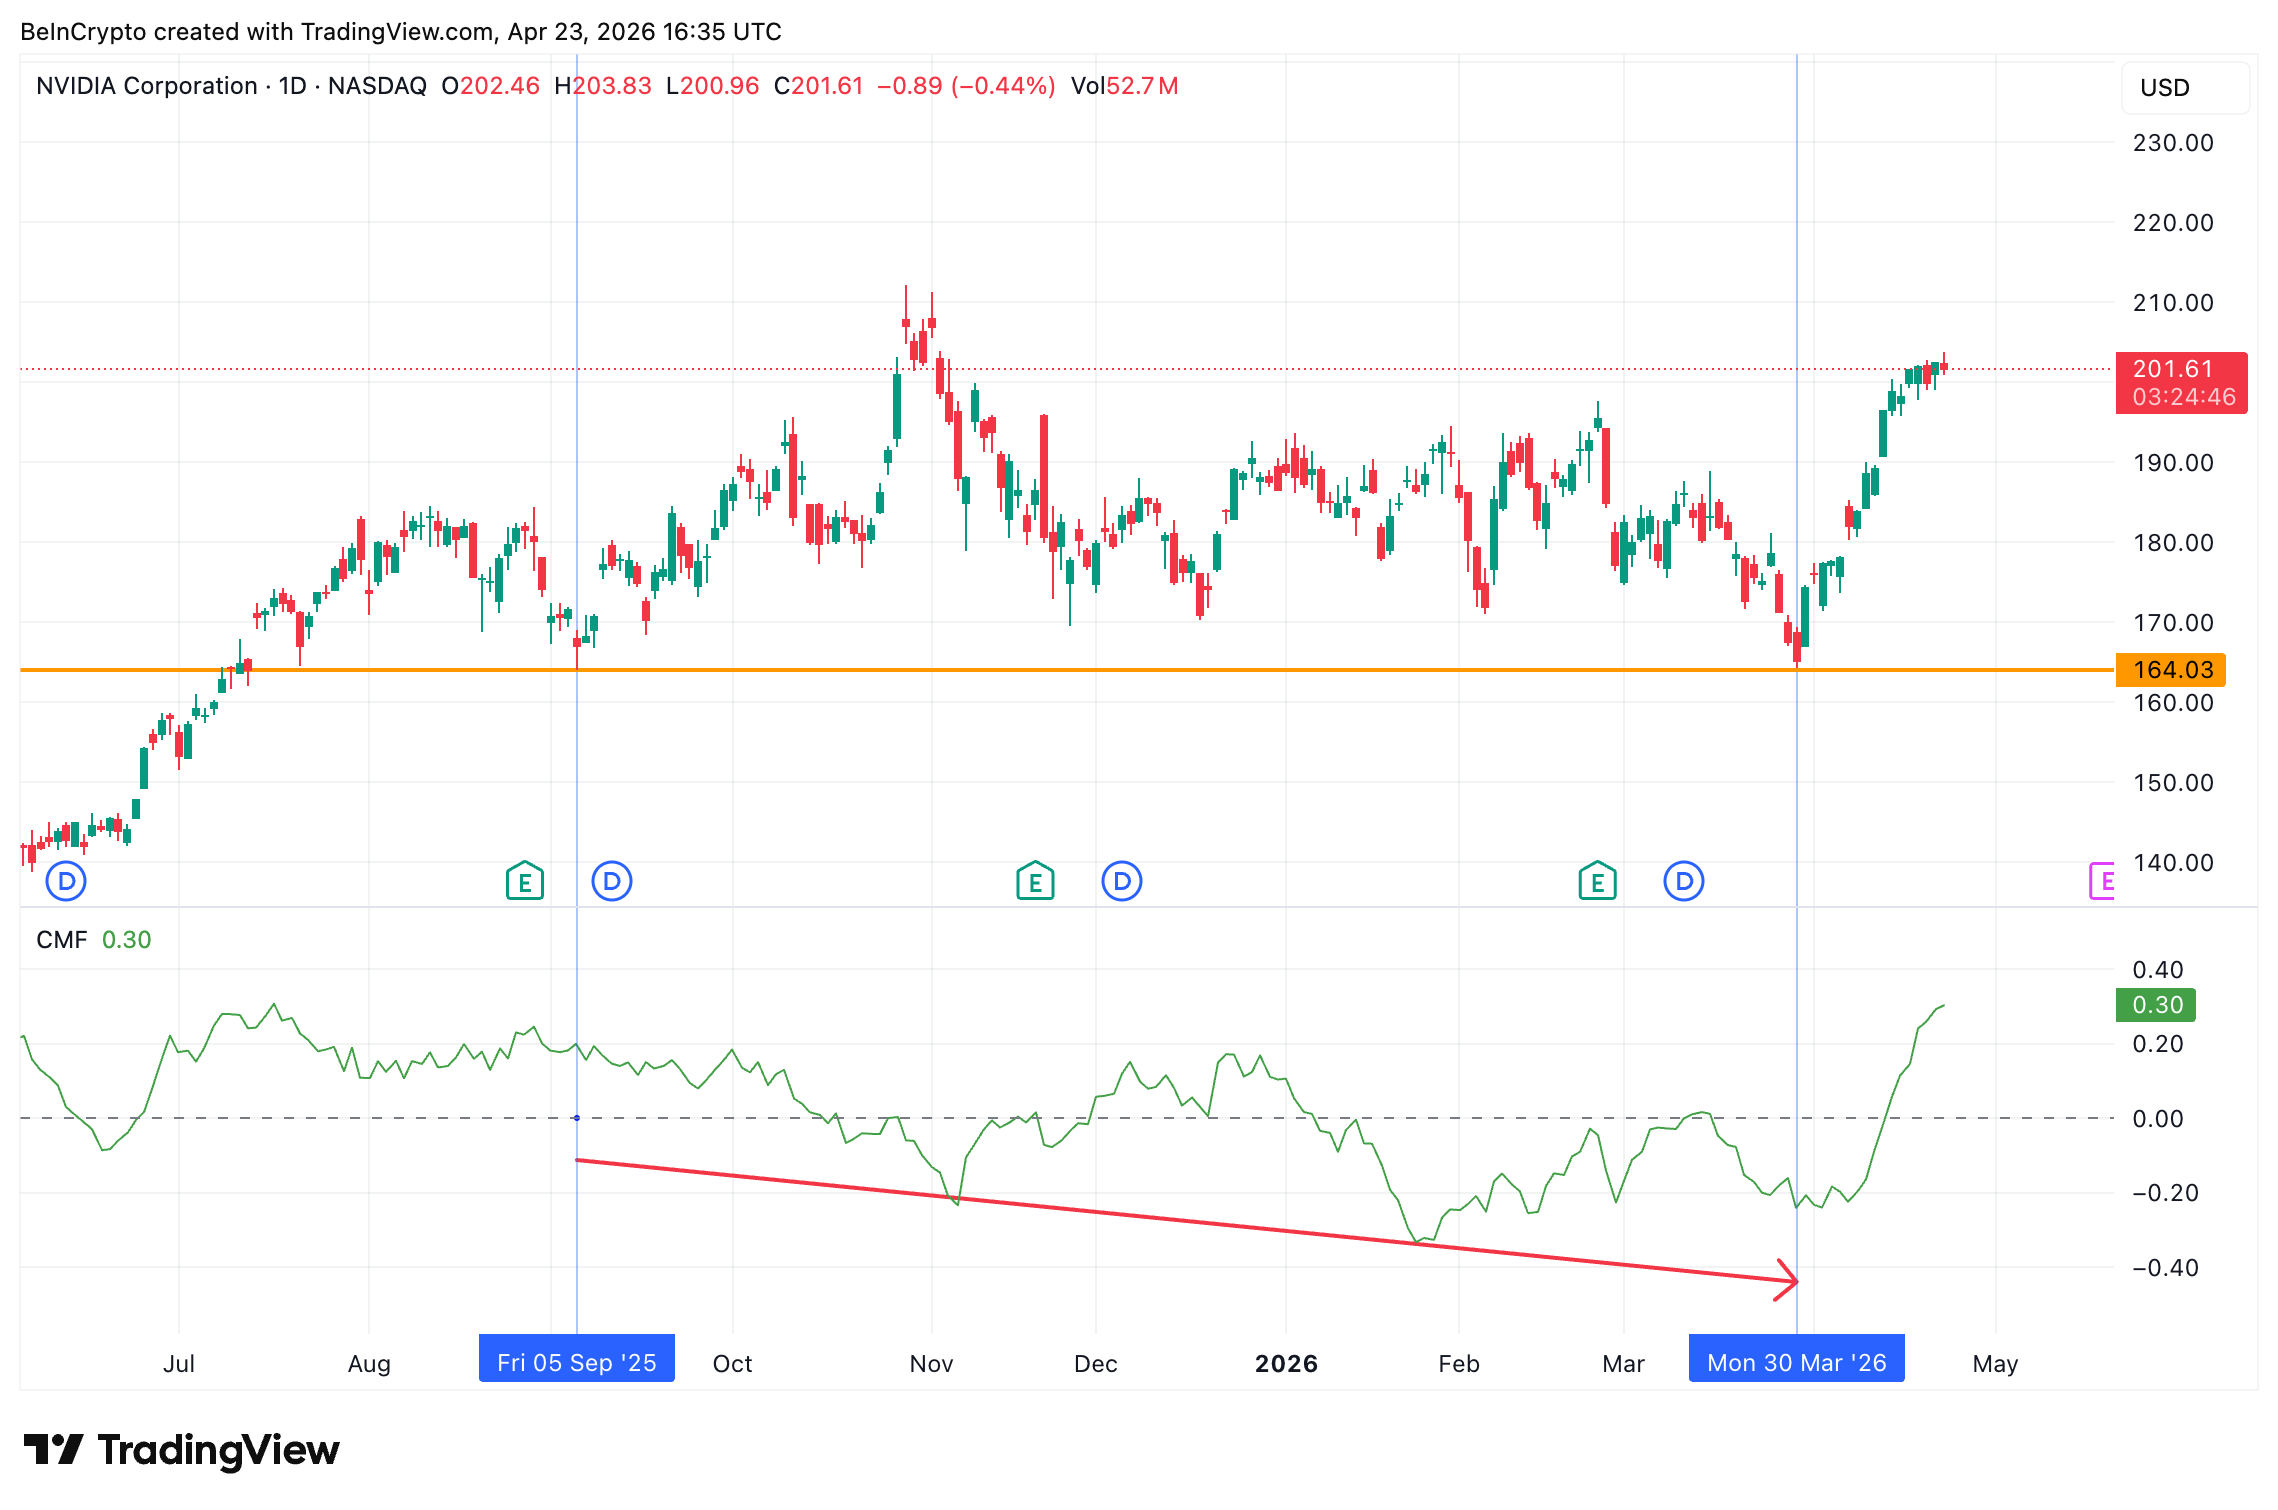
Between September 5, 2025, and March 30, 2026, Nvidia’s price returned to the $164 level at both endpoints, while CMF trended lower over that span. That is a hidden weakness signal.
The April rally has shot CMF up to 0.30, but the structural picture shows NVDA running hot into its May 27 print with little room for upside surprise.
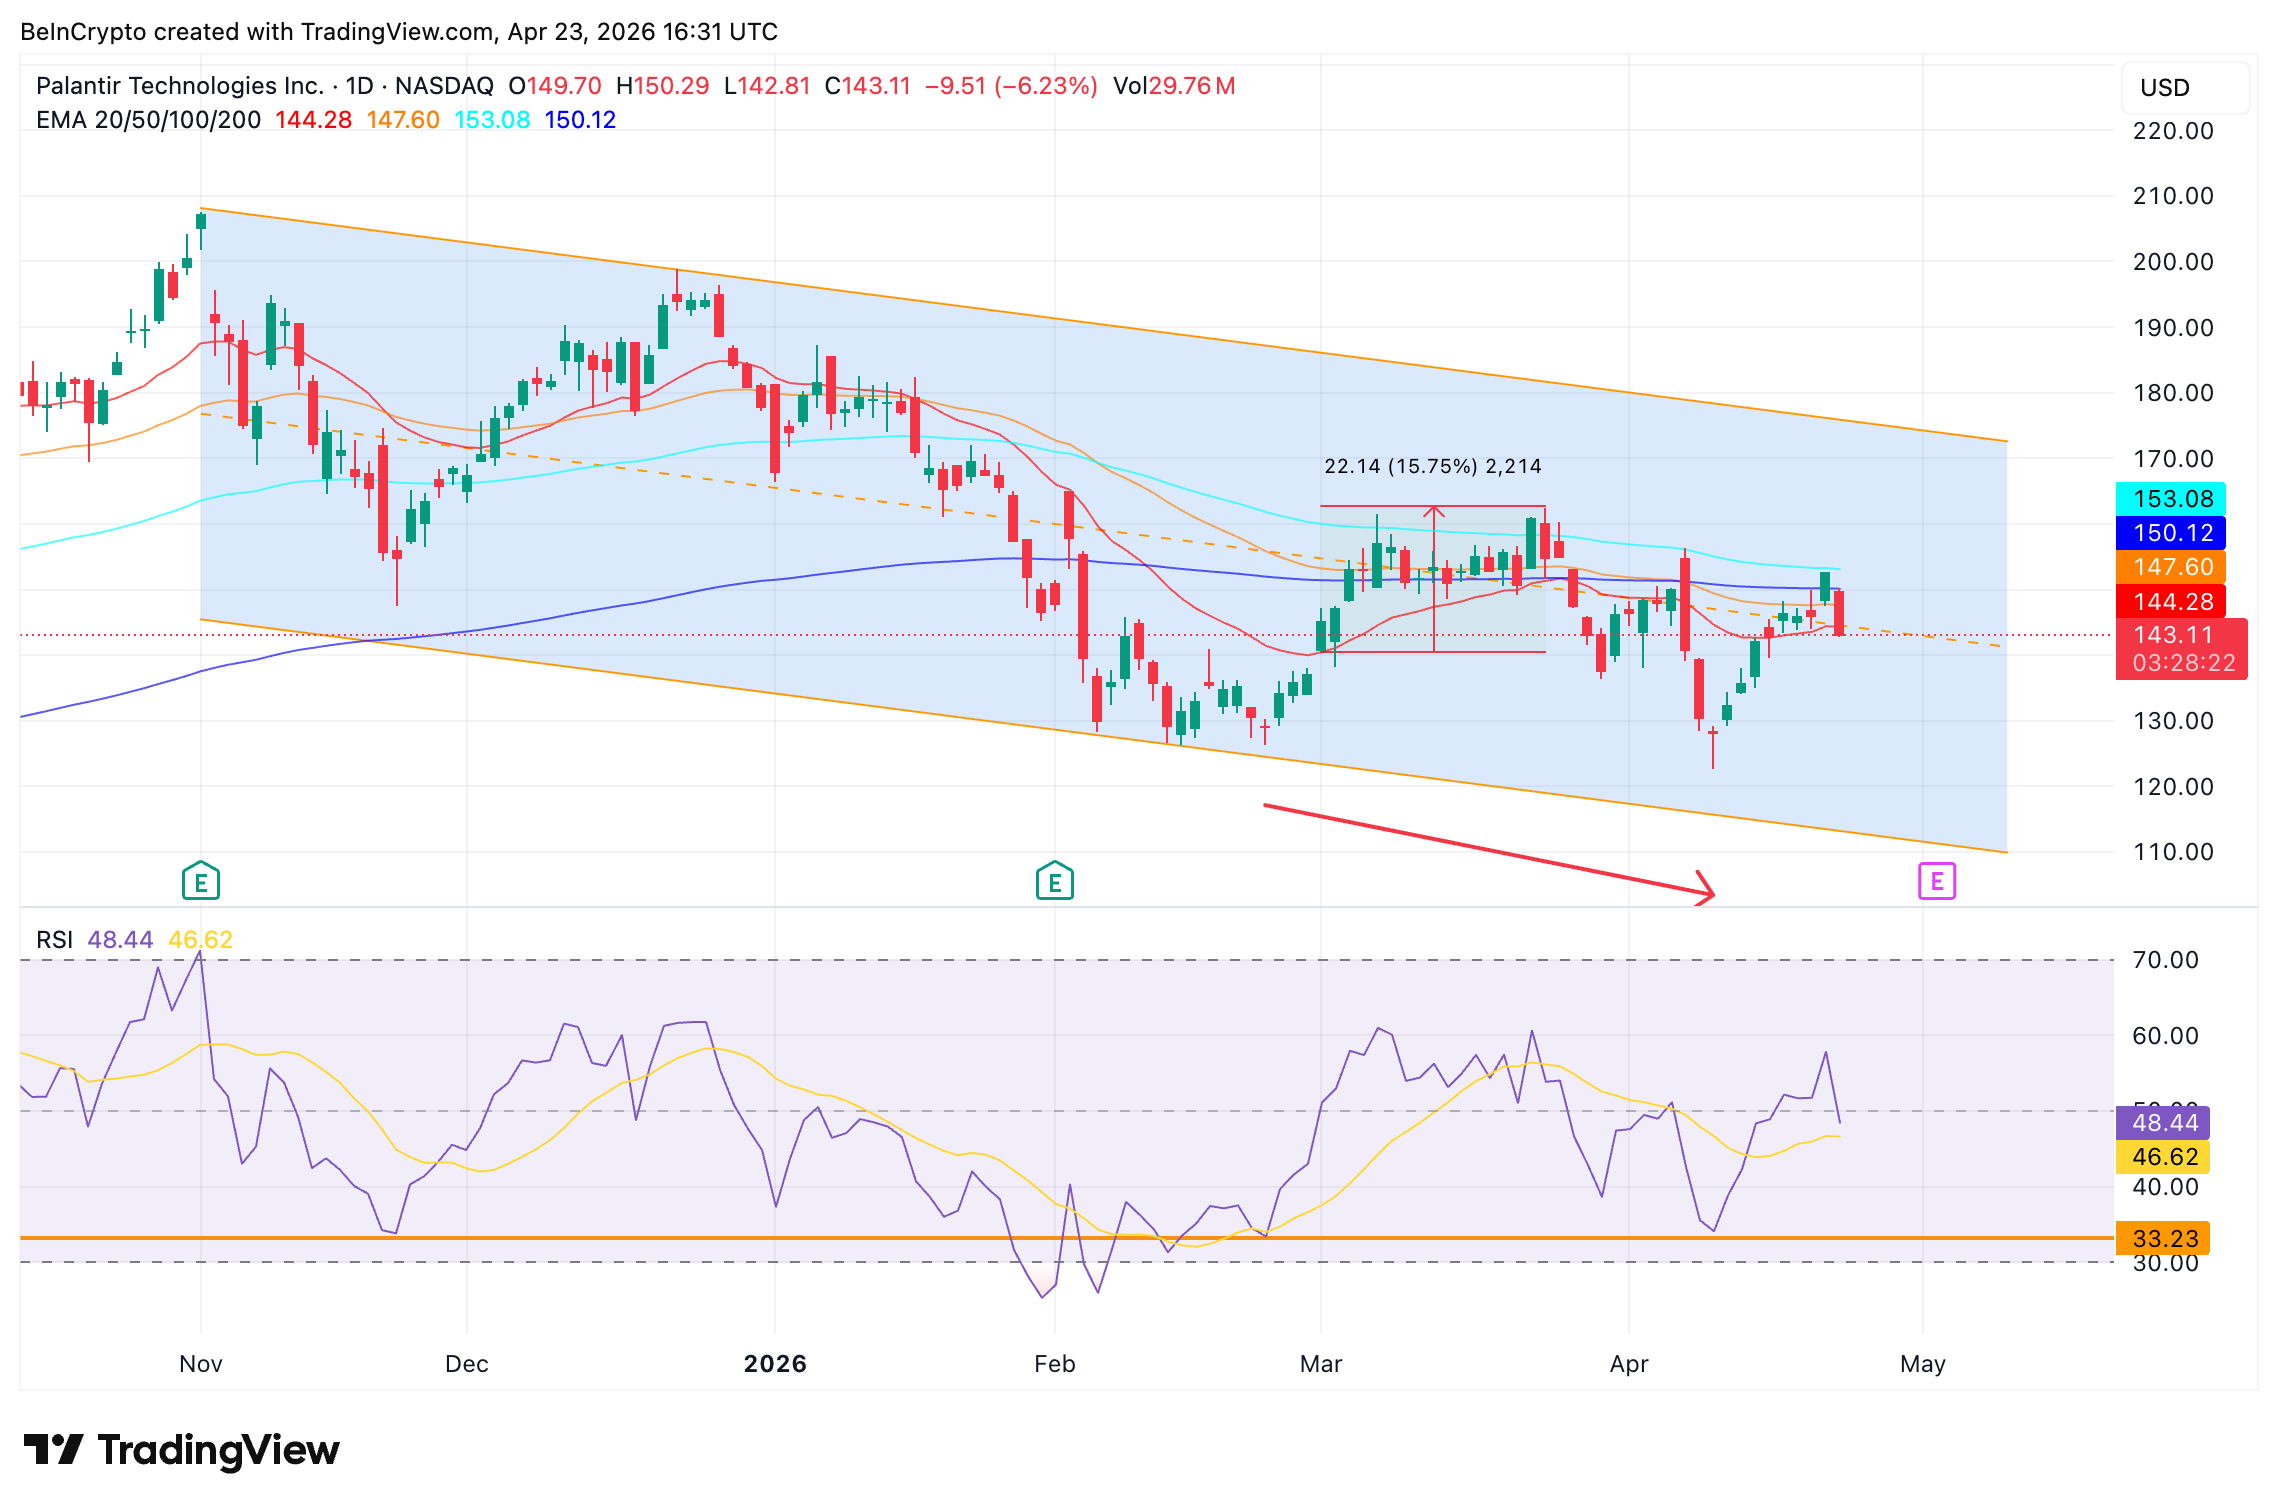
Also, between February 24 and April 10, PLTR price made a lower low while its Relative Strength Index (RSI), a momentum indicator, made a higher low. That is a standard bullish divergence, and it already played out with a rally off the April low. The moving averages amplify the signal.
PLTR’s key exponential moving averages (EMAs) are all clustered within a tight ten-dollar band above the current $143 price. EMAs are trend lines that smooth out daily noise.
When four of them compress this close together, the next clean break triggers a cascade as each line gets reclaimed in quick succession. The last time PLTR cleanly reclaimed its 20-day EMA, on March 2, the stock rallied 15.75%.
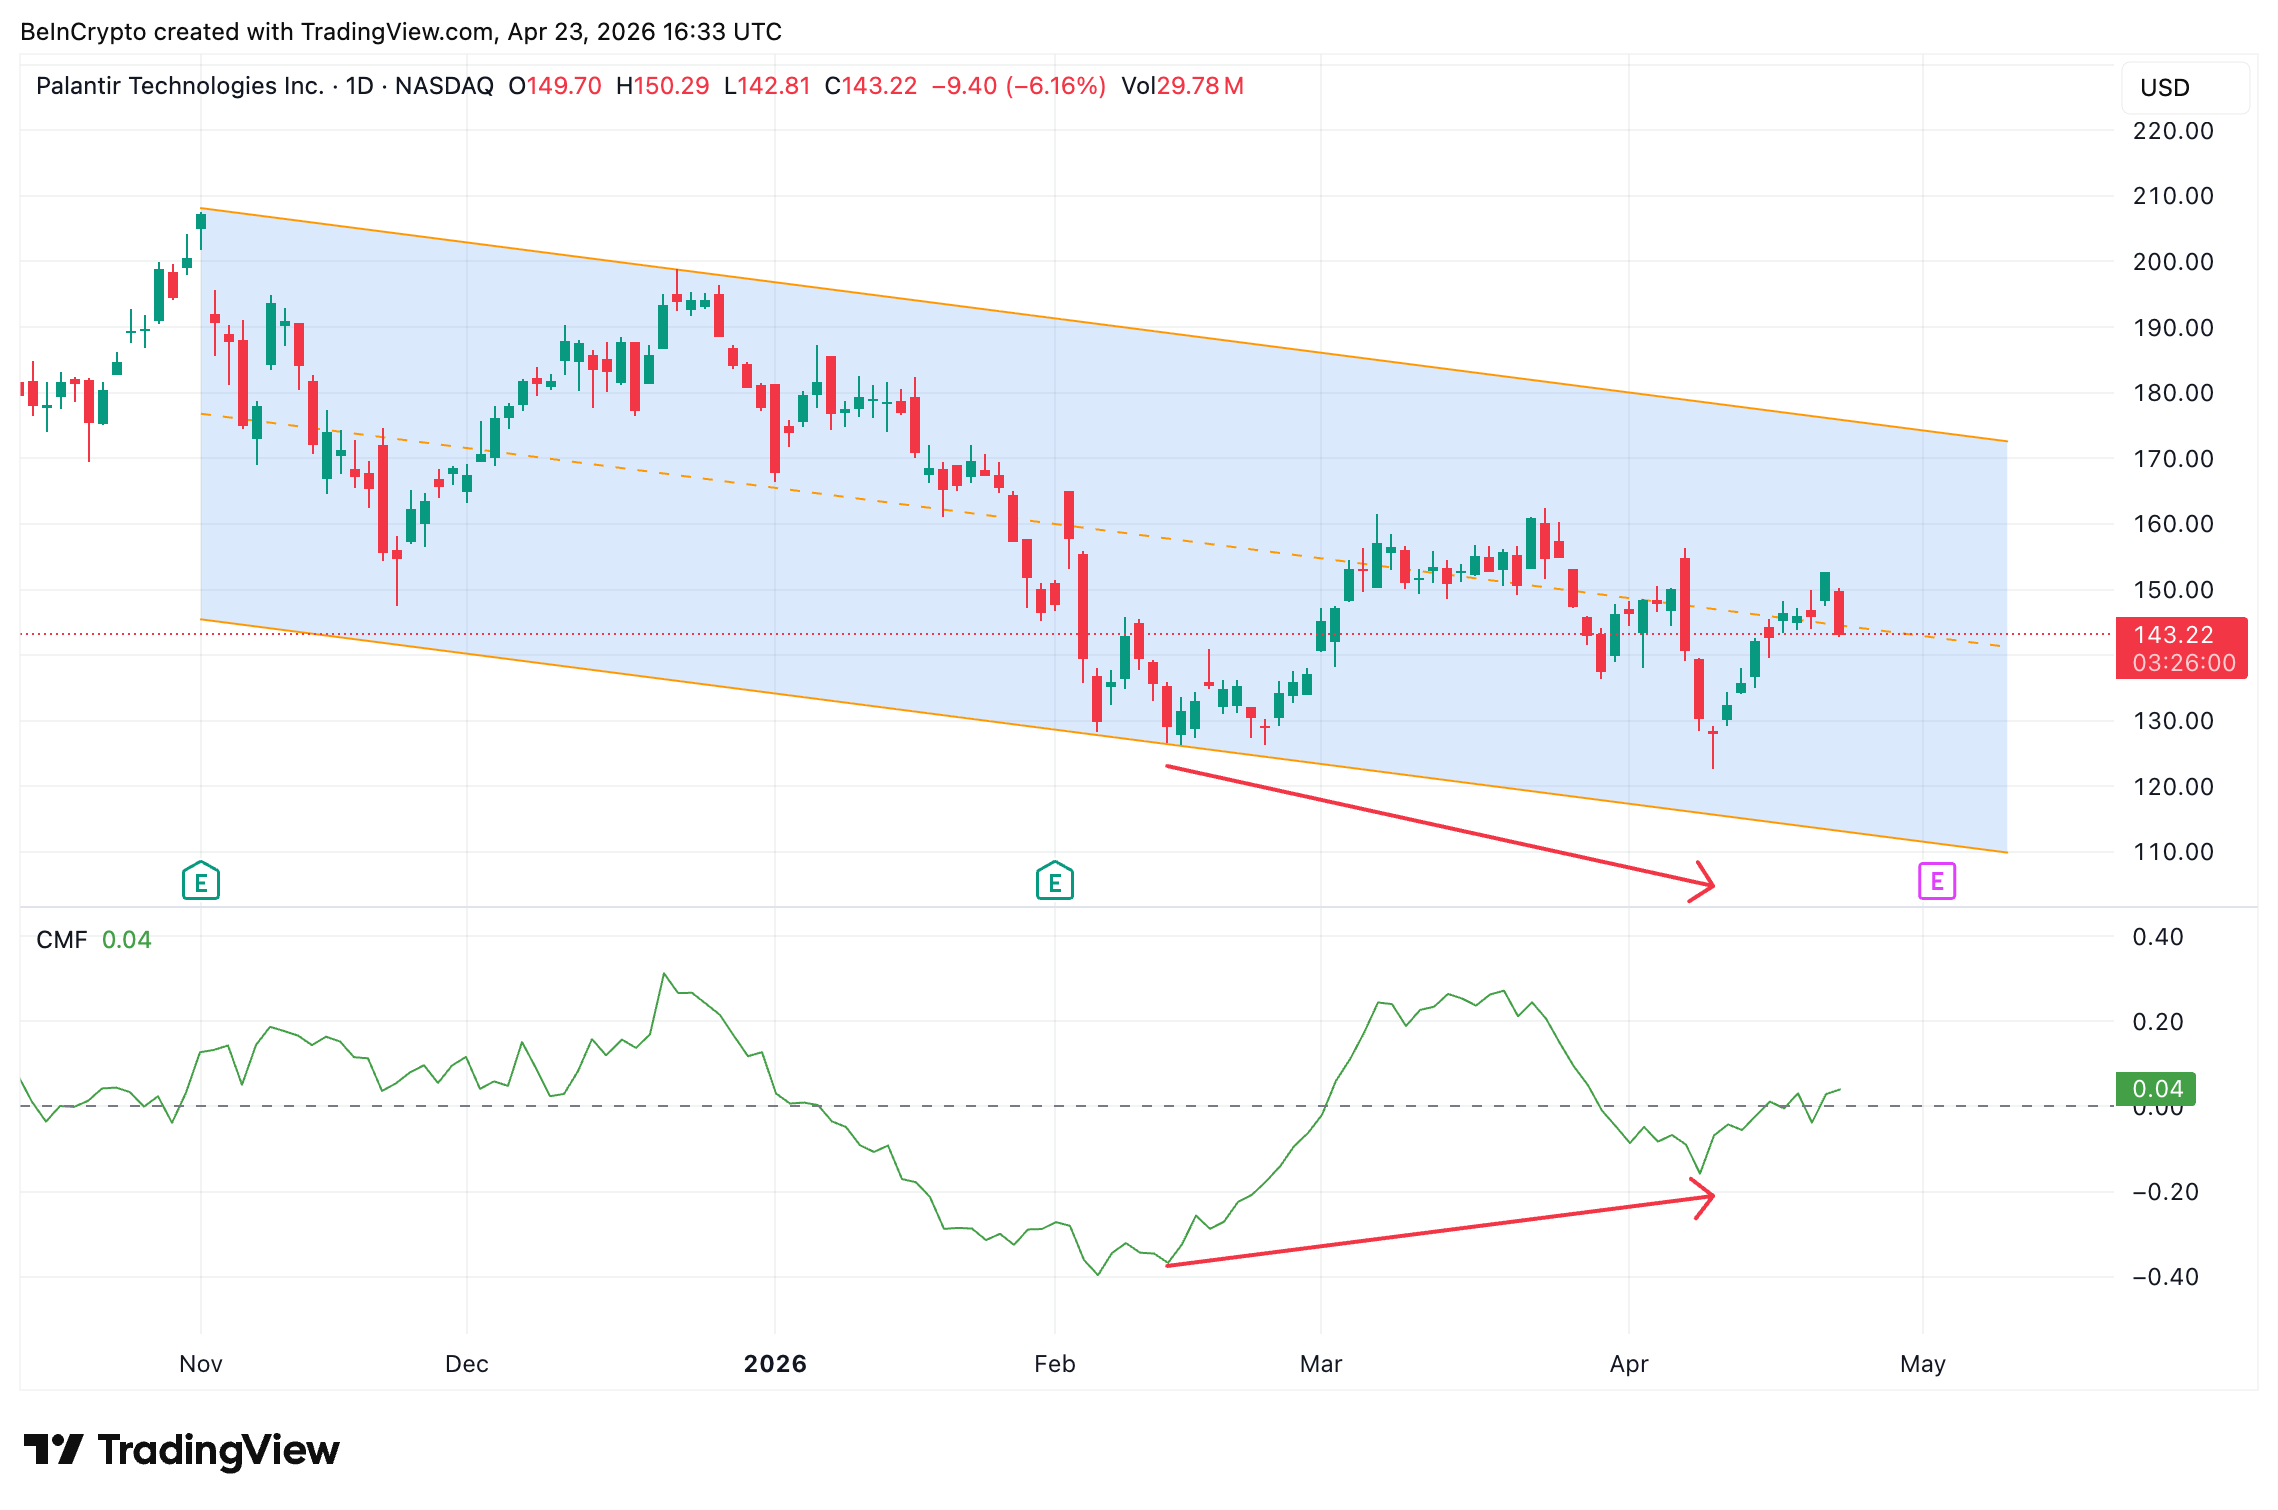
Coming back to the big money flow, between February 12 and April 10, the price trended lower while the CMF trended higher. This second bullish divergence has since triggered CMF’s cross back above the zero line.
The Options Market Could Decide the Rally
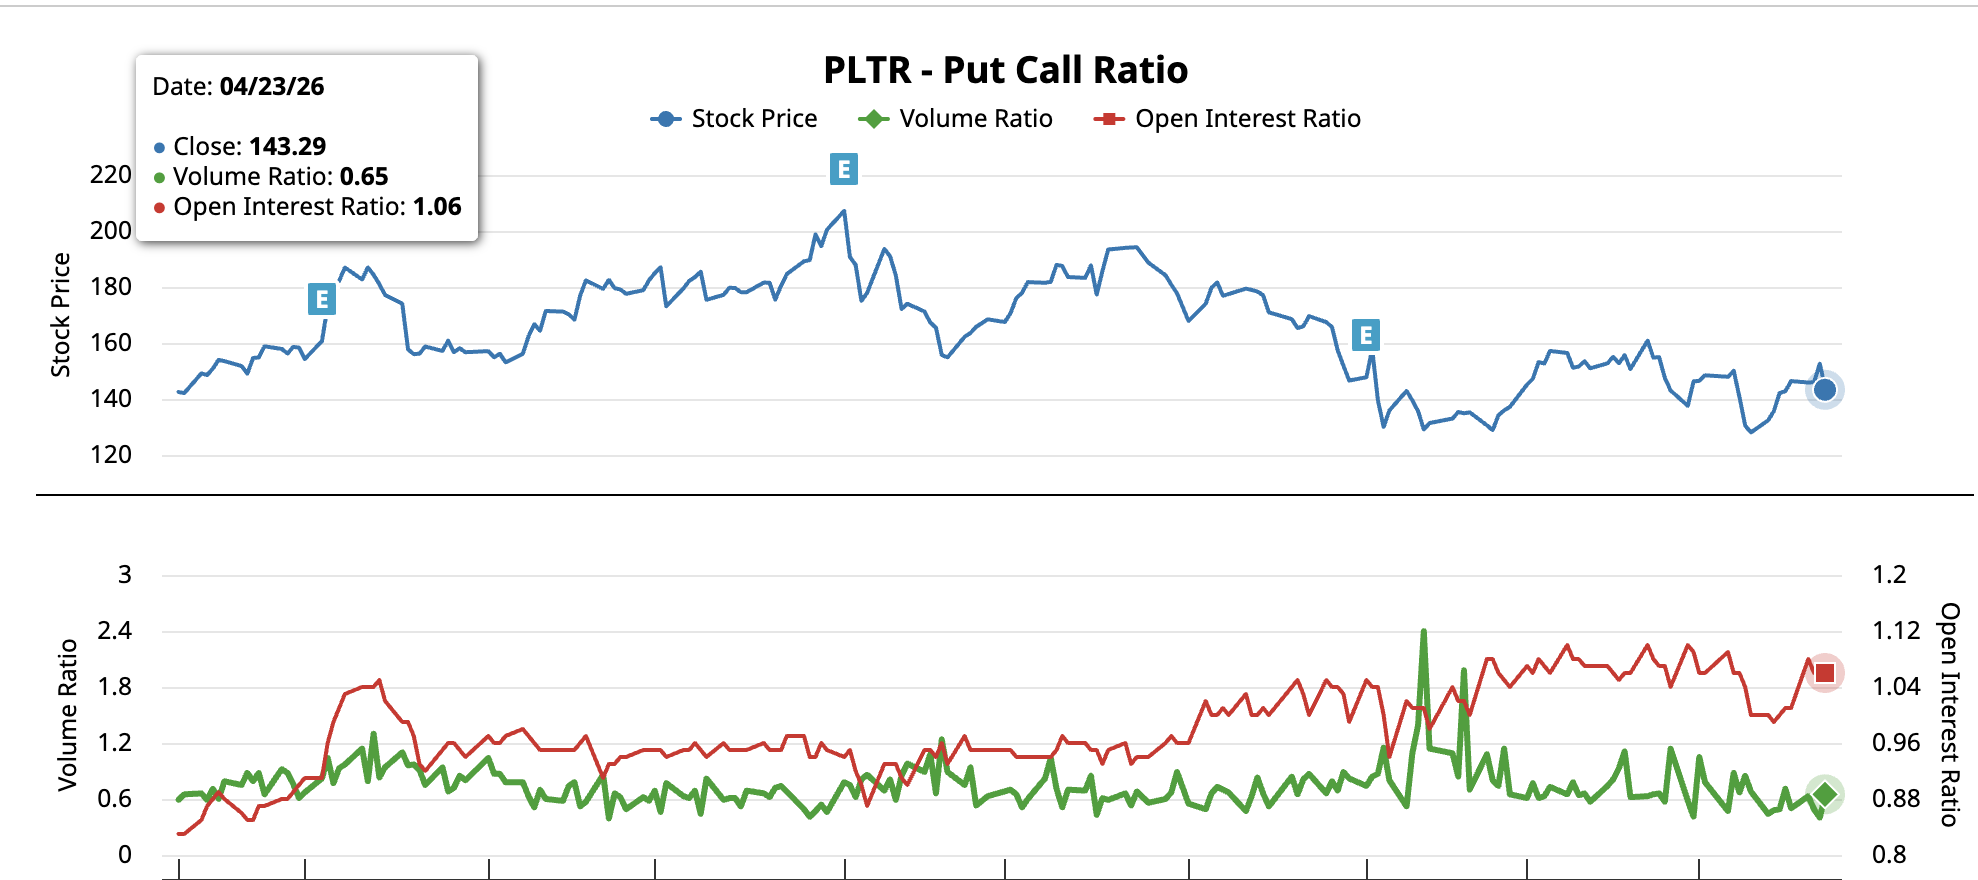
The third signal is in the options market. PLTR’s volume put-call ratio is 0.65, indicating calls are outpacing puts on a daily basis. But the open interest put-call ratio is 1.06, meaning there are still more puts than calls in standing contracts.
That gap is short-squeeze fuel. If the May 4 print delivers the beat-and-raise that consensus already expects, trapped short positioning has to cover, and the mechanical flow alone can push PLTR through the channel resistance that has capped every rally since November.
Together, multiple signals, oversold price, positive institutional flow, and short positioning primed to squeeze, converge on one level that has to break.
Break $155 to Flip the Trend, Lose $142, and the Decline Continues
The first hurdle is $155. A daily close above that level takes price through all four stacked EMAs at once, the same cascade that delivered the 15.75% rally after the March 2 reclaim. That break opens a path toward $165 and then the bigger test at $175.
The $175 level is where the setup earns its edge. It aligns with the 0.618 Fibonacci retracement and the upper trendline of the falling channel that has capped every rally since November 3. A break above $175, especially if the May 4 print delivers the beat-and-raise Morgan Stanley has flagged, clears the channel and exposes $189 and the November peak at $207 as the next upside targets.
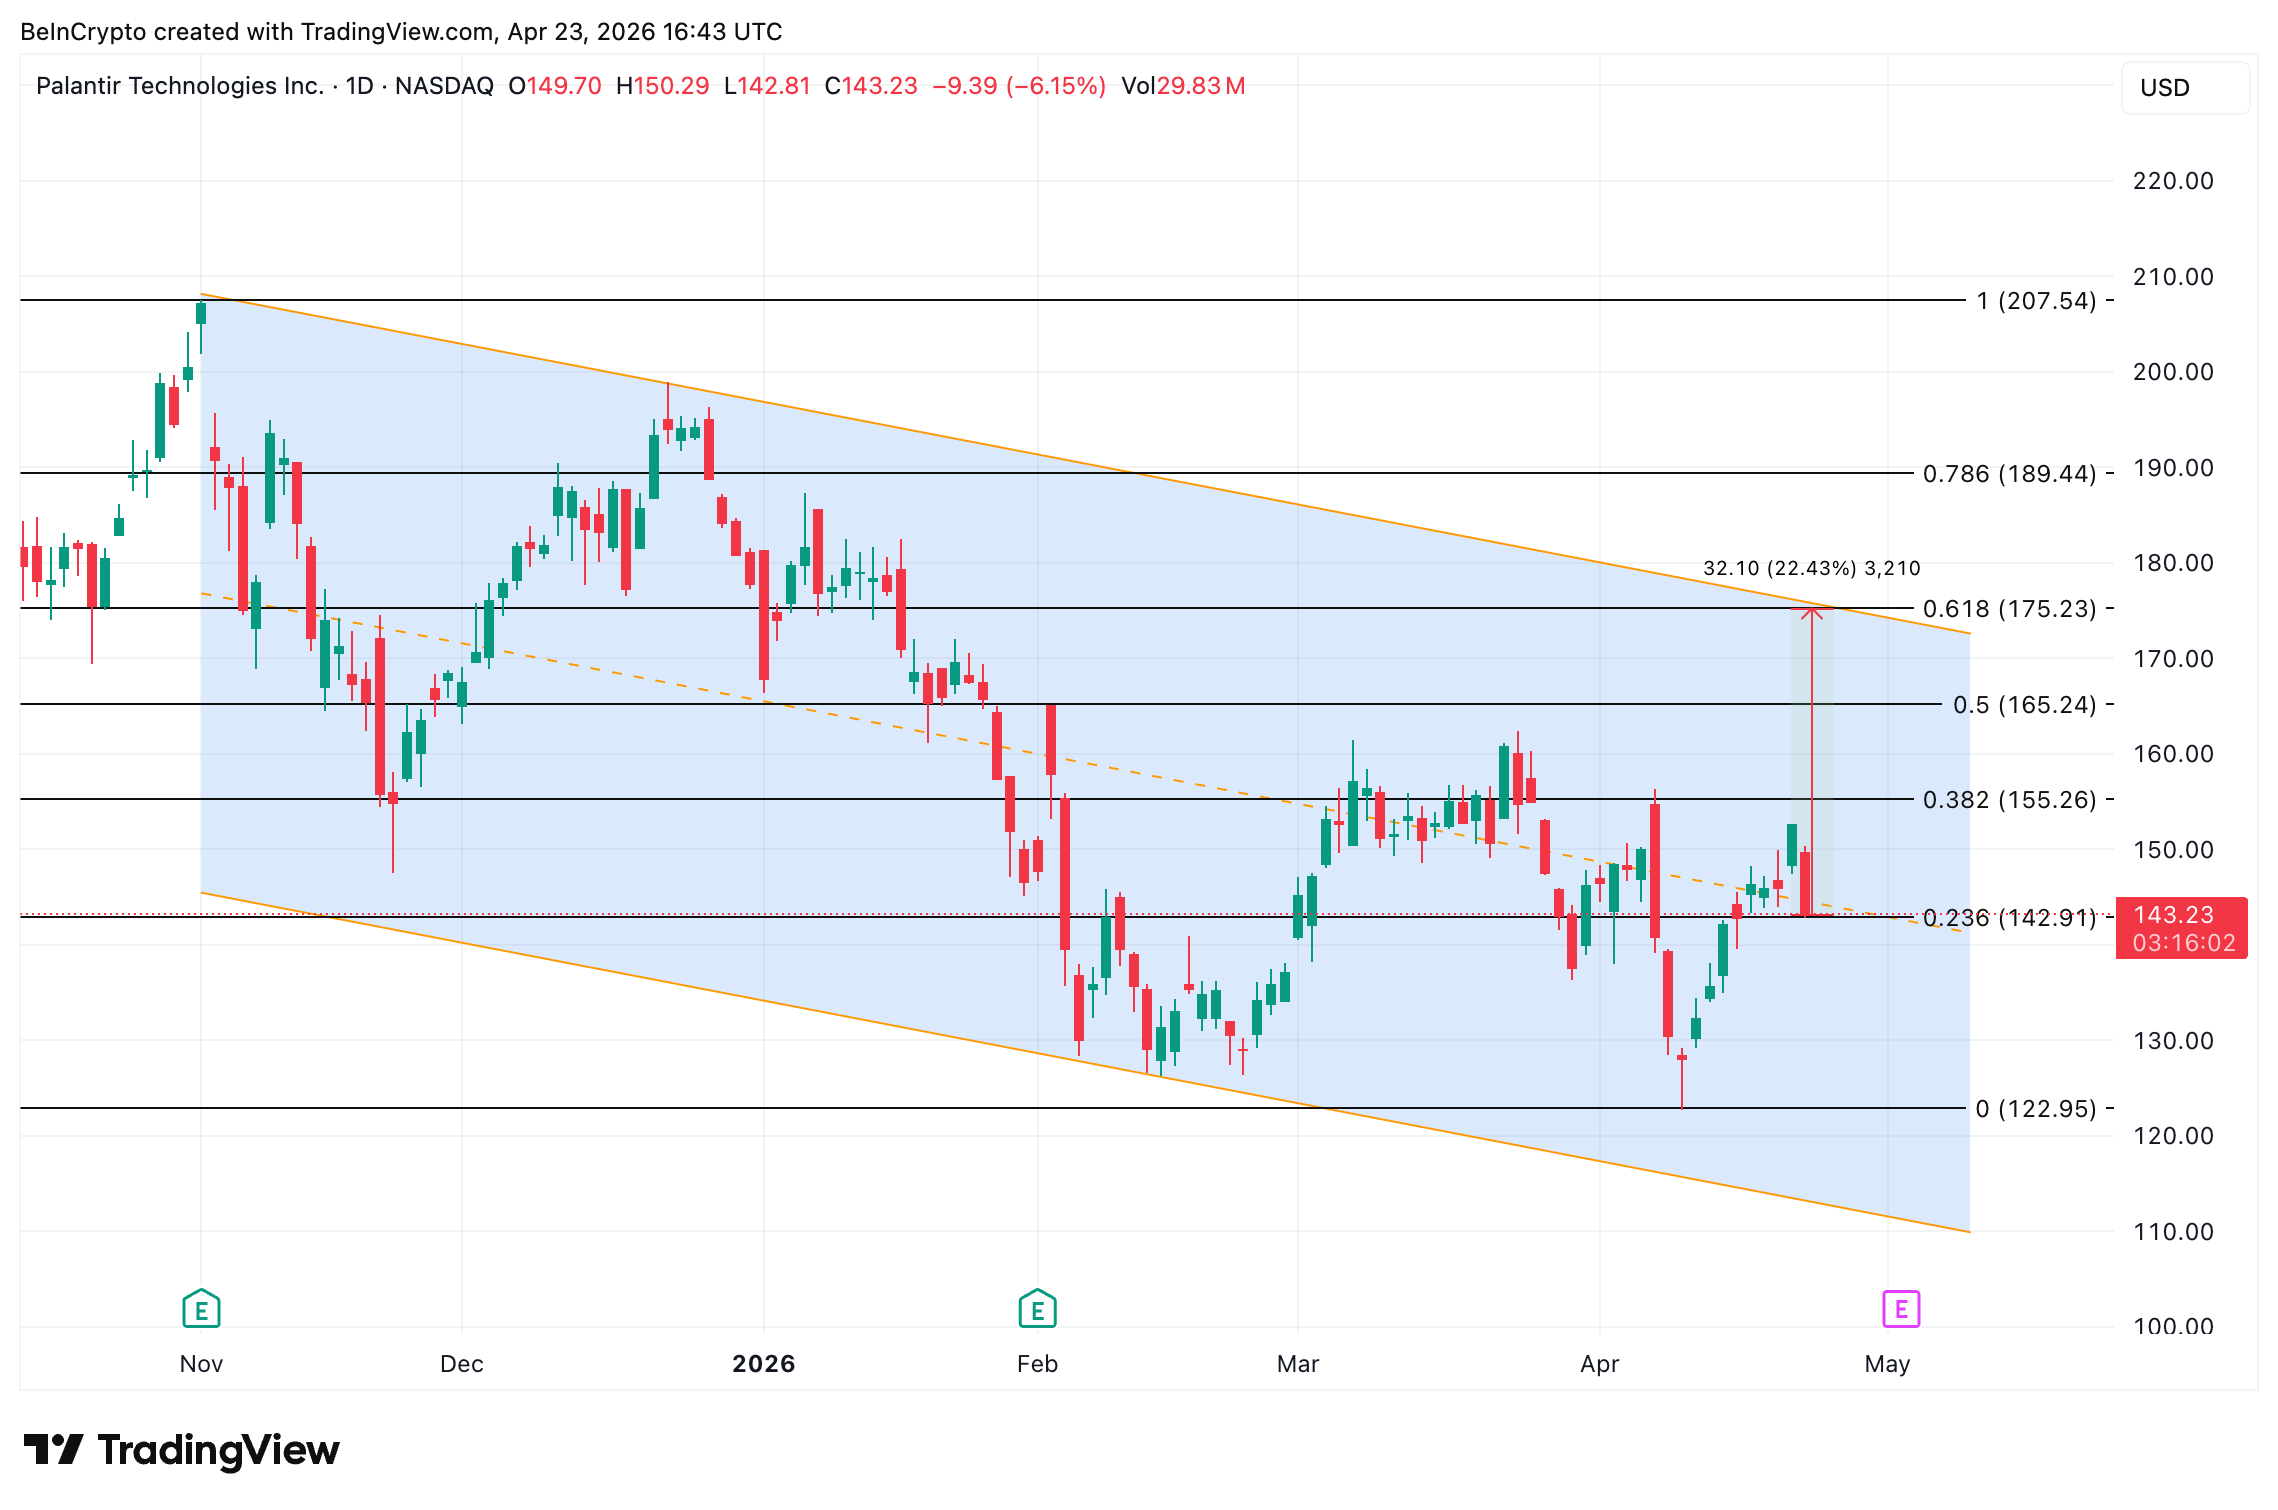
The invalidation is clean. A daily close under $142 breaks the setup and reopens the downside. That exposes $122, the recent April low. If Palantir delivers the beat-and-raise the tape is already setting up for, the signals that have been stacking up for weeks will finally clear the resistance that has capped the stock for six months.
The post Palantir Earnings Could Ignite AI Stocks Before Nvidia appeared first on BeInCrypto.

Everyone on a liquidity route in Bitcoin’s Lightning Network wants the same rebalance of funds to happen, but none of them wants to be the first person to pay.
The tenuous impasse is a classic Mexican standoff.
When this situation occurs, Lightning node operators can neither pay nor not pay first without harming themselves, so nobody moves, and nobody wins. It has been a recurring problem for years.
After almost a decade of tools and research chasing this problem, the network’s routing nodes remain locked in a standoff that quietly erodes routing reliability of bitcoin (BTC).
The Lightning Network, Bitcoin’s largest layer 2 network with no connection to an altcoin, has a structural bias toward channel depletion.
That is, money tends to flow in one direction along channels from senders toward structural receivers, such as merchants receiving BTC who deliver goods and services to customers.
Routing nodes are left with channels that are stuffed with BTC on one side and depleted of BTC on the other. A channel that cannot send in both directions is effectively half-broken for routing purposes.
Lightning’s total capacity set a fresh all-time high of roughly 5,600 BTC in December 2025, but that surge arrived almost entirely through institutional deposits from Binance and OKX into existing channels. Year-to-date data tells a different story.
BTC capacity from December’s high above 5,600 has declined to 4,884 today, and payment channels have declined from more than 80,000 in mid-2023 to about 45,000 today, nearly halving as liquidity consolidated into lopsided channels on a shrinking graph.
The cheapest fix is the one nobody will start
René Pickhardt, one of the network’s most prolific routing researchers, wrote that most channels “are expected to be depleted over time, primarily due to selfish routing behavior within the current protocol design.”
By his accounting, any given payment link has roughly a coin-flip chance of avoiding long-term depletion.
Researchers have described the embarrassingly simple yet elusive solution.
Presenting several nodes sitting on a circular payment path connected to one another by payment channels and all lopsided in the same direction, each could push BTC around the loop and finish a complete cycle with healthier channels as a result.
Everyone would benefit if everyone cooperated at the same time.
The problem, as with every Mexican standoff, is who pays first.
Routing BTC over Lightning costs money. Whichever node kicks off the rebalance owes routing fees to every other hop on the loop. If they wait, other nodes can receive their rebalancing for free and pocket the fee.
Although every node operator on the ring would benefit most as a collective if they all pushed BTC around for a single sending plus a single receiving fee — i.e. for nearly free in net — each operator also has the rational choice to wait for someone else to send first so they can collect without sending.
Wait for someone else to move first. It is a Mexican standoff.
Read more: Why two-party Bitcoin Lightning channels keep failing
A graveyard of fixes for Lightning channel imbalances
The industry has thrown nearly a decade of engineering at channel imbalances without solving these types of standoffs.
Alex Bosworth’s submarine swaps, announced in August 2018, let operators shuffle BTC between on-chain and Lightning to reload channels.
It helped a bit, but every swap burned a real BTC transaction fee, so adoption didn’t pick up enough to solve many of the network’s recurring Mexican standoffs.
Lightning Labs packaged the idea into Loop and, later, into Lightning Pool, a non-custodial marketplace for inbound channels since at least November 2020.
Lightning Pool activity declined within roughly a year, and the product faded from the ecosystem.
Core Lightning’s Liquidity Ads, the closest protocol-native alternative, sees fulfillment that one recent analysis described as sporadic at best.
Amboss Technologies launched Magma in April 2022 to let operators buy and sell inbound liquidity peer-to-peer. Other rebalancing scripts like C-Otto’s rebalance-lnd and Bosworth’s Balance of Satoshis let operators pay themselves through loops when fees permit.
A new proposal this week aims to encourage cooperation at a protocol level.
A perennial problem with Lightning
None of those efforts have prevented standoffs from recurring.
Protos has previously documented Pickhardt’s argument that depletion is a structural property of the two-party channel itself, not an operational hiccup.
His January 2026 paper identified three possible mitigations: symmetric fees per direction, convex or tiered fees, and coordinated replenishment.
The first two require fee structures most routing nodes would reject outright. The third requires somebody to volunteer to coordinate.
Coordination is where Lightning keeps getting stuck. The protocol is supposed to work with nodes routing selfishly without trusting each other.
When channels become lopsided, however, fixing the network’s most persistent liquidity problem requires exactly the type of coordination the protocol was built to avoid.
Got a tip? Send us an email securely via Protos Leaks. For more informed news, follow us on X, Bluesky, and Google News, or subscribe to our YouTube channel.
- XRP price held support near $1.40 and could eye a retest of $1.50.
- Bitcoin and Ethereum continued to dictate sentiment.
- Cryptocurrencies are showing upside potential despite geopolitical headwinds.
XRP is positioning for a crucial retest of the $1.50 resistance level, buoyed by broader upside signals across the cryptocurrency market.
As Bitcoin stabilizes above $78,000 and Ethereum holds near $2,300, XRP’s price around $1.40 reflects relative stability in today’s trading.
BTC and ETH holding current levels could help reinvigorate capital flows, with top altcoins likely to follow despite ongoing geopolitical uncertainties.
XRP price holds support
As noted, XRP held above key support at $1.40 on Thursday, with a slight uptick to intraday highs signaling a potential move back toward $1.50.
While prices were down about 1.8% at the time of writing, trading volume had also declined by 11%, suggesting bulls are absorbing selling pressure rather than capitulating.
XRP climbed to highs of $1.45, showing resilience as Bitcoin reclaimed $78,600 and Ethereum touched $2,350.
Cryptocurrencies have broadly held key levels despite geopolitical headwinds, including tensions in the Middle East.
“This month’s sustained rebound reflects capital inflows. If macroeconomic pressures bottom out by mid-year, Bitcoin’s bottom will also be confirmed,” analysts at Greekslive wrote on X.
On-chain data points to reduced selling pressure, with whale accumulation increasing in recent weeks. This stability suggests buyers are regrouping and could challenge overhead resistance if momentum continues.
XRP price outlook
XRP’s broader outlook remains tied to movements across risk assets, including recent outflows from crypto ETFs.
Macro factors—such as Federal Reserve hawkishness and equity market pullbacks—could amplify downside risks. If Bitcoin weakens, XRP is likely to follow.
Lingering geopolitical uncertainty, including limited progress from the US-Iran ceasefire, could further weigh on sentiment.
That said, institutional and retail interest remains supportive. Ripple’s ongoing partnerships and expansion in payments adoption continue to underpin fundamentals.
Despite delays in a spot XRP ETF launch, analysts believe Ripple could still attract sustained capital inflows.
Technical setup signals breakout potential
From a technical perspective, a potential cup-and-handle pattern is forming on the daily chart.
The “cup” base developed between $1.10 and $1.65 over the past month, with the handle consolidating in the $1.40–$1.50 range.
A decisive breakout above $1.50 could open the path toward $1.80. However, XRP has struggled to regain momentum after falling below the $2.00 level.
Failure to break resistance may see the token revisit lower support levels around $1.30 or even $1.20, last seen in early April.
Going forward, investors are likely to watch macroeconomic data and geopolitical developments closely for direction.

A negative Bitcoin funding rate and $7.5 billion in USDC reserves suggest traders may start positioning against the bearish trend. Will BTC price keep rising?

Intel headquarters in Santa Clara, California, on Jan. 22, 2026.
Justin Sullivan | Getty Images
Semiconductor stocks are powering the U.S. equity market to records in recent days and traders are predicting that means a big swing in shares of Intel after earnings after the bell Thursday.
Options are pricing in a $6.23 move on the report, a roughly 9% swing. That wouldn’t be out of the ordinary for the chipmaker: Shares slid as much as 18% after reporting fourth-quarter earnings in January before staging a 50% rally just this month alone.
The semiconductor group is up 145% in the past year, and Intel’s been a key leader, climbing more than 230% over that period.
The catch is, the stock has dropped after three of its last four earnings reports.
Sentiment looks like it’s shifting more bullish this time around. There are about as many puts trading as calls, but options traders are paying beefier premiums in upside calls, with total call premiums nearing $100M versus $50M in puts, according to data compiled by SpotGamma.
One big bullish trader this morning spent $2.2 million buying 3,200 $70 strike calls expiring June 18. Given the stock’s recent history of dropping after earnings, that seems less like a bet on the direction Friday and more that the stock will find footing in its long-term uptrend that’s been in play since last summer.

TLDR
- Bitmine staked about $320 million worth of ETH within 24 hours through Coinbase Prime.
- The company now generates yield on more than 70% of its total ether holdings.
- Onchain data shows Bitmine has staked roughly 3.5 million ETH valued at about $8.1 billion.
- Reports indicate that Bitmine may hold up to 5.08 million ETH if recent wallet transfers are confirmed.
- Bitmine controls over 4.1% of the total ether supply and targets 5%.
Bitmine expanded its Ethereum staking position after moving about $320 million worth of ETH within 24 hours. The company now generates yield on more than 70% of its total ether reserves. Onchain trackers reported fresh transfers to Coinbase Prime as Ethereum traded at $2,317 on Thursday.
Bitmine increases Ethereum Staking Allocation Through Coinbase Prime
Bitmine transferred about 75,600 ETH to Coinbase Prime for staking on Thursday morning. Onchain data from Arkham Intelligence recorded the transaction. The move followed a separate transfer of more than 61,200 ETH on Wednesday.
Blockchain analytics platform Lookonchain flagged the transactions in a public update. It stated that Bitmine has now staked around 3.5 million ETH. That amount equals roughly $8.1 billion and represents about 70.1% of its overall holdings.
Lookonchain also reported that three new wallets likely tied to Bitmine received 100,000 ETH. The tokens carried an estimated value of $234 million before Thursday’s staking activity. Bitmine has not yet confirmed ownership of those wallets.
If confirmed, Bitmine would hold about 5.08 million ETH in total. That level would extend its lead over SharpLink. SharpLink currently holds about 868,699 ETH.
As a result, Bitmine controls more than 4.1% of the total ether supply. The firm has stated a target of reaching 5% of supply. Recent purchases align with that objective.
On Monday, The Block reported that Bitmine bought over 100,000 ETH in the prior week. Chairman Tom Lee said he sees ether in the “final stages of the ‘mini-crypto winter.’” He commented while discussing the firm’s acquisition strategy.
Ethereum Price Declines as Bitmine Advances Treasury Strategy
Ethereum traded at $2,317 on Thursday, reflecting a 3.5% daily decline. The token ranked as the largest loser among the top 20 cryptocurrencies by market value. The broader crypto market also showed weakness during the session.
In March, Bitmine announced plans to migrate its ether treasury to MAVAN. The company launched MAVAN as its in-house staking platform last month. However, recent staking allocations continue to move through Coinbase Prime.
Bitmine has projected nearly $300 million in annual staking rewards once it completes the migration. The estimate relies on a 2.83% seven-day staking yield. The company has not provided a timeline for full migration.
Bitmine’s stock, trading under BMNR, has declined over the past six months. Shares traded near $22 on Thursday. The price reflects a 55% drop since October.
BMNR has tracked Ether’s roughly 50% decline during the broader crypto market drawdown. The company continues to expand its ether holdings despite market pressure. Its latest transfers mark the most recent treasury update.


World’s largest Cryptocurrency | Top 10 Cryptocurrency in the world #gk #bitcoin #crypto #rich #news
Coronation Street fans’ one problem with Lisa Swain and Carla Connor wedding after ITV change

Which Prop Firm Is Best for Beginners?
Manchester United reach agreement with Casemiro over contract clause amid transfer speculation

US brings back mandatory military draft registration

Steven Gerrard disagrees with Gary Neville over ‘shock’ Chelsea and Arsenal claim | Football


-

 Sports6 days ago
NWFL Suspends Two Players Over Post-Match Clash in Ado-Ekiti
-

 Fashion6 days ago
Weekend Open Thread: Theodora Dress
-

 Politics6 days ago
Palestine barred from entering Canada for FIFA Congress
-
Entertainment4 days ago
NBA Analyst Charles Barkley Chimes in on Ice Spice McDonald’s Fiasco
-

 Tech5 days ago
Auto Enthusiast Scores Running Tesla Model 3 for Two Grand and Turns It Into Bare-Bones Go-Kart
-

 Business4 days ago
Powerball Result April 18, 2026: No Jackpot Winner in Powerball Draw: $75 Million Rolls Over
-

 Politics4 days ago
Zack Polanski demands ‘council homes not luxury flats for foreign investors’
-

 Crypto World6 days ago
Russia Pushes Bill to Criminalize Unregistered Crypto Services
-

 Politics3 days ago
Gary Stevenson delivers timely reminder to register to vote as deadline TODAY
-

 Business1 day ago
Rolls-Royce Voted UK’s Most Iconic Trade Mark as IPO Register Hits 150
-

 Politics1 day ago
Disabled people challenge government SEND proposals over segregation concerns
-

 Politics1 day ago
Making troops accountable for war crimes threatens US alliance, ex-SAS colonel warns
-
 Business7 days ago
Creo Medical agree sale of its manufacturing operation
-

 Crypto World6 days ago
Russia Introduces Bill To Criminalize Unregistered Crypto Services
-

 Politics1 day ago
Starmer handler McSweeney to be dragged from shadows by Foreign Affairs Committee
-

 Politics1 day ago
Zack Polanski responds to home secretary’s taser threat
-
Politics1 day ago
Wings Over Scotland | How To Get Away With Crimes
-
Crypto World5 days ago
Kelp DAO rsETH Bridge Hack Drains $292M as DeFi Losses Top $600M in Two Weeks
-

 Politics1 day ago
‘Iran is still a nuclear threat’
-

 Crypto World2 days ago
New York sues Coinbase, Gemini over prediction market offerings
You must be logged in to post a comment Login