
Crypto World
Cardano price chart points to more downside as key ecosystem metrics plunge
Cardano price was stuck in a tight range on Monday, mirroring the performance of other cryptocurrencies.
Summary
- Cardano price continued its strong downward trend on Monday.
- Data shows that Cardano’s ecosystem growth has stalled.
- The team is now pegging its hope on the upcoming Midnight mainnet launch.
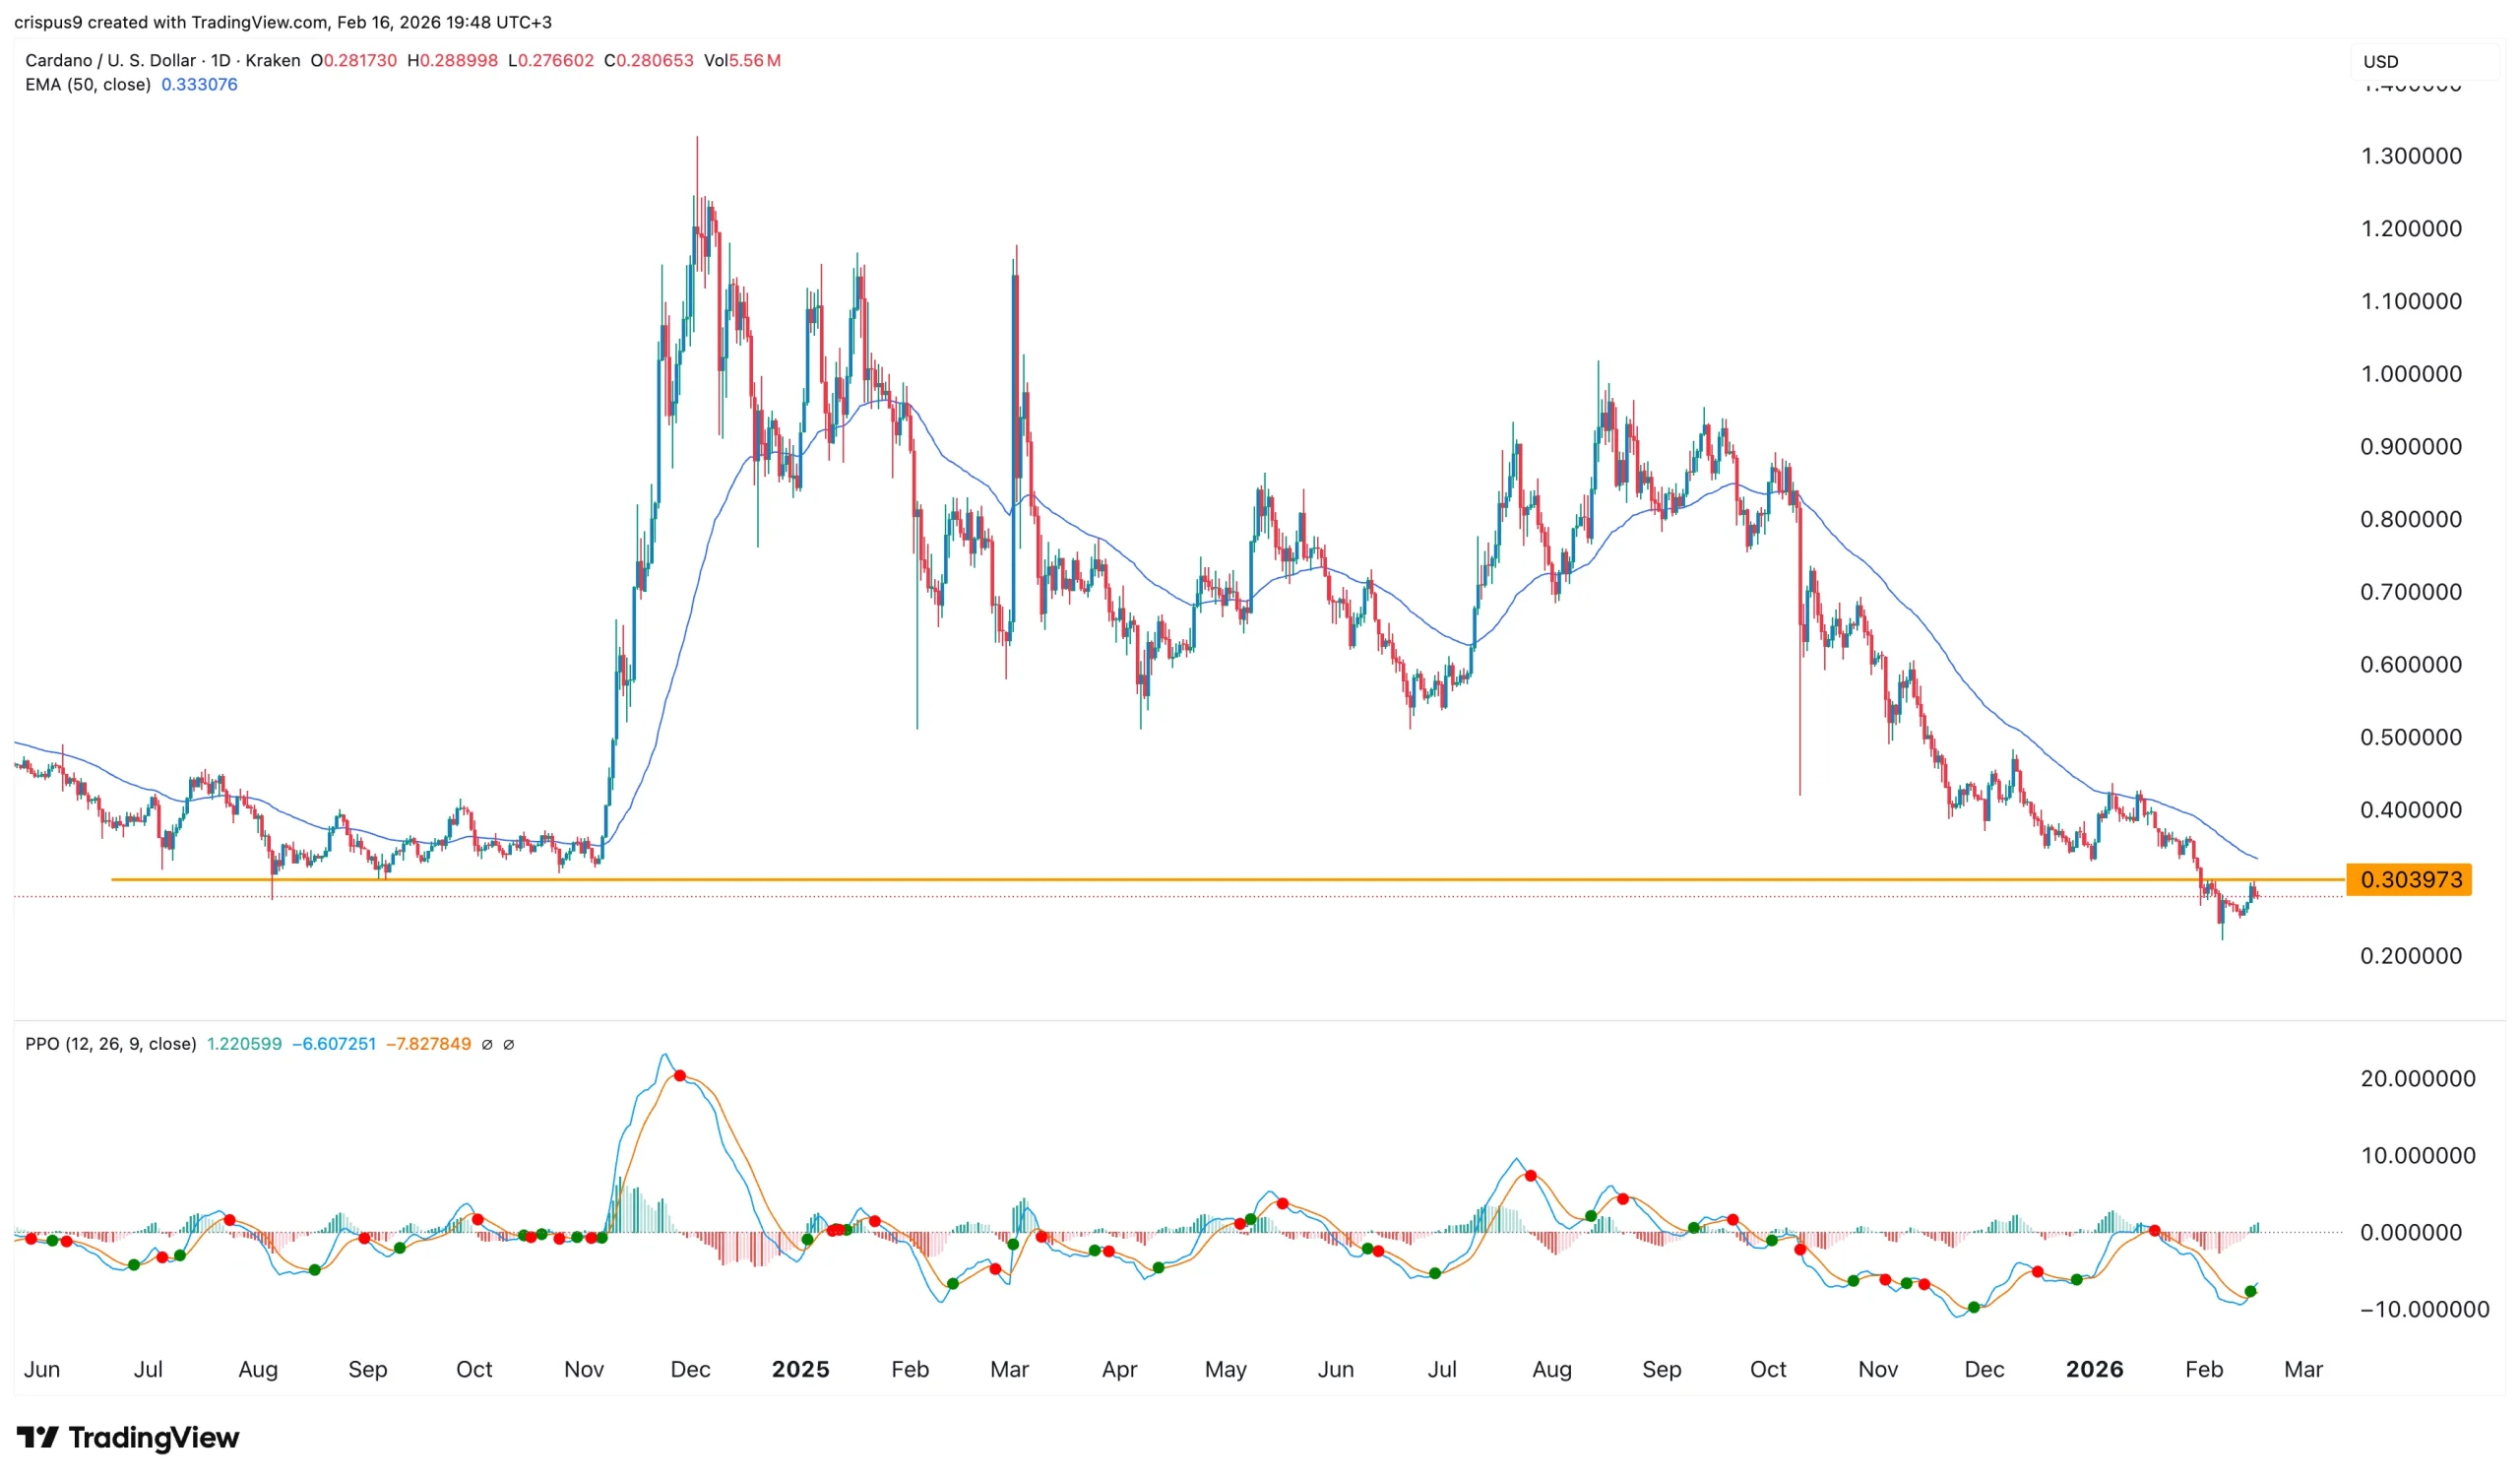
Cardano (ADA) was trading at $0.2815, stuck within a range it has been in for the past few days. It has dropped by nearly 80% from its highest point in November 2024.
Data compiled by DeFi Llama shows that Cardano’s ecosystem has continued to deteriorate over the past few weeks. Its decentralized finance ecosystem has continued to wane, with the total value locked falling by 26% in the last 30 days to $134 million.
Cardano has not added any new developers this year, even after securing a partnership with Pyth Network, one of the biggest oracles in the crypto industry. Pyth helps to bring off-chain data, such as price feeds, to the on-chain in an accurate way.
Adding more oracles to Cardano is one of the Pentad proposal’s top priorities, launched last year.
Cardano’s stablecoin ecosystem has also stalled. Its stablecoin supply stands at just $37 million, a tiny amount in an industry with over $300 billion in assets. The top stablecoins in the ecosystem are low-tier tokens like Moneta, Anzens, Djed, and iUSD.
Meanwhile, data compiled by CME show that the initial reception of the recently launched ADA futures has been weak, with the open interest being much lower than other tokens like Bitcoin and XRP.
Cardano is pegging its turnaround on Pentad and the upcoming Midnight mainnet launch, which will happen in the final week of March. Midnight will be a privacy-focused sidechain on Cardano, which is expected to attract more developers in the ecosystem.
Cardano price technical analysis
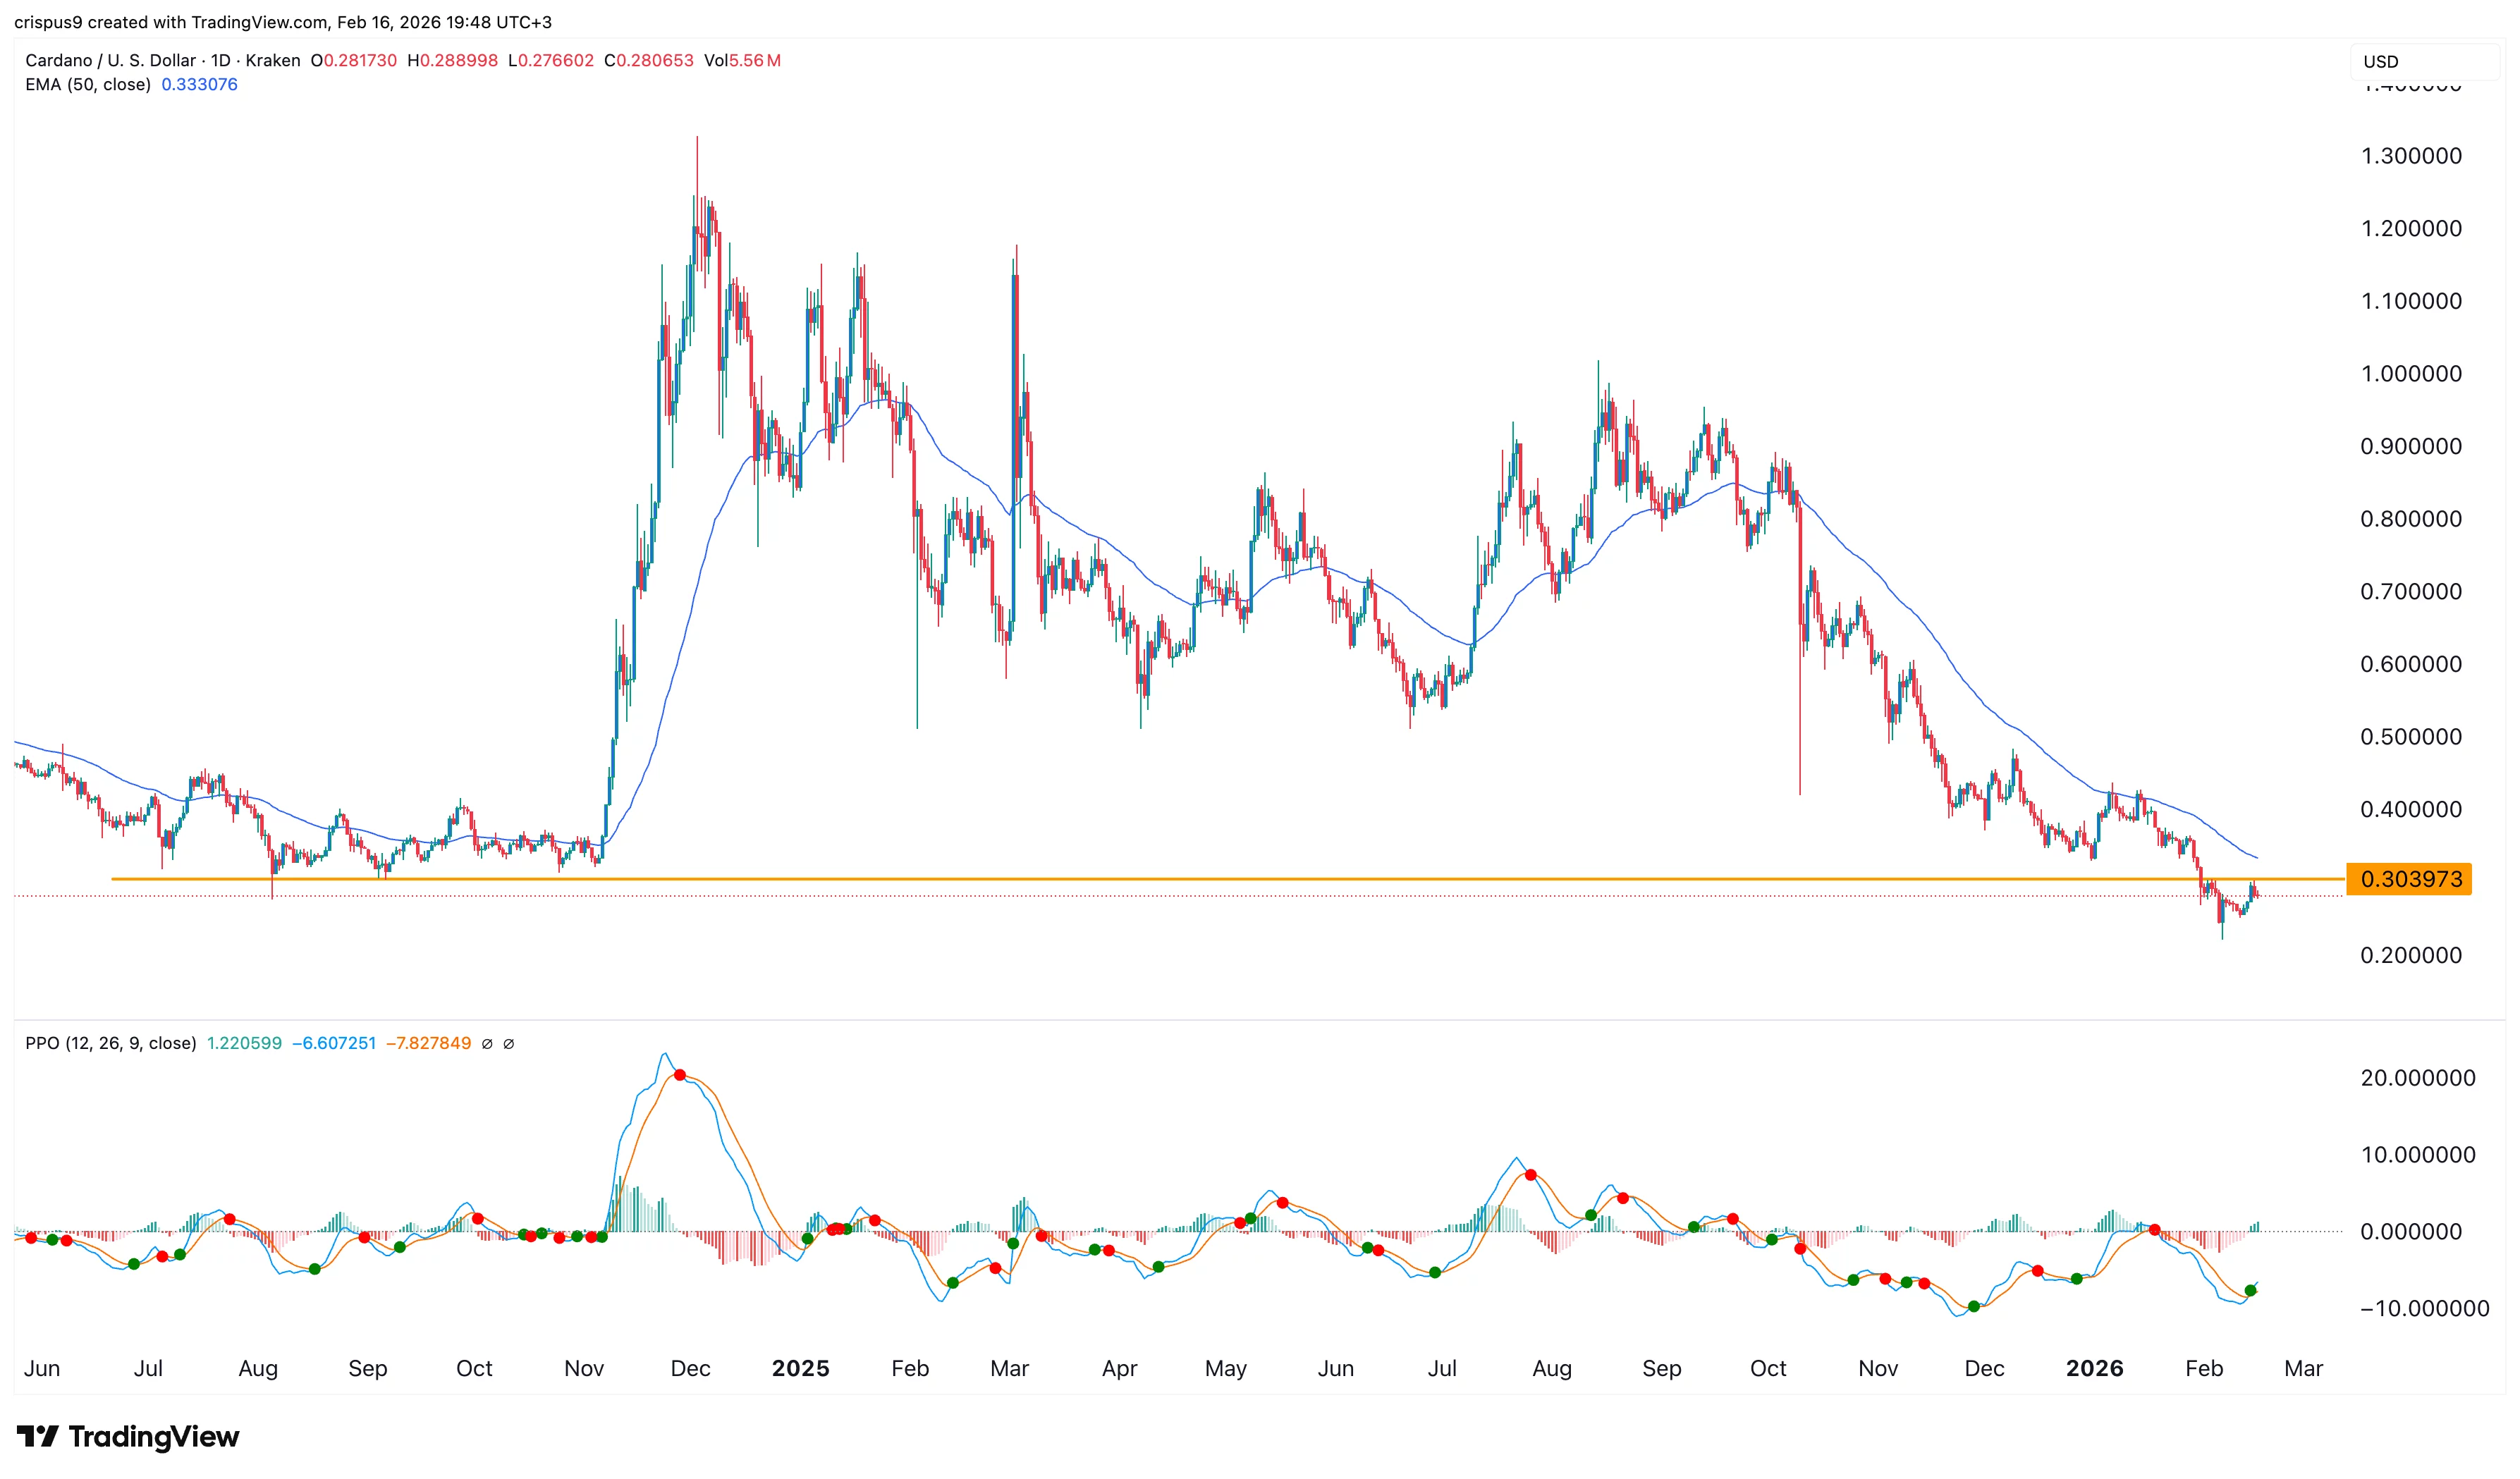
The daily timeframe chart shows that ADA price has been in a strong downward trend in the past few months, a move that has cost investors billions of dollars, with its market capitalization falling to over $10 billion.
Cardano has moved below the important support level at $0.3040, its lowest level in July and September 2024. It also remains below all moving averages, while the Percentage Price Oscillator remains below the zero line.
Therefore, the most likely Cardano price prediction is bearish, with the initial target being the year-to-date low of $0.2255. A drop below that level will indicate further downside toward the key support level at $0.200.

Crypto World
Algorand Breakout Gains Attention as Swiss Bank Post Finance Enables Direct ALGO Trading

TLDR:
- ALGO breaks key resistance near $0.12, signaling a shift from a prolonged bearish trend toward recovery
- Falling wedge breakout and MACD crossover indicate strengthening bullish momentum in the short term
- PostFinance enables direct ALGO trading, expanding access through regulated banking infrastructure
- Price stability above $0.12 remains crucial to sustain momentum and avoid a return to prior demand zones
Algorand’s native token ALGO is gaining renewed attention after a technical breakout coincided with increased institutional access.
Recent market structure shifts and banking integration have drawn focus to its evolving position within the broader crypto landscape.
Technical Structure Signals Momentum Shift
A recent tweet from market analyst Lucky @LLuciano_BTC outlined a notable shift in ALGO/USDT price action. The chart shows a move from a prolonged downtrend into a potential bullish phase. Over several months, price action followed a descending channel, marked by consistent lower highs and lower lows.
However, the structure began tightening into a falling wedge formation. This pattern often signals reduced selling pressure and possible reversal conditions.
As the wedge approached its apex, volatility declined, suggesting seller exhaustion. Price then broke above both the descending resistance trendline and the horizontal level near 0.12 $.
The breakout placed ALGO around 0.1213 $, marking a structural shift. The analysis also identified a demand zone between 0.0794 and 0.10$.
This zone held firmly during repeated tests, pointing to accumulation behavior. As a result, the breakout gained further technical backing.
Additional indicators support this shift. Bollinger Bands showed prior compression followed by expansion, often linked with trend transitions.
At the same time, the MACD indicator confirmed a bullish crossover, with momentum turning positive. These signals align with the observed breakout and suggest continued upward attempts if support levels hold.
Short-term resistance levels remain between 0.14$ and 0.16 $, while broader targets extend toward 0.20 and higher.
A projected move based on the wedge pattern places a potential upper range near 0.3360$. Still, price stability above the 0.12 level remains critical for continuation.
Banking Integration Expands Market Access
Alongside technical developments, adoption news has also emerged. A tweet from Collide @We_R_Crypto reported that Algorand is now available for direct trading through PostFinance.
This marks the first time a systemically important Swiss bank has enabled direct ALGO access from customer accounts.
This development reflects ongoing efforts to integrate digital assets into traditional financial systems. Customers of PostFinance can now buy and sell ALGO without relying on external crypto exchanges. As a result, access becomes more streamlined for users already within the banking network.
Moreover, regulatory clarity in Switzerland continues to support such integrations. The country has maintained a structured approach toward digital assets, allowing banks to expand crypto offerings within defined frameworks. This environment has encouraged institutions to explore additional blockchain-based services.
The integration also aligns with broader trends in real-world asset adoption and blockchain utility. While market participants continue to assess long-term outcomes, increased accessibility through established financial institutions remains a notable step.
At the same time, market conditions still require caution. Price action near upper Bollinger levels suggests possible short-term cooling.
A pullback toward the 0.115$–0.11$ range could occur before further movement. Maintaining higher lows will be important for sustaining upward structure.
Overall, ALGO’s recent price movement and institutional access update present two parallel developments. One reflects shifting market sentiment through technical patterns, while the other shows expanding availability through regulated channels.

TLDR:
- Viral post claims a gold price crash by comparing current charts with the 2011 market cycle
- Historical data shows gold’s 2011 decline unfolded over years, not within a few days
- Current gold trend still shows higher highs and higher lows, keeping bullish structure intact
- Traders focus on macro factors like central bank demand and global uncertainty for direction
The gold price crash narrative gained traction after a viral post claimed history is repeating from 2011. The post triggered debate across markets, as traders assessed whether current price action signals a major reversal or continued strength.
Viral Chart Comparison Raises Questions
A widely shared tweet by a Tracer claimed that gold is repeating its 2011 cycle. The post warned of a sharp drop and referenced a past rally followed by a prolonged decline. It used strong wording to suggest that current price action mirrors a previous market top.
The tweet compared two charts labeled “Gold 2011” and “Gold 2026.” The 2011 chart showed a strong rally into a peak near $1,900 per ounce.
After that, gold entered a correction phase that lasted several years. Historical data shows the decline unfolded gradually between 2011 and 2015, not within days.
The 2026 chart shows a strong uptrend with large bullish candles. A recent pullback appears, yet the overall trend structure remains intact. The post suggested both charts show the same pattern, but the structures differ on closer inspection.
Market participants continue to watch for confirmation signals. A lower high after a peak and a breakdown in trend structure would support a bearish setup. These elements have not fully appeared in the current market.
Market Structure and Macro Factors Remain Key
Traders continue to track price structure to determine direction. A sustained uptrend forms through higher highs and higher lows. Gold still follows that structure, which keeps the broader trend intact for now.
At the same time, macro conditions differ from those seen in 2011. During that period, the global economy showed signs of recovery after the financial crisis. Monetary policy also shifted, which reduced demand for safe-haven assets.
In contrast, current conditions show elevated global debt and continued central bank gold purchases. Ongoing geopolitical tensions also support demand for gold. These factors shape a different environment compared to the earlier cycle.
Traders also monitor indicators such as support levels, trading volume, and momentum signals like RSI divergence. These tools provide clearer direction based on market behavior rather than comparisons alone.
The viral post used phrases designed to attract attention, including claims of limited awareness and urgent warnings. Such messaging often appears in market discussions but does not replace data-driven analysis.
AI firm Anthropic forms an employee-funded PAC while facing questions over political balance and a growing dispute with the Pentagon over AI use.
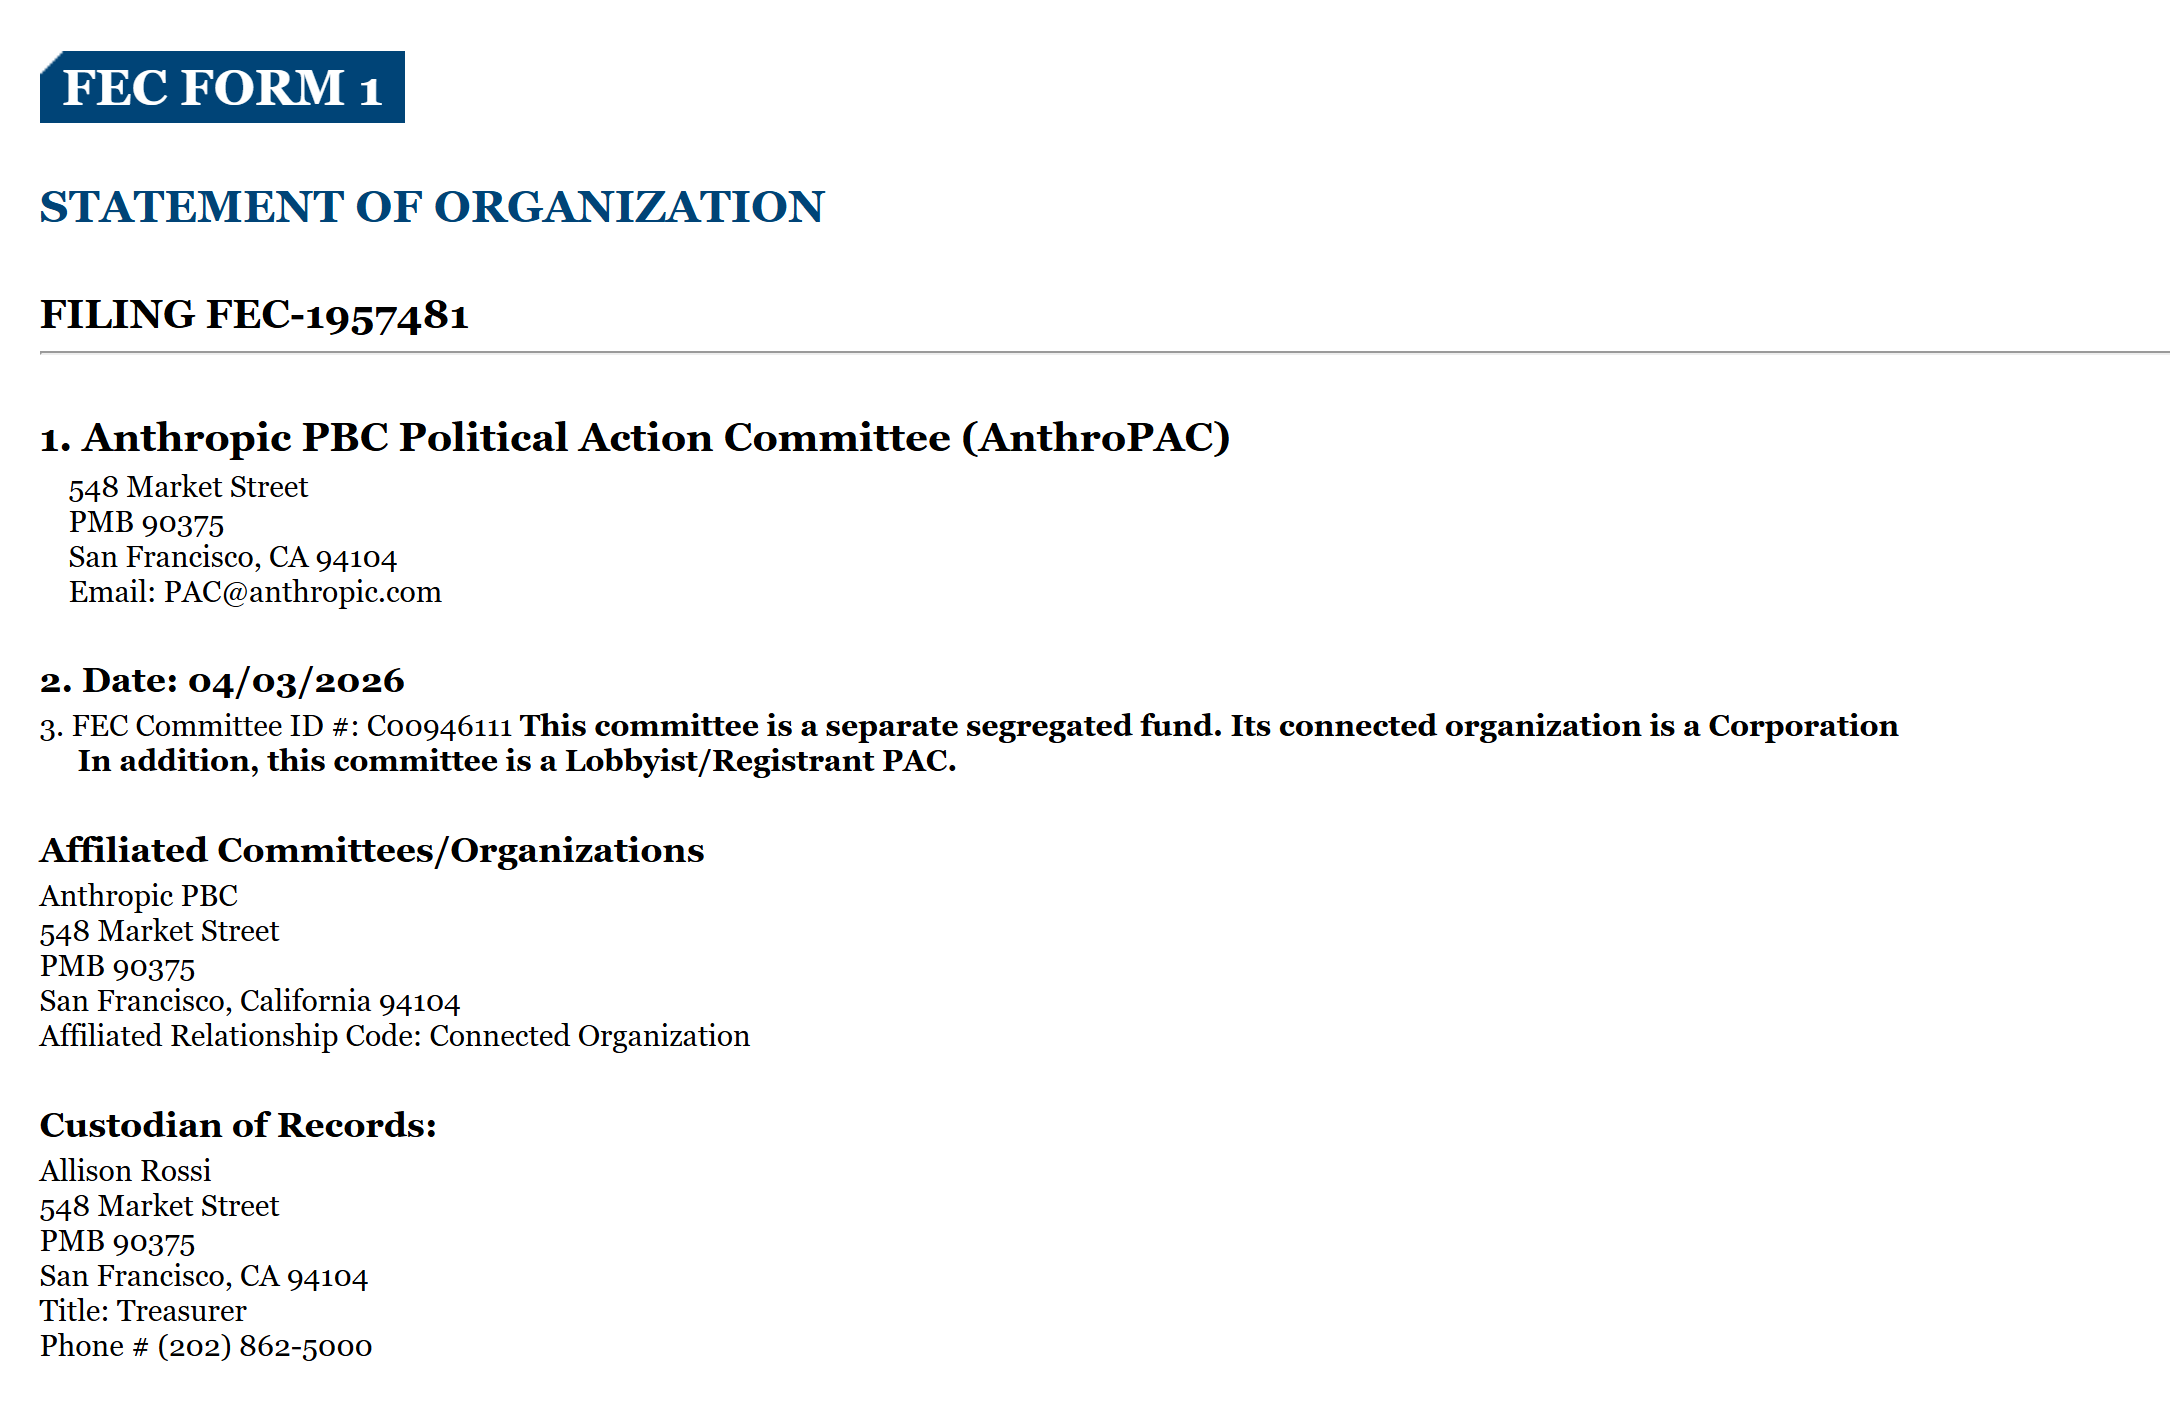
Artificial intelligence firm Anthropic has launched a corporate political action committee (PAC), entering election financing as debates over AI policy intensify in Washington.
The company filed a statement of organization with the Federal Election Commission on Friday to establish “AnthroPAC,” an employee-funded PAC that will collect voluntary contributions from staff. The filing lists Anthropic as the “connected organization,” with the committee structured as a “separate segregated fund” and registered as a lobbyist-affiliated PAC.
Under US law, individual contributions are capped at $5,000 per election cycle per candidate and must be disclosed through public filings.

Anthropic said the PAC is expected to support candidates from both major parties. However, some figures have questioned whether the effort will remain politically balanced.
Related: CFTC Chair Selig says blockchain could help verify AI-generated content
Anthropic clashes with Pentagon over AI use in weapons
The move comes as Anthropic faces mounting friction with the Pentagon over the use of its AI systems. In February, the Defense Department designated the firm a supply chain risk after it opposed the use of its technology in fully autonomous weapons and mass surveillance.
Anthropic has challenged that designation in court, arguing it reflects retaliation against what it described as a protected viewpoint. A federal judge in California has temporarily blocked the measure and paused broader restrictions tied to the dispute.
The company has already been active in political funding this cycle, including a $20 million contribution to Public First Action, a group focused on advancing AI safety efforts.
Related: David Sacks’ 130-day term as Trump’s crypto and AI czar has ended
Google backs $5B Texas data center for Anthropic
As Cointelegraph reported, Google is preparing to support a multibillion-dollar data center project in Texas leased to Anthropic, as demand for AI infrastructure accelerates.
The project, operated by Nexus Data Centers, could exceed $5 billion in its initial phase, with Google expected to provide construction loans while banks compete to arrange additional financing.
Magazine: Bitcoin may take 7 years to upgrade to post-quantum — BIP-360 co-author
TLDR:
- Hedge funds sold global equities fastest in 10 years, with shorts dominating longs 7.6 to 1.0.
- March 2026 marks the fourth consecutive month of net selling, mirroring Feb–May 2025 trends.
- 76% of sales concentrated in ETFs and indexes, with US large-cap ETFs rising +17.2% in shorts.
- Industrials, Financials, and Technology led single-stock sales, while Energy and Healthcare saw buying.
Hedge funds accelerated bearish positions across global equities in March 2026, marking one of the most aggressive selling phases in a decade.
Data shows short sales sharply exceeded long positions, reflecting a broad shift in institutional market positioning.
Hedge Funds Intensify Short Positions Across Global Markets
Recent data shared by The Kobeissi Letter shows hedge funds sold global equities at the fastest pace in ten years. Short positions outpaced long purchases by a ratio of 7.6 to 1.0 during March. This marked the fourth consecutive month of net selling activity.
The selling trend closely mirrors the February to May 2025 period, when markets also faced sustained pressure. This pattern suggests a continued reduction in equity exposure among large institutional players. The activity was not evenly distributed across assets.
Approximately 76% of total sales were concentrated in index and ETF products. US-listed ETF short positions rose by 17.2%, driven largely by large-cap equity funds. This indicates a broad-based strategy rather than isolated stock-specific trades.
Meanwhile, single-stock selling accounted for only about 24% of total flows. The most affected sectors included Industrials, Financials, and Technology. These sectors faced consistent selling pressure across global markets.
In contrast, Energy, Healthcare, and Consumer Staples recorded net buying activity. These sectors often attract defensive positioning during uncertain market conditions. The divergence highlights a shift toward perceived stability within portfolios.
The Kobeissi Letter also noted rising risks tied to the current positioning. Heavy short exposure increases the likelihood of sharp reversals if market sentiment changes quickly.
Extreme Selling Levels Reflect Broader Market Positioning Shift
The accompanying chart titled “Prime Book: Global Equities” provides a long-term view of hedge fund activity. It tracks monthly net trading flows from 2011 through early 2026 using a Z-score metric. This measure shows how extreme buying or selling is compared to historical averages.
March 2026 recorded a reading near -2.5 on the Z-score scale. This places it among the most aggressive selling months in the past fifteen years. Most historical readings typically remain within a range of plus or minus two.
Earlier periods of extreme selling occurred in 2013 and 2025. These moments often align with broader market stress or shifting macro conditions. The current reading falls within that same range of elevated activity.
The chart also shows cycles of accumulation and distribution over time. Periods like 2016 to 2017 and 2019 reflected steady net buying. Those phases coincided with stronger market sentiment and increased risk appetite.
In contrast, extended selling phases appeared from 2011 to 2013 and again from 2025 to 2026. These periods suggest a cautious stance among institutional investors. The ongoing trend indicates that similar behavior is unfolding now.
Sustained negative flows often lead to heightened market volatility. When combined with elevated short interest, the environment becomes more reactive to sudden price movements. This setup increases the chance of rapid shifts in positioning.
The data suggest that institutional strategies are currently aligned toward risk reduction. However, concentrated short exposure also creates conditions where sharp rebounds can occur. This dynamic keeps markets sensitive to unexpected catalysts.
Key Points
- Despite years of government restrictions, millions of Iranians continue using Telegram through VPN technology
- Pavel Durov, Telegram’s co-founder, reports that approximately 50 million users in both Iran and Russia rely on VPNs to bypass blocks
- A complete internet shutdown was enacted across Iran in January 2026 amid escalating tensions with Israel and the United States
- Citizens have turned to alternative connectivity methods including Starlink satellite internet and BitChat, a mesh messaging platform operating via Bluetooth
- During Nepal’s 2025 social media restrictions, BitChat recorded 48,000 downloads before protesters successfully overthrew the government
Years after implementing a nationwide prohibition on Telegram, Iran’s censorship strategy has spectacularly failed to achieve its objectives.
This assessment comes directly from Telegram co-founder Pavel Durov, who revealed on Friday that millions of Iranian citizens continue accessing the messaging platform by leveraging virtual private network technology.
VPN services function by redirecting internet data through international servers, effectively masking users’ actual geographic locations and enabling them to circumvent regional blocking measures.
According to Durov, Tehran’s strategy aimed to migrate the population toward government-sanctioned messaging platforms that authorities could easily surveil. The outcome proved to be the exact opposite—a widespread embrace of privacy-enhancing technologies.
“The government hoped for mass adoption of its surveillance messaging apps, but got mass adoption of VPNs instead,” Durov stated.
His estimates place Iran’s VPN user base at approximately 50 million individuals. A comparable number of Russian citizens are employing identical circumvention methods.
Complete Network Shutdown Across Iran
The digital landscape in Iran deteriorated further in January 2026 when authorities implemented a comprehensive internet shutdown. This drastic measure coincides with intensifying regional hostilities involving Israel, the United States, and Iran, with the blackout continuing indefinitely.
Despite these severe restrictions, portions of the population maintain internet connectivity through alternative channels. One prominent workaround involves Starlink, the orbital internet service operated by SpaceX. While Iranian authorities have officially prohibited Starlink usage, enforcement remains incomplete.
Another emerging solution is BitChat, an innovative application that operates independently of traditional internet infrastructure. The platform establishes mesh networks through Bluetooth connections among proximate devices. Each smartphone functions as a node, transmitting messages to other BitChat-enabled phones within signal range.
This architecture allows BitChat to maintain functionality even when conventional internet services and satellite connections face complete disruption.
BitChat Emerges as Protest Communication Tool
BitChat has previously demonstrated its utility during government-imposed internet shutdowns.
When Nepal implemented social media restrictions in September 2025 amid widespread demonstrations, BitChat experienced a surge exceeding 48,000 installations within Nepal during that week. Protesters successfully removed the Nepali government from power during the same month.
Madagascar witnessed a comparable increase in BitChat adoption during concurrent protest movements.
Durov characterized this technological shift as digital defiance, referring to what he described as “50 million members of the digital resistance in Iran.”
The comprehensive internet blackout initiated by Iranian authorities in January 2026 remained active at the time of Durov’s Friday statement.
TLDR
- Kwasi Kwarteng’s tenure as UK Chancellor lasted only 38 days in 2022 when his emergency budget caused gilt market collapse and pension fund turmoil
- He acknowledges the emergency budget was “very, very rushed,” implemented merely two weeks into his tenure
- Kwarteng cautions that the UK faces a dangerous fiscal cycle where government spending outpaces revenue and tax increases stifle economic expansion
- He condemns short-term thinking in both political and financial spheres, noting the UK lags behind cities like Paris in digital asset adoption
- He now serves as executive chairman of Stack BTC, a British bitcoin treasury firm holding 31 BTC, where Reform UK leader Nigel Farage owns 6%
Kwasi Kwarteng’s name appears in the record books for all the wrong reasons. His 38-day stint as UK Chancellor during September 2022 ranks among the briefest in British history. Today, he’s re-emerged in the public sphere with a dramatically different focus: cryptocurrency and his critique of conventional financial systems.
Kwarteng assumed his position on September 6, 2022. Within 48 hours, Queen Elizabeth II passed away. This tragic event condensed his timeline considerably. His economic team subsequently rushed through an ambitious emergency budget in a mere fortnight after assuming office.
“The mini budget was literally two weeks after we took office, it was just very, very rushed business,” Kwarteng acknowledged during a recent CoinDesk interview.
The consequences arrived swiftly and severely. British government bond yields surged dramatically. Sterling plummeted. The turmoil revealed critical vulnerabilities within the nation’s pension infrastructure, particularly affecting Liability-Driven Investment strategies that buckled under market stress.
Kwarteng maintains his policy objectives were sound. However, he doesn’t dispute that implementation was deeply flawed.
UK Trapped in a Fiscal Doom Loop
He’s currently sounding alarms that the UK confronts challenges far greater than a single mishandled budget. According to Kwarteng, Britain finds itself caught in a destructive fiscal “doom loop.”
Government expenditure consistently exceeds tax collection. To bridge this deficit, authorities increase taxation. Yet elevated tax burdens dampen economic activity, suppress growth, and paradoxically reduce total revenue. The vicious cycle continues.
“You’re spending more money than you can raise in taxation,” he explained, emphasizing that increasing taxes “kill incentives in the economy.”
He also criticized the mindset pervading politics and finance. “Everything’s quarterly driven, people are either euphoric or freaking out,” he observed. He contends that sound decision-making demands extended time horizons.
Kwarteng highlighted the UK’s sluggish approach toward digital assets. Throughout his Treasury service, he noted that civil servants recognized bitcoin but dismissed it as marginal. He drew comparisons with Paris, which he characterized as “quite forward leaning on digital assets.”
He also rebutted remarks from former Prime Minister Boris Johnson, who labeled bitcoin a “Ponzi.” Kwarteng advocated for greater receptiveness toward emerging monetary systems.
Stack BTC and the Political Angle
Kwarteng currently chairs Stack BTC as executive chairman, a publicly-traded British bitcoin treasury enterprise. The organization presently maintains 31 bitcoin in its reserves.
The venture has garnered political notice. Reform UK party leader Nigel Farage has acquired a 6% ownership position in Stack BTC.
Stack BTC operates under ticker symbol STAK. It represents part of an expanding cohort of British enterprises developing bitcoin treasury frameworks comparable to American counterparts.
Kwarteng’s transition into cryptocurrency aligns with his overarching thesis that myopic political decision-making has compromised the UK’s position, and that more resilient, long-duration monetary instruments might provide enhanced stability.
Stack BTC’s holdings currently stand at 31 BTC, with Farage’s ownership interest confirmed through the company’s latest regulatory filings.
Key Highlights
- Approximately 1.40 million SOL tokens—worth roughly $110 million—transferred to exchanges within a 72-hour period, signaling potential sell-side pressure.
- A bear flag pattern breakdown on daily charts has invalidated a critical market structure level near $85.
- Immediate support is established at $77, while a failure at this zone could expose the $66–$70 range.
- The 4-hour chart shows a bearish SMA crossover, with the 20-period moving average slipping beneath the 50-period line.
- Meanwhile, Solana’s ecosystem growth remains robust, with real-world asset tokenization crossing $2 billion and SoFi deploying enterprise banking infrastructure on the blockchain.
Solana (SOL) is experiencing heightened downside risk following substantial token movements to centralized trading venues, compounding an already fragile technical landscape. Currently hovering between $79 and $81, the cryptocurrency has declined approximately 2.95% over the last seven days.
Blockchain analytics specialist Ali Martinez identified approximately 1.40 million SOL tokens migrating to exchange wallets during a three-day span. This transfer represents roughly $110 million in value moving onto trading platforms. Historically, elevated exchange inflows correlate with imminent selling activity as holders position to liquidate assets.
1.40 million Solana $SOL, worth approximately $110 million, were moved to exchanges in the last 72 hours. pic.twitter.com/YnYwLAbcO5
— Ali Charts (@alicharts) April 4, 2026
Technical analysis reinforces the bearish narrative. Analyst Crypto_Scient observed a confirmed breakdown from a bear flag formation on the daily timeframe, with price action violating the pivotal market structure transition level at $85. This threshold had previously delineated bullish from bearish control, and its breach suggests vulnerability to additional downside pressure.
Further deterioration appears on the 4-hour chart, where a bearish moving average crossover has materialized—the SMA-20 crossing beneath the SMA-50. This configuration typically precedes extended declines. Trading activity now occurs below a significant supply zone, indicating market acceptance of reduced valuation.
Critical Support Zones Under Scrutiny
Near-term demand has emerged around the $77 level, which has functioned as temporary support during recent trading sessions. Should this floor collapse, market observers anticipate a test of secondary support spanning $63 to $67.
Trader Marcus Corvinus highlighted that the $92–$95 region previously served as a robust defense zone, but concentrated selling at those levels propelled SOL into the current $75–$78 range. He characterized this area as pivotal, where price behavior will likely dictate the subsequent directional move. A breakdown could accelerate losses, whereas a successful defense might trigger a violent short covering rally.
$SOL PRESSURE IS REAL
Trendline lost.
Structure starting to crack.That $92–$95 zone held strong.
Sellers stepped in with intent.Now price sits on $75–$78.
Not just support… a real decision zone.If buyers defend it, expect a sharp reaction.
Quick bounce. Short squeeze… pic.twitter.com/i3V1uj7wOa— Marcus Corvinus (@CryptoBull009) April 3, 2026
The primary support band is positioned between $66 and $70, consistent with projections from Crypto_Scient. Any recovery attempt toward $84–$89 may constitute merely a retest of broken structure rather than a genuine trend reversal.
Fundamental Developments Persist
Notwithstanding price deterioration, Solana’s infrastructure continues attracting institutional adoption. SoFi recently unveiled an enterprise-grade banking platform constructed on Solana’s blockchain, facilitating both fiat currency and stablecoin settlement. The network’s real-world asset tokenization volume has exceeded $2 billion, with major payment processors leveraging Solana for stablecoin transaction processing.
Analyst Crypto Patel emphasized that Solana has received commodity classification from regulatory authorities, establishing it within a favorable compliance framework. The digital asset currently trades approximately 77% beneath its historic peak valuation.
$SOL Just Got Classified As A Commodity And It’s Still -77% From ATH 😏
That’s Like Watching #SOLANA Drop To $8 In 2022 And Thinking It Was Dead…
Except This Time It Already Proved It Can Do A 2,194% Rally From The Bottom 😂Fibonacci Golden Zone Holding Perfectly On The 2W… pic.twitter.com/kZ7lIk2vZL
— Crypto Patel (@CryptoPatel) April 3, 2026
Market commentator RoccobullboTTom identified sustained long-term accumulation occurring between $75 and $85. A decisive reclaim above $100 would transform the momentum profile, establishing $120 and $125 as subsequent resistance objectives.
A $285 million security breach affecting Drift Protocol and impacting 20 projects has contributed to near-term caution across the ecosystem.
Daily trading volume maintains robust levels exceeding $1.68 billion, demonstrating continued market engagement despite downward price movement.
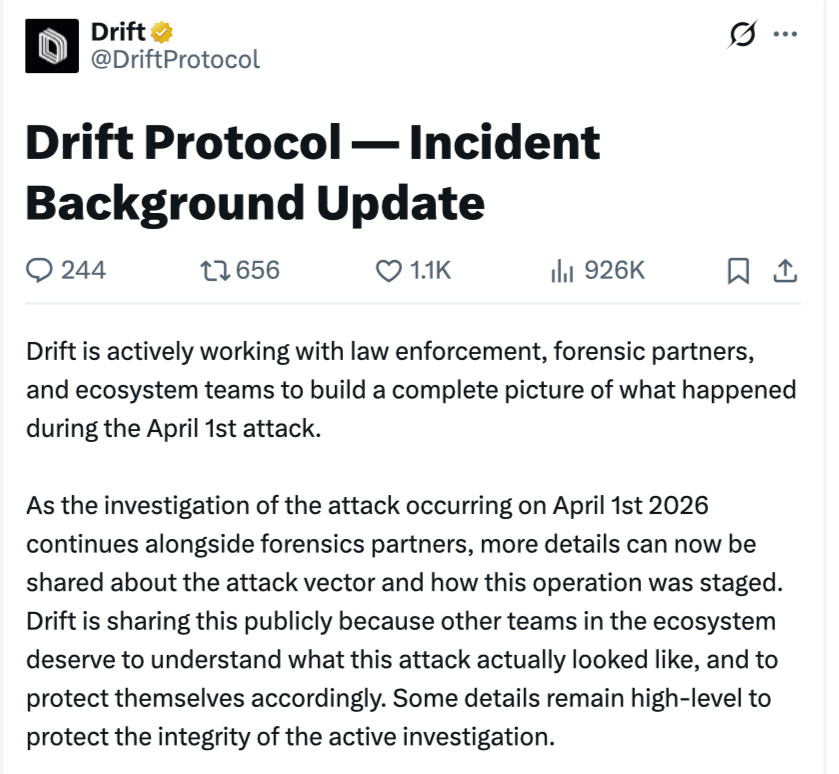
Drift Protocol, a decentralized cryptocurrency exchange (DEX), says the recent exploit against the platform was a six-month-long, highly coordinated attack.
“The preliminary investigation shows that Drift experienced a structured intelligence operation requiring organizational backing, significant resources, and months of deliberate preparation,” Drift said in an X post on Saturday.
The decentralized exchange was exploited on Wednesday, with external estimates putting losses at around $280 million.
It all began at a “major crypto conference”
According to Drift, the attack plan can be traced back to around October 2025, when malicious actors posing as a quantitative trading firm first approached Drift contributors at a “major crypto conference,” claiming to be interested in integrating with the protocol.

The group continued to engage contributors in person at multiple industry events over the following six months. “It is now understood that this appears to be a targeted approach, where individuals from this group continued to deliberately seek out and engage specific Drift contributors,” Drift said.
“They were technically fluent, had verifiable professional backgrounds, and were familiar with how Drift operated,” Drift said.
After gaining trust and access to Drift Protocol over six months, they used shared malicious links and tools to compromise contributors’ devices, execute the exploit, and then wiped their presence immediately after the attack.
The incident serves as a reminder for crypto industry participants to remain cautious and skeptical, even during in-person interactions, as crypto conferences can be prime targets for sophisticated threat actors.
Drift flags a high probability of a Radiant Capital hack link
Drift said, with “medium-high confidence,” that the exploit was carried out by the same actors behind the October 2024 Radiant Capital hack.
In December 2024, Radiant Capital said the exploit was carried out through malware sent via Telegram from a North Korea-aligned hacker posing as an ex-contractor.

“This ZIP file, when shared for feedback among other developers, ultimately delivered malware that facilitated the subsequent intrusion,” Radiant Capital said.
Drift said it is “important to note” that the individuals who appeared in person “were not North Korean nationals.”
Related: Naoris launches post-quantum blockchain as quantum security risks gain attention
“DPRK threat actors operating at this level are known to deploy third-party intermediaries to conduct face-to-face relationship-building,” Drift said.
Drift said that it is working with law enforcement and others in the crypto industry to “build a complete picture of what happened during the April 1st attack.”
Magazine: Bitcoin 85% crashes ‘done,’ CLARITY Act speculation mounts: Hodler’s Digest, Mar. 29 – April 4
Crypto World
Bitcoin Surges Past Gold and S&P 500 Following Major Global Disruptions, Research Reveals
Key Takeaways
- Research from Mercado Bitcoin demonstrates that Bitcoin outperforms both gold and S&P 500 during 60-day periods following significant global disruptions
- Following Trump’s tariff announcement in 2025, Bitcoin surged 24% compared to gold’s 8% gain and S&P 500’s 4% increase
- Throughout the ongoing U.S.-Iran tensions, Bitcoin has climbed 2.2% while gold declined 11% and S&P 500 dropped 4.4%
- Spot Bitcoin ETFs in the United States attracted $1.32 billion during March, contrasting sharply with gold ETFs’ $2.92 billion in withdrawals
- Industry analyst James Seyffart predicts Bitcoin ETFs will ultimately exceed gold ETFs in total assets
Research conducted by Brazilian cryptocurrency platform Mercado Bitcoin reveals that Bitcoin consistently delivers superior performance compared to gold and the S&P 500 index during the two-month periods following significant global disruptions.
The analysis was spearheaded by Rony Szuster, serving as research director at Mercado Bitcoin. His research team examined 60-day performance windows after various economic upheavals and geopolitical conflicts, encompassing events such as the COVID-19 pandemic emergence and U.S. trade policy escalations.
Following the Trump administration’s comprehensive tariff rollout in April 2025, Bitcoin experienced a remarkable 24% appreciation during the subsequent 60 days. Meanwhile, gold managed an 8% increase, and the S&P 500 recorded only a 4% advance during the identical timeframe.
This performance pattern emerged similarly at the onset of the COVID-19 crisis in March 2020. Bitcoin achieved a 21% gain, significantly outpacing both gold and the S&P 500.
Szuster cautioned against premature assessments of Bitcoin’s crisis response. “It’s like watching the first few minutes of a movie and thinking you already know how it ends,” he remarked.
He clarified that market participants frequently liquidate holdings rapidly during crises to secure liquidity, which can temporarily pressure even traditionally defensive assets.
Bitcoin Maintains Positive Momentum Amid Middle East Tensions
This established pattern appears to be repeating during the current U.S.-Iran confrontation. Bitcoin has appreciated approximately 2.2%, advancing from roughly $65,800 to $67,300.
Gold, conventionally regarded as a crisis hedge, has experienced an approximately 11% decline during this period. The S&P 500 has retreated 4.4%, marking its sharpest monthly decline since 2022.
Szuster emphasized that Bitcoin emerged as the top-performing asset throughout the previous decade, notwithstanding its characteristic volatility.
Bitcoin ETFs Capturing Market Share From Gold Funds
ETF specialist James Seyffart indicated during an appearance on the Coin Stories podcast that Bitcoin exchange-traded funds may eventually overtake gold ETFs in aggregate assets under management.
“There are just more use cases of why somebody would put a Bitcoin ETF in a portfolio,” Seyffart explained. He highlighted Bitcoin’s multiple functions including digital gold status, value preservation, portfolio diversification tool, and growth-oriented investment.
“Our view is that Bitcoin ETFs will be larger than gold ETFs,” he stated.
Current investment flow patterns support this evolving market sentiment. Throughout March, gold ETFs domiciled in the United States experienced net redemptions totaling $2.92 billion. During this same interval, U.S. spot Bitcoin ETFs registered net contributions of $1.32 billion.
The premier U.S. gold ETF witnessed a single-day outflow of $3 billion on March 4, representing the largest daily redemption in more than two years.
Both asset classes have declined over the trailing 30-day period. Bitcoin has retreated approximately 8% while gold has fallen around 8.25%, indicating parallel price movements despite divergent ETF activity.
In December 2025, Fidelity Digital Assets analyst Chris Kuiper observed that gold and Bitcoin have historically alternated in their relative performance leadership.

Bitcoin’s social mood has cooled in recent days, with bearish sentiment reaching levels not seen since late February, according to data from Santiment. The crypto analytics firm noted that fear, uncertainty and doubt (FUD) has crept back into Bitcoin discussions across X, Reddit, and other platforms, a shift it describes as a potential precursor to a rebound rather than a sustained selloff.
Santiment’s analysis is drawn from a broad sample of crypto-focused accounts, tracking the ratio of bullish to bearish Bitcoin comments. On Saturday, the metric stood at 0.81 — the lowest reading since February 28 — implying roughly five bears for every four bulls in the social chatter. The firm highlighted a familiar paradox: while the crowd’s sentiment can influence near-term moves, markets often move in the opposite direction of the crowd’s expectations. “A high level of FUD like this is a good sign that things can turn positive sooner rather than later,” Santiment wrote in a Saturday update.
Key takeaways
- Bearish sentiment on Bitcoin, as measured by the bullish/bearish comment ratio, sits at 0.81 (lowest since February 28), suggesting a crowded mood of skepticism.
- Historical patterns indicate that pronounced FUD can coincide with eventual upside, reflecting a contrarian market dynamic.
- Bitcoin trades around $67,100, with about a 5.5% decline over the last 30 days, highlighting a cautious near-term setup.
- The CLARITY Act, a much-watched piece of U.S. crypto legislation, remains a potential catalyst; industry voices say movement toward a Senate markup is approaching.
- Market sentiment remains in “Extreme Fear” territory according to the Crypto Fear & Greed Index, signaling ongoing caution among investors.
Sentiment dynamics and contrarian signals
The latest snapshot from Santiment shows a still-fragile mood among Bitcoin observers. The 0.81 ratio translates into a commentary environment where bearish views outnumber bullish ones, even as the price action continues to define a narrow trading range. Santiment highlighted a simple, yet powerful, investor heuristic: when sentiment shifts sharply to the downside, opportunistic players may prepare for a rebound as sellers exhaust themselves and buyers reenter the market.
Markets typically move in the opposite direction of the crowd’s expectations. A spike in FUD can be a warning sign of a forthcoming turn to the upside, rather than a straightforward continuation of the downtrend.
For Bitcoin holders and traders, such contrarian signals are not new. They reflect a broader reality: sentiment indicators are best read alongside price action and macro catalysts. In recent weeks, the attention has shifted to regulatory developments and the resilience of the broader crypto market as a potential antidote to a purely momentum-driven selloff.
Price frame, FUD, and regulatory tailwinds
Bitcoin’s price sits near $67,100 at the time of writing, according to CoinMarketCap, down about 5.5% over the past 30 days. The move fits a pattern of consolidation after a period of volatility, with traders weighing both micro-market dynamics and macro regulatory signal. The current mood of “Extreme Fear,” as captured by the Crypto Fear & Greed Index with a score of 12, underscores pervasive caution even as on-chain metrics and exchange flows show mixed signals.
Beyond price action, the crypto policy landscape looms large for traders and builders. Santiment pointed to the US CLARITY Act as a potential “what-if” catalyst holding back Bitcoin’s price, noting that the industry is closely watching for legislative progress. The measure seeks to clarify regulatory expectations around digital assets, and a favorable outcome could soften some of the near-term uncertainty that has weighed on investor sentiment.
Industry commentary has echoed that sentiment. Coinbase’s chief legal officer, Paul Grewal, has said the CLARITY Act is “moving toward” a markup hearing in the U.S. Senate Banking Committee, with the potential to advance to a floor vote if senators resolve outstanding debates over stablecoin yields and scheduling. Such legislative steps could tilt the risk-reward calculus for institutions and large holders, potentially contributing to a more constructive price environment if clarity reduces regulatory ambiguity.
As investors parse these developments, it’s important to distinguish what is known from what remains uncertain. The CLARITY Act’s trajectory—whether it moves quickly through committee processes or encounters delays—will shape how market participants price in regulatory risk. At the same time, Bitcoin’s price reaction will depend on a combination of sentiment shifts, technicals, and the pace of any regulatory milestones.
Regulatory watch and market posture
While price remains subdued relative to the latest surges in the sector, the market’s attention to regulatory clarity continues to shape trading strategies. The ongoing dialogue around the CLARITY Act highlights a central tension for Bitcoin and larger crypto markets: the potential to unlock clearer operating guidelines versus the risk of a protracted, contentious legislative process that sustains volatility.
Analysts and traders are also keeping an eye on broader risk dynamics as the year unfolds. The market’s current posture—modest pricing, cautious positioning, and a willingness to wait for policy clarity—reflects a sector that is not immune to macro shocks but is increasingly sensitive to policy signals that could either normalize or disrupt institutional participation.
For readers seeking practical implications, the trend suggests two likely focal points: first, any concrete progress on the CLARITY Act’s markup and floor-vote timeline could lift sentiment and support risk-on activity; second, social sentiment shifts from Extreme Fear toward more constructive levels would likely precede price strength, provided macro conditions remain favorable.
As the regulatory conversation continues to evolve, market participants should monitor not only legislative milestones but also accompanying shifts in social sentiment and price action. Each piece of new information could tilt risk-reward preferences, influencing how portfolios are balanced in the months ahead.
What remains uncertain is the exact pace of regulatory progress and how quickly sentiment pivots in response. Investors should stay alert to updates from policymakers, corporate counsel briefings, and the evolving discourse on stablecoins and yields, all of which could help determine whether Bitcoin breaks from its current mood and resumes a more constructive ride higher.
Readers should watch for upcoming committee hearings and any concrete dates related to markup activity, as well as fresh sentiment readings that might reveal early signs of capitulation or renewed optimism. These developments will likely shape trading behavior and risk strategies as the market inches toward a potentially pivotal moment for the sector.

Bolton College lecturer on helping young people in Ready Riders scheme

Netflix: Three Reasons To Expect An Earnings Beat
Algorand Breakout Gains Attention as Swiss Bank Post Finance Enables Direct ALGO Trading


-

 NewsBeat3 days ago
Steven Gerrard disagrees with Gary Neville over ‘shock’ Chelsea and Arsenal claim | Football
-

 Business2 days ago
No Jackpot Winner and $194 Million Prize Rolls Over
-

 Fashion2 days ago
Weekend Open Thread: Spanx – Corporette.com
-
Entertainment6 days ago
Fans slam 'heartbreaking' Barbie Dream Fest convention debacle with 'cardboard cutout' experience
-

 Crypto World4 days ago
Gold Price Prediction: Worst Month in 17 Years fo Save Haven Rock
-

 Tech6 days ago
The Pixel 10a doesn’t have a camera bump, and it’s great
-
Crypto World5 days ago
Dems press CFTC, ethics board on prediction-market insider trades
-

 Tech6 days ago
Avatar Legends: The Fighting Game comes out in July and it looks pretty slick
-

 Business3 days ago
Login and Checkout Issues Spark Merchant Frustration
-

 Sports11 hours ago
India men’s 4x400m and mixed 4x100m relay teams register big progress | Other Sports News
-

 Tech6 days ago
Apple will hide your email address from apps and websites, but not cops
-

 Sports5 days ago
Tallest college basketball player ever, standing at 7-foot-9, entering transfer portal
-

 Tech5 days ago
EE TV is using AI to help you find something to watch
-

 Politics6 days ago
Should Trump Be Scared Strait?
-

 Tech5 days ago
Flipsnack and the shift toward motion-first business content with living visuals
-

 Tech7 days ago
Elon Musk’s last co-founder reportedly leaves xAI
-

 Fashion6 days ago
The Best Spring Trends of 2026
-

 Tech5 days ago
How to back up your iPhone & iPad to your Mac before something goes wrong
-
Crypto World6 days ago
Bitcoin’s Six-Month Losing Streak: What On-Chain Data Says About the Market’s Next Move
-
Tech5 days ago
Daily Deal: StackSkills Premium Annual Pass
You must be logged in to post a comment Login