
Crypto World
Cardano Price Near Breakout as Selling Hits 6-Month Low
The Cardano price is down nearly 4% over the past 24 hours and remains about 33% lower over the past month. Despite this weakness, several technical and on-chain signals suggest that selling pressure is fading.
The share of ADA supply in profit has dropped by roughly 75% since January, sharply reducing profit-taking incentives. At the same time, a potential reversal pattern is forming on lower time frames. Together, these signals raise a key question: is this Charles Hoskinson-led token preparing for a rebound toward $0.34, or is this just another failed recovery attempt?
Sponsored
Sponsored
Inverse Pattern And Divergence Hint At Buyers Regaining Control
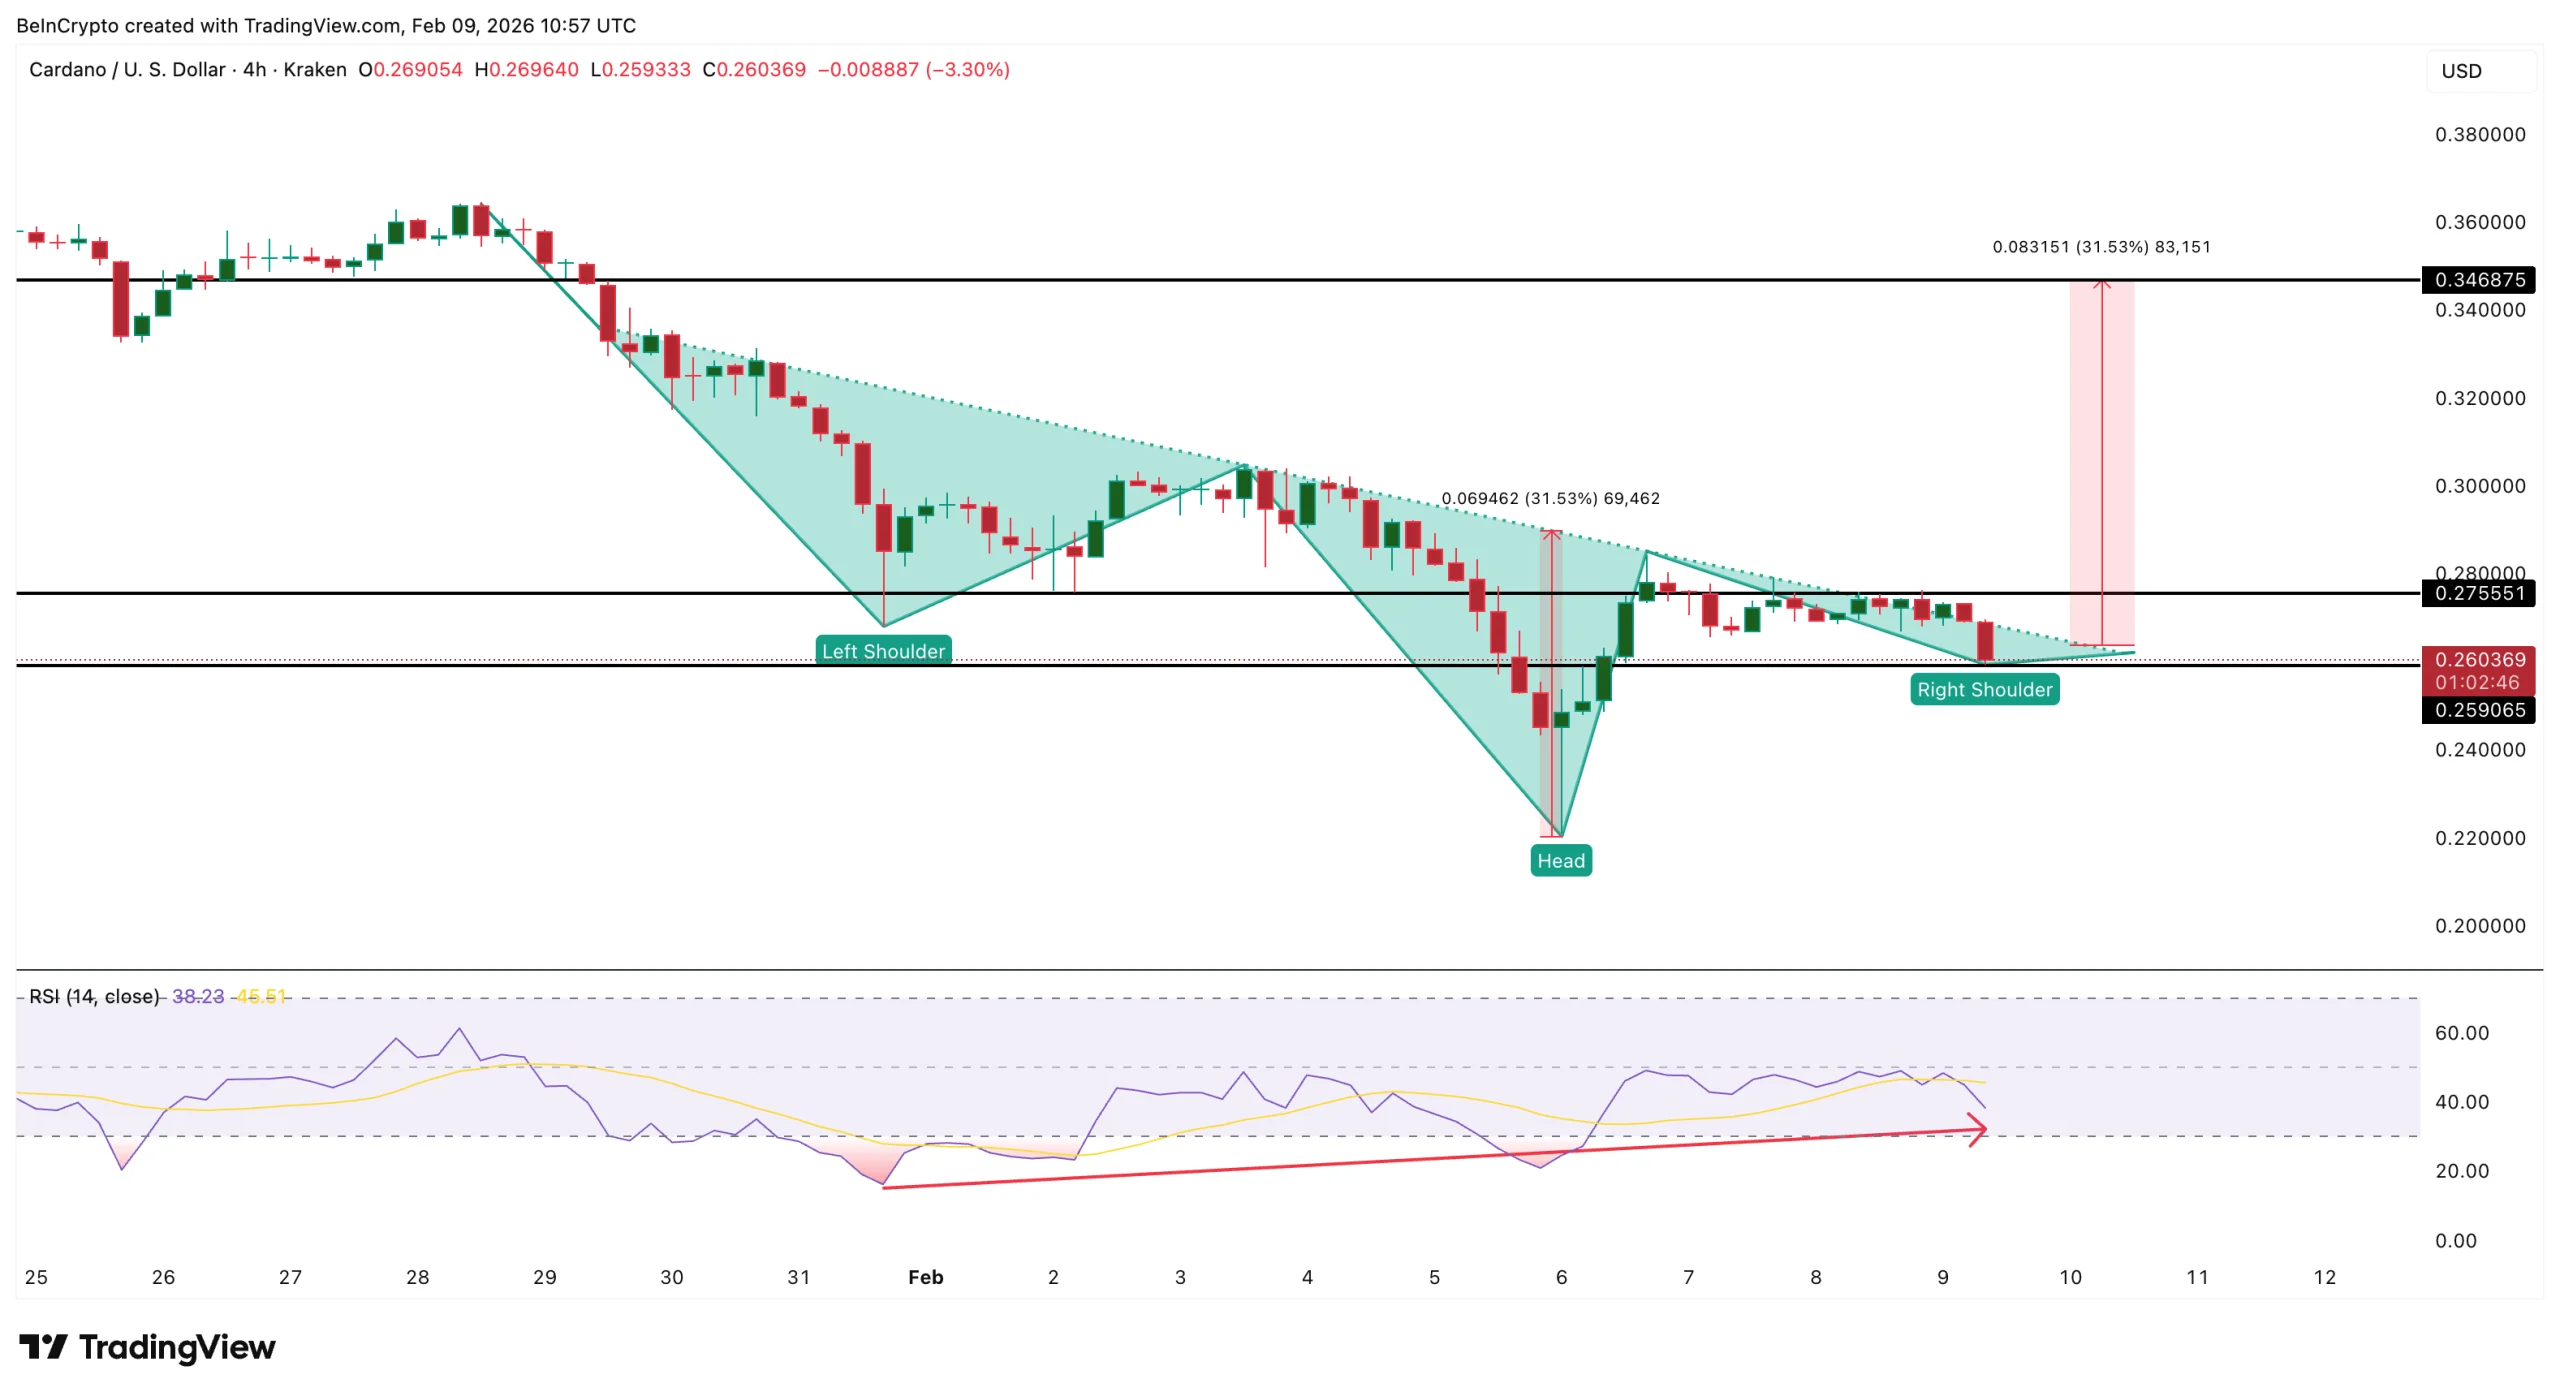
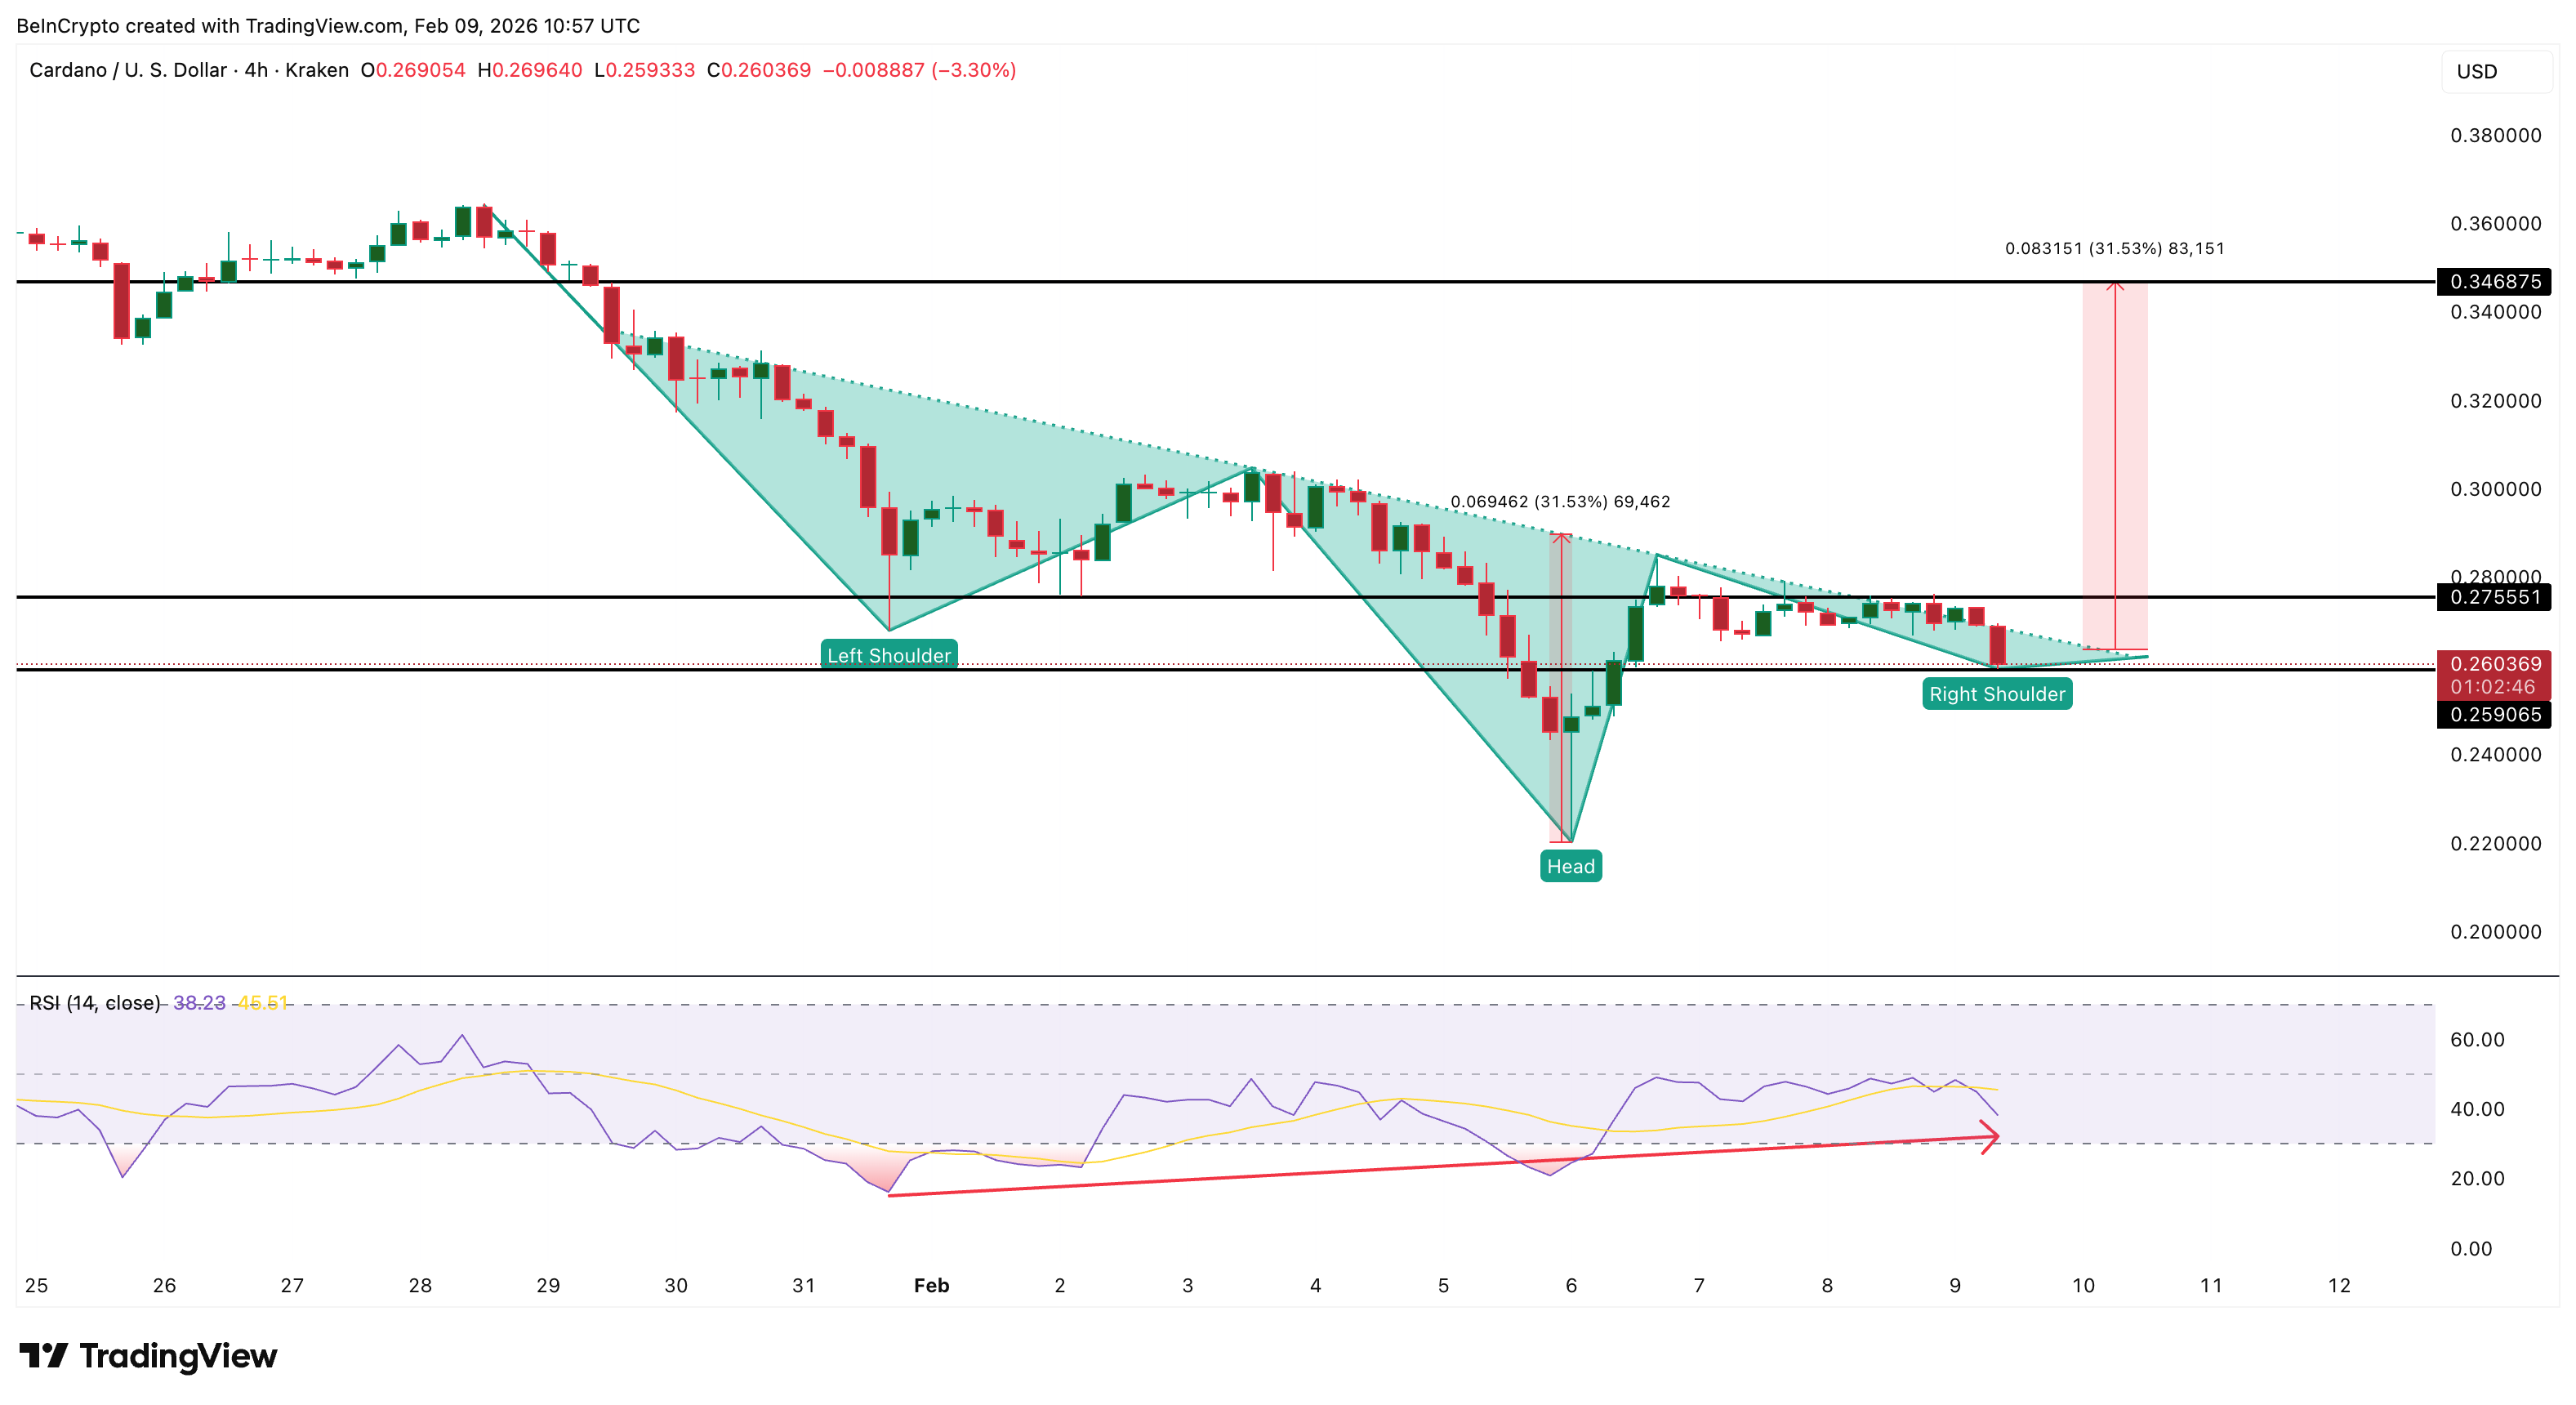
On the 4-hour chart, Cardano is forming an inverse head-and-shoulders pattern. This structure often appears near local bottoms and signals that sellers may be losing control. It consists of a left shoulder, a deeper central low, and a higher right shoulder.
In this case, the neckline is sloping downward. A downward-sloping neckline makes breakouts harder because buyers must push through falling resistance. For this pattern to activate, ADA needs a clear four-hour close above the $0.275–$0.280 zone.
A momentum indicator, the Relative Strength Index (RSI), also supports this early recovery attempt. Between January 31 and February 9, Cardano seems to be printing lower lows on price, while the Relative Strength Index or RSI is printing higher lows. This developing bullish divergence shows that selling pressure is weakening even as price tests new short-term lows.
The divergence signal would confirm if the next ADA price candle forms above $0.259.
Want more token insights like this? Sign up for Editor Harsh Notariya’s Daily Crypto Newsletter here.
In simple terms, sellers are becoming less aggressive. Buyers are slowly stepping in. But this setup only works if demand continues to build. Without follow-through, these patterns usually fail. That brings attention to whether sellers still have strong reasons to exit.
Sponsored
Sponsored
Profit-Taking and Coin Activity Have Collapsed, Reducing Sell Pressure
On-chain data shows that selling incentives have dropped sharply over the past month.
The percentage of total ADA supply in profit has fallen from above 33% in mid-January to about 8% in early February. That represents a decline of roughly 75%. It places profitable supply close to its lowest level in six months.
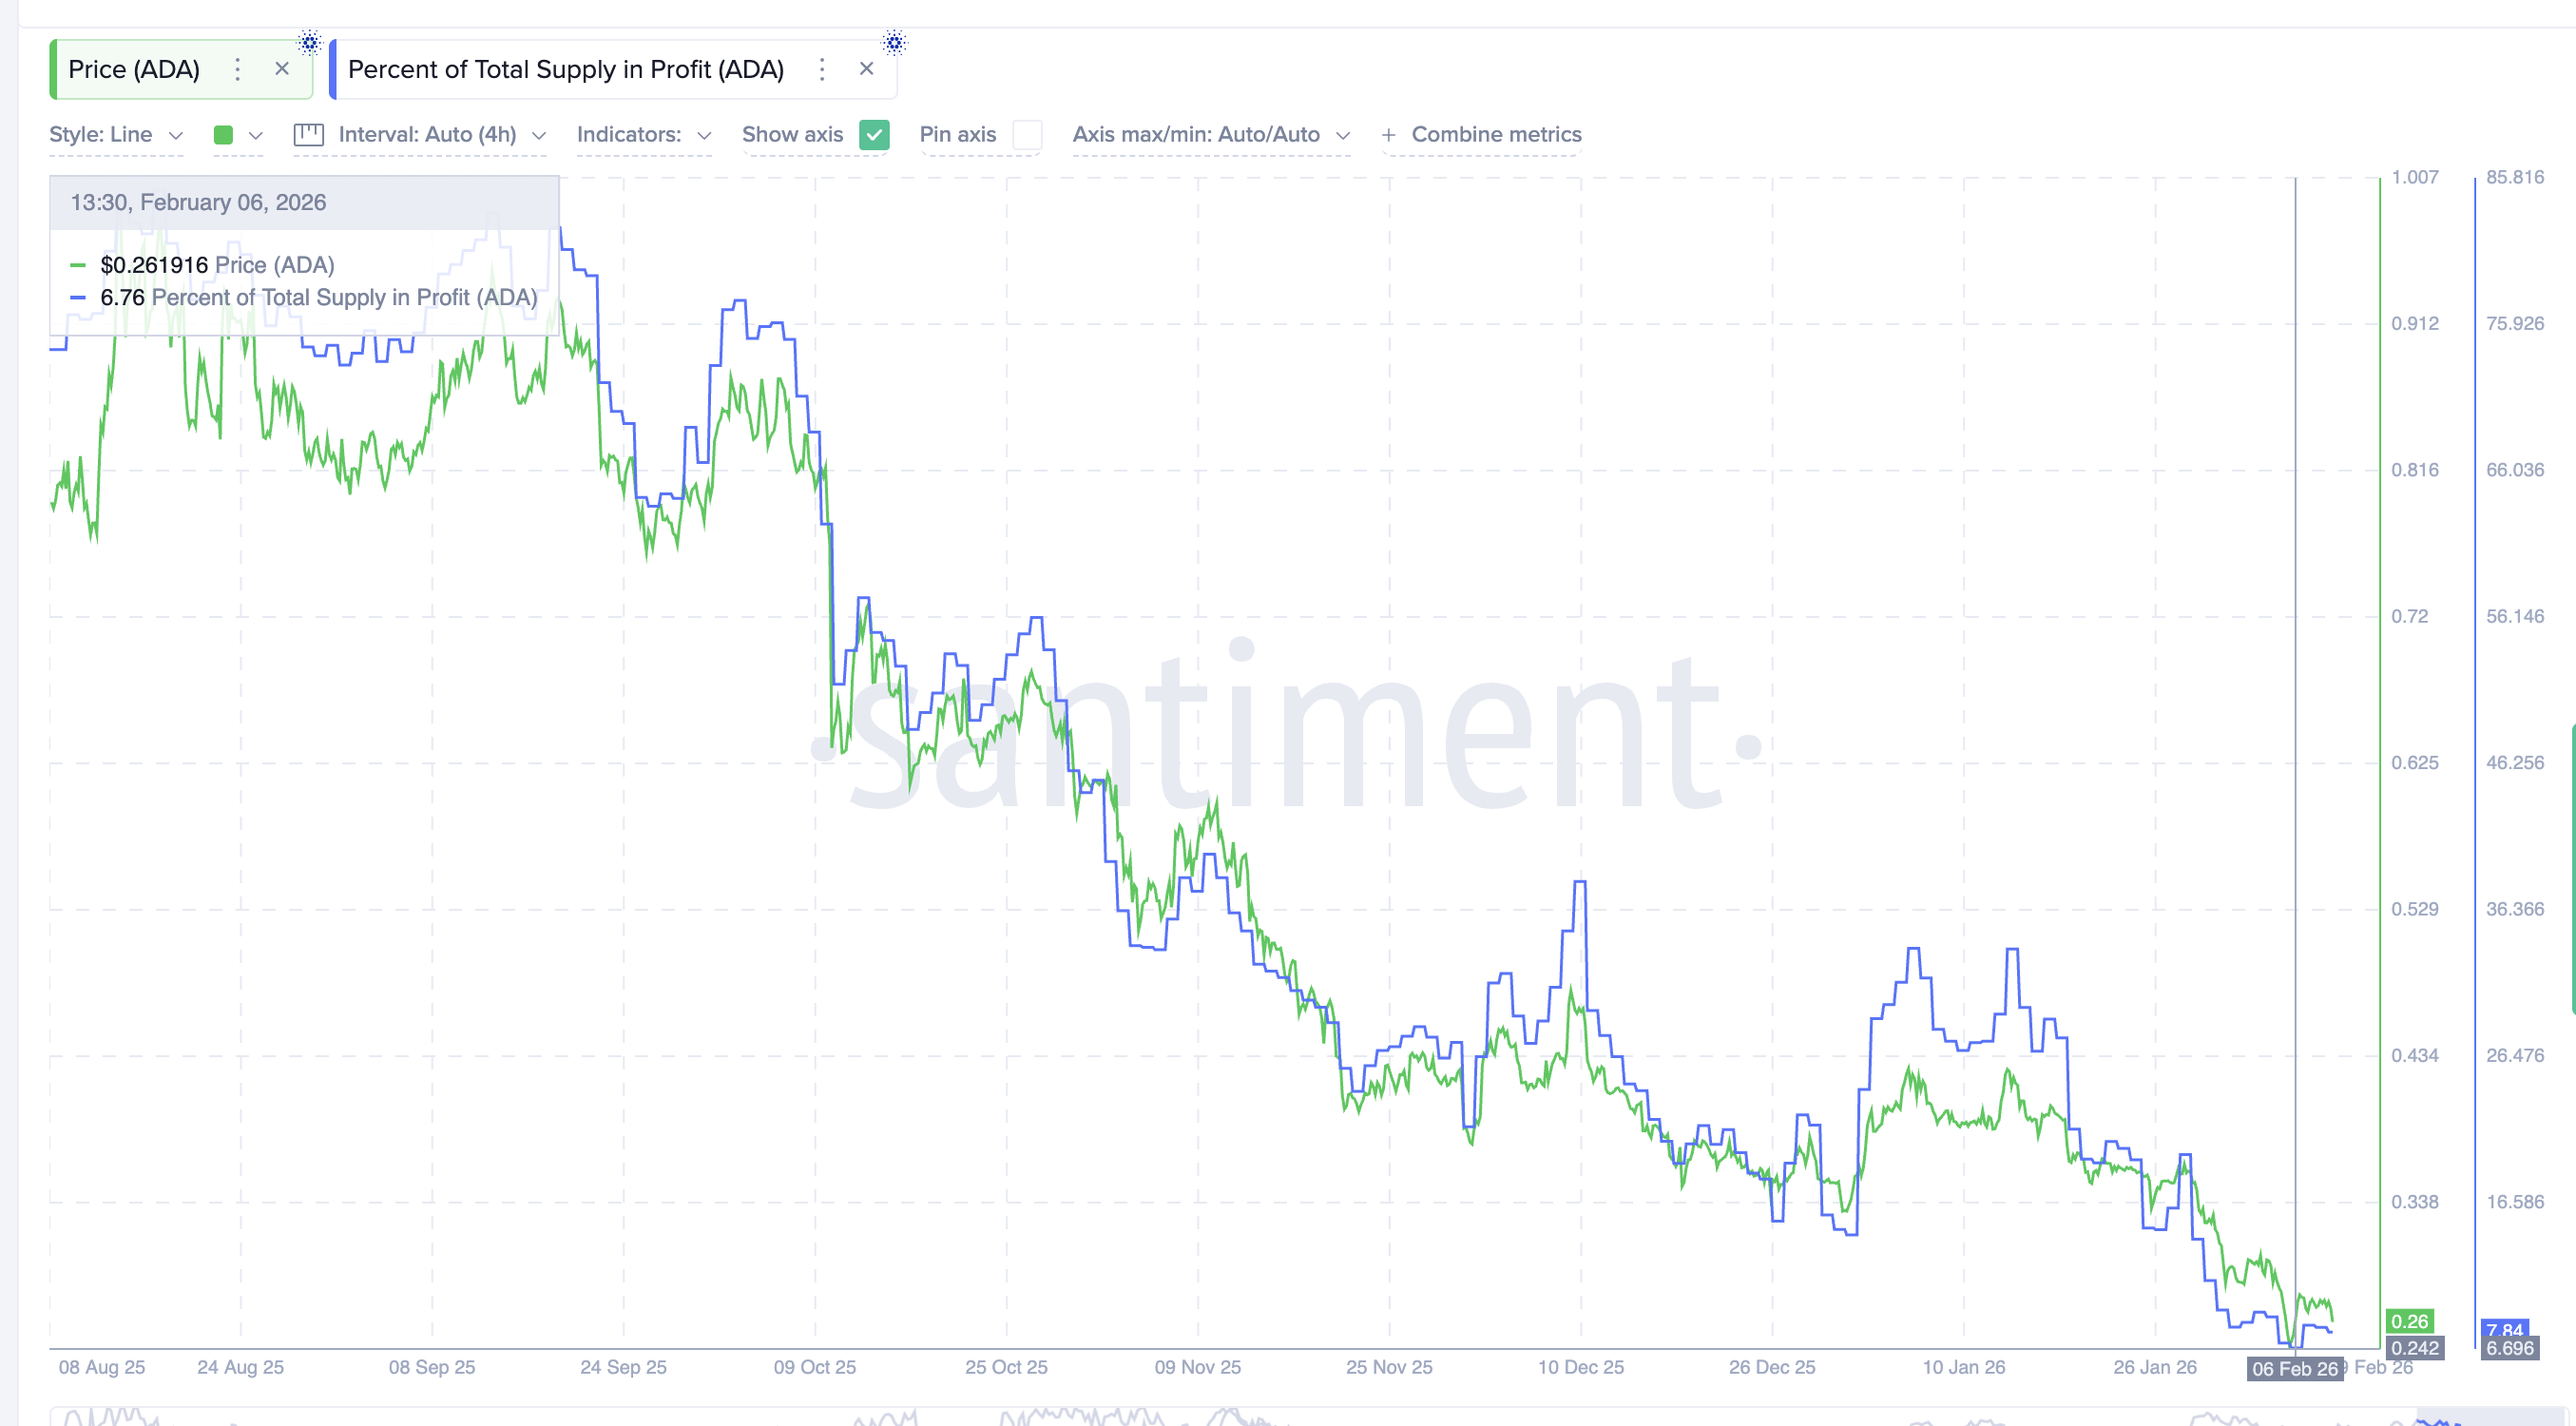
When so few holders are in profit, fewer investors are motivated to sell into small rallies. Most are either at break-even or sitting on losses. This reduces natural selling pressure.
Another supportive signal comes from spent coins age data, which tracks how many coins, across old and young cohorts, are being moved. During the February 6 sell-off, coin activity surged to around 168 million ADA. Since then, it has dropped to roughly 92 million. That is a decline of about 45%.
Sponsored
Sponsored
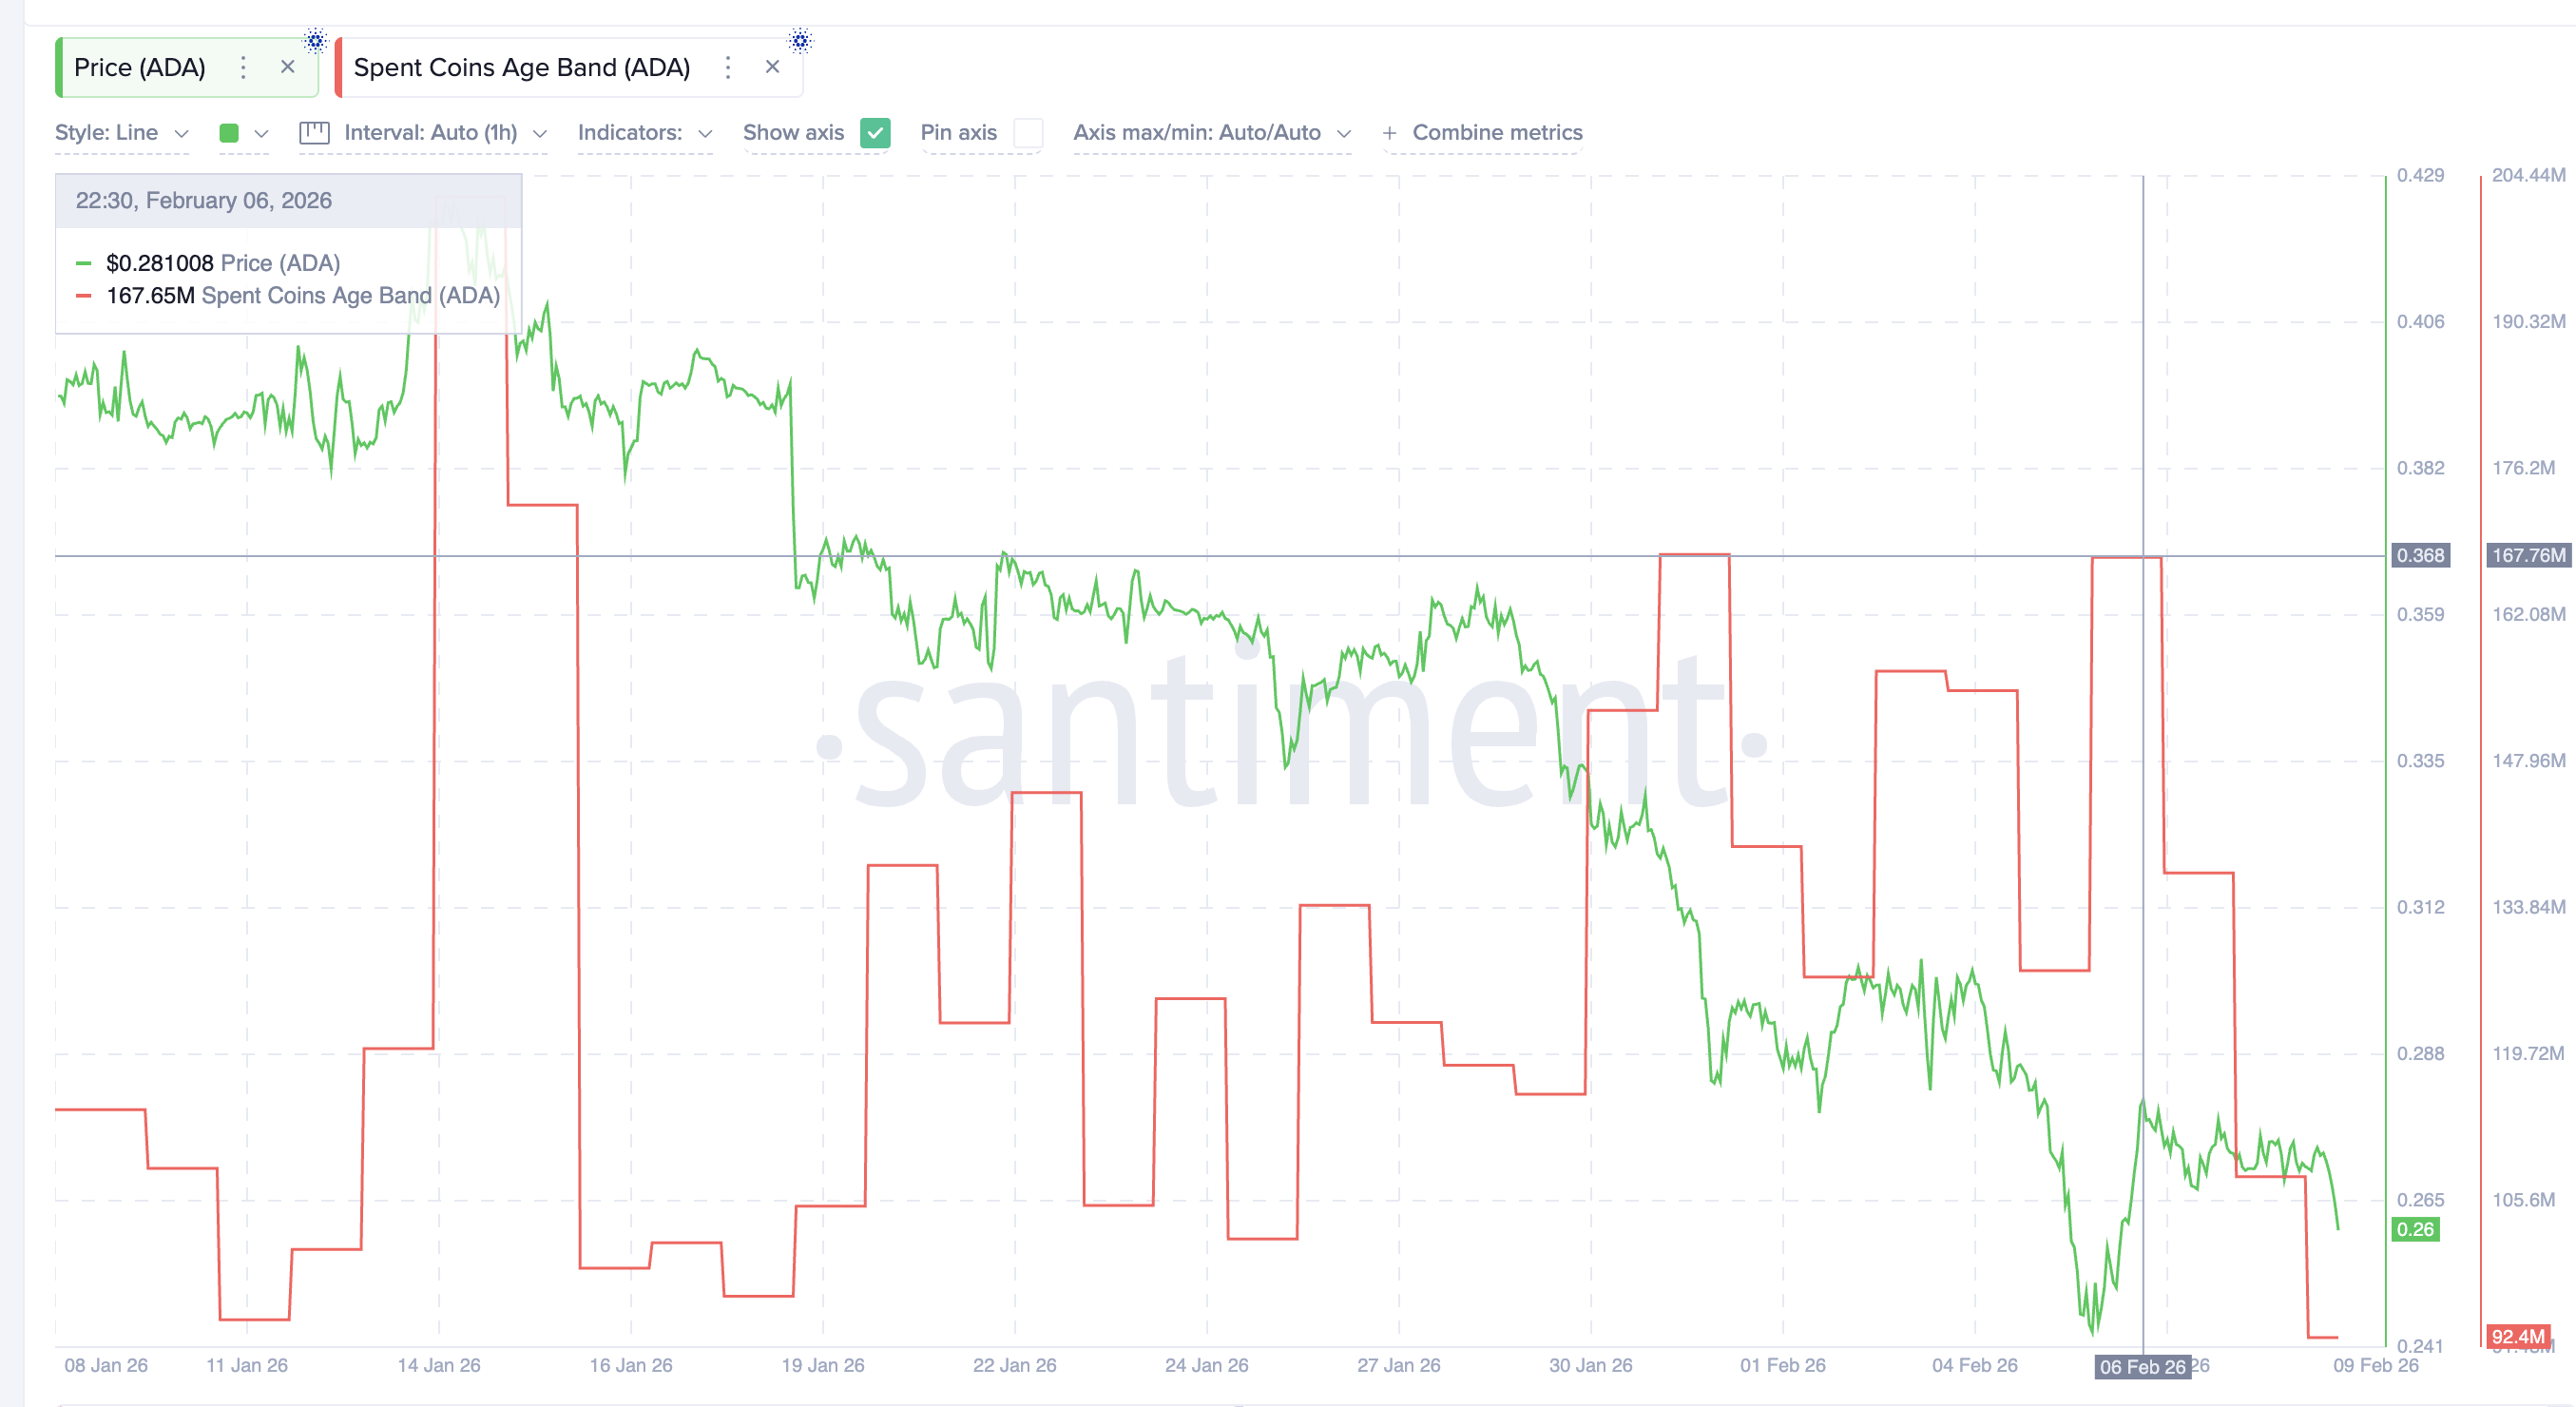
This shows that long-term holders are no longer rushing to move or sell their coins. Panic-driven exits have slowed. Many investors are choosing to wait. When falling profit supply aligns with declining coin movement, it usually means distribution is easing. This does not guarantee a rally, but it creates space for one to develop.
With fewer motivated sellers, the next move depends mainly on buyer strength.
Volume and Cardano Price Levels Will Decide If $0.34 Comes Into Play
Despite improving structure and weaker selling pressure, buying strength remains limited.
On-Balance Volume, which tracks whether volume supports rising or falling prices, is still trending lower. It remains below a descending trendline. This shows that recent rebounds have not been supported by sustained demand.
Sponsored
Sponsored
The last major surge in buying happened on February 6, when ADA rallied from near $0.220 to around $0.285 in one day, almost 30%. Volume expanded sharply during that move. Since then, participation has cooled.
For a true breakout to develop, volume must expand again and push OBV above its downtrend. Without that, rallies are likely to fade. Key ADA price levels reflect this balance.
The first major resistance sits near $0.275. A confirmed break above this zone would validate the inverse pattern. Above that, $0.285 becomes the next hurdle. Clearing both would open the path toward $0.346, almost 30% from the pattern’s neckline.
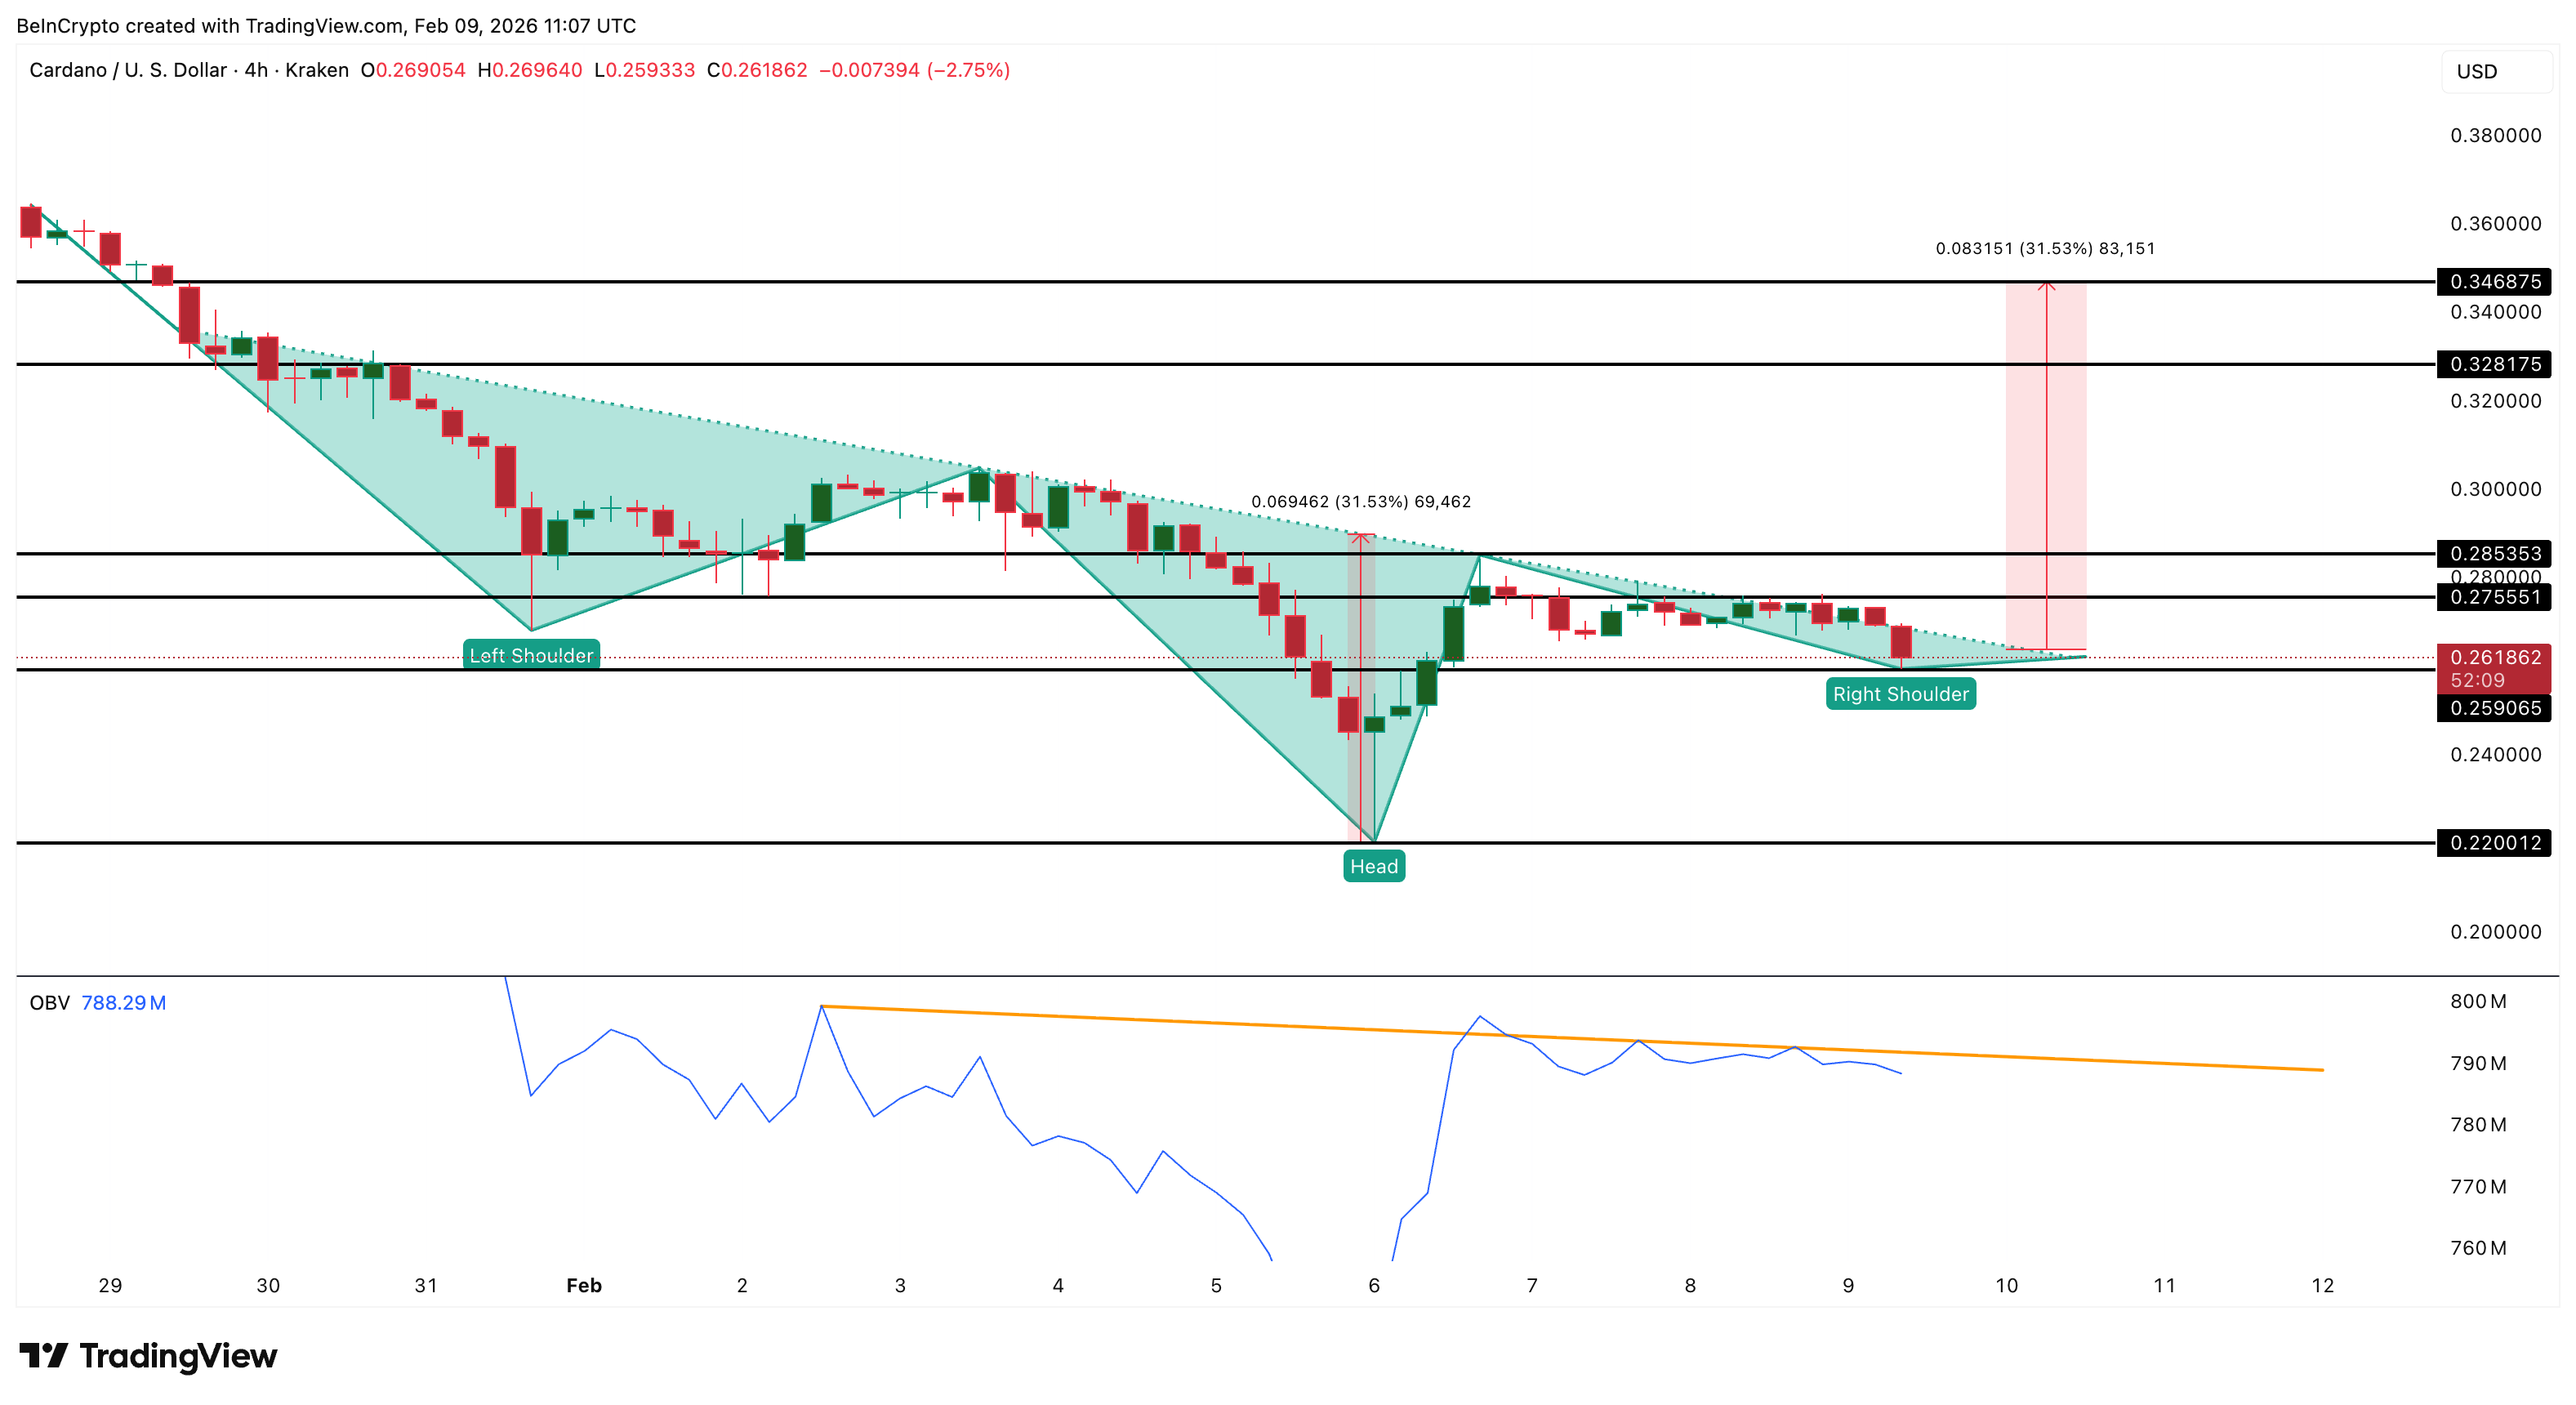
On the downside, $0.259 is critical support. A break below this level would weaken the right shoulder and damage the bullish setup. Full invalidation occurs below $0.220, which would place the price back under the pattern’s base.
In simple terms, Cardano is approaching a decision point. Selling incentives have dropped about 75%. Coin activity has cooled. Momentum is improving. But volume has not yet confirmed buyer control.
If strong participation returns and $0.275 breaks, a move toward $0.34 ($0.346 to be exact) becomes realistic. If not, the ADA price risks drifting lower again.


TLDR
- Arizona advanced Senate Bill 1649 to a full House floor vote after clearing the House Rules Committee.
- The bill would allow the state to create a Digital Assets Strategic Reserve Fund.
- The proposal permits Arizona to retain seized cryptocurrencies instead of auctioning them.
- The legislation names XRP, Bitcoin, Monero, NEAR Protocol, and Nano as eligible assets.
- Lawmakers set criteria to assess adoption levels and transaction activity for reserve assets.
Arizona lawmakers advanced Senate Bill 1649 to a full House vote after clearing the House Rules Committee. The proposal would allow Arizona to retain seized digital assets in a state-managed fund. The measure names XRP, Bitcoin, and Monero as eligible assets under defined standards.
Arizona Crypto Reserve Plan Names XRP as Eligible Asset
The House Rules Committee approved SB1649 with eight votes in favor. As a result, the bill now heads to the full House for consideration. Lawmakers introduced the measure to create a Digital Assets Strategic Reserve Fund. The proposal allows the state to keep digital assets obtained through forfeiture or surrender. Currently, agencies auction most seized cryptocurrencies.
State Senator Mark Finchem introduced SB1649 earlier this session. The Senate Finance Committee passed the bill with a 4–2–1 vote. Lawmakers set criteria to determine which assets qualify for the reserve. The criteria review adoption rates, annual transaction volume, and ecosystem development. The bill lists XRP, Bitcoin, Monero, NEAR Protocol, and Nano as eligible assets.
The proposal authorizes the State Treasurer to manage the reserve fund. The Treasurer may invest holdings to generate returns for the state. However, the bill requires that investment actions do not increase financial risk. Lawmakers included this provision to guide fund management practices.
If the House approves SB1649, the bill will move to the governor’s desk. The governor may sign the measure into law or veto it. Lawmakers placed the bill on the House calendar following the committee vote.
Bitcoin and Monero Included in Arizona Reserve Framework
SB1649 identifies Bitcoin as a primary digital asset for the reserve. Lawmakers also included Monero under the eligibility framework. The bill groups these assets with XRP under a defined fair value threshold. This threshold evaluates economic strength and technical performance.
Under the measure, Arizona may retain cryptocurrencies received through legal processes. Agencies would transfer those assets to the reserve fund instead of auctioning them. The Treasurer would then oversee storage and management of the holdings. Lawmakers structured the bill to formalize how the state handles digital assets.
The legislation forms part of broader digital asset discussions in Arizona. Lawmakers are also considering Senate Bill 1042. That proposal would allow the state to invest up to 10% of public funds in cryptocurrencies. SB1042 remains under review in the state legislature.
At the federal level, digital asset reserves have also entered policy debates. President Donald Trump signed an executive order establishing a Strategic Bitcoin Reserve. The order also created a broader digital asset stockpile framework. Lawmakers referenced these developments during state discussions.
The House will now determine the fate of SB1649 in a floor vote. If members approve the measure, it will proceed to final executive consideration. The legislative process continues as scheduled in the current session.

TLDR
- Cango received a notice from the New York Stock Exchange after its shares traded below $1 for 30 consecutive days.
- The company has six months to regain compliance and avoid suspension or delisting proceedings.
- Cango secured a $10 million convertible note agreement with DL Holdings to strengthen its balance sheet.
- The financing includes warrants that allow share purchases at $2.70 per share.
- Cango recently closed a $65 million strategic investment settled in USDT and issued over 49 million Class A shares.
Cango faces a potential New York Stock Exchange (NYSE) delisting after its shares traded below $1 for 30 consecutive days. The exchange issued a compliance notice and granted a six-month cure period. Meanwhile, Cango secured fresh funding to support operations and expansion plans.
Cango Receives NYSE Compliance Notice Over Share Price
The New York Stock Exchange notified Cango on March 10 about non-compliance with its minimum price rule. The exchange requires an average closing price above $1 over 30 trading days. Cango’s shares fell below that threshold and triggered the notice.
The company now has six months to restore compliance and avoid suspension proceedings. Cango stated that it will monitor market conditions and assess available options. It also confirmed that its shares will continue trading during the cure period.
Cango’s stock has declined more than 70% this year. The shares recently traded near $0.39 after starting January above $1.40. Sustained selling pressure pushed the stock under the exchange’s minimum listing standard.
Cango Secures $10 Million Convertible Note to Support Expansion
Cango entered a $10 million convertible note agreement with Hong Kong-listed DL Holdings. The company also issued warrants allowing share purchases at $2.70 per share. Cango paired the financing with a non-binding cooperation framework.
The framework outlines potential joint investments in crypto mining and AI infrastructure. Cango said it will allocate proceeds toward upstream acquisitions and computing infrastructure expansion. The company continues shifting focus beyond bitcoin mining operations.
Management has positioned its global mining footprint as a base for high-performance computing services. The company plans to repurpose or expand power capacity for AI-driven workloads. This strategy supports revenue diversification within computing infrastructure.
Cango recently closed a $65 million strategic investment round. Entities controlled by Chairman Xin Jin and Director Chang-Wei Chiu led the transaction. The deal was settled in USDT and concluded on March 31.
The company issued more than 49 million Class A shares under that agreement. Cango said the capital strengthens its balance sheet. It aims to support operations during ongoing market pressure.
Management stated that it seeks to stabilize finances while executing long-term plans. The company continues evaluating measures to regain compliance with NYSE rules. Cango confirmed that it remains focused on meeting the $1 minimum requirement.
The recent fundraising activity reflects immediate capital needs. Cango continues trading on the NYSE under existing ticker terms. The company has not announced a reverse split or other corporate action.
Cango confirmed that it will provide updates regarding compliance efforts. The company emphasized that the notice does not immediately affect trading. Shares last changed hands near $0.39, reflecting year-to-date losses above 70%.
TLDR
- Genius Group sold its entire Bitcoin holdings to fully repay $8.5 million in debt.
- The company said it plans to rebuild its Bitcoin treasury when market conditions improve.
- Genius Group previously held 440 Bitcoin as part of its Bitcoin-first strategy.
- A US court order restricted the company from raising funds or issuing shares.
- Nakamoto disclosed a $20 million Bitcoin sale earlier this week.
Genius Group has liquidated its remaining Bitcoin holdings to fully repay $8.5 million in debt, the company confirmed today. The NYSE-listed firm said it cleared the balance after selling all digital asset reserves. It also stated that it plans to rebuild its Bitcoin treasury when market conditions improve.
Genius Group and Bitcoin Strategy Shift
Genius Group adopted a Bitcoin-first treasury policy in late 2024 after Donald Trump won the US presidential election. The company committed to allocating at least 90% of its reserves to Bitcoin. By February 2025, it held 440 BTC as part of that strategy.
However, a US court order later blocked the company from raising funds or issuing shares. As a result, Genius Group began selling portions of its Bitcoin holdings. Last month, it sold about 86 BTC and retained around 84 BTC.
The company confirmed that it has now liquidated the remaining coins. It used the proceeds to fully repay its outstanding $8.5 million debt. Genius Group stated that it intends to rebuild its Bitcoin treasury when markets become favorable.
Corporate Bitcoin Sales Expand as Nakamoto and MARA Adjust Holdings
Genius Group was not alone in reducing its Bitcoin exposure. Nakamoto, led by Bitcoin advocate David Bailey, disclosed the sale of $20 million in Bitcoin earlier this week. The company did not provide further details about the transaction.
Meanwhile, MARA Holdings reported the sale of 15,133 Bitcoin valued at roughly $1.1 billion. The company said it used the proceeds to finance the buyback of its 2030 and 2031 convertible notes. These moves followed a broader pullback in corporate digital asset holdings.
Revenue Growth and Gross Profit Drive Operational Turnaround
Genius Group reported Q1 2026 operational revenue of $3.3 million. The figure marked a 171% year-over-year increase. Gross profit rose 228% to $2.0 million during the same period.
Net profit from operations reached $2.7 million, reversing a loss recorded in the prior year. The company attributed the turnaround to higher-margin educational programs and experiential learning initiatives. Adjusted EBITDA improved to $600,000.
The company also highlighted several recent initiatives. It launched Genius School as a model future school and expanded Genius City in Bali. It also introduced AI-powered Space Capsule learning pods and reported continued CEO investment in company shares.
Federal Reserve Governor Michelle Barr said on Tuesday that clearer U.S. stablecoin rules could accelerate the sector’s growth, but she warned that regulators must address money-laundering risks, bank-run concerns and consumer protection as they implement the GENIUS Act.
Speaking at a Federalist Society event on stablecoin regulation, Barr emphasized that the law would provide “needed clarity” for issuers. Yet she stressed that the ultimate impact will hinge on how federal and state agencies translate the statute into concrete rules.
Stablecoins are still primarily used for crypto trading and as a dollar-denominated store of value in certain foreign markets. Barr noted their potential to reduce remittance costs, speed up trade-finance processes and help firms manage treasury operations. She also highlighted risks, including bad actors acquiring stablecoins in secondary markets without identity checks, and the temptation for issuers to pursue yield in reserve assets in ways that could erode confidence during periods of stress.
Her remarks come as U.S. agencies shift from drafting legislation to writing rules. The Treasury Department opened a second round of public comment on implementing the GENIUS Act in September 2025, signaling the administration’s intent to craft a regulatory framework that fosters innovation while addressing illicit finance, consumer protections and financial stability concerns.
Key takeaways
- The GENIUS Act provides a federal framework and clarity for stablecoin issuers, but real impact depends on the specifics of forthcoming rulemaking by federal and state authorities.
- Regulators are prioritizing guardrails around reserve assets, anti-money-laundering checks, consumer protections and capital/liquidity requirements for issuers.
- The Treasury’s ongoing public consultation underscores a balance-driven approach: enabling innovation while mitigating systemic and illicit-finance risks.
- Past discussions of stability and trust in privately issued digital money inform the current stance, as officials warn against overreach that could undermine confidence in redemption at par during stress.
GENIUS Act’s framework under scrutiny
The GENIUS Act, signed into law on July 18, 2025, established a federal pathway for U.S. payment stablecoins, mandating one-to-one backing with reserve assets such as U.S. dollars and Treasury securities. The statute anticipated a phased rollout, taking effect 18 months after signing or 120 days after final agency rules are published, whichever comes later. The rulemaking process now centers on translating that framework into practical requirements for issuers, custodians, and the networks that support on-chain dollars.
Barr’s remarks reflect a broader tension in the policy agenda: while the law aims to reduce regulatory uncertainty and spur legitimate adoption, it also raises questions about how to supervise reserve management, ensure robust AML controls and prevent consumer harm if redemption experiences stress. In her view, clear guardrails are essential to prevent a repeat of past fragilities seen during financial upheavals when private money markets faced losses or liquidity strains.
The governance question is not purely theoretical. The act explicitly contemplates reserve-asset backing and the prudential requirements that might accompany it, including capital and liquidity standards. Barr cited the potential for regulatory arbitrage between federal and state authorities as a practical risk if rules are unevenly applied across jurisdictions, potentially fragmenting the market and complicating compliance for issuers operating nationwide.
Beyond issuance, the scope of control – such as whether regulators oversight beyond the mere act of minting stablecoins to include the management of reserves, settlement rails and treasury operations – remains a focal point for policy negotiators. Barr’s framing suggests that a comprehensive approach will be essential to maintain market integrity and reassure users that stablecoins remain a reliable, on-demand dollar proxy even under stress.
Safeguards, compliance frictions and market dynamics
One recurring theme in Barr’s remarks is the risk of illicit finance and the need for rigorous identity checks in secondary markets. The possibility that bad actors could circumvent oversight by acquiring stablecoins off-exchange underscores the demand for robust Know Your Customer and AML controls throughout the ecosystem. Regulators are weighing how to enforce identity verification without stifling legitimate financial activity or driving participants to opaque, cross-border channels.
Another area of focus is the management of reserve assets. The GENIUS Act envisions reserves that can include U.S. dollars and U.S. Treasuries, but the regulatory calculus around what constitutes acceptable collateral, how reserve liquidity is maintained and how stress scenarios are modeled remains unsettled. Barr pointed to the risk that issuers might pursue yields that look attractive in normal times but prove destabilizing when conditions tighten. These considerations are central to preserving confidence that stablecoins can be redeemed on demand at stable value.
The policy conversation is also being shaped by concurrent statements from other U.S. regulators. Fed Vice Chair for Supervision Michelle Bowman has indicated that capital and liquidity rules for stablecoin issuers are already in development, while the Federal Deposit Insurance Corporation chair has said the agency does not expect deposit insurance for stablecoins under the GENIUS framework. Taken together, the signals suggest a cautious but forward-moving rulemaking process designed to keep stablecoins within a managed risk envelope while supporting legitimate innovation.
From an investors’ perspective, the rulemaking trajectory matters for how quickly stablecoins can scale as a trusted payment instrument, and how exposure to reserve risk or issuer missteps is priced into the market. For users and builders—wallet providers, exchanges and on-chain infrastructure—the clarity around compliance expectations and reserve governance will influence product design, KYC workflows and treasury-management features. The line between activity that is permissible under the law and what would trigger supervisory action remains a critical area to watch as agencies publish draft rules and conduct public consultations.
What to watch next for the stablecoin voyage
With the GENIUS Act as the anchor, the regulatory timetable is shifting toward concrete rules that will define how stablecoins operate in the United States. The ongoing public-comment process signals a willingness to refine the framework to accommodate financial innovation while strengthening protections against financial crime and systemic risk. Key milestones to monitor include the issuance of final agency rules, the precise calibration of reserve-asset standards, and the delineation of permissible activities beyond straightforward issuance—such as on-chain settlement mechanics and intermediation functions by custodians.
Market participants should also gauge how other major economies approach stablecoins, as global operators weigh whether U.S. rules will remain the gold standard or push activity toward more permissive or restrictive jurisdictions. In the near term, investors may see a bifurcation: issuers that align quickly with evolving standards could gain faster access to U.S. markets, while those that lag might encounter higher compliance costs or restricted access to U.S. rails. For users, the prospect of stronger consumer protections and clearer redemption guarantees offers a more predictable environment, though it could come with increased onboarding checks and slower transactions in some cases.
Ultimately, Barr’s speech reinforces a central fact: the GENIUS Act is a landmark attempt to reconcile private, on-chain money with public safeguards. The outcome will hinge on the rigor of rulemaking and the resilience of the safeguards regulators implement. As the process unfolds, the industry will be watching not only how reserve assets are treated, but how the rules address specialized risks such as cross-border use, illicit financing channels and the potential for runs during shocks.
Readers should stay attentive to the pace of rule publication and the specifics agencies publish about capital, liquidity and AML standards, as those details will shape the feasibility and cost of compliant stablecoin programs in the United States.
The evolving regulatory backdrop underscores a broader theme for the crypto space: legitimate-scale adoption depends on credible assurances that stablecoins can deliver on the promise of speed, reliability and safety, without compromising financial stability or enabling misuse.
As policymakers refine the balance between innovation and protection, the market will likely respond with a mix of pragmatic partnerships, new compliance tooling and product innovations designed to navigate a tighter but clearer regulatory horizon.
What remains uncertain is how quickly final rules will land and how issuers, custody providers and exchanges will adapt to a potentially stricter regime. Still, Barr’s remarks emphasize a deliberate, risk-conscious path forward—one that could ultimately help stablecoins mature from niche tools into mainstream financial rails.


The $1.7 trillion asset manager will absorb the 250 Digital team and all liquid crypto strategies previously managed by CoinFund, targeting pensions and sovereign wealth funds.
TLDR
- Jamie Dimon said JPMorgan may enter the prediction markets sector in the future.
- He ruled out offering contracts tied to sports or political events.
- Goldman Sachs confirmed it is actively reviewing prediction market opportunities.
- Polymarket and Kalshi remain leading platforms as competition expands.
- Coinbase and Robinhood have added prediction trading to their services.
JPMorgan CEO Jamie Dimon said the bank may enter prediction markets as large institutions assess the fast-growing sector. He shared the update during a CBS interview on Tuesday. His remarks place JPMorgan alongside Goldman Sachs in reviewing potential offerings.
JPMorgan Reviews Prediction Markets Strategy
Dimon confirmed JPMorgan is studying the space but set clear limits. “It’s possible one day we’ll do something like that,” Dimon said. However, he ruled out markets tied to sports or politics.
He stressed that the bank would follow strict internal standards. “There’s a bunch of stuff we won’t do,” Dimon said. He added, “We have strict rules around insider information.”
Goldman Sachs has also advanced its review of prediction markets. CEO David Solomon addressed the topic during the bank’s January earnings call. He said the firm has engaged directly with industry leaders.
“I personally met with the two big prediction companies,” Solomon said. He said he spent hours learning about their models and leadership. He added that a team continues to evaluate the sector.
Neither bank has disclosed launch timelines. They have also not detailed technology choices or regulatory structures. However, their statements confirm active internal discussions.
Polymarket, Kalshi, and Rising Crypto Platforms
Prediction markets were once centered on two main platforms. Polymarket and Kalshi dominated the sector for years. Now, competition has expanded quickly across crypto and traditional firms.
Coinbase and Robinhood have integrated prediction market trading. These companies offer retail access through existing platforms. Their entry has increased user participation and market volume.
Polymarket operates on blockchain infrastructure using Polygon. Users deposit stablecoins and place outcome-based trades. Smart contracts record transactions and settle payouts automatically.
Kalshi uses a regulated exchange model without blockchain systems. It offers event contracts under centralized order matching. The platform handles settlement through traditional mechanisms.
Polymarket has secured partnerships and investment backing. It maintains ties with Intercontinental Exchange, which owns the New York Stock Exchange. The company holds an estimated $20 billion valuation.
Kalshi recently closed a funding round led by Coatue Management. The round valued the platform at about $22 billion. These figures reflect growing capital flows into prediction markets.
Regulation in the United States continues to evolve. Authorities assess how event contracts should be classified. Banks have indicated they will monitor policy developments closely.
Earlier this month, the Commodity Futures Trading Commission advanced oversight efforts. The agency outlined steps to build a regulatory framework. These actions mark the latest formal move shaping prediction markets in the U.S.

A crypto governance critique argues that token voting has not fulfilled its decentralized promise, and markets may offer a better coordination mechanism. In a perspective piece, Francesco Mosterts, co-founder of Umia, outlines why the early dream of “on-chain democracy” via token-weighted votes faces fundamental flaws—and how a market-based approach could reshape how on-chain organizations decide what to build and fund.
Mosterts emphasizes that crypto’s strength lies in markets: prices, incentives, and capital flows already coordinate almost every facet of the ecosystem, from token valuations to lending rates and blockspace demand. Yet when governance arrives, the system often abandons markets. He points to ongoing governance frictions across major protocols and a troubling pattern of participation and influence in DAOs. A recent study covering 50 DAOs found a persistent engagement gap: token holders vote inconsistently, and a single large voter can sway about 35% of outcomes, while four voters or fewer can influence two-thirds of decisions. In practice, this means governance power remains highly concentrated even as a decentralization narrative remains loud.
Key takeaways
- Token voting suffers from chronic underparticipation: most token holders abstain, leaving decisions to a small, active minority.
- Whales wield outsized influence, undermining the egalitarian premise of decentralized governance and risking outcomes dominated by a few large holders.
- There is no price signal attached to governance votes, creating misalignment between information, conviction, and action.
- Markets-based governance—where outcomes are priced and funded—could transform governance from expression of opinion into a mechanism of measurable conviction.
The promise and limits of token governance
The original vision of DAOs began with a simple idea: token holders would govern by voting on proposals, thereby aligning ownership with decision rights. The first wave of experiments—DAOs launched in 2016 and beyond—sought to replace centralized management with code-driven governance. Tokens, in theory, would symbolize both ownership and influence, enabling any participant to steer a protocol’s direction by casting a vote.
In practice, however, token voting has struggled to live up to that promise. Three core challenges repeatedly surface: participation, the dominance of whales, and incentive misalignment. Participation remains uneven, as many governance decisions require significant time and effort to review and analyze. The result is governance fatigue, with the majority of token holders remaining passive while a narrow cadre of participants makes the call on key proposals.
Whales compound the problem. Large holders can and do tilt outcomes, demoralizing ordinary voters who feel their input matters less than those with bigger balance sheets. This dynamic starkly contrasts with the ideal of a broad, democratic process where every tokenholder has a meaningful voice.
Then there’s the incentive issue. Governance voting lacks a direct economic signal—votes carry equal weight regardless of a voter’s information, due diligence, or risk tolerance. There is little price for being right or penalty for being wrong, which can encourage speculative or uninformed participation rather than careful, conviction-driven decision-making.
Why pricing decisions could fix governance
The argument pivots on a simple observation: crypto already uses markets to allocate capital, price risk, and signal conviction across a spectrum of activities. If governance can be integrated with pricing mechanisms, it could convert opinions into measurable expectations and align participation with real economic incentives. In other words, decision markets could monetize governance outcomes by letting participants buy and sell bets on proposed directions or policies, thereby revealing collective conviction through market activity.
Advocates of this approach point to several possible benefits. First, decision markets would incentivize participants to research proposals more thoroughly, because their capital at stake would fluctuate with the perceived success of a given outcome. Second, pricing governance outcomes would help surface true preferences and risk assessments, reducing the influence of uninformed voting and opportunistic behavior. Finally, markets could extend beyond mere protocol decisions to broader capital allocation—funding the most promising initiatives with transparent, incentive-aligned mechanisms from inception.
There is a growing sense in the ecosystem that the governance bottleneck—characterized by protracted debates, treasury disputes, and stalled proposals—is a symptom of the misalignment between how decisions are made and how value is created. If crypto wants governance to be a true coordination engine, it may need to borrow from markets more aggressively. Predictions markets, futures-like payoffs on governance outcomes, and futarchy-inspired mechanisms are increasingly revisited as potential pathways to price governance bets and coordinate action around credible forecasts.
What changes when governance is priced, not just voted on
Framing governance as a pricing problem could shift the dynamic from passive endorsement to active, informed risk assessment. By attaching economic signals to decisions, participants would be exposed to the consequences of their bets in real-time, incentivizing careful evaluation of proposals and potential trade-offs. The broader implication is a move from “vote for my preferred outcome” to “trade for the outcome you expect to materialize.”
Beyond improving participation and alignment, decision markets could influence how on-chain organizations allocate resources from day one. Startups and protocols might raise capital with built-in incentive structures for governance that reflect the true costs and benefits of proposed initiatives. In this view, token voting remains valuable for signaling preferences, but it becomes part of a wider system where markets determine which directions receive support and funding, and within what conditions.
As the ecosystem debates these ideas, it’s worth noting that some observers have already flagged governance tensions at prominent protocols. For example, coverage from Cointelegraph highlighted governance disputes around Aave’s exit from a DAO governance framework, underscoring the fragility of current models when high-stakes decisions collide with real-world incentives. The ongoing tug-of-war between governance control and treasury strategy illustrates how far the current approach is from a scalable, market-informed model.
What to watch next as markets reshape on-chain governance
The broader market is watching for experiments that meaningfully integrate pricing into governance. If decision markets can demonstrate durable improvements in decision quality and coordination speed without compromising decentralization, they could become a central feature of the next generation of on-chain organizations. The revival of discussions around futarchy, prediction markets, and other market-based coordination tools points to a phase of crypto where governance becomes less about voting rituals and more about economically rational decision-making under uncertainty.
Still, several questions remain unresolved. How would such markets be designed to prevent manipulation or collusion? What safeguards would ensure that price signals reflect diverse risk tolerances and long-term value creation rather than short-term speculation? And how would regulators treat on-chain decision markets that directly influence capital allocation and product strategy?
What’s clear is that token voting, while historically significant as crypto’s first big governance experiment, is unlikely to be the final answer to decentralized coordination. The next era could see governance complemented, or even superseded, by markets that price outcomes, align incentives, and actively guide what gets built with transparent, market-driven signals.
In the meantime, readers should monitor ongoing debates about how to harmonize decentralization with effective governance, particularly where treasury management, proposal execution, and cross-chain coordination are concerned. The direction crypto takes next—whether sticking with traditional voting or embracing a pricing-based framework—will shape how communities decide and fund the protocols they rely on every day.
Ripple XRP moved closer to full national trust bank status on April 1 as the OCC’s final rule – detailed in Bulletin 2026-4 – took effect, formalizing a regulatory framework that directly enables Ripple’s conditionally approved national trust bank charter to progress toward operational status.
The rule revises chartering regulation to allow national trust banks to conduct non-fiduciary activities alongside fiduciary ones, expanding the scope of what Ripple National Trust Bank can legally offer once pre-opening conditions are satisfied.
XRP traded at $1.3364 on April 1, with technical indicators shifting bullish for the first time in two weeks as the regulatory milestone landed.
The OCC issued this rule after conditionally approving charters for Ripple National Trust Bank, First National Digital Currency Bank, BitGo, Fidelity, and Paxos – a cluster of approvals that signals the agency’s deliberate move to integrate crypto-native and crypto-adjacent institutions into the federally regulated banking system.
That this rule arrives under a Trump-era OCC that has explicitly positioned itself as pro-crypto makes the timing more than procedural: it is structural.
- Rule Scope: OCC Bulletin 2026-4 takes effect April 1, expanding national trust bank authority to include non-fiduciary activities – custody and safekeeping of digital assets now explicitly in scope.
- Ripple’s Position: Ripple National Trust Bank holds conditional OCC approval from December 2025, pending satisfaction of AML, KYC, capital adequacy, and risk control conditions before full operations begin.
- Regulatory Background: XRP was classified as a digital commodity by the SEC and CFTC on March 17, 2026, clearing the legal ambiguity that had shadowed Ripple’s institutional adoption narrative for years.
- XRP Market Impact: XRP price sat at $1.3364 on April 1, with bullish technicals emerging for the first time in two weeks; exchange outflows signal accumulation among holders amid the regulatory catalyst.
- What to Watch: Ripple’s Federal Reserve master account application is the next gating variable – Kraken’s approval sets a precedent, and Ripple’s clearance would give it direct access to Fed payment rails.
Discover: Top Crypto Presales to Watch Before They Launch
What the OCC Final Rule Actually Does – and Why the Terminology Change Matters
The core mechanism of OCC Bulletin 2026-4 is a terminological revision that carries operational weight: the agency replaced the phrase “fiduciary activities” with “operations of a trust company and activities related thereto” in its chartering regulation.
That distinction matters. Under the prior framework, national trust bank charters were more narrowly scoped around fiduciary functions – managing assets on behalf of clients in a representative capacity. The revised language explicitly opens the door to non-fiduciary activities, which includes custody and safekeeping services where the institution holds assets but does not exercise discretionary management over them.
For digital asset firms, that difference is the entire product. Custody – holding client crypto assets under federal oversight without necessarily exercising fiduciary discretion – is the foundational service that institutional clients require before allocating capital through a regulated entity.
The OCC has been explicit that this rule neither expands nor contracts its chartering authority; it clarifies what charter-holders can operationally do. That framing matters because it neutralizes the argument that the OCC is overstepping – the agency is not creating new powers, it is specifying existing ones with enough precision for digital asset custody to fit cleanly within them.
The rule’s April 1 effective date follows a sequence: conditional approvals for Ripple, BitGo, Fidelity, and Paxos came first, and the final rule now establishes the operational framework those approved entities will operate under once their pre-opening conditions are cleared. Ripple’s path to full charter runs through this framework directly.
Ripple XRP Specific Position – From SEC Defendant to Federal Bank Applicant
The speed of Ripple’s regulatory repositioning over the past 18 months is the context that makes April 1 significant: a company that spent years fighting the SEC over whether XRP was an unregistered security received a digital commodity classification on March 17, 2026, and now holds a conditional OCC national trust bank charter – a trajectory that would have been unthinkable in 2023, and that now positions Ripple as one of the most institutionally credible crypto-native entities in the U.S. banking framework.
Ripple National Trust Bank’s conditional approval enables the company to operate as a federally regulated fiduciary, custody client assets under federal oversight, and integrate RLUSD – its stablecoin – and XRP-denominated products within U.S. banking infrastructure.
The remaining conditions – robust risk controls, compliance systems, AML and KYC procedures, and capital adequacy thresholds – must be satisfied before full operations begin. Commentator Xaif noted the rule’s potential to enable federal-level digital asset custody services for Ripple once those restrictions lift, framing it as infrastructure rather than just licensing.
"The digital marketplace is important to the future, and Ripple is the right partner to take us there." — Eddie Gonzalez, President, i-payout — Ripple (@Ripple) March 16, 2026
Ripple Payments helps i-payout deliver real-time payouts into the U.S. & Canada, from days to seconds. 
See how →… pic.twitter.com/WWNmJc9utQ
Ripple has also applied for a Fed master account, which would give it direct access to Federal Reserve payment rails – the same access Kraken recently received approval for.
Analysts tracking XRP’s institutional adoption narrative have flagged the Fed master account as the variable that converts national trust bank status into full-stack banking capability. The Bank Policy Institute, representing JPMorgan, Goldman Sachs, and Citigroup, is reportedly weighing a lawsuit against the OCC over crypto firm charters – a sign that incumbent banks view these approvals as competitive threats, not bureaucratic formalities.
Explore: Best Crypto Projects With High Growth Potential in 2026
The post Ripple XRP Nears National Bank Status as OCC Rule Takes Effect April 1 appeared first on Cryptonews.
TLDR
- Gnosis, Zisk, and the Ethereum Foundation launched the Ethereum Economic Zone at EthCC 2026 in Cannes.
- The framework aims to connect more than 20 Ethereum layer two networks under a unified structure.
- The Ethereum Economic Zone enables synchronous smart contract calls across rollups and the mainnet.
- The system uses ETH as the default gas token and removes separate bridge requirements.
- Early partners include Aave, Centrifuge, and a Swiss-based EEZ Alliance.
The Ethereum Economic Zone launched on March 29 at EthCC in Cannes to address layer-2 fragmentation. Gnosis, Zisk, and the Ethereum Foundation introduced the rollup framework at the Palais des Festivals. The initiative aims to unify liquidity and restore synchronous composability across the Ethereum mainnet and participating rollups.
Ethereum Economic Zone framework targets L2 fragmentation
Gnosis, Zisk, and the Ethereum Foundation presented the Ethereum Economic Zone during EthCC 2026 in Cannes. They introduced a rollup framework that connects multiple layer-2 networks under a shared structure. The project seeks to reduce fragmentation across more than 20 operational Ethereum L2s.
Those networks currently secure about $40 billion in assets but operate as isolated systems. Each L2 maintains separate liquidity pools, deployments, and bridge infrastructure. As a result, users and developers navigate disconnected environments.
Gnosis co-founder Friederike Ernst addressed this issue during the conference. She said, “Ethereum doesn’t have a scaling problem. It has a fragmentation problem.” She added that each new L2 creates another isolated liquidity pool and bridge.
The Ethereum Economic Zone enables smart contracts to perform synchronous calls across rollups and the mainnet. It allows atomic transactions that execute across networks within a single process. The framework also uses ETH as the default gas token.
Developers can remove separate bridge protocols under this structure. The system keeps security anchored to Ethereum’s base chain. Project backers said the design restores composability between rollups.
Zisk developer Jordi Baylina joined Ernst during the presentation. They described the framework as aligned with Ethereum’s scaling roadmap. The collaboration receives co-funding from the Ethereum Foundation.
Zisk CEO Maria Roberts spoke during the event. She said, “The zone will facilitate a new era of blockchain innovation.” She added that developers can integrate existing applications into the framework “pretty easily.”
Conference highlights institutional focus and market data
Early partners include Aave, Centrifuge, and a Swiss-based EEZ Alliance. Organizers confirmed these groups joined at launch. Coverage from The Block and CoinDesk reported their participation.
Ethereum’s shift toward cheaper L2 networks has reduced mainnet fee revenue. ETH trades near $2,000 according to recent market data. The network secures about $53 billion in DeFi total value locked.
Stablecoins on Ethereum account for about $163 billion in value. Market data cited by Phemex outlined these figures. Organizers positioned EEZ as a structural upgrade for capital flow efficiency.
EthCC organizers described 2026 as “the year of professionalisation of Ethereum and the wider crypto ecosystem.”
The conference relocated to Cannes for this edition. The event featured institution-focused forums.
Kaiko launched its Agora forum during the conference. Organizers said the forum targets professional market participants. They highlighted infrastructure and market structure discussions.
Separate reporting referenced Kaiko’s findings on market structure gaps. One report stated that an Alameda trading gap still exists. The conference sessions addressed transparency and liquidity topics.
The Ethereum Economic Zone framework officially went live during EthCC. Project representatives confirmed that onboarding discussions continue with other L2 teams. The launch took place on March 29 at the Palais des Festivals in Cannes.
By Omkar Godbole (All times ET unless indicated otherwise)
As the new quarter gets underway, the crypto market is sending a subtle but important signal: traders seem a bit more cautious about bitcoin than ether (ETH).
You can see this in the options market, where more experienced traders and institutions go to hedge risk or generate extra returns. Think of options as a kind of insurance. Traders can buy protection against price drops (puts) or bet on price increases (calls), depending on their outlook.
Right now, one key metric, called a risk reversal, is negative for both bitcoin and ether across different time frames. In simple terms, that means puts, or downside protection, is more expensive than bullish bets. When traders are willing to pay more for put options, it usually signals lingering fears of a price drop. That’s perfectly normal, considering the brutal downtrend in bitcoin and ether since October.
But here’s where it gets interesting: that caution is stronger for bitcoin. Put options on bitcoin are more expensive than those on ether across all time frames, suggesting traders are more worried about BTC’s downside risk.
The difference becomes even clearer when zooming further out. Longer-dated ether options, such as those expiring next March, are only slightly bearish, while bitcoin’s equivalent options carry a much steeper premium for downside protection.
In short, the market is betting that ether will be relatively resilient. That would signal a bullish trend change in the ether-to-bitcoin ratio, which has been in a downtrend since August (see the technical analysis section).
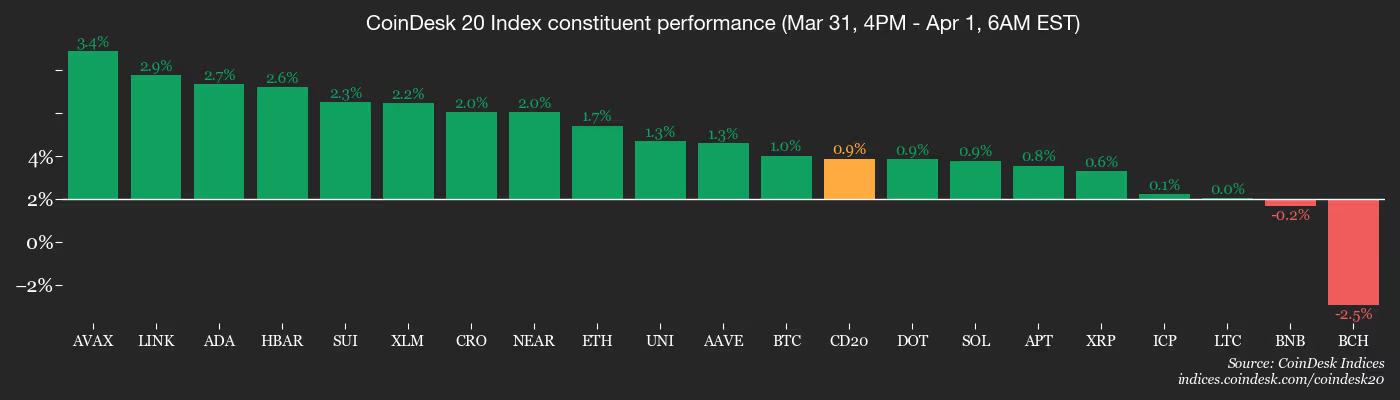
Ether has risen 5% over the past 24 hours, outpacing bitcoin , XRP (XRP), solana (SOL), and the CoinDesk 20 Index. Several smaller tokens associated with quantum-computing-resistant technology have rallied by 20% or more.
Analysts said a firm breakout in BTC above its 50-day moving average of $68,680 will likely strengthen the bullish momentum.
In traditional markets, the 10-year U.S. Treasury yield fell for the fourth straight day while futures tied to the Nasdaq and S&P 500 rose nearly 0.5%. Together, these things point to risk-on sentiment ahead. Stay alert
Read more: For analysis of today’s activity in altcoins and derivatives, see Crypto Markets Today
What to Watch
For a more comprehensive list of events this week, see CoinDesk’s “Crypto Week Ahead“.
- Crypto
- Macro
- April 1, 8:15 a.m.: U.S. ADP Employment Change for March (Prev. 63K)
- April 1, 10:00 a.m.: U.S. ISM Manufacturing PMI for March (Prev. 52.4)
- Earnings (Estimates based on FactSet data)
Token Events
For a more comprehensive list of events this week, see CoinDesk’s “Crypto Week Ahead“.
- Governance votes & calls
- Unlocks
- Token Launches
- April 1: Orexn (OXN) enters a phased exchange listing period after the token generation event.
Conferences
For a more comprehensive list of events this week, see CoinDesk’s “Crypto Week Ahead“.
Market Movements
- BTC is up 0.61% from 4 p.m. ET Wednesday at $68,622.64 (24hrs: +3.34%)
- ETH is up 1.47% at $2,136.90(24hrs: +5.27%)
- CoinDesk 20 is up 0.62% at 1,968.28 (24hrs: +3.62%)
- Ether CESR Composite Staking Rate is unchanged at 2.76%
- BTC funding rate is at 0.0033% (3.5193% annualized) on Binance

- DXY is down 0.37% at 99.59
- Gold futures are up 1.5% at $4,748.80
- Silver futures are down 0.69% at $74.40
- Nikkei 225 closed up 5.24% at 53,739.68
- Hang Seng closed up 2.04% at 25,294.03
- FTSE is up 1.63% at 10,342.45
- Euro Stoxx 50 is up 1.75% at 5,667.09
- DJIA closed on Tuesday up 2.49% at 46,341.51
- S&P 500 closed up 2.91% at 6,528.52
- Nasdaq Composite closed up 3.83% at 21,590.63
- S&P/TSX Composite closed up 2.61% at 32,768.04
- S&P 40 Latin America closed up 4.26% at 3,623.86
- U.S. 10-Year Treasury rate is down 3.2 bps at 4.279%
- E-mini S&P 500 futures are up 0.33% at 6,592.25
- E-mini Nasdaq-100 futures are up 0.48% at 24,030.25
- E-mini Dow Jones Industrial Average Index futures are up 0.36% at 46,750.00
Bitcoin Stats
- BTC Dominance: 58.72% (-0.04%)
- Ether-bitcoin ratio: 0.03111 (0.89%)
- Hashrate (seven-day moving average): 1,004 EH/s
- Hashprice (spot): $32.37
- Total fees: 2.47 BTC / $166,441
- CME Futures Open Interest: 104,900 BTC
- BTC priced in gold: 14.5 oz.
- BTC vs gold market cap: 4.58%
Technical Analysis

- The chart shows daily swings in the ether-bitcoin ratio in the candlestick format.
- The ratio has been trending lower since August, showcasing ether underperformance relative to bitcoin. This downtrend is represented by the yellow line that connects the steady decline over seven months.
- The outlook would flip bullish if the ratio rises past this trendline. Such a move would confirm renewed investor preference for ether, as suggested by the options market.
Crypto Equities
- Coinbase Global (COIN): closed on Tuesday at $174.61 (+8.60%), +1.80% at $177.75 in pre-market
- Circle Internet (CRCL): closed at $95.41 (+6.12%), +2.69% at $97.98
- Galaxy Digital (GLXY): closed at $18.45 (+7.58%), +1.94% at $18.81
- Bullish (BLSH): closed at $35.73 (+7.39%), +0.95% at $36.07
- MARA Holdings (MARA): closed at $8.16 (+4.62%), +1.35% at $8.27
- Riot Platforms (RIOT): closed at $12.36 (+4.48%), +2.35% at $12.65
- Core Scientific (CORZ): closed at $14.96 (+7.55%), -0.40% at $14.90
- CleanSpark (CLSK): closed at $8.51 (+4.03%), +2.12% at $8.69
- CoinShares Valkyrie Bitcoin Miners ETF (WGMI): closed at $34.82 (+7.70%), +1.81% at $35.45
- Exodus Movement (EXOD): closed at $6.50 (+4.84%), -0.92% at $6.44
Crypto Treasury Companies
- Strategy (MSTR): closed at $124.80 (+2.77%), +1.48% at $126.65
- Strive (ASST): closed at $10.02 (+6.94%), +1.90% at $10.21
- SharpLink Gaming (SBET): closed at $6.45 (+7.32%), +2.02% at $6.58
- Upexi (UPXI): closed at $0.99 (+3.90%), +6.49% at $1.05
- Lite Strategy (LITS): closed at $1.16 (+11.54%)
ETF Flows
Spot BTC ETFs
- Daily net flow: $117.5 million
- Cumulative net flows: $56.09 billion
- Total BTC holdings ~ 1.29 million
Spot ETH ETFs
- Daily net flow: $31.2 million
- Cumulative net flows: $11.59 billion
- Total ETH holdings ~ 5.70 million
Source: Farside Investors
While You Were Sleeping
Trump says Iran war could end in ‘two weeks’, with or without deal (euronews): Trump, who will address the nation Wednesday night, said the war in Iran could end in two to three weeks. However, Israeli Prime Minister Benjamin Netanyahu said its war on Tehran will continue.
Iran fires missiles across Middle East as Trump signals exit (Bloomberg): Iran fired missiles across the Middle East while Israel and the U.S. kept up their bombardment of the Islamic Republic, even as Trump fueled market optimism by signaling he’s preparing to end the war.
UAE wants to force Hormuz open and is willing to join the fight (The Wall Street Journal): The UAE is preparing to help the U.S. and other allies open the Strait of Hormuz by force, Arab officials said, a move that would make it the first Persian Gulf country to join the war.
Crypto asset manager CoinShares to list on Nasdaq after $1.2 billion SPAC deal (CoinDesk): CoinShares, a leading European digital asset manager with over $6 billion under management, is set to begin trading on the Nasdaq Stock Market under the ticker symbol CSHR.

Megan Thee Stallion Speaks, More Revealed About Hospitalization

Arsenal, Chelsea, Man City? Joe Cole reveals his pick to win the FA Cup | Football

Eli Lilly GLP-1 pill Foundayo approved for obesity


-

 News Videos7 days ago
Parliament publishes latest register of MPs’ financial interests
-

 Business6 days ago
Instagram, YouTube Found Responsible for Teen’s Mental Health Struggle in Historic Ruling
-
 Tech6 days ago
Intercom’s new post-trained Fin Apex 1.0 beats GPT-5.4 and Claude Sonnet 4.6 at customer service resolutions
-

 NewsBeat5 days ago
The Story hosts event on Durham’s historic registers
-

 Sports5 days ago
Sweet Sixteen Game Thread: Tide vs Michigan
-
Entertainment2 days ago
Fans slam 'heartbreaking' Barbie Dream Fest convention debacle with 'cardboard cutout' experience
-
 Entertainment4 days ago
Lana Del Rey Celebrates Her Husband’s 51st Birthday In New Post
-
Crypto World1 day ago
Dems press CFTC, ethics board on prediction-market insider trades
-

 Sports1 day ago
Tallest college basketball player ever, standing at 7-foot-9, entering transfer portal
-

 Tech3 days ago
The Pixel 10a doesn’t have a camera bump, and it’s great
-

 Entertainment7 days ago
HBO’s Harry Potter Series Will Definitely Fail For One Big Reason, And It’s Not J.K. Rowling Or Snape
-

 Crypto World2 days ago
U.S. rule change may open trillions in 401(k) funds to crypto
-

 Tech1 day ago
How to back up your iPhone & iPad to your Mac before something goes wrong
-

 Fashion6 days ago
En Vogue in Brown Leather and Tailored Neutrals by Atelier Savoir, Styled by J Bolin
-

 Politics2 days ago
Should Trump Be Scared Strait?
-

 Tech1 day ago
EE TV is using AI to help you find something to watch
-

 Fashion6 days ago
What Are Your Favorite T-Shirts for the Weekend?
-

 Fashion5 days ago
Weekly News Update, 3.27.26 – Corporette.com
-

 Tech2 days ago
Apple will hide your email address from apps and websites, but not cops
-

 Tech2 days ago
Flipsnack and the shift toward motion-first business content with living visuals
You must be logged in to post a comment Login