
Crypto World
CFTC asks judge to dismiss CME lawsuit over crypto perpetual futures

The regulator claims the dispute is “much ado about nothing,” noting that the order allows any designated contract market, including CME, to list these products.



The third-wave Coldcard exploiter moved about 10% of stolen funds through THORChain as researchers traced the assets to a new Ethereum address.
Uniswap price has doubled since August 14, and the money comes from an unexpected place. Robinhood Chain, the network Robinhood launched on Arbitrum in July, now generates two thirds of everything Uniswap earns.
The original Robin Hood took from the rich and gave to the poor. This one takes from the chain it was built on and pays a protocol that has found it hard to keep its revenue.
Robinhood’s Record Month Ran on Uniswap
Robinhood Chain traded $17.99 billion in August, 26% more than July, per DefiLlama’s Robinhood Chain data, and September 1 was its biggest single day yet.
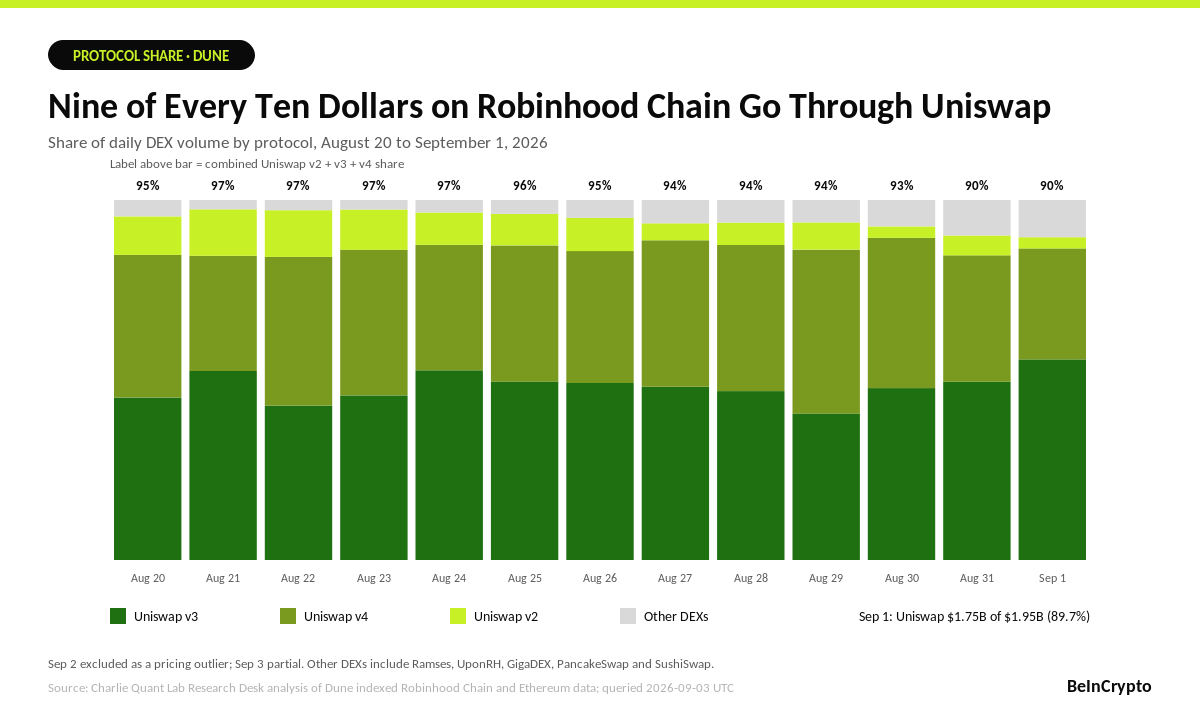
Almost all of it was Uniswap. On September 1, $1.75 billion of the chain’s $1.95 billion passed through Uniswap pools, per Dune, so nearly every new dollar on the chain is a new dollar of Uniswap fees.

The number of traders barely changed. Wallets rose 22% since August 1 while volume rose 7.9 times, so each is trading about six times more.

Existing users are putting more money to work, and since Uniswap earns a percentage of each trade, that deepening interest is worth more to it than a rush of new wallets.
So who collects those fees?
Taking From Arbitrum, Paying Uniswap?
Not the chain’s landlord. Robinhood Chain is an Arbitrum Orbit chain, meaning Robinhood built it with Arbitrum’s technology and in return hands Arbitrum 10% of the chain’s net revenue, which came to $1.32 million in 30 days.
Uniswap, the exchange where the trading happens, collected $78.73 million in trading fees there over the same period. That is 60 times Arbitrum’s share, and 66% of everything Uniswap earned across 47 chains. Arbitrum gets paid for lending the technology. Uniswap gets paid every time someone trades.

The DeFi protocol also earns more per dollar there, charging 0.465% of each dollar traded on Robinhood Chain against 0.214% globally, because Robinhood swaps land in higher fee tiers. In the two highest Uniswap v4 tiers, they paid 84 and 351 basis points against 45 and 241 on Ethereum, per Dune indexed data.

Those tiers are where tokenized stocks trade, and their share of volume rose from under 0.1% in mid August to 4.1% on September 1. More volume at a higher rate means more fees.
The Weakness Robinhood Is Fixing
More fees matter because keeping them is where Uniswap falls short. Of $119.3 million in 30-day fees, only $9.45 million, or 7.9%, reached UNI holders through the burn approved last December. Aerodrome, the largest exchange on Base, passes 70% to holders. GMGN, a Solana meme coin trading app, passes 82%.

Robinhood does not raise that 7.9%. It raises the fee total the 7.9% is taken from. Robinhood Chain’s volume grew 26% in August, and Uniswap charges double its usual rate there. Therefore, every dollar traded on the chain produces more Uniswap fee than a dollar traded elsewhere.
A fixed 7.9% of a larger fee total means more money spent buying and burning UNI, and fewer UNI left in circulation.

That is the revenue story whale wallets bought with 257,777 UNI as September opened, and the price was already moving on it.
Uniswap Price Action: A Flag After a 100% Pole
Uniswap trades at $5.73, down 2.1% day-on-day, after a 100% run from $3.16 on August 14 to $6.38. The pullback looks like a bull flag, which usually resolves upward.

Volume agrees. Buying rose into the peak, and selling has stayed below August 24 levels since.
A daily close above $6.20 confirms the flag and opens $7.06, 23% higher. Below $5.67 the flag fails, and a break under $4.35 erases the setup.

Analyst’s View: Robinhood did not set out to rescue Uniswap, but the money says it has. While Robinhood’s volume keeps climbing, UNI has a revenue story it never had before. The chart says the market is still deciding whether to believe it.
The post Uniswap (UNI) Price Surges 100%, and One Chain Playing ‘Robin Hood' Explains Why appeared first on BeInCrypto.
B HODL stock has climbed 67% in a month. It announced buying 1 BTC on Thursday, lifting its treasury to 167.487 BTC.
The company trades on the Aquis Stock Exchange, a small London venue for growth companies. It part-funded the purchase by completing its second at-the-market (ATM) equity programme, with its Capital Deployment Programme covering the rest.
B HODL Stock Climbs While the Bitcoin Cost Basis Stays Underwater
The company paid £57,680, or about $77,772, for the coin. Its average cost sits near $110,129 per Bitcoin, so the treasury stays roughly 29% under water.
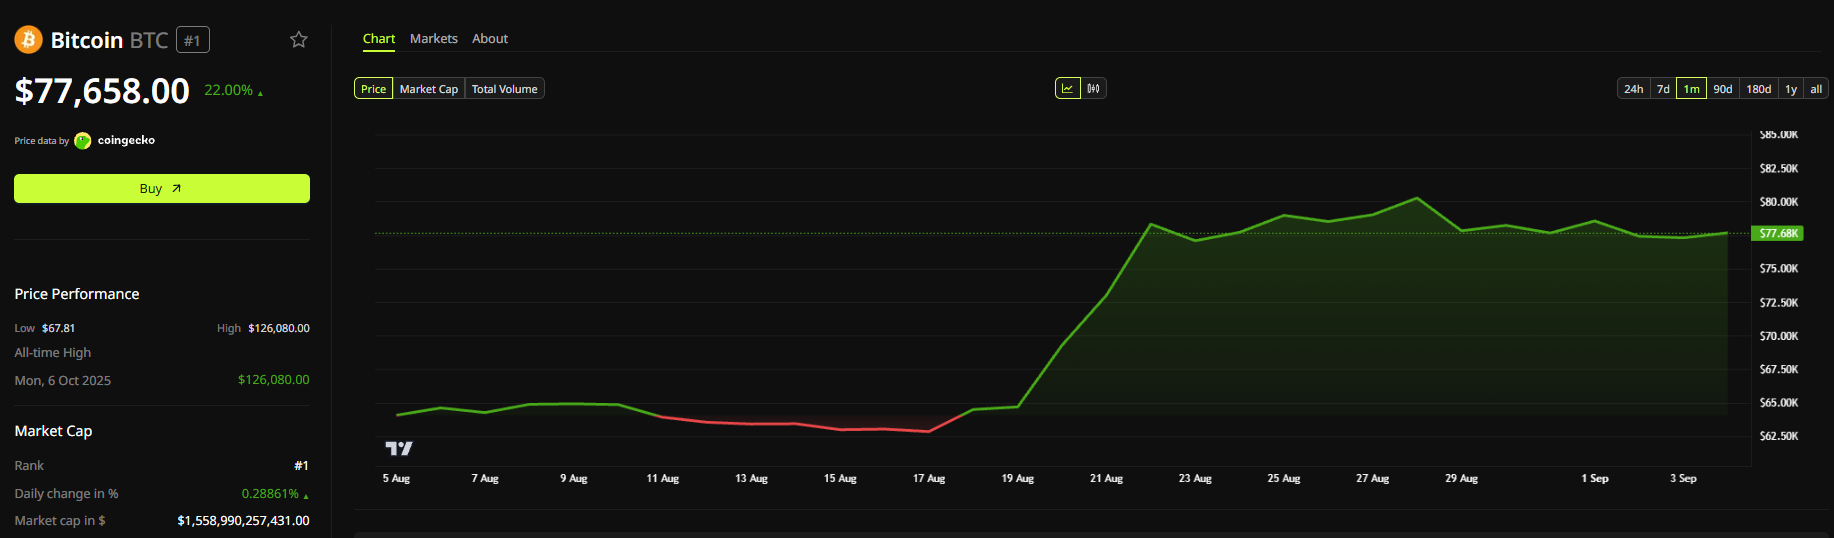
Bitcoin (BTC) traded near $77,658 on Thursday, up 0.3% on the day. The coin has gained 22% in a month, so B HODL stock tripled that pace.
Sats per share climbed to 120.16 from 117.77 at the end of April. That number matters because dilution only pays when each share ends up holding more Bitcoin.
An ATM programme drip-feeds small share tranches into the open market, and MicroStrategy pioneered the tool. B HODL raised about £48,300, or roughly $65,000, selling 600,000 shares at an average 8.06 pence. The Capital Deployment Programme made up the difference.
The scale differs wildly from MicroStrategy’s billion-dollar raises, yet the mechanism is identical. Several peers cannot sell equity at all, because their stock trades below Bitcoin they already own.

Adam Back Endorses the MicroStrategy Model
Adam Back, the Blockstream chief executive, endorsed the approach.
He also backs European treasury vehicles directly, funding a Capital B raise worth €7.6 million on Wednesday.
The rally, however, arrived before the news. HODL closed Wednesday at 8.84p, up 4% on the day, after an 11.11% jump on Tuesday.

MicroStrategy still sets the benchmark. Michael Saylor said his firm holds more reserve capital than every S&P 500 financial except Berkshire Hathaway, pointing to 845,050 Bitcoin.
That claim rests on a metric MicroStrategy designed itself, however, and MSTR slipped 2.1% on Wednesday.
Analysts called treasury stocks a textbook bubble chart in June, and market net asset value (mNAV) pressure has persisted since.
B HODL, however, keeps clearing that bar. ATM 2 delivered roughly 135 sats for each new share, comfortably above the 120.16 average.
Issuing above that line leaves holders owning more Bitcoin per share, not less. ATM 3 opens on about September 8 with the same test attached.
The post B HODL Stock Surges 67% in a Month on MicroStrategy Bitcoin Playbook appeared first on BeInCrypto.
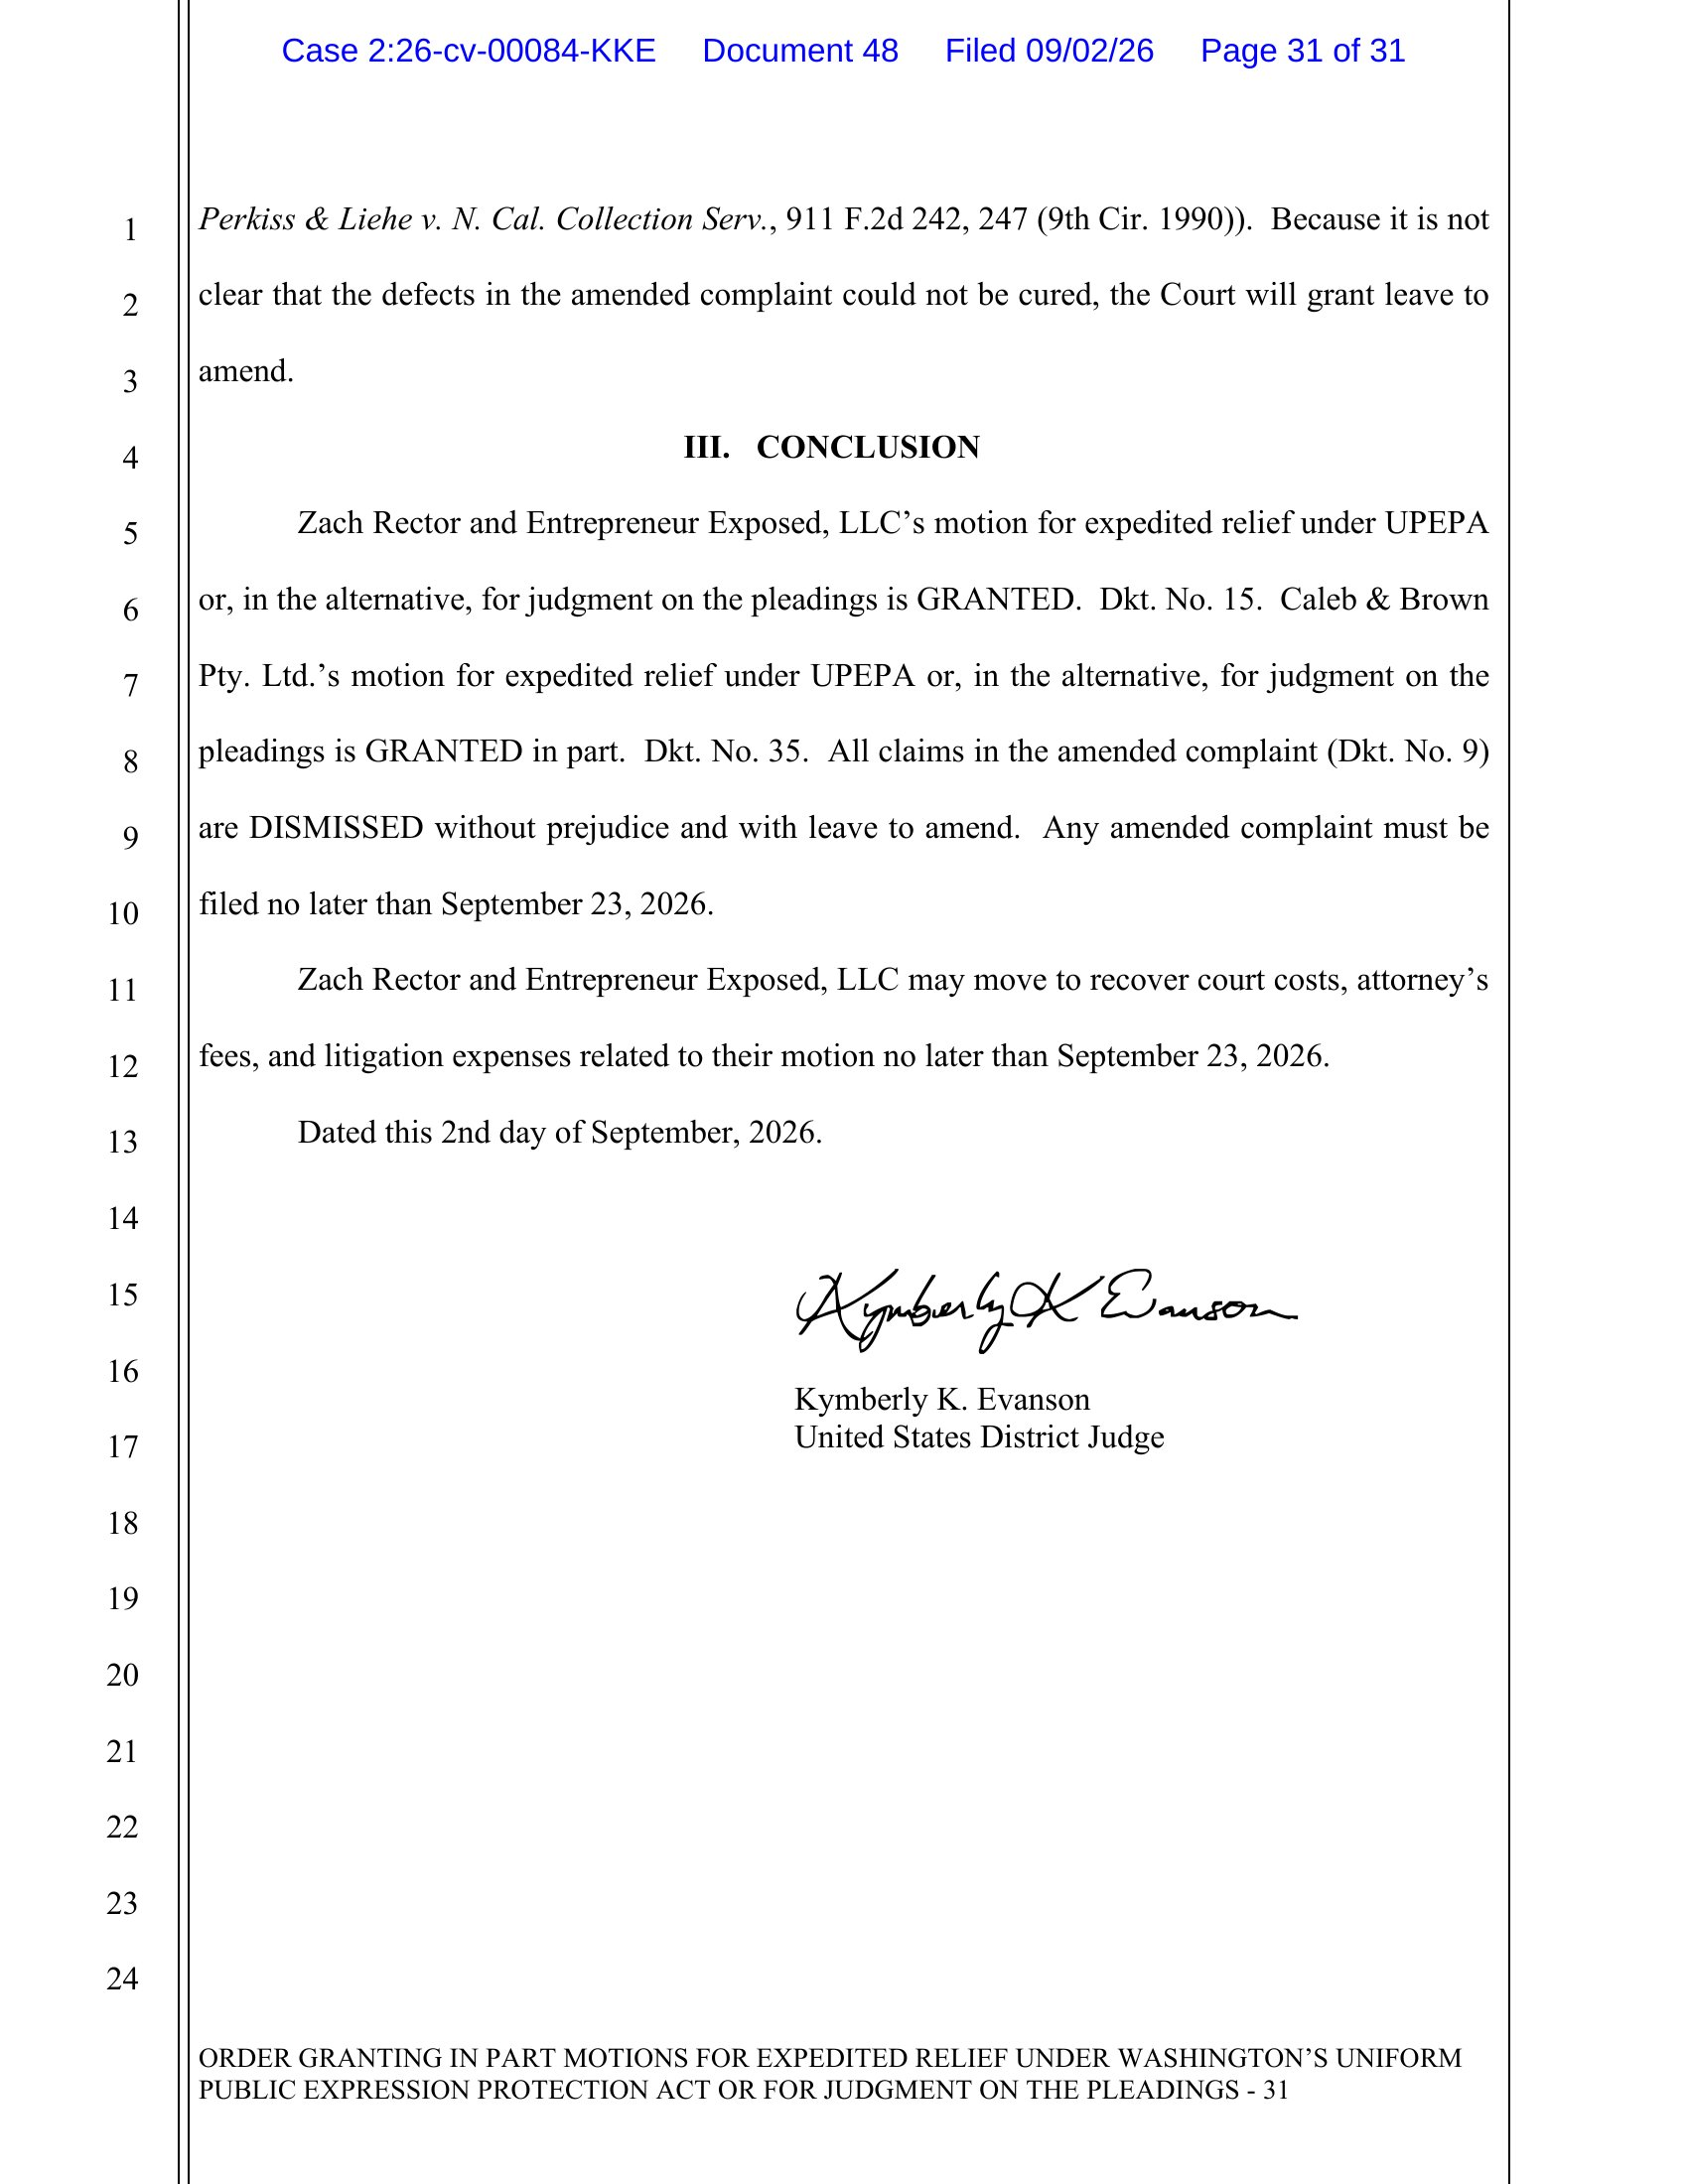
A federal judge in Washington dismissed a defamation lawsuit filed by XRP-focused influencer Jake Claver against content creator Zach Rector on September 2.
The court ruled that Rector’s 2025 videos about Claver’s businesses contained no actionably false statements.
What Rector’s Videos Actually Referenced
The dismissed lawsuit centered on three videos Rector posted alleging misconduct tied to Claver’s Digital Ascension Group and Digital Wealth Partners, according to reports on X. Those videos drew directly on Claver’s own admissions in a separate New York lawsuit filed by payments processor Verivend Inc.
In that case, Claver acknowledged fabricating emails, wire transfer confirmations, and a screenshot of a Verivend wallet dashboard showing a false balance exceeding $1 million, according to court documents.
Court filings also show Jake Claver admitted to impersonating Verivend employees on multiple occasions to generate fake email threads.
Judge Kymberly K. Evanson granted Rector’s motion under Washington’s Uniform Public Expression Protection Act, the state’s anti-SLAPP law designed to protect speech on matters of public concern.
“We may not agree with each other sometimes, but for Jake Claver to sue Zach Rector, a fellow XRP community voice, turning price‑call criticism into a $30m federal fight, only to be told the speech was protected, reflects more on the plaintiff than on the videos…,” one user said on X.
Follow us on X to get the latest news as it happens.

The court dismissed all of Claver’s claims, including defamation, tortious interference, conspiracy, and breach of contract, without prejudice. Evanson also ruled that Rector is entitled to recover his attorneys’ fees and litigation costs. Claver has until September 23 to file an amended complaint.
Rector confirmed the ruling directly, saying the court found no false statement in his videos and that he is entitled to recover his fees because Claver’s suit targeted his free speech rights on a matter of public concern.
A Familiar Pattern in Crypto Defamation Cases
This is not the first time a prominent crypto influencer’s defamation claim against a critic has collapsed. In 2022, BitBoy Crypto founder Ben Armstrong sued fellow YouTuber Erling Mengshoel Jr., known as Atozy, over a video accusing him of promoting a failed token.
Armstrong voluntarily withdrew the case within weeks after Atozy crowdfunded more than $200,000 for his defense, as public backlash mounted. Unlike Claver’s case, no judge ever ruled on it, so it set no formal legal precedent.
Subscribe to our YouTube channel to watch leaders and journalists provide expert insights.
Still, both episodes illustrate a recurring dynamic in the crypto space: defamation suits filed against outspoken critics have repeatedly struggled to survive public and legal scrutiny, often ending in withdrawal or dismissal rather than victory for the plaintiff.
The ruling drew a strong reaction within the XRP community online, with several observers characterizing it as a clear vindication of Rector’s reporting and a warning against using defamation claims to suppress criticism within the space.
The post Federal Judge Dismisses XRP Influencer's Defamation Suit: What Does It Mean? appeared first on BeInCrypto.
Following the latest escalation in the Middle East war, bitcoin’s price dipped toward $76,000 yesterday for the first time in almost two weeks before rebounding today.
Most larger-cap alts have posted some gains over the past day, with XRP climbing to over $1.35 and BNB tapping $700. ETH still fights for $2,400.
BTC Rebounds
The breakout from a couple of weeks ago drove the primary cryptocurrency from under $65,000 toward $80,000 within days. After hitting some resistance there at first, BTC finally managed to surge past that level last week, jumping to $81,200 and $81,500 on a couple of occasions.
However, the bulls were too exhausted and couldn’t continue driving the asset north. Instead, bitcoin dropped to $77,000 last Friday after Kevin Warsh’s hawkish speech at Jackson Hole.
Nevertheless, the cryptocurrency managed to recover some ground during the weekend and touched $79,000 on Sunday. It dipped back down to $77,000 on Monday after the strikes in the Middle East resumed, rebounded to $79,000 and closed the month in the green, and dropped once again yesterday to $76,200 – its lowest price tag in 10 days.
Nevertheless, that level provided the necessary support, and BTC now trades close to $78,000. Its market capitalization on CMC is up to $1.560 trillion, while its dominance over the alts stands still at 59.6%.

ARB Rockets
Arbitrum’s native token is today’s top performer, having surged by 18.5%. It now trades close to $0.14 after a 50% increase in the past week. NIGHT is next with an 11.5% pump, followed by CAKE (9%), APT (9%), LIT (8%), and PYTH (6.5%).
SUI and ADA have surged the most from the larger caps, both up by over 6% to $0.21 and $0.77. XRP has reclaimed the $1.35 support after a 2.7% daily increase. ETH fights for $2,400, while BNB is slightly above $700. SOL is back to $100, while TRX is up by just over 1%. In contrast, UNI has slumped by 6.5% after its recent rally, while SKY is down by almost 6%.
The total crypto market cap is up by $20 billion to $2.620 trillion on CMC.

The post ARB Skyrockets by Double Digits Again, BTC Recovers From Drop to $76K: Market Watch appeared first on CryptoPotato.
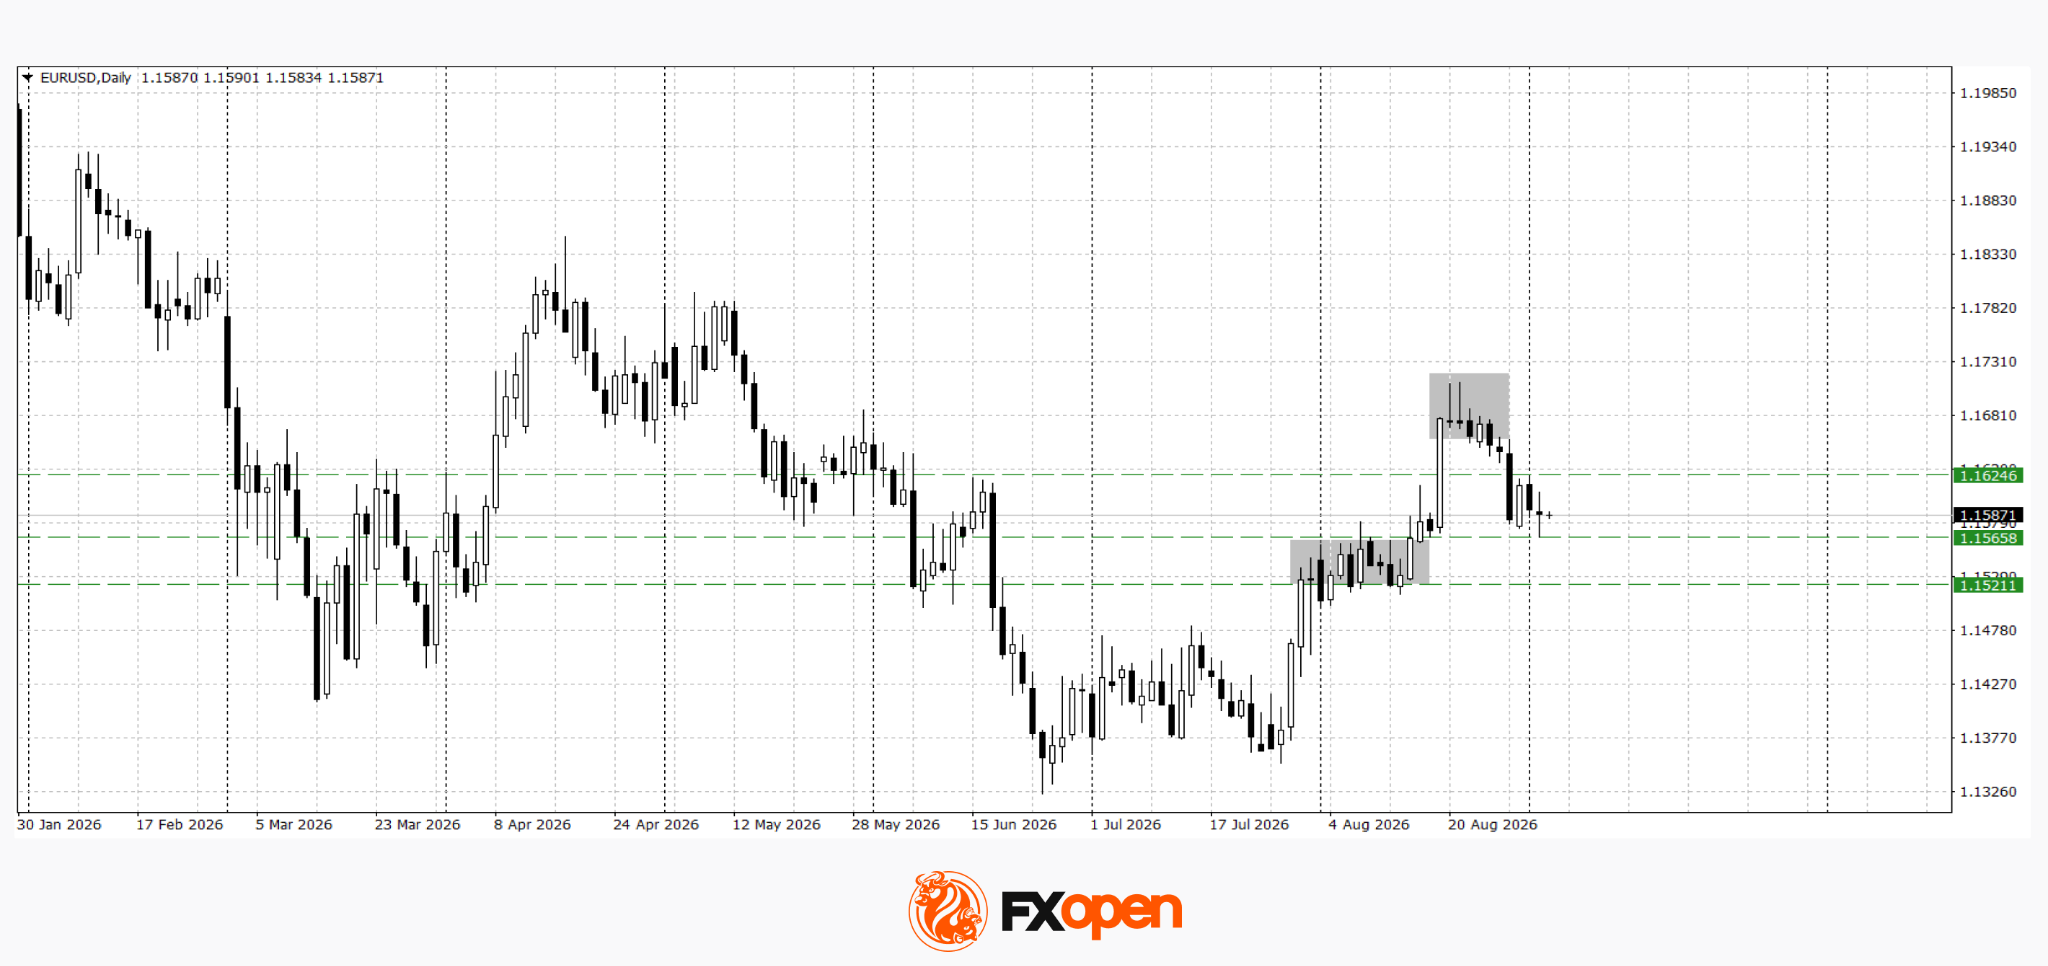
The euro and pound continue to decline, approaching important support levels amid a stronger US dollar. Further moves in EUR/USD and GBP/USD will depend on incoming macroeconomic data, particularly developments in the US labour market.
Today, market attention will focus on economic data from Europe and the US. In the eurozone, services-sector business activity indices will be released, with weaker readings potentially keeping pressure on the euro. In the US, weekly labour-market data will be published, while additional attention will be paid to comments from Federal Reserve representative Christopher Waller. However, tomorrow’s employment report will be the key market reference point. Following the weak ADP reading, further signs of a cooling labour market could strengthen expectations of a more accommodative Fed policy and put pressure on the dollar, while stronger figures could support further dollar gains.
For the pound, domestic data and signals from the Bank of England will provide an additional point of reference. Services-sector business activity figures will be in focus, along with a speech by Bank of England Governor Andrew Bailey, whose comments could influence expectations for the central bank’s future policy.
EUR/USD
As expected, EUR/USD has tested the important 1.1580–1.1620 support area. The decline has so far slowed near the upper boundary of the 1.1520–1.1560 range formed in August. Weak eurozone data could push EUR/USD further into this range. A return above 1.1620, followed by a sustained move above this level, would weaken the current bearish scenario and create conditions for a corrective recovery.
Key events for EUR/USD:
- today at 10:15 (GMT+3): Spain Services Purchasing Managers’ Index (PMI);
- today at 10:55 (GMT+3): Germany Composite Purchasing Managers’ Index (PMI);
- today at 15:30 (GMT+3): US initial jobless claims.
GBP/USD
GBP/USD continues to play out the bearish “tower” pattern described earlier. A sustained move below the important 1.3500 support level keeps the risk of further declines towards the 1.3400–1.3440 area. A rebound from this zone could trigger a corrective recovery, while the bearish scenario could be considered invalidated after a sustained move above 1.3560.
Key events for GBP/USD:
- today at 11:30 (GMT+3): UK Services Purchasing Managers’ Index (PMI);
- today at 17:00 (GMT+3): US ISM Non-Manufacturing Purchasing Managers’ Index;
- tomorrow at 11:50 (GMT+3): speech by Bank of England Governor Andrew Bailey.
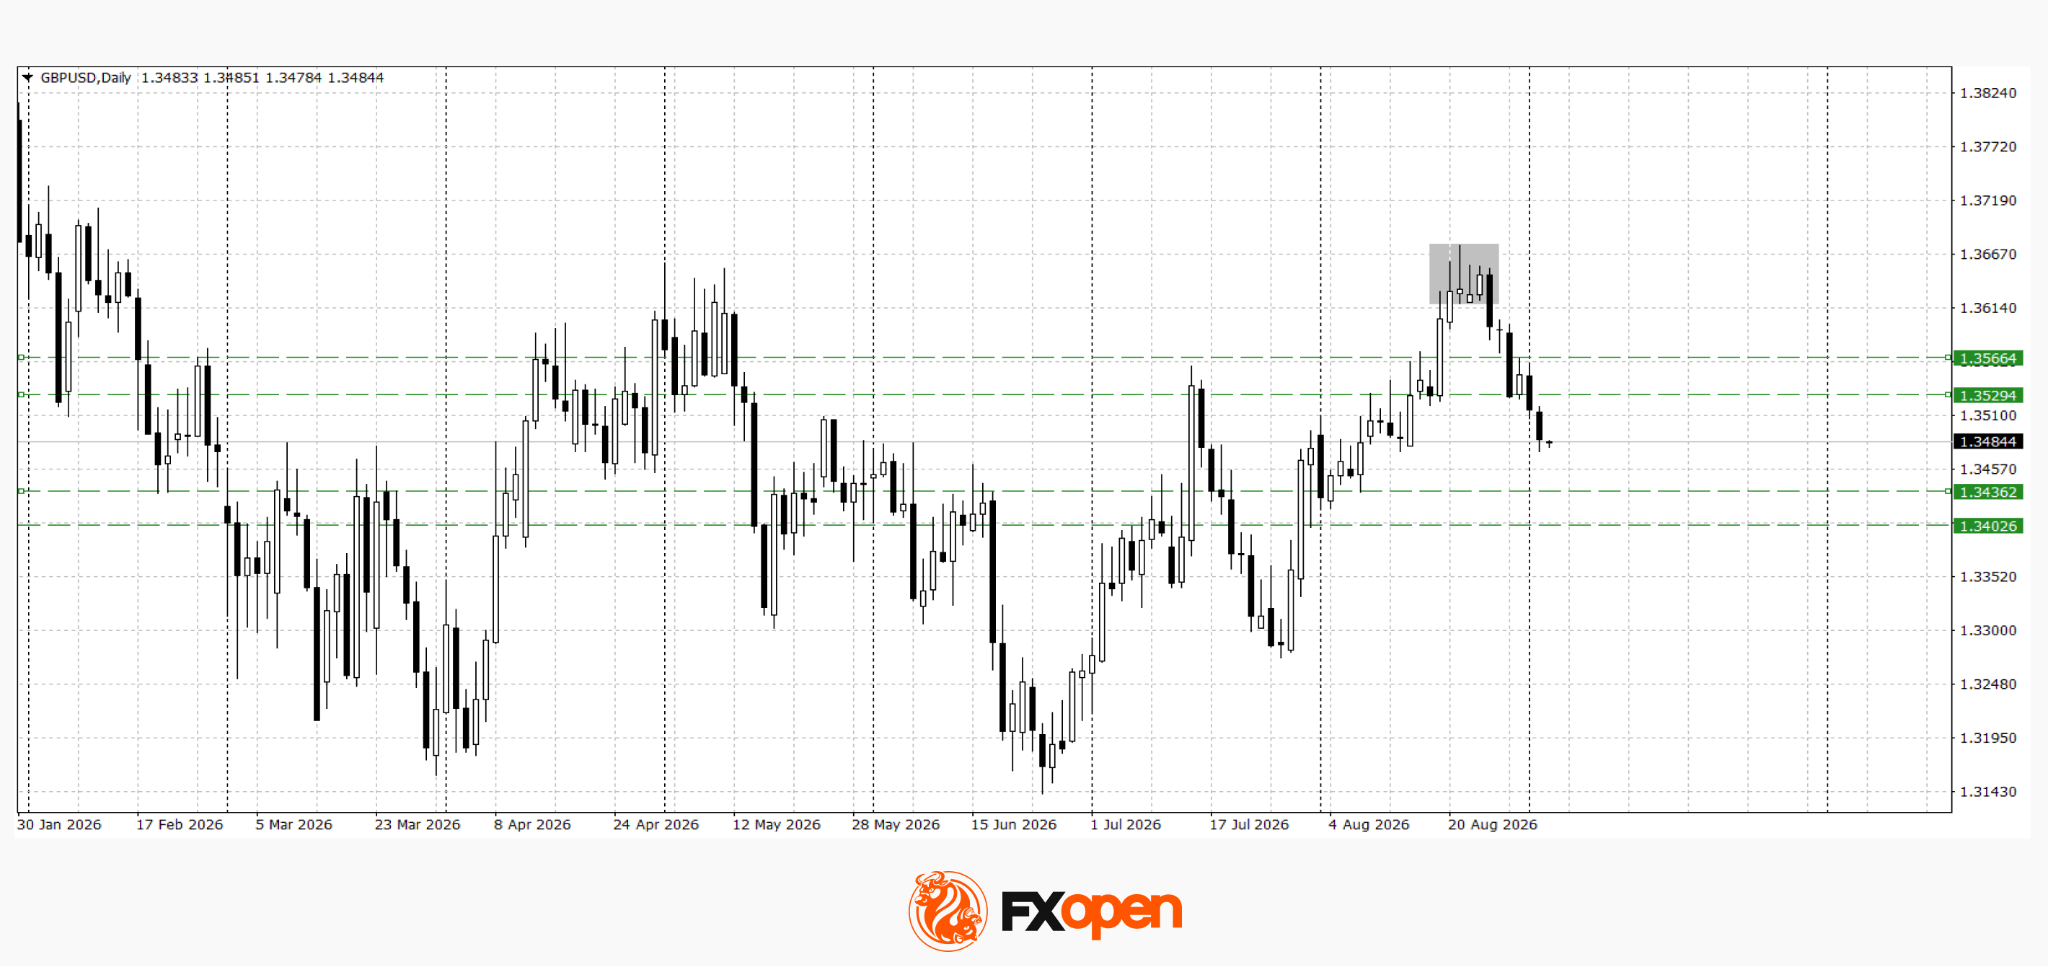
Overall, EUR/USD and GBP/USD remain in a downtrend near important support levels, although their further direction will depend on incoming macroeconomic data. Following the weak ADP report, tomorrow’s US employment report will be the key reference point. Further signs of cooling in the labour market could increase pressure on the dollar, while stronger figures could support further dollar gains and lead to continued declines in both currency pairs.
Trade over 50 forex markets 24 hours a day with FXOpen. Take advantage of low commissions, deep liquidity, and spreads from 0.0 pips (additional fees may apply). Open your FXOpen account now or learn more about trading forex with FXOpen.
This article represents the opinion of the Companies operating under the FXOpen brand only. It is not to be construed as an offer, solicitation, or recommendation with respect to products and services provided by the Companies operating under the FXOpen brand, nor is it to be considered financial advice.
On 26 August, Meta announced an agreement with a bipartisan group of 52 state and territorial attorneys general and the Attorney General of the District of Columbia. Under the agreement, the company will pay around $18 billion over ten years and introduce additional restrictions for underage Facebook and Instagram users, including a two-hour daily usage limit and an overnight app block from midnight to 6:00 am. Around $5.3 billion of this amount will only be payable if TikTok and YouTube implement similar measures and each pay a corresponding amount. Meta also expects to recognise around $10 billion in legal expenses in Q3 2026 in connection with the agreement.
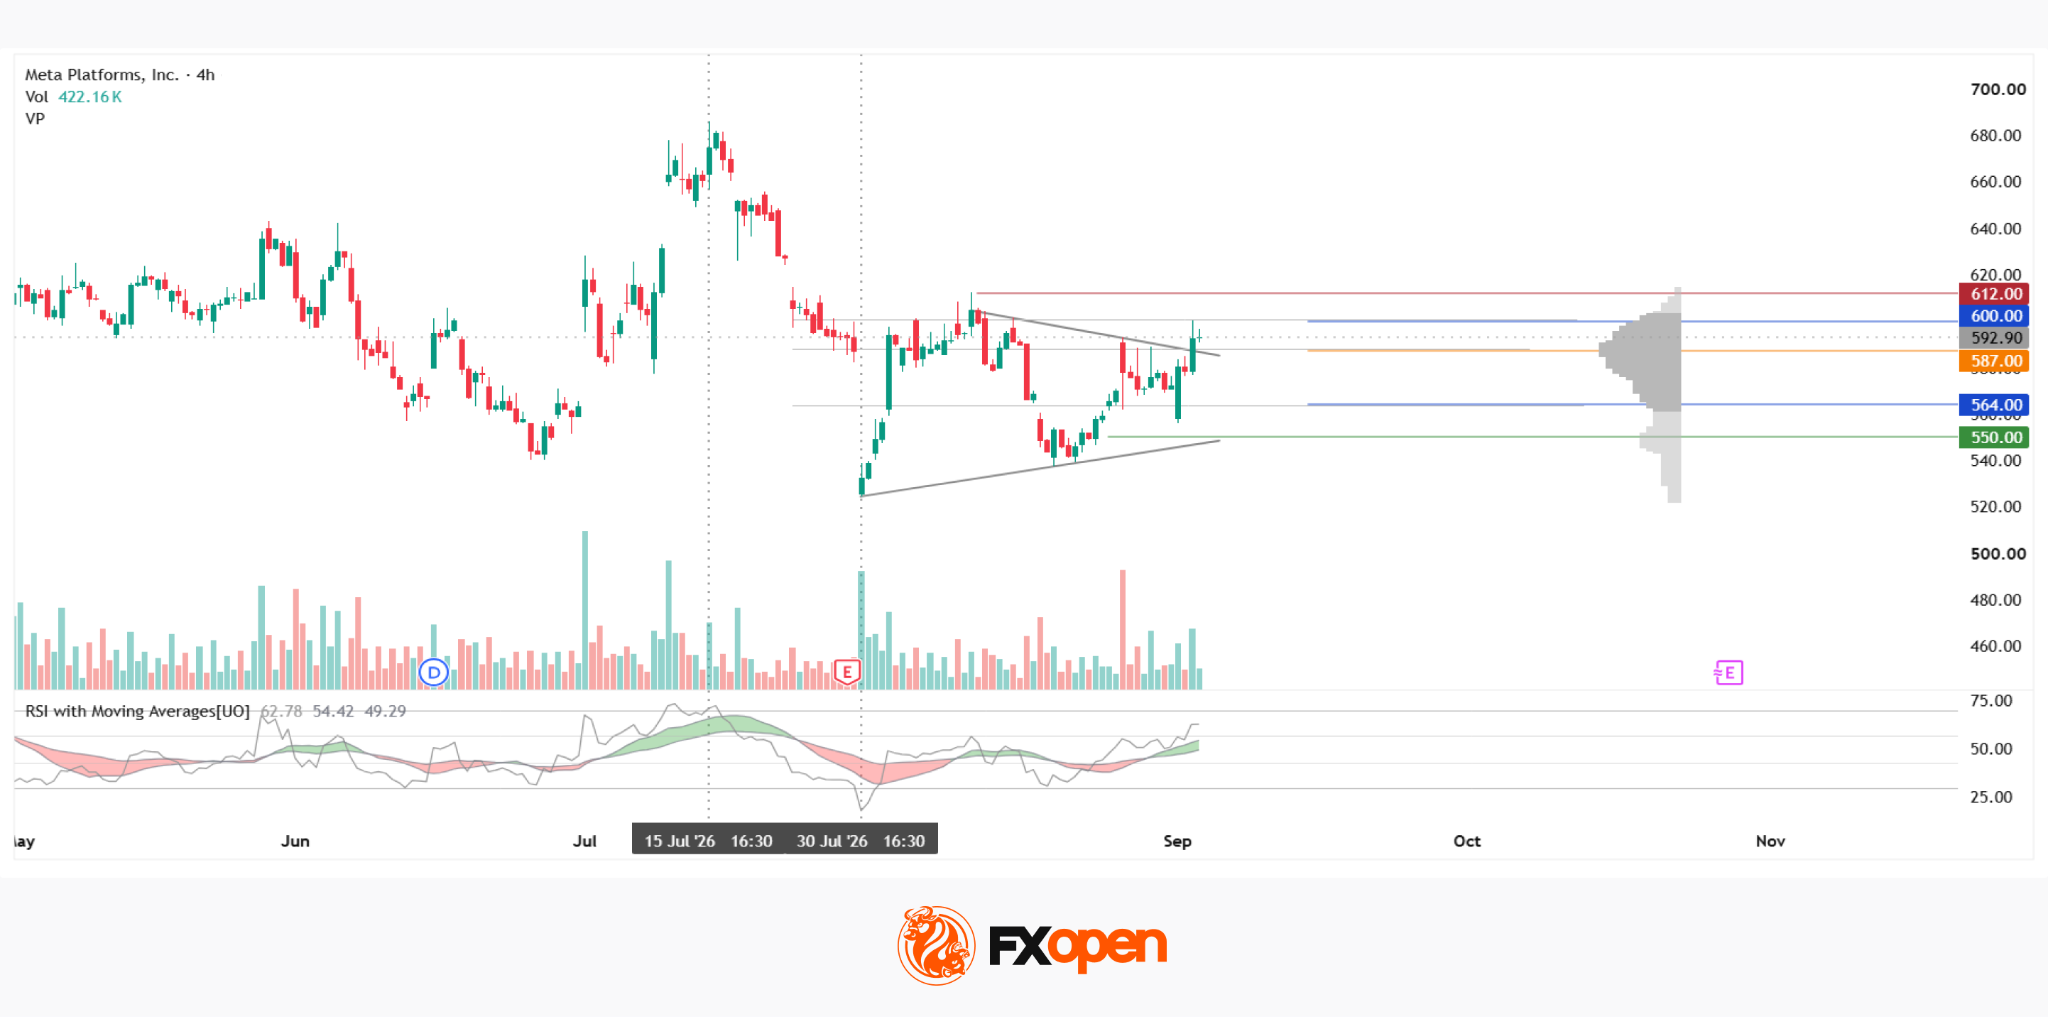
On the four-hour META chart, the medium-term picture remains range-bound, with the price continuing to move within a broad range between the 690 and 540 areas. Within this range, a short-term decline occurred between 15 and 30 July, during which a pattern resembling a converging triangle formed near the lower end of the move. The pattern’s boundaries progressively narrowed the amplitude of price fluctuations. However, the vertical volume profile throughout the pattern’s formation does not appear typical of this type of consolidation, raising questions about the technical integrity of the structure.
After breaking above the pattern’s upper boundary, the price remains within the current market profile and is now squeezed between the Point of Control (POC) at $587.00 and the upper boundary of the profile at $600.00, attempting to establish itself above the pattern. Red resistance is located around $612.00 and is relatively close to the profile. If the price returns to the pattern’s range and establishes itself below the lower boundary of the profile at $564.00, a green support level around $550.00 could come into play. This level is also relatively close to the profile.
The RSI + MAs indicator is showing readings of 62, 54 and 49. The oscillator is above the neutral zone, while the moving averages remain within the zone, meaning that it is still too early to speak of a confirmed breakout.
Key Takeaways
The atypical volume pattern within the formation, combined with the incomplete RSI + MAs signal, leaves open the question of how sustainable the price’s move above the established structure will prove to be. An additional source of uncertainty is that part of the litigation settlement remains conditional on decisions by Meta’s competitors across the industry.
Buy and sell stocks of the world’s biggest publicly-listed companies with CFDs on FXOpen’s trading platform. Open your FXOpen account now or learn more about trading share CFDs with FXOpen.
This article represents the opinion of the Companies operating under the FXOpen brand only. It is not to be construed as an offer, solicitation, or recommendation with respect to products and services provided by the Companies operating under the FXOpen brand, nor is it to be considered financial advice.
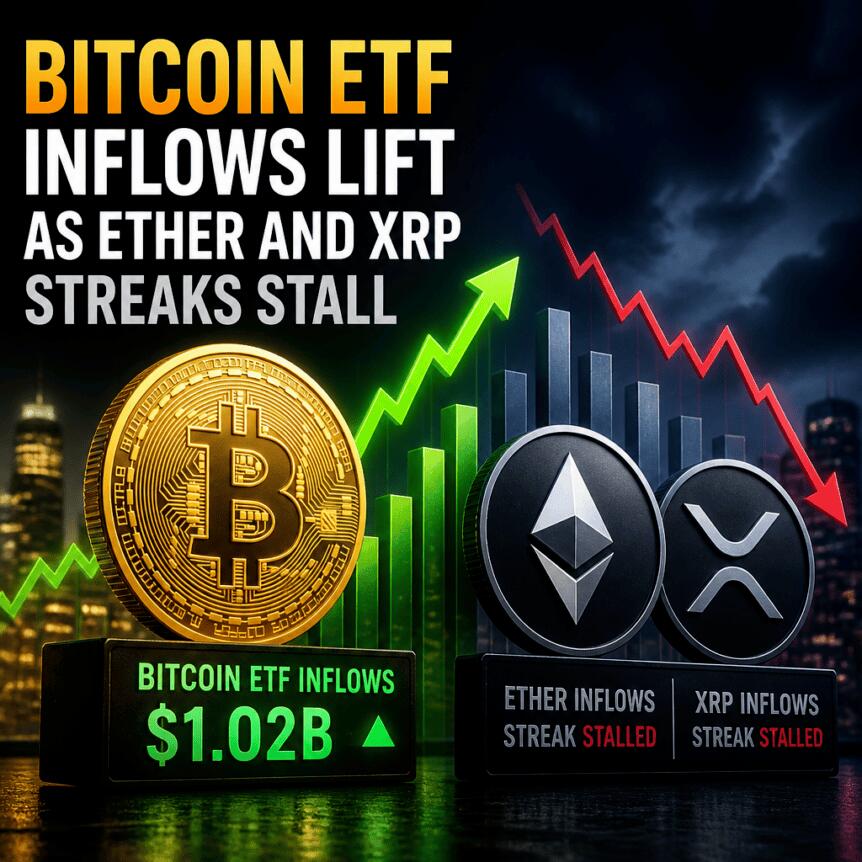
Demand for US spot crypto ETFs cooled Wednesday, reversing recent inflow streaks in both Ether and XRP products. After more than a week of persistent buying, spot Ether ETFs saw net outflows totaling $48 million, while spot XRP ETFs recorded $7.2 million in net withdrawals.
Bitcoin ETFs moved in the opposite direction, drawing fresh inflows even as broader cryptocurrency prices slipped. The flow shift matters because ETF purchases are often treated as a barometer for US institutional sentiment toward major digital assets.
Key takeaways
- Spot Ether ETFs pulled $48 million in net outflows on Wednesday, ending 12 consecutive trading days of inflows.
- Spot XRP ETFs recorded $7.2 million in net outflows, ending an 11-session inflow streak that added about $170 million.
- Ether’s largest products led withdrawals, with BlackRock’s iShares Ethereum Trust (ETHA) down $53.4 million on the day.
- Bitcoin ETFs saw inflows of $101.2 million after a prior day of net outflows.
Ether spot ETFs break a 12-day inflow run
According to SoSoValue, US-listed spot Ether ETFs recorded $48 million in net outflows on Wednesday. This marked the end of a 12-trading-day streak during which the funds collectively attracted $1.62 billion.
Farside Investors data showed that withdrawals were broad-based across the largest Ether vehicles. BlackRock’s iShares Ethereum Trust (ETHA) led the day’s outflows with $53.4 million, while Fidelity’s Ethereum Fund (FETH) lost $26.2 million. Grayscale’s Ethereum Staking ETF (ETHE) also saw $23.5 million in net outflows.
One product, however, helped cushion the overall move: BlackRock’s staked Ether ETF (ETHB) posted roughly $53 million in net inflows. Together, these figures suggest that Wednesday’s redemptions were not uniform across every Ether-related wrapper—investors appeared to reallocate rather than exit the theme entirely.
XRP ETFs end an 11-session inflow streak
Spot XRP ETFs also flipped from steady demand to withdrawals. According to SoSoValue, the funds posted $7.2 million in net outflows on Wednesday, ending an 11-session inflow streak.
That inflow run had brought in roughly $170 million, lifting cumulative XRP ETF inflows to about $1.68 billion. The reversal on Wednesday therefore matters less as a single-day withdrawal and more as an indicator that recent momentum may be losing traction.
Bitcoin ETFs attract money as Ether and XRP slip
While Ether and XRP saw net outflows, Bitcoin ETFs took the opposite path. Wednesday’s activity brought $101.2 million in net inflows, following a day earlier marked by $236.5 million in net outflows.
This divergence is notable: it suggests investors were not necessarily retreating from crypto ETFs altogether, but instead rotating exposure across assets during a softer pricing tape.
Price weakness coincides with the rotation in flows
The shift in ETF flows came alongside a broader pullback in major tokens. CoinGecko data cited in the original reporting indicated that over the previous seven days, Ether was down 3.4%, XRP down 2.4%, and Bitcoin down 1.3%.
At the time of publication, Ether, XRP, and Bitcoin were trading around $1,360, $2,407, and $77,744, respectively. While the direction of ETF flows doesn’t always map perfectly to short-term price moves, the timing here aligns with a market mood shift—investors appeared to pause or rotate capital as returns weakened.
For traders and allocators, this combination—slowing inflows in Ether and XRP paired with inflows into Bitcoin—can be interpreted as a near-term preference for the most liquid exposure during uncertainty. It also highlights that the “ETF flow narrative” may vary significantly by asset, even when the overall crypto market is moving in tandem.
What to watch next
Investors should monitor whether Wednesday’s withdrawals in Ether and XRP are followed by another reversal back into inflows, or whether the streak break reflects a more durable shift. Given that one staked Ether product recorded substantial inflows even as other Ether funds saw outflows, upcoming flow data may further reveal whether the market is reallocating within the Ether ETF complex or reducing overall exposure.
Meta announced on 26 August that it had reached an agreement with a bipartisan group comprising 52 state and territorial attorneys general, together with the Attorney General of the District of Columbia. Under the terms of the agreement, the company is expected to pay approximately $18 billion over ten years and introduce tighter protections for underage users of Facebook and Instagram. These measures include a two-hour daily usage cap and an overnight restriction blocking access to the apps between midnight and 6:00 am.
Of the total amount, around $5.3 billion would only become payable if TikTok and YouTube adopt comparable measures and make equivalent payments. Meta also anticipates recording roughly $10 billion in legal expenses during Q3 2026 as a result of the agreement.
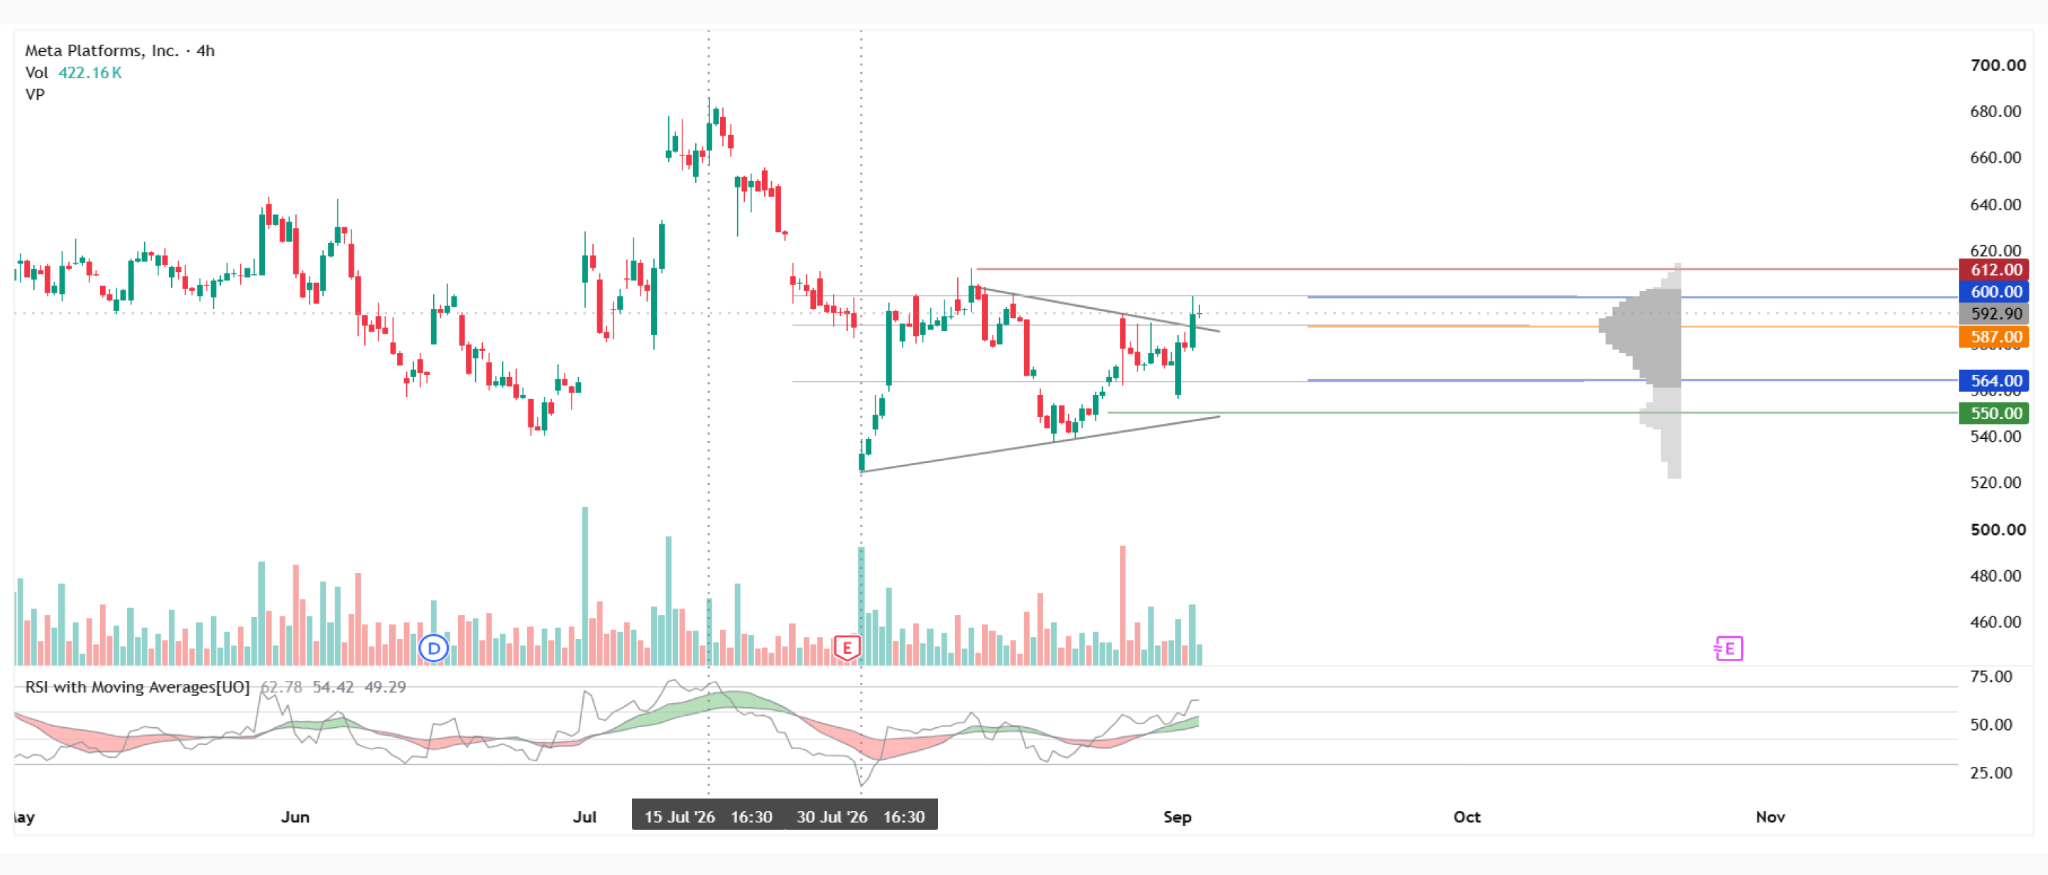
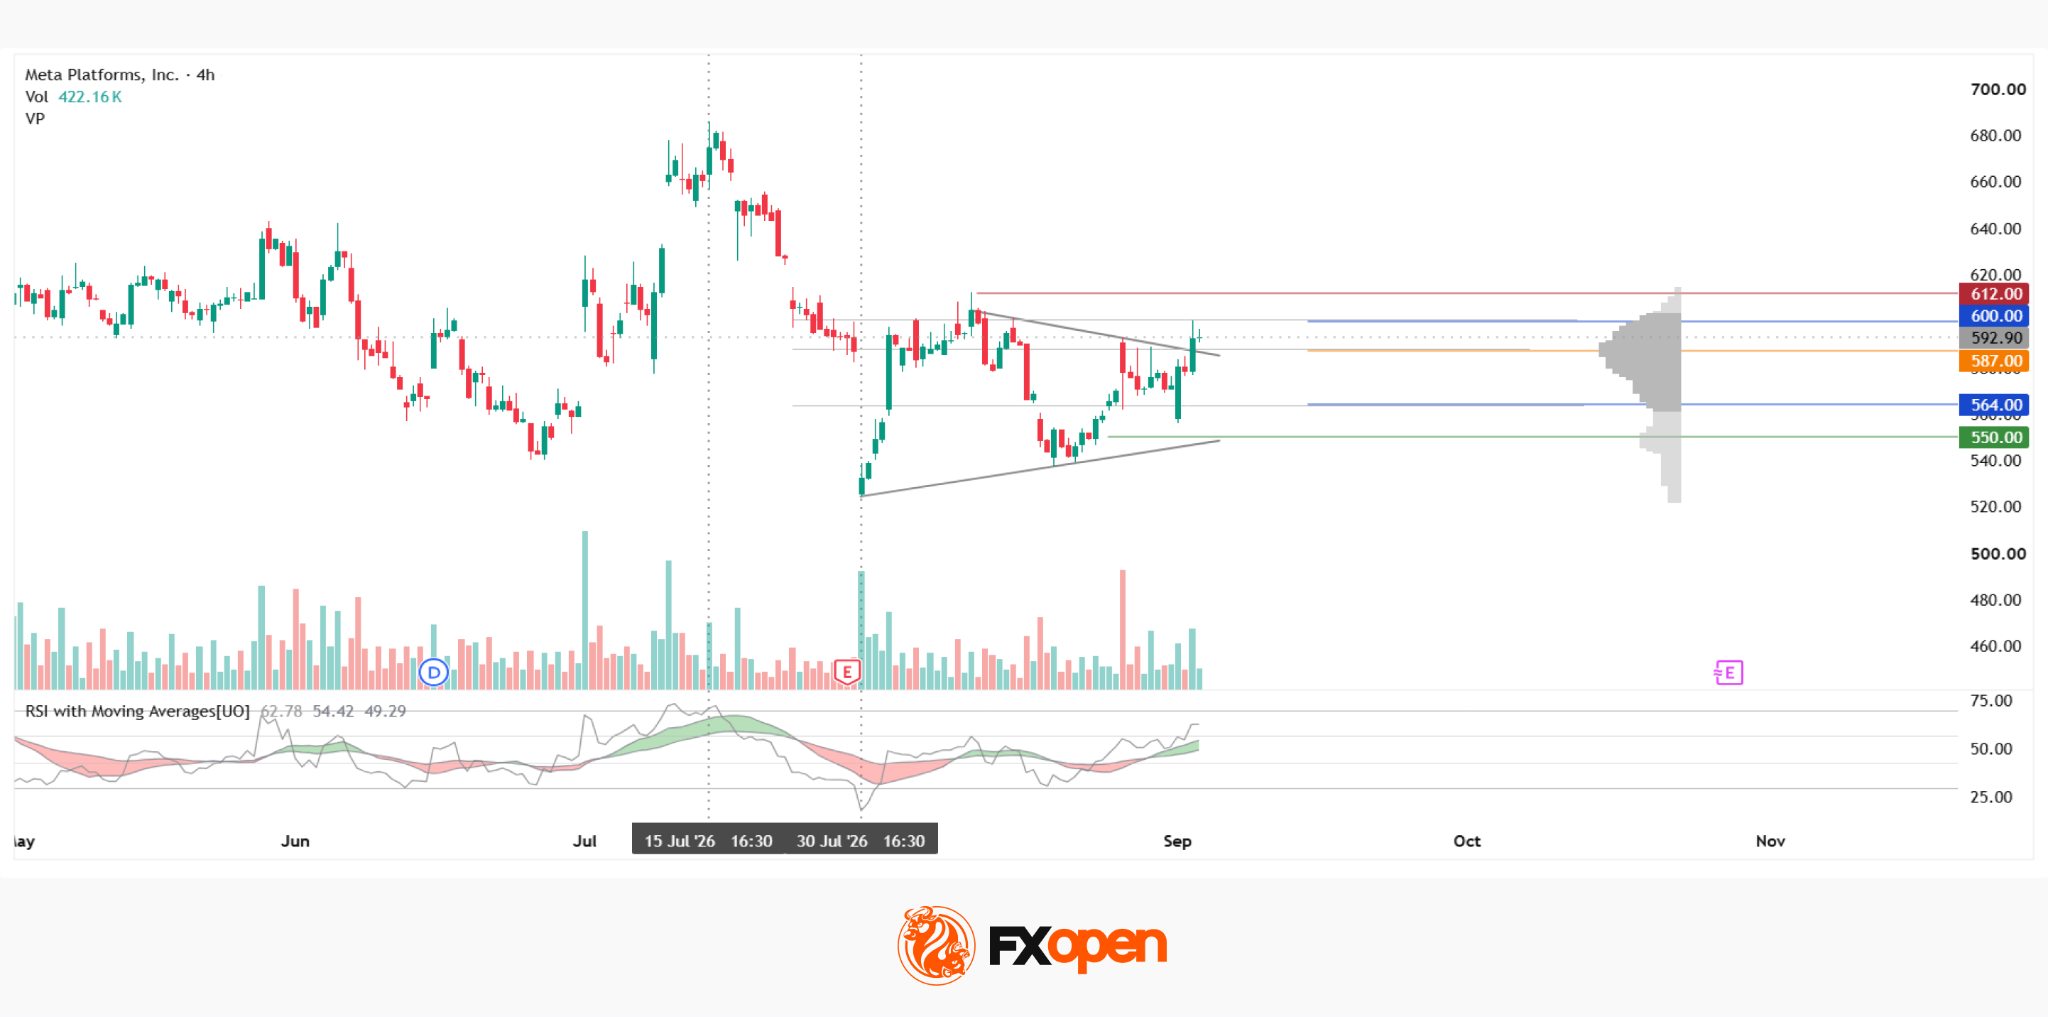
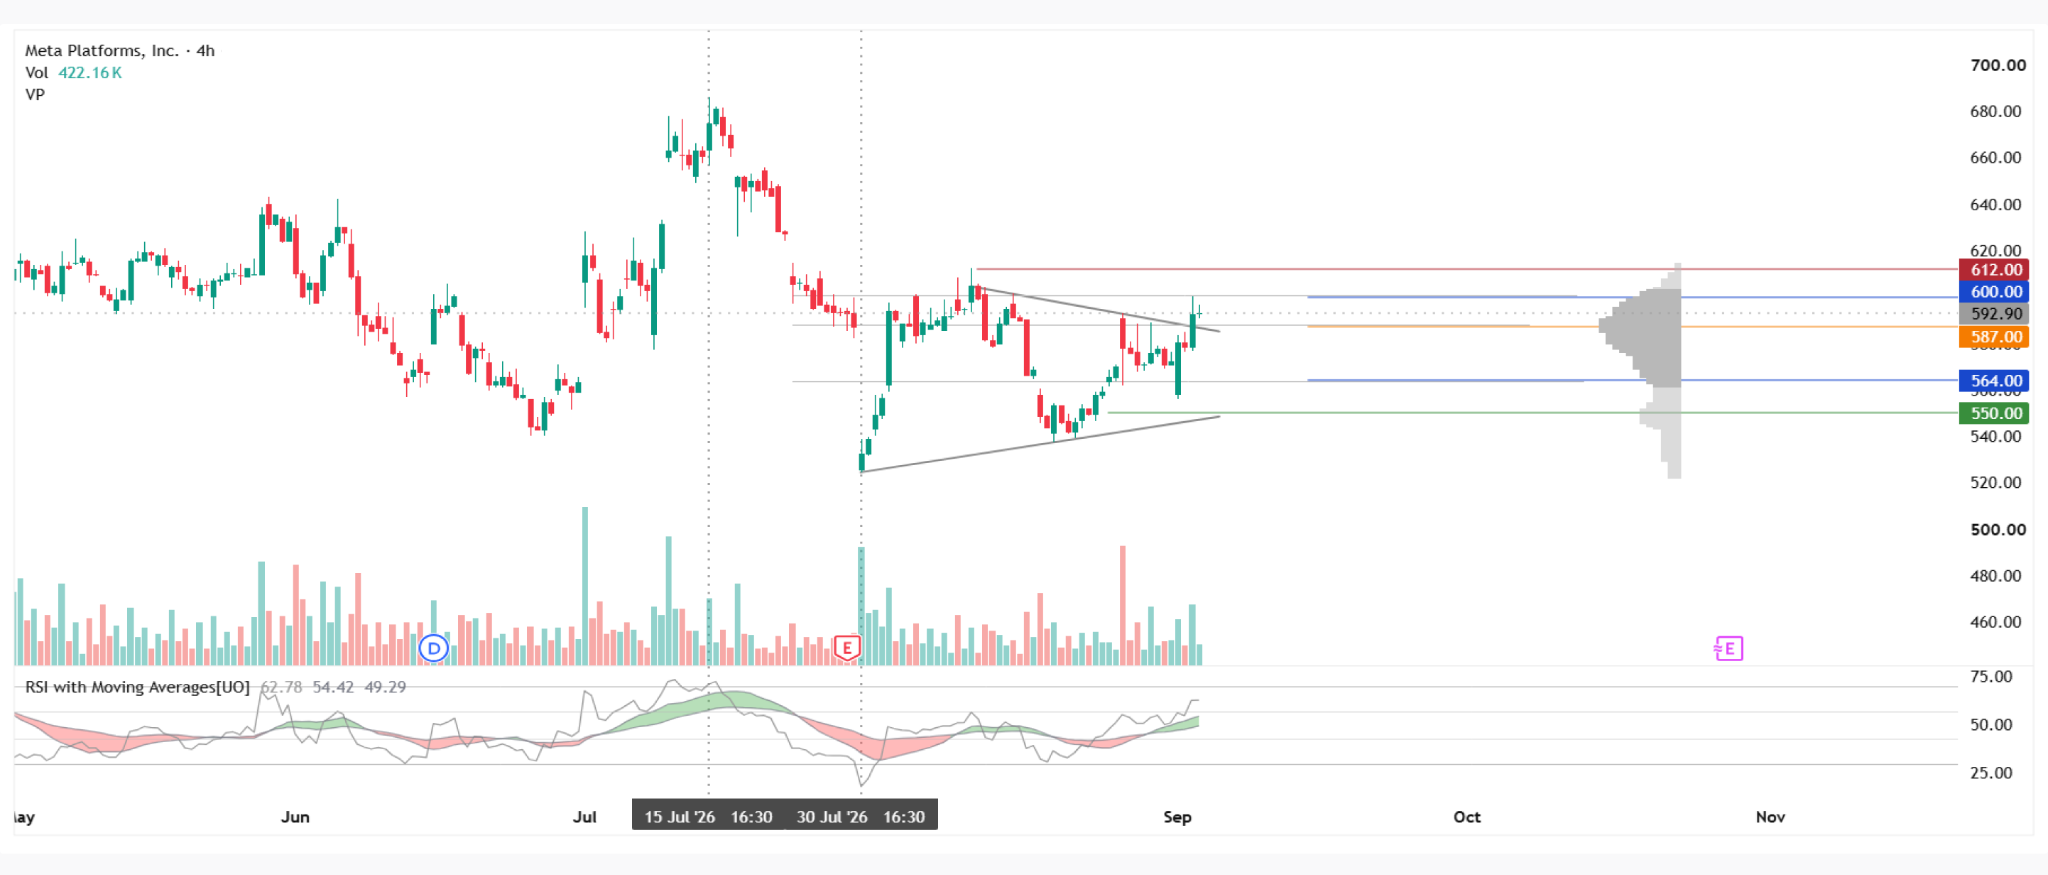
On the four-hour META chart, the medium-term structure remains broadly range-bound, with price continuing to fluctuate between the 690 and 540 areas. During the decline from 15 to 30 July, a converging triangle-like formation developed close to the lower portion of the broader range. Its boundaries gradually contracted as the amplitude of price movements narrowed.
However, the volume profile accompanying the formation is not particularly characteristic of this type of consolidation. This unusual volume behaviour raises some doubt over the reliability of the pattern and whether the subsequent move should be interpreted as a fully confirmed technical breakout.
Following the move above the upper boundary, Meta remains inside the current market profile and is now trading in the relatively narrow zone between the Point of Control (POC) at $587.00 and the profile’s upper boundary at $600.00. Price is effectively attempting to hold above the former pattern.
The next red resistance area sits near $612.00, only a short distance above the profile ceiling. Conversely, a return into the previous structure would become more concerning if price establishes itself below the profile’s lower boundary at $564.00. In that scenario, attention could shift towards the green support around $550.00, which is also positioned relatively close to the profile.
The RSI + MAs indicator currently reads 62, 54 and 49. The oscillator has moved above the neutral area, while the moving averages remain around the neutral zone. As a result, the technical picture has improved, but there is not yet enough confirmation to treat the breakout as firmly established.
Key Takeaways
Meta has managed to remain above the converging structure, but the unusual volume behaviour during the pattern’s development weakens the conviction behind the move. The RSI + MAs readings are also not sufficiently aligned to confirm a decisive change in momentum.
The outlook therefore remains dependent on whether price can sustain itself above the current structure and move through the $600.00–$612.00 area. A failure to hold the breakout zone, particularly a move below $564.00, would increase the risk of a return towards $550.00.
The legal settlement also adds a separate layer of uncertainty, as part of the financial commitment remains conditional on whether Meta’s competitors adopt comparable measures. This leaves both the technical breakout and the broader fundamental backdrop subject to further confirmation.
This article represents the opinion of the Companies operating under the FXOpen brand only. It is not to be construed as an offer, solicitation, or recommendation with respect to products and services provided by the Companies operating under the FXOpen brand, nor is it to be considered financial advice.
Cointelegraph is committed to providing independent, high-quality journalism across the crypto, blockchain, AI, and fintech industries.
All news, reviews, and analyses are produced with full journalistic independence and integrity. For more details on our standards and processes, please read our Editorial Policy.

SuperMobile is Vodafone’s premium mobile service with faster speeds

How to Make Money

‘You’ve just been chopped’, teen attacker told schoolboy after stabbing him in the back





-

 Fashion6 days ago
Weekend Open Thread: Maeve – Corporette.com
-

 Crypto World6 days ago
Bitcoin’s 22% rally now needs real demand to outlast Treasury liquidity boost
-

 Business6 days ago
Apple Confirms September 9 Keynote and Reveals Its Full Pre-Order Schedule
-

 Business6 days ago
Salesforce Stock Soars 19% as Blowout Earnings and Agentforce AI Growth Silence Software Skeptics
-

 Crypto World10 hours ago
CLARITY Act could advance within weeks, Atkins says
-

 Business5 days ago
Onto Innovation Stock: AI’s Next Bottleneck Is Yield (NYSE:ONTO)
-

 Crypto World5 days ago
Bitcoin price tests $82K resistance as Brandt stays long
-
 Tech5 days ago
Hugging Face built a $4.5 billion empire on free AI models. Now Nvidia is buying it for $12.9 billion
-

 Business6 days ago
iPhone 18 Pro Pre-Orders Could Shift to Saturday as Apple Reportedly Avoids September 11 Anniversary
-

 Crypto World6 days ago
Truflation calls for Fed rate cut after PCE forecast
-

 News Videos4 days ago
Charlie Munger on Robinhood: No one should believe that Robinhood’s trades are free
-

 Tech5 days ago
PaperCut releases second emergency patch for exploited flaws
-
 Business7 days ago
AI Assistant Startup Instinct Rockets to $2.5 Billion Valuation in Weeks Amid Investor Feeding Frenzy
-

 Tech6 days ago
The fix for the AI agent that hijacked a company’s DNS: it can propose the change, but it can’t approve it
-
 Entertainment6 days ago
‘Adults’ Creators Break Down Season 2’s Most Shocking Moments and Tease a Potential Season 3
-

 Tech4 days ago
Tamagotchi Ring Takes the 30-Year Digital Pet and Places it on Your Finger
-

 Tech4 days ago
As the influencer economy drives retail sales, Seattle startup raises $22M to play matchmaker
-

 Crypto World1 day ago
Elon Musk Says Grok 4.7 Lands in 10 Days and Will Beat Every Model
-
 NewsBeat4 days ago
Trump posts AI video of ‘Lake America’ being protected by an army of bequiffed ‘Donald Ducks’
-
 Crypto World1 day ago
Bitcoin slips below $77.5K as macro pressure offsets ETF inflows
You must be logged in to post a comment Login