

Crypto World
Chart Formation Signals a Potential Explosive Rally Ahead
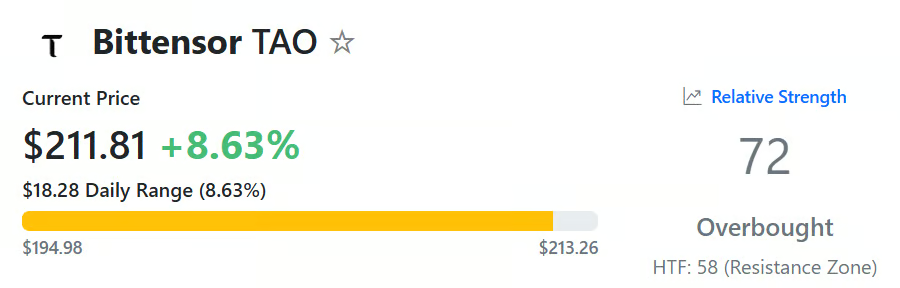
What’s next for TAO after reaching a one-month peak?
Bittensor (TAO) has pumped by double digits over the past seven days, with some analysts expecting this could be the beginning of a much more substantial surge.
At the same time, certain indicators suggest a short-term correction is also a plausible option.
Further Gains Ahead?
As of this writing, TAO trades at around $213 (per CoinGecko), making it the top daily performer among the biggest 100 cryptocurrencies after rising 9% over the period. Its market capitalization soared past the $2 billion psychological mark, thus flipping well-known altcoins such as OKB, ASTER, and others.
The renowned analyst Ali Martinez noted TAO’s strong performance, spotting the potential formation of an Adam & Eve pattern on its price chart. It consists of two bottoms: a sharp “Adam” dip and a rounded “Eve” plunge. The structure is generally considered bullish, as it suggests sellers have lost momentum and could be replaced by buyers. Martinez estimated that in this case, TAO’s price could soar to as high as $270.
X user GalaxyTrading is also quite optimistic. Recently, they described TAO as “the clearest 10x coin for the next altcoin run phase.” The analyst argued that the asset could emerge as a dominant figure in the crypto space thanks to the development of Artificial Intelligence.
ZAYK Charts chipped in, too. Earlier this week, they assumed that Bittensor’s native token was moving within a falling channel, predicting that a breakout above roughly $200 could open the door to a possible 100% increase to almost $400.
Moving South is Also an Option
Despite the prevailing optimism among traders and analysts, some technical indicators suggest TAO’s valuation could tumble in the near future.
You may also like:
The asset’s Relative Strength Index (RSI), which measures the speed and magnitude of recent price changes, has risen above 70. This signals that the token is overbought and could be on the verge of a short-term pullback. The index runs from 0 to 100, and conversely, ratios below 30 are typically interpreted as buying opportunities.
The next factor on the list is TAO’s exchange netflow. CoinGlass’s data show that over the past few days, inflows have exceeded outflows, indicating that investors have been shifting from self-custody to centralized platforms. This is often viewed as a pre-sale step.

Binance Free $600 (CryptoPotato Exclusive): Use this link to register a new account and receive $600 exclusive welcome offer on Binance (full details).
LIMITED OFFER for CryptoPotato readers at Bybit: Use this link to register and open a $500 FREE position on any coin!


The strategic investment is the latest in a string of Bitcoin infrastructure bets by the stablecoin giant.
USDT issuer Tether has made a strategic investment in Ark Labs, the team developing Arkade, a programmable infrastructure layer for Bitcoin.
The $5.2 million funding round is aimed at expanding stablecoin access on the Bitcoin network and brings the total funding raised by Ark Labs to $7.7 million. Arkade is designed to enable instant, programmable transactions on Bitcoin for both retail users and financial institutions, positioning the network as a more viable platform for everyday payments and commerce.
“Improving access to USD₮ on the most secure and widely recognized blockchain supports greater financial inclusion, more efficient cross-border payments, and stronger global liquidity,” said Tether CEO Paolo Ardoino in a blog post.
Ark Labs CEO Marco Argentieri said Bitcoin has long lacked the programmable infrastructure needed for financial applications, and that Tether’s involvement would help accelerate development of payments, lending, and digital asset solutions being built on Arkade.
The Ark Labs deal is part of a broader infrastructure push. Last week, Tether led a $7.5 million raise for Utexo, a startup building Bitcoin-native USDT settlement rails using Lightning and RGB technology.
Launched in 2014, USDT has grown into the dominant force in the stablecoin market. USDT currently has a market cap of roughly $183 billion, making it the largest circulating stablecoin.
The stablecoin sector’s rapid growth has been driven in part by regulatory clarity, with the GENIUS Act signed into law in July 2025, creating the first federal regulatory framework for stablecoins in the U.S.


OP Labs, the main developer firm supporting the Optimism ecosystem, has laid off 20 employees as part of an internal restructuring aimed at sharpening the organization’s strategic focus, according to a message shared by the group’s leadership.
In a post on X, CEO of OP Labs Jing Wang said the decision followed internal discussions with affected staff and was communicated to employees before being disclosed publicly. The company said the layoffs were driven by a need to “narrow our focus,” rather than financial constraints.
“This is not about finances,” she said in a Slack message she shared alongside her post. “OP Labs is well capitalized with years of runway.”
Instead, she suggested that the move was intended to streamline decision-making and “do fewer things … exceptionally well.”
The OP token is down roughly 3% over the last 24 hours.
OP Labs plays a central role in the development of Optimism, an Ethereum layer-2 scaling network designed to make transactions faster and cheaper by processing activity off the Ethereum main chain. The broader Optimism ecosystem now includes several high-profile chains built on its technology stack, including Coinbase’s Base, Uniswap’s Unichain and Sony’s Soneium.
CoinDesk reached out to OP Labs for comment and to clarify the percentage of staff that was laid off.
Read more: Optimism’s OP token falls after Base moves away from the network’s ‘OP stack’ in major tech shift


As traders are loading up on XRP long positions, one metric signals that it may be time to pay attention.
There’s encouraging data emerging for XRP traders from the order books of perpetual futures exchanges like Binance Futures, Bybit, and OKX, as well as their decentralized counterparts like Hyperliquid, Aster, and Lighter.
Referencing a graph from CoinAnk, popular data analyst CW8900 noted that the number of long positions in XRP has been increasing and has now exceeded the number of short positions.
$XRP‘s long positions have increased, exceeding the size of short positions.
Expectations for $XRP‘s rise are growing. pic.twitter.com/xMnIAEcQqs
— CW (@CW8900) March 12, 2026
But what does this mean for the XRP price? Well, usually, in a vacuum scenario, when there are more buyers than sellers, the price goes up. Of course, that’s incredibly simplified, and it would only hold if these orders are coming from market makers. Market takers could place buying orders at higher prices, but they wouldn’t be executed unless the price actually rises. In all fairness, though, an increasing number of long positions is almost always a good sign, especially if it persists.
This comes at a time when Ripple’s fundamentals are also looking good. For instance, in the last week alone, the company said it would pursue a strategic acquisition to obtain a financial license in Australia, was listed on Mastercard’s new crypto-focused platform, and announced a massive share buyback.
That said, there are some worrying signs as well. As CryptoPotato reported earlier this week, open interest has been dropping across several exchanges. This metric represents the total number of futures contracts that remain active in the market. When it declines, this usually means that traders are reducing exposure. So while the number of long positions went up, the broader open interest went down, meaning that an increase in price is far from certain.
Binance Free $600 (CryptoPotato Exclusive): Use this link to register a new account and receive $600 exclusive welcome offer on Binance (full details).
LIMITED OFFER for CryptoPotato readers at Bybit: Use this link to register and open a $500 FREE position on any coin!


- ADA traded near $0.26 as bulls looked to break above a key resistance line.
- Open interest hovered around $414 million, sharply down over the past month.
- ADA price could drop to $0.22 or lower if bears strengthen.
Cardano’s ADA remains under pressure as buyers struggle to regain momentum, with the token retreating from a key technical resistance level near $0.26.
The cryptocurrency is now down more than 20% year to date.
The decline has also pushed Cardano out of the top 10 cryptocurrencies by market capitalisation, after Hyperliquid (HYPE) climbed to around $38 and moved into the 10th position on CoinMarketCap.
As of March 12, 2026, Hyperliquid’s market capitalisation stood at about $9.6 billion, slightly ahead of Cardano’s $9.4 billion.
The ranking shift could reverse if a potential recovery driven by bullish network-related developments supports ADA’s price.
Otherwise, the prevailing downtrend could push the altcoin toward new multi-month lows.
Cardano open interest falls to $414 million
Cardano’s ADA has trended lower since reaching a peak of $1.01 in August 2025, with derivatives market data reflecting the weakening momentum.
Over the past several months, Cardano’s open interest has declined sharply from about $1.87 billion when the token rallied above $1.
By October 2025, open interest in outstanding ADA futures contracts had fallen to roughly $1.5 billion, before dropping further to around $842 million by mid-January 2026.
The metric now stands at approximately $414 million as of March 12, 2026.
Open interest typically falls as leveraged positions unwind, indicating reduced participation from speculative traders.
The decline of more than 50% from January levels suggests that confidence in ADA’s near-term price outlook has weakened, aligning with the token’s broader bearish trend.
ADA price outlook: bulls face downtrend risk
Cardano price hovers near the resistance line of a parallel channel formed since Feb. 26.
Prices slipped below $0.27 earlier this month amid comments from founder Charles Hoskinson.
From a technical analysis point of view, a breakout looks likely as bulls hold onto support near the trendline.
However, sellers have shown conviction, keeping ADA within a channel formation in place since October 2025.
In terms of the short-term outlook, momentum indicators on the daily chart reinforce the downward risk.
As can be seen below, the Relative Strength Index (RSI) signals weakness under the 50 mark, while the MACD also suggests buyers’ indecision could play into bears’ hands.
Meanwhile, the 50 and 100-day SMAs indicate downward strength.

Cardano’s price is down more than 20% YTD and 70% in the past six months.
This means that failure to strengthen its recovery could risk ADA plunging to year-to-date lows of $0.22.
If price breaks below this level, ADA could face a deeper bearish setup.
However, if gains across crypto and network-related developments boost a fresh uptick, it could invalidate this outlook.
Breaking above the downtrend line and closing above $0.28 would embolden buyers, with key targets at $0.30 and $0.33.
Even then, bulls may need to reclaim $0.45 as support to retake control.


Bitcoin has risen 7% since the U.S.-Iran conflict began, beating gold and the Nasdaq 100, according to Arthur Hayes.
Bitcoin has gained 7% since the U.S.-Iran war started on February 28, outpacing gold, which fell 2%, and the Nasdaq 100, which slipped by 0.5%.
This is according to data shared on X on March 12 by BitMEX co-founder Arthur Hayes.
Bitcoin Holds Ground While Traditional Assets Slip
Hayes posted a normalized performance chart comparing Bitcoin, gold, and the Nasdaq 100 from February 28 to the present. All three assets started at the same baseline on that date, which allowed for a clean comparison of relative performance across nearly two weeks.
On the chart, Bitcoin stood out against the traditional safe haven asset and the broad tech index, gaining 7% as energy prices spiked in the background over concerns about supply disruptions.
Nevertheless, BTC’s price action in that period wasn’t exactly calm. When news of the United States’ and Israel’s strike on Iran first emerged, the asset dropped from around $66,000 to just above $63,000 before reversing to $67,000 following the death of Iranian Supreme Leader Ayatollah Ali Khamenei.
Market watchers at the London Crypto Club agreed with Hayes, saying they had noted a similar dynamic playing out when the Israel-Palestine conflict escalated, and argued that BTC covers both the far left and far right tails of the risk distribution, meaning it can react to extreme scenarios in both directions while spending most of its time trading somewhere in the middle alongside equities.
As of today, the number one cryptocurrency is trading near $70,000, with a 24-hour range between $69,000 and $71,000, gaining less than 2% on the day, per data from CoinGecko. However, the picture goes red over seven days, with BTC down 3.5%, although its current price is a 2% bump on the 30-day reading.
You may also like:
Looking at the wider context, on-chain data analysts Arab Chain wrote that the Binance BTC Scarcity Index, which measures how much Bitcoin is immediately available for sale on the platform, recently hit its highest reading since October 2025, at 5.10.
According to them, the reading suggests that supply on the exchange has thinned out, and this condition historically appeared during bullish price phases when holders moved their BTC into cold storage rather than leaving them on exchanges.
Hayes is Watching the Fed
Despite the relative outperformance, Hayes has insisted that he’s still not buying Bitcoin. In a recent interview, the former BitMEX CEO said that he would not put any money into BTC right now, flagging the risk that if the United States’ war with Iran dragged on too long, it could trigger a broad equity sell-off that drags Bitcoin toward $60,000.
Bloomberg Intelligence strategist Mike McGlone offered a different framing, suggesting that oil could go near $120, Bitcoin to $90,000, Copper at $6 per pound, and silver near $100 per ounce, which would represent a collective peak for risk assets in the first quarter of 2026, with rising volatility possibly spilling into equity markets.
Binance Free $600 (CryptoPotato Exclusive): Use this link to register a new account and receive $600 exclusive welcome offer on Binance (full details).
LIMITED OFFER for CryptoPotato readers at Bybit: Use this link to register and open a $500 FREE position on any coin!

Key Takeaways
-
Tracking Bitcoin properly requires visibility across wallets, exchanges, and on-chain activity
-
Portfolio trackers simplify monitoring balances, performance, and price movements
-
Modern tools offer automation, analytics, and alerts for better portfolio management
-
Platforms like CoinStats allow users to track Bitcoin holdings across multiple wallets and exchanges in one place
Introduction
Bitcoin remains the cornerstone of the cryptocurrency market. Whether investors hold BTC as a long-term store of value or actively trade it across exchanges, keeping track of Bitcoin holdings has become increasingly important.
In 2026, many investors no longer store their Bitcoin in a single place. Assets are often distributed across centralized exchanges, hardware wallets, mobile wallets, and DeFi platforms. This fragmented structure makes it harder to maintain a clear overview of balances, performance, and exposure.
For this reason, tools designed specifically to monitor crypto portfolios have become essential. Tracking Bitcoin today means more than simply checking the price. Investors need visibility into wallet balances, transaction history, profit and loss, and portfolio performance across multiple platforms.
Why Tracking Bitcoin Is Important
Many crypto investors underestimate the importance of structured portfolio tracking. Without a proper system in place, it becomes difficult to answer basic questions such as:
-
How much Bitcoin do I actually hold across all platforms?
-
What is my average purchase price?
-
How much profit or loss have I generated over time?
-
How exposed is my portfolio to Bitcoin compared to other assets?
Manually calculating this information quickly becomes inefficient, especially for investors who frequently move funds between exchanges or wallets.
A reliable tracking system helps users maintain transparency over their investments and enables better decision-making in volatile markets.
The Challenges of Managing Bitcoin Across Multiple Platforms
One of the defining features of crypto is self-custody. Unlike traditional finance, where assets are often held within a single brokerage account, crypto investors commonly distribute their holdings across multiple platforms.
For example, a typical Bitcoin holder might store BTC in:
-
A mobile wallet like Trust Wallet
-
A browser wallet like MetaMask
Each platform provides its own interface, transaction history, and balance display. While this decentralization offers greater control, it also creates operational complexity.
Without a unified system, users must manually check each wallet and exchange to determine their total Bitcoin holdings.
Portfolio Trackers Simplify the Process
Crypto portfolio trackers were developed to solve this exact problem. These tools allow investors to connect multiple wallets and exchanges into a single dashboard, giving them a consolidated view of their assets.
Once connected, portfolio trackers automatically synchronize balances, transaction history, and price data. This removes the need for manual tracking or spreadsheets.
In addition to balance aggregation, modern portfolio trackers often provide:
These features allow investors to monitor their Bitcoin positions more effectively and react faster to market changes.
Tracking Bitcoin With CoinStats
One of the most widely used tools for this purpose is the CoinStats Bitcoin tracker, which allows users to monitor their BTC holdings across multiple wallets and exchanges from a single interface.
CoinStats supports hundreds of wallets and exchanges and integrates with more than 120 blockchains. This makes it possible to track Bitcoin stored in both centralized and decentralized environments.
Instead of logging into several platforms, users can connect their accounts and instantly view their Bitcoin balance, transaction history, and overall portfolio performance.
The platform also offers advanced analytics features that help investors understand how their Bitcoin holdings perform over time. These insights include profit and loss calculations, historical performance tracking, and portfolio breakdowns.
Real-Time Insights and Alerts
Another advantage of using a dedicated tracking platform is real-time monitoring. Bitcoin markets operate 24/7, and prices can change rapidly within short periods of time.
Portfolio tracking tools allow users to set alerts for price movements, ensuring they are notified when Bitcoin reaches specific levels. This is particularly useful for investors who follow long-term accumulation strategies or traders who monitor entry and exit points.
Having access to these alerts helps users stay informed without constantly checking multiple exchange apps.
A Better Way to Monitor Your Bitcoin
As the crypto ecosystem grows more complex, tools that simplify portfolio management are becoming increasingly valuable. Bitcoin may be the most established digital asset, but managing it across multiple platforms still presents practical challenges.
Using a portfolio tracker allows investors to maintain clarity, track performance accurately, and make more informed decisions.
For users who hold BTC across several wallets or exchanges, having a unified dashboard can significantly improve the overall investment experience.
Final Thoughts
Bitcoin continues to play a central role in the digital asset ecosystem. Whether used as a long-term investment or part of an active trading strategy, keeping track of Bitcoin holdings is essential for effective portfolio management.
As the market expands and investors interact with more platforms, tools that aggregate and analyze portfolio data are becoming indispensable.
Solutions like CoinStats demonstrate how portfolio tracking has evolved from simple balance monitoring into a comprehensive system for managing digital assets in an increasingly decentralized financial landscape.


An initiative to ban the U.S. Federal Reserve from issuing a government-run digital dollar has been approved in an overwhelmingly bipartisan 89-10 vote in the Senate, but it’s tucked inside a housing bill that may run into headwinds in the U.S. House of Representatives.
The effort to outlaw a central bank digital currency (CBDC) has long been a favorite of Republican lawmakers, though the U.S. government has never advanced beyond the research stage for establishing a government token that could compete with privately issued stablecoins (and rival other CBDCs pursued by China and other jurisdictions). The 21st Century ROAD to Housing Act included an unrelated section that outlawed U.S. CBDCs until at least the end of 2030.
The section, in the final pages of the 302-page bill advanced by the Senate, declares that the Fed “may not issue or create a central bank digital currency or any digital asset that is substantially similar to a central bank digital currency directly or indirectly through a financial institution or other intermediary.”
“Financial privacy is a cornerstone of American freedom, and any decision to authorize a Central Bank Digital Currency must remain with Congress and the American people,” said Digital Chamber CEO Cody Carbone in a statement. “We appreciate the Senate reinforcing that digital innovation in the United States should be led by the private sector while protecting individual liberty.”
But lawmakers in the House have signaled they may force a second effort at the Senate’s version, which could disrupt the bill’s progress. At particular issue is the Senate bill’s forcing of large investors in U.S. housing, such as private equity firms, to sharply limit the number of homes they can own.
President Donald Trump has favored that concept himself — one of the few areas of overlap with Democratic lawmakers.
Though Trump has supported the effort to make housing more widely available in the U.S., he recently stated that he won’t sign any bills into law until Congress sends him legislation that would demand voters produce identification and proof of citizenship before they cast ballots in this year’s consequential congressional midterm election. The path for that initiative is unclear, adding to the uncertainty for those advocating the housing bill and other efforts, including the crypto market structure bill known as the Digital Asset Market Clarity Act.
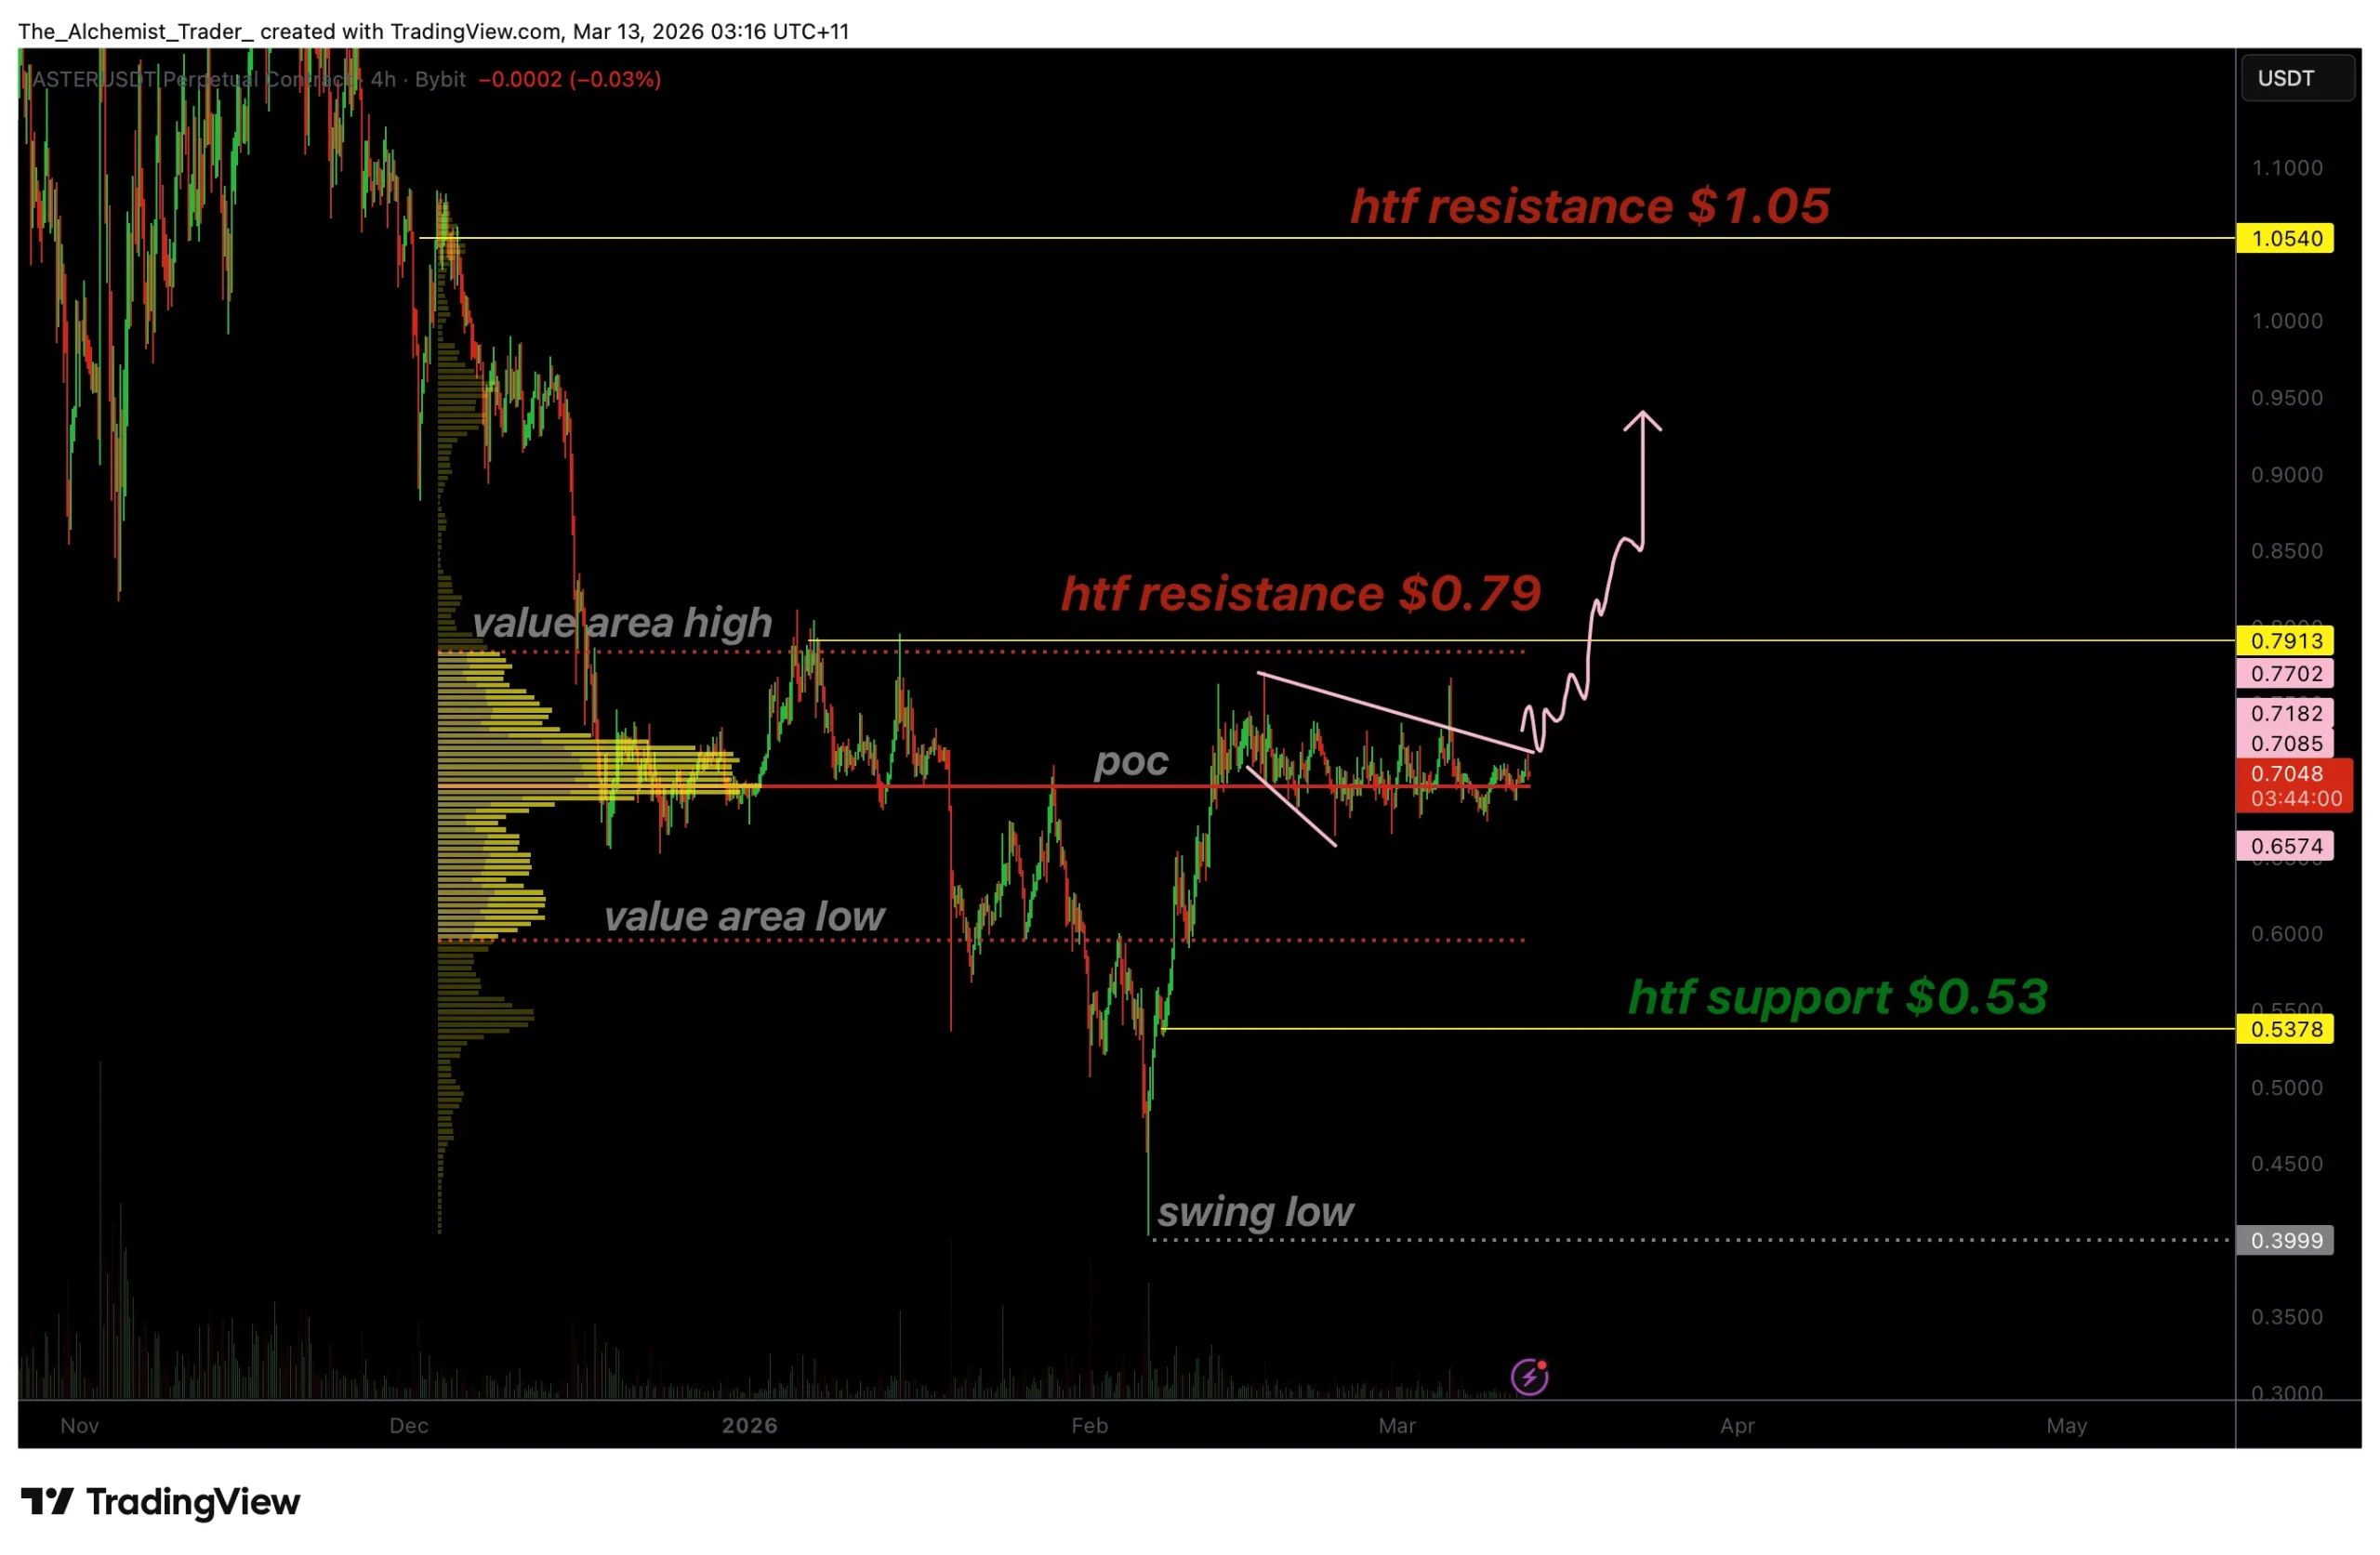
Aster price is consolidating beneath key high-timeframe resistance as price compresses within a bullish broadening wedge pattern.
Summary
- Key Resistance: $0.79 remains the critical breakout level for bullish continuation.
- Bullish Pattern: Price compressing within a bullish broadening wedge structure.
- Upside Target: Breakout could trigger a measured move toward $1.05.
Aster’s (ASTR) recent price action is beginning to attract attention from technical traders as the asset consolidates within a bullish broadening wedge formation. After rebounding from a previous swing low, price has entered a period of compression near a critical high-timeframe resistance level.
This consolidation is occurring around the point of control, a zone where the highest amount of trading volume has historically taken place, often acting as a magnet for price before the next directional move unfolds.
If the bullish structure remains intact and resistance breaks, the setup could open the door for a significant rally toward the $1.05 region.
Aster price key technical points:
- High-timeframe resistance: $0.79 remains the key breakout level.
- Bullish broadening wedge: Price structure suggests building upside pressure.
- Technical target: A breakout could trigger a measured move toward $1.05.

Aster’s current structure shows price trading within a broadening wedge formation, a pattern often associated with increasing volatility and expanding price swings. Unlike traditional contracting patterns, a broadening wedge features widening support and resistance boundaries, reflecting an environment where buyers and sellers are actively testing both sides of the range. In Aster’s case, the structure is leaning bullish because price continues to hold above a key support region while gradually building pressure beneath resistance.
One of the most important levels within this structure is the point of control, the price zone that represents the highest traded volume within the current range. The point of control often acts as a fair-value area where buyers and sellers reach temporary equilibrium before the next directional move emerges. Aster’s price action currently rotating around this level suggests the market is still in a consolidation phase, absorbing liquidity before a potential expansion in volatility.
The bullish argument for Aster largely depends on the ability of price to break above the $0.79 high-timeframe resistance level. This area has historically acted as a barrier preventing further upside movement, making it a critical zone for confirmation. A clean breakout above this level would signal that buyers have regained control of market structure and that the current consolidation has successfully built enough momentum to push price higher.
From a technical perspective, the projected upside target of $1.05 is derived from the measured move of the current structure. This target is calculated by taking the distance from the recent swing low that initiated the current bullish leg and projecting that move from the point where the breakout occurs. Measured move projections are commonly used by traders to estimate potential continuation targets once price escapes consolidation patterns.
Another key factor supporting the bullish outlook is the broader structure of the wedge itself. For a bullish broadening wedge pattern to remain valid, price must continue respecting the two dynamic support and resistance trendlines that define the pattern. These expanding boundaries indicate that market participants are progressively testing higher and lower extremes, a characteristic that often precedes large directional breakouts when the pattern resolves.
However, confirmation will ultimately depend on volume behavior during the breakout attempt. A breakout that occurs on weak or declining volume may lead to a false move, commonly referred to as a liquidity sweep or bull trap. For the bullish scenario to fully materialize, traders will want to see strong and sustained buying pressure accompanying any move above the $0.79 resistance zone.
What to expect in the coming price action
As long as Aster continues consolidating above the point of control and maintains the bullish wedge structure, the probability of an upside breakout remains intact. A decisive move above $0.79 supported by strong volume could trigger the measured move toward the $1.05 target.
Failure to break resistance, however, could extend the current consolidation phase before the next major directional move develops.
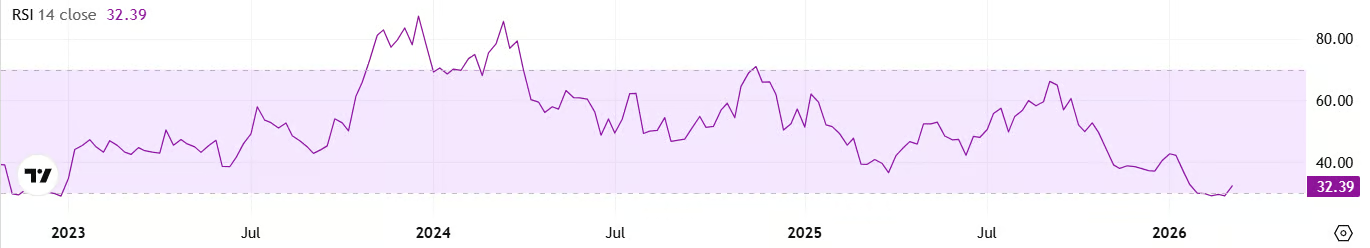
One analyst believes that SOL below $90 is a “phenomenal offer.”
Solana (SOL) has seen reduced volatility over the past several days, but the emergence of a certain technical signal suggests it may soon chart a substantial move.
Some analysts who touched upon the asset see an upswing as the more likely outcome, though others warn that a sharp decline could follow.
Major Turbulence Ahead?
Despite some sporadic spikes and dips, SOL has been trading in a tight range between $80 and $87 over the past weeks. According to Ali Martinez, this price action has triggered a squeeze in the Bollinger Bands.
This technical indicator consists of a moving average and two outer bands (one lower and one upper). When they tighten, it suggests the valuation might be gearing up for a huge move, as long periods of slight volatility are often followed by breakouts or breakdowns.
Although the Bollinger Bands don’t offer a clear direction, Solana’s Relative Strength Index (RSI) stands out as a distinctly bullish signal. The technical analysis tool ranges from 0 to 100 and is often used by traders to spot potential reversal points. It runs from 0 to 100, with readings below 30 considered buying opportunities, while anything above 70 is seen as bearish territory. Data shows that SOL’s RSI on a weekly scale recently fell to 29, while currently it stands at around 32.

X users James and OxBossman are among the optimistic analysts. The former argued that SOL under $90 is a “phenomenal offer,” while the latter thinks that the price would first hit $200 rather than collapse to $40.
The Bears Could be Quite Stubborn
Other popular traders, though, believe Solana’s native cryptocurrency has yet to feel the real impact of the current bear market. X user DrBullZeus predicted that the price could dip to as low as $50, assuming that “bulls are running out of time.”
You may also like:
UNKONWN TRADER was also pessimistic, forecasting heightened volatility in the coming weeks that might lead to a drop to $53, the lowest since the end of 2023.
When speculating on SOL’s price, it is useful to observe the asset’s recent exchange netflow. Over the past several days, inflows have outpaced outflows, indicating that more investors have been moving their holdings to centralized platforms. This doesn’t guarantee a price collapse but is a bearish factor since such behavior often precedes selling.

Binance Free $600 (CryptoPotato Exclusive): Use this link to register a new account and receive $600 exclusive welcome offer on Binance (full details).
LIMITED OFFER for CryptoPotato readers at Bybit: Use this link to register and open a $500 FREE position on any coin!


Disclosure: This article does not represent investment advice. The content and materials featured on this page are for educational purposes only.
Playnance will launch G Coin on March 18 to power transactions across its blockchain gaming and prediction ecosystem.
Summary
- Playnance will launch G Coin on March 18 to power its gaming and prediction ecosystem.
- G Coin will run on PlayBlock, enabling fast, gas-free transactions across platforms.
- Playnance reports 200k token holders and 300k users ahead of the G Coin token generation event.
Playnance is launching G Coin on March 18, introducing the token that will support economic activity across its blockchain entertainment ecosystem.
The company says the token will power interactions across gaming platforms, sports prediction markets, and financial participation tools operating within the Playnance network.
According to Playnance, the token already has more than 200,000 holders prior to its official launch. Roughly 13 billion tokens were distributed during the presale phase. The project’s market capitalization is estimated to be around $38 million ahead of the Token Generation Event.
G Coin is designed to function as the economic infrastructure across the ecosystem. It will facilitate gameplay activity, predictions, rewards, and settlement transactions across Playnance platforms.
The token runs on PlayBlock, the company’s blockchain infrastructure designed to support fast and gas-free interactions while maintaining non-custodial ownership and full on-chain transparency.
Playnance reports that its ecosystem currently includes more than 300,000 registered users and partnerships with over 30 game studios. More than 10,000 blockchain-based games are available across the network.
Across these platforms, around 2 million on-chain transactions are processed daily. Users also interact with more than 2.5 million sports events annually.
Playnance CEO Pini Peter said that G Coin introduces a usage-driven token economy designed to grow alongside its expanding global community.
The company also reported that its “Be The Boss” program has exceeded $2 million in payouts to participants. Total revenue generated across the ecosystem has surpassed $5.3 million.
The token will follow a fixed supply model capped at 77 billion tokens. Circulating supply will be managed through a lock and release system. Tokens lost during gameplay will remain locked for 12 months before being reintroduced to circulation. Unsold tokens from the Token Generation Event will be subject to a 12-month cliff and a 24-month linear vesting schedule.
Disclosure: This content is provided by a third party. Neither crypto.news nor the author of this article endorses any product mentioned on this page. Users should conduct their own research before taking any action related to the company.

Tragedy or Triumph? Hamnet on 4K UHD Disc: Review
Ex-Manchester United star who agreed to take pay cut opens up on challenging time

Fats and oils in the spotlight


-
Business6 days ago
Form 8K Entergy Mississippi LLC For: 6 March
-

 News Videos3 days ago
10th Algebra | Financial Planning | Question Bank Solution | Board Exam 2026
-

 Fashion6 days ago
Weekend Open Thread: Ann Taylor
-

 Crypto World3 days ago
Paradigm, a16z, Winklevoss Capital, Balaji Srinivasan among investors in ZODL
-
 Tech1 day ago
A 1,300-Pound NASA Spacecraft To Re-Enter Earth’s Atmosphere
-

 Tech2 days ago
ChatGPT will now generate interactive visuals to help you with math and science concepts
-

 Politics6 days ago
Top Mamdani aide takes progressive project to the UK
-

 Business2 days ago
ExxonMobil seeks to move corporate registration from New Jersey to Texas
-

 Sports5 days ago
Three share 2-shot lead entering final round in Hong Kong
-

 Sports5 days ago
Braveheart Lakshya downs Lai in epic battle to enter All England Open final | Other Sports News
-

 NewsBeat1 day ago
Residents reaction as Shildon murder probe enters second day
-

 Entertainment6 days ago
Hailey Bieber Poses For Sexy Selfies In New Luscious Lip Thirst Traps
-

 Business4 days ago
Search for Nancy Guthrie Enters 37th Day as FBI Probes Wi-Fi Jammer Theory
-

 Business1 day ago
Search Enters Sixth Week With New Leads in Tucson Abduction Case
-
 NewsBeat3 days ago
Pagazzi Lighting enters administration as 70 jobs lost and 11 stores close across Scotland
-

 Tech3 days ago
Despite challenges, Ireland sixth in EU for board gender diversity
-

 Business3 days ago
Search Enters 39th Day with FBI Tip Line Developments and No Major Breakthroughs
-

 NewsBeat1 day ago
I Entered The Manosphere. Nothing Could Prepare Me For What I Found.
-

 Business6 days ago
Iran war enters second week as Trump demands ’unconditional surrender’
-

 Sports3 days ago
Skateboarding World Championships: Britain’s Sky Brown wins park gold