
Crypto World
CLARITY Act faces 2030 delay warning from Senator Lummis


A new push for the CLARITY Act is building in Washington as crypto policy supporters warn the timeline may be narrowing.
Summary
- Cynthia Lummis warned Congress may miss its best chance to pass the CLARITY Act soon.
- David Sacks and crypto leaders urged the Senate to move market structure legislation forward now.
- Senate progress may depend on resolving stablecoin yield disagreements before a markup hearing begins.
Senator Cynthia Lummis said Congress must move soon or risk delaying market structure reform for years.
Lummis said the United States may miss a rare opening to pass the CLARITY Act if lawmakers fail to act soon. She said the bill may not get another real chance until at least 2030.
In a post on X, Lummis wrote, “This is our last chance to pass the Clarity Act until at least 2030.” She added, “We can’t afford to surrender America’s financial future.”
The warning comes as crypto policy supporters watch the political calendar. With US midterm elections set for November, some industry figures fear Congress could shift focus and slow work on crypto legislation.
That concern has kept attention on the bill’s timing. Supporters say the next few months may decide whether the measure advances during the current session.
Former White House AI and crypto czar David Sacks also called for quick action. He said the Senate Banking Committee and the full Senate should move the bill forward.
Sacks said, “The time to act is now. Senate Banking, and then the full Senate, should pass market structure.” He added that he expects President Donald Trump to sign the bill if Congress approves it.
Other industry voices have also backed the legislation. A16z Crypto managing partner Chris Dixon said,
“when rules are defined, both consumers and entrepreneurs win.”
Immutable founder Robbie Ferguson also backed the bill. On April 3, he said, “the CLARITY Act will make the last decade of growth in gaming look like a joke.”
Senate progress depends on key issues
Coinbase Chief Executive Brian Armstrong said on Friday that “it’s time” for the bill to pass after months of delays. His comment added to fresh calls for movement in the Senate.
Coinbase Chief Legal Officer Paul Grewal said on April 2 that the CLARITY Act could be nearing a markup hearing in the Senate Banking Committee. He also said disagreements over stablecoin yield still need to be resolved.
Regulators have also shown support. SEC Chairman Paul Atkins said,
“It’s time for Congress to future-proof against rogue regulators & advance comprehensive market structure legislation to President Trump’s desk.”


TLDR:
- Ethereum posted a -3.19% daily move, rejecting near $2,300 and closing lower within the range
- Price remains range-bound between $2,000 and $2,300 after exiting a prolonged downtrend phase
- Momentum indicators show weakening strength as MACD histogram shrinks and lines converge
- Key support at $2,110 faces pressure, while resistance near $2,300 continues limiting upside attempts
Ethereum began the second quarter with mild gains, yet recent price action shows hesitation near key resistance levels.
A daily chart shared by analyst Daan Crypto Trades points to weakening momentum, as ETH struggles to sustain upward movement within a defined consolidation range.
What Does Current Price Action Reveal About Ethereum’s Market Structure?
A tweet from Daan Crypto Trades outlines Ethereum’s current position on the ETH/USD 1D chart from Bitstamp. The latest candle opened at 2,285.1 and reached a high of 2,289.3.
The price later dropped to a low of 2,176.6 before closing at 2,212.8. This marks a decline of 72.8 points, representing a 3.19% loss on the day.
This daily candle reflects a strong rejection near the upper boundary of the range. The close near the lower half of the candle suggests that sellers regained control during the session. As a result, upward attempts faced resistance, limiting further gains in the short term.
Looking at the broader structure, Ethereum remains in a recovery phase after a prolonged decline. From November to February, the market formed consistent lower highs and lower lows. During that period, price dropped from above 4,000 to around 1,700.
Since March, the structure has shifted into sideways movement. Price has been trading between 2,000 and 2,300, forming a consolidation range.
This range reflects a balance between buyers and sellers after the earlier decline. While higher lows have formed since February, resistance continues to cap upward movement near 2,300 to 2,400.
How Do Indicators and Key Levels Shape Ethereum’s Next Move?
Volatility bands on the chart provide further context for current price action. The upper band sits near 2,295.8, while the middle band stands at 2,112.8.
The lower band is positioned around 1,941.7. Price recently tested the upper band but failed to break above it. This rejection pushed the price back toward the mid-band level.
The mid-band near 2,110 now acts as a short-term pivot zone. Holding above this level may support continued consolidation.
However, a break below could expose the lower range near 2,000. The lower band at 1,940 remains a deeper support level if selling pressure increases.
Momentum indicators also show a shift in strength. The MACD-style oscillator remains positive, with the histogram reading at +0.86%.
The fast line stands near 1.71%, while the signal line is around 0.86%. Although momentum turned positive recently, the histogram is shrinking, and the lines are converging.
This pattern often signals slowing upward momentum. As a result, buying pressure appears to be fading near resistance levels. This aligns with the recent rejection near 2,300, where sellers stepped in again.Source: TradingView
Resistance remains clearly defined between 2,295 and 2,320. A break above this zone would open the path toward 2,400 and beyond.
On the downside, immediate support lies between 2,110 and 2,120. Below that, the 2,000 to 2,050 range continues to act as a strong floor.
Current conditions suggest a market still searching for direction. Short-term movement leans toward the downside following the recent rejection. However, the broader structure remains range-bound, with no confirmed breakout yet.
If price drops below 2,110, a move toward 2,000 becomes more likely. On the other hand, reclaiming 2,300 could shift momentum back toward higher targets between 2,500 and 2,700.

Crypto World
Trump Moves to Choke Iran’s Ports Without Closing the World’s Oil Lifeline, CENTCOM Confirms


U.S. Central Command (CENTCOM) will begin enforcing a blockade on all maritime traffic entering and exiting Iranian ports on April 13 at 10 a.m. ET, according to an official announcement issued in line with a presidential proclamation.
The directive applies to all vessels, regardless of flag or ownership, operating in Iranian coastal waters, including ports in the Arabian Gulf and the Gulf of Oman.
U.S. to Enforce Blockade on Iranian Ports as CENTCOM Announces Maritime Clampdown
However, CENTCOM emphasized that the measure will not impede freedom of navigation for ships transiting the Strait of Hormuz to or from non-Iranian ports, a critical distinction aimed at maintaining global energy flows.
“The blockade will be enforced impartially against vessels of all nations entering or departing Iranian ports and coastal areas, including all Iranian ports on the Arabian Gulf and Gulf of Oman,” the CENTCOM articulated.
Officials said the operation will be enforced impartially and that commercial mariners will receive additional guidance through formal “Notice to Mariners” communications ahead of implementation.
Vessels operating in the Gulf of Oman and approaches to the Strait of Hormuz are being advised to monitor maritime broadcasts and maintain contact with U.S. naval forces on bridge-to-bridge VHF channel 16.
The move marks a significant escalation in maritime pressure on Iran amid ongoing regional tensions that have already disrupted shipping routes and heightened global energy market volatility.
Analysts note that while the Strait of Hormuz remains open, restricting access to Iranian ports could intensify economic strain on Tehran.
CENTCOM did not provide details on the duration of the blockade but indicated further operational updates will follow as conditions evolve in the region.
Shipping operators and energy traders are expected to closely monitor developments as enforcement begins, with maritime risk assessments likely to be revised in real time.
Insurance premiums for Gulf-bound cargoes could also fluctuate depending on the scope of enforcement and any Iranian response.
The situation remains fluid, with governments and commercial fleets awaiting further clarification from U.S. naval authorities in the coming hours and days ahead of scheduled rollout begins period.
“Enjoy the current pump figures. With the so-called ‘blockade’, Soon you’ll be nostalgic for $4–$5 gas,” wrote Ghalibaf, Speaker of the Islamic Republic of Iran’s Parliament.
The post Trump Moves to Choke Iran’s Ports Without Closing the World’s Oil Lifeline, CENTCOM Confirms appeared first on BeInCrypto.
Bitcoin fell below $71,000 on Sunday as talks between the United States and Iran stalled, underscoring how geopolitical tensions are seeping into crypto markets even as traders weigh liquidity and inflation factors. Data from TradingView showed BTC trading under the key threshold as a weekly close approached, highlighting the asset’s sensitivity to the ebb and flow of risk appetite amid flare-ups in the Strait of Hormuz and diplomatic deadlock.
Key points:
- BTC softens after news that US–Iran negotiations in Islamabad broke down, reviving risk-off pressure.
- US threats to reopen and police the Strait of Hormuz amplified concerns about energy prices and inflation dynamics.
- Bitcoin-long positions faced notable liquidations, signaling renewed volatility in the immediate term.
Diplomatic setback reverberates through crypto markets
In the wake of stalled talks aimed at curbing Iran’s nuclear ambitions, negotiations between the US and Iran were left unfinished as delegations left Islamabad without an agreement. The breakdown coincided with President Donald Trump’s explicit threat to blockade the Strait of Hormuz and to interdict vessels that pay for passage, a move that would directly affect global oil flows and prices. Trump later amplified the stance via Truth Social, reiterating calls for fully operational transit through Hormuz.
The geopolitical headline set the stage for a broader market assessment: if the conflict escalates or oil supply becomes more constrained, inflation pressures could intensify and complicate the policy path for central banks. The Kobeissi Letter, a market commentary that authors follow closely on X, framed the immediate macro risk thus: “If the path forward is continued war, escalation, and a prolonged closure of the Strait of Hormuz, then the Iran War has just entered a new era.” The note further tied inflation dynamics to energy prices, warning that CPI inflation could spike higher if geopolitical tensions persist.
Meanwhile, financial markets prepared for a stream of inflation data and policy commentary. The March CPI print had shown a notable jump in inflationary pressures, though the month’s headline figure landed slightly below consensus expectations; what mattered more for markets was the oil-price component’s surprise surge—the strongest in six decades—within the CPI release. Analysts argued that a sustained rise in energy costs could sustain higher inflation readings, complicating the Federal Reserve’s balancing act between taming inflation and supporting growth.
Against this backdrop, market participants questioned whether the escalation would push policymakers toward stimulus or liquidity measures if risk assets continued to wobble. On X, veteran trader Michaël van de Poppe argued that a longer flare-up in the Iran situation would likely hamper risk-on assets, prompting discussions about possible Fed intervention. He suggested that a weak economy could force the central bank to reassert its unconventional toolkit, potentially rekindling the liquidity wagon that has historically buoyed risky assets during periods of stress.
Bitcoin liquidity metrics echo renewed volatility
Bitcoin’s price reaction unfolded as a mixed bag of risk signals and technical pressure. In the lead-up to the opening of futures markets, BTC’s move below $71,000 represented a retreat from recent highs and highlighted a potential trigger for late-long positions to unwind. Market data from CoinGlass indicated heightened volatility, with long liquidations climbing toward the $350 million mark over the preceding 24 hours. The liquidation heat map pointed to a tremor in speculative bets as traders repositioned in response to a shifting macro and geopolitical backdrop.
For traders, the impulse to seek safer harbors clashed with the crypto market’s own risk profile. Crypto traders often respond quickly to macro headlines because crypto markets are still highly sensitive to liquidity conditions and the stance of global financial policy. The latest data underscored that even a single, loud geopolitical cue can cascade into material downside pressure for long positions, especially when paired with concerns about energy prices and inflation expectations.
“Volatility remains high, and there won’t be a path forward where risk-on assets perform well if this remains the consensus,” wrote a notable market observer in response to the current environment.
Those who watch the broader macro canvas note an emerging tension: a weaker real economy could prompt a renewed dose of monetary accommodation, which historically has supported risk assets in the short term but could complicate inflation trajectories over the longer horizon. The question traders are tracking is whether the Fed and other major central banks will lean into more expansive policy if geopolitical risk sustains its grip on markets, or if tighter financial conditions will reassert themselves as inflation drivers remain in focus.
Inflation risk, policy expectations, and what comes next
Beyond the immediate price action, the narrative around inflation and policy remains central to crypto’s risk-reward calculus. The March CPI data had shown a notable oil-price component spike, underscoring how energy dynamics can tilt inflation readings and, by extension, central-bank guidance. Kobeissi’s analysis linked these dynamics to the Iran scenario, arguing that a protracted conflict could push inflation higher, potentially prompting renewed monetary support or liquidity measures to cushion real-economy weakness.
Looking ahead, investors will be watching the upcoming suite of inflation indicators, including the March Producer Price Index (PPI) release, for signals about the breadth of price pressures. Additionally, speeches from senior Federal Reserve officials will likely frame the near-term policy outlook more clearly. In that context, Bitcoin and other crypto assets could continue to act as a barometer for how traders interpret the risk of policy missteps amid geopolitical stress and energy-price volatility.
What to watch next
The immediate focus remains on how geopolitical tensions evolve and what that means for energy markets, inflation, and central-bank responses. If talks resume or a de-escalation path emerges, crypto traders could reassess risk appetites, potentially stabilizing prices as liquidity conditions normalize. Conversely, further escalation—whether through renewed sanctions, renewed missile rhetoric, or supply-chain disruptions in energy markets—could keep volatility elevated and drive continued attention on liquidity dynamics and macro forecasts.
Investors should also monitor how long the current risk-off mood persists and whether the market receives a clearer signal from policy makers about their tolerance for inflation versus economic growth trade-offs. The next few weeks promise to be data-rich, and the balance of macro signals—oil prices, inflation readings, and central-bank communications—will likely set the tone for Bitcoin and broader crypto markets as they navigate a geopolitically unsettled environment.
This editorial summary reflects observed market reactions and publicly available data points from TradingView, CoinGlass, and market commentary circulating around the geopolitical narrative surrounding US–Iran tensions and Hormuz-related risks. As always, readers should perform their own due diligence and consider multiple scenarios as the macro landscape evolves.
Next up, traders will scrutinize inflation trajectories and policy guidance to assess whether crypto assets gain or lose traction in a macro environment increasingly shaped by energy prices and geopolitical risk.
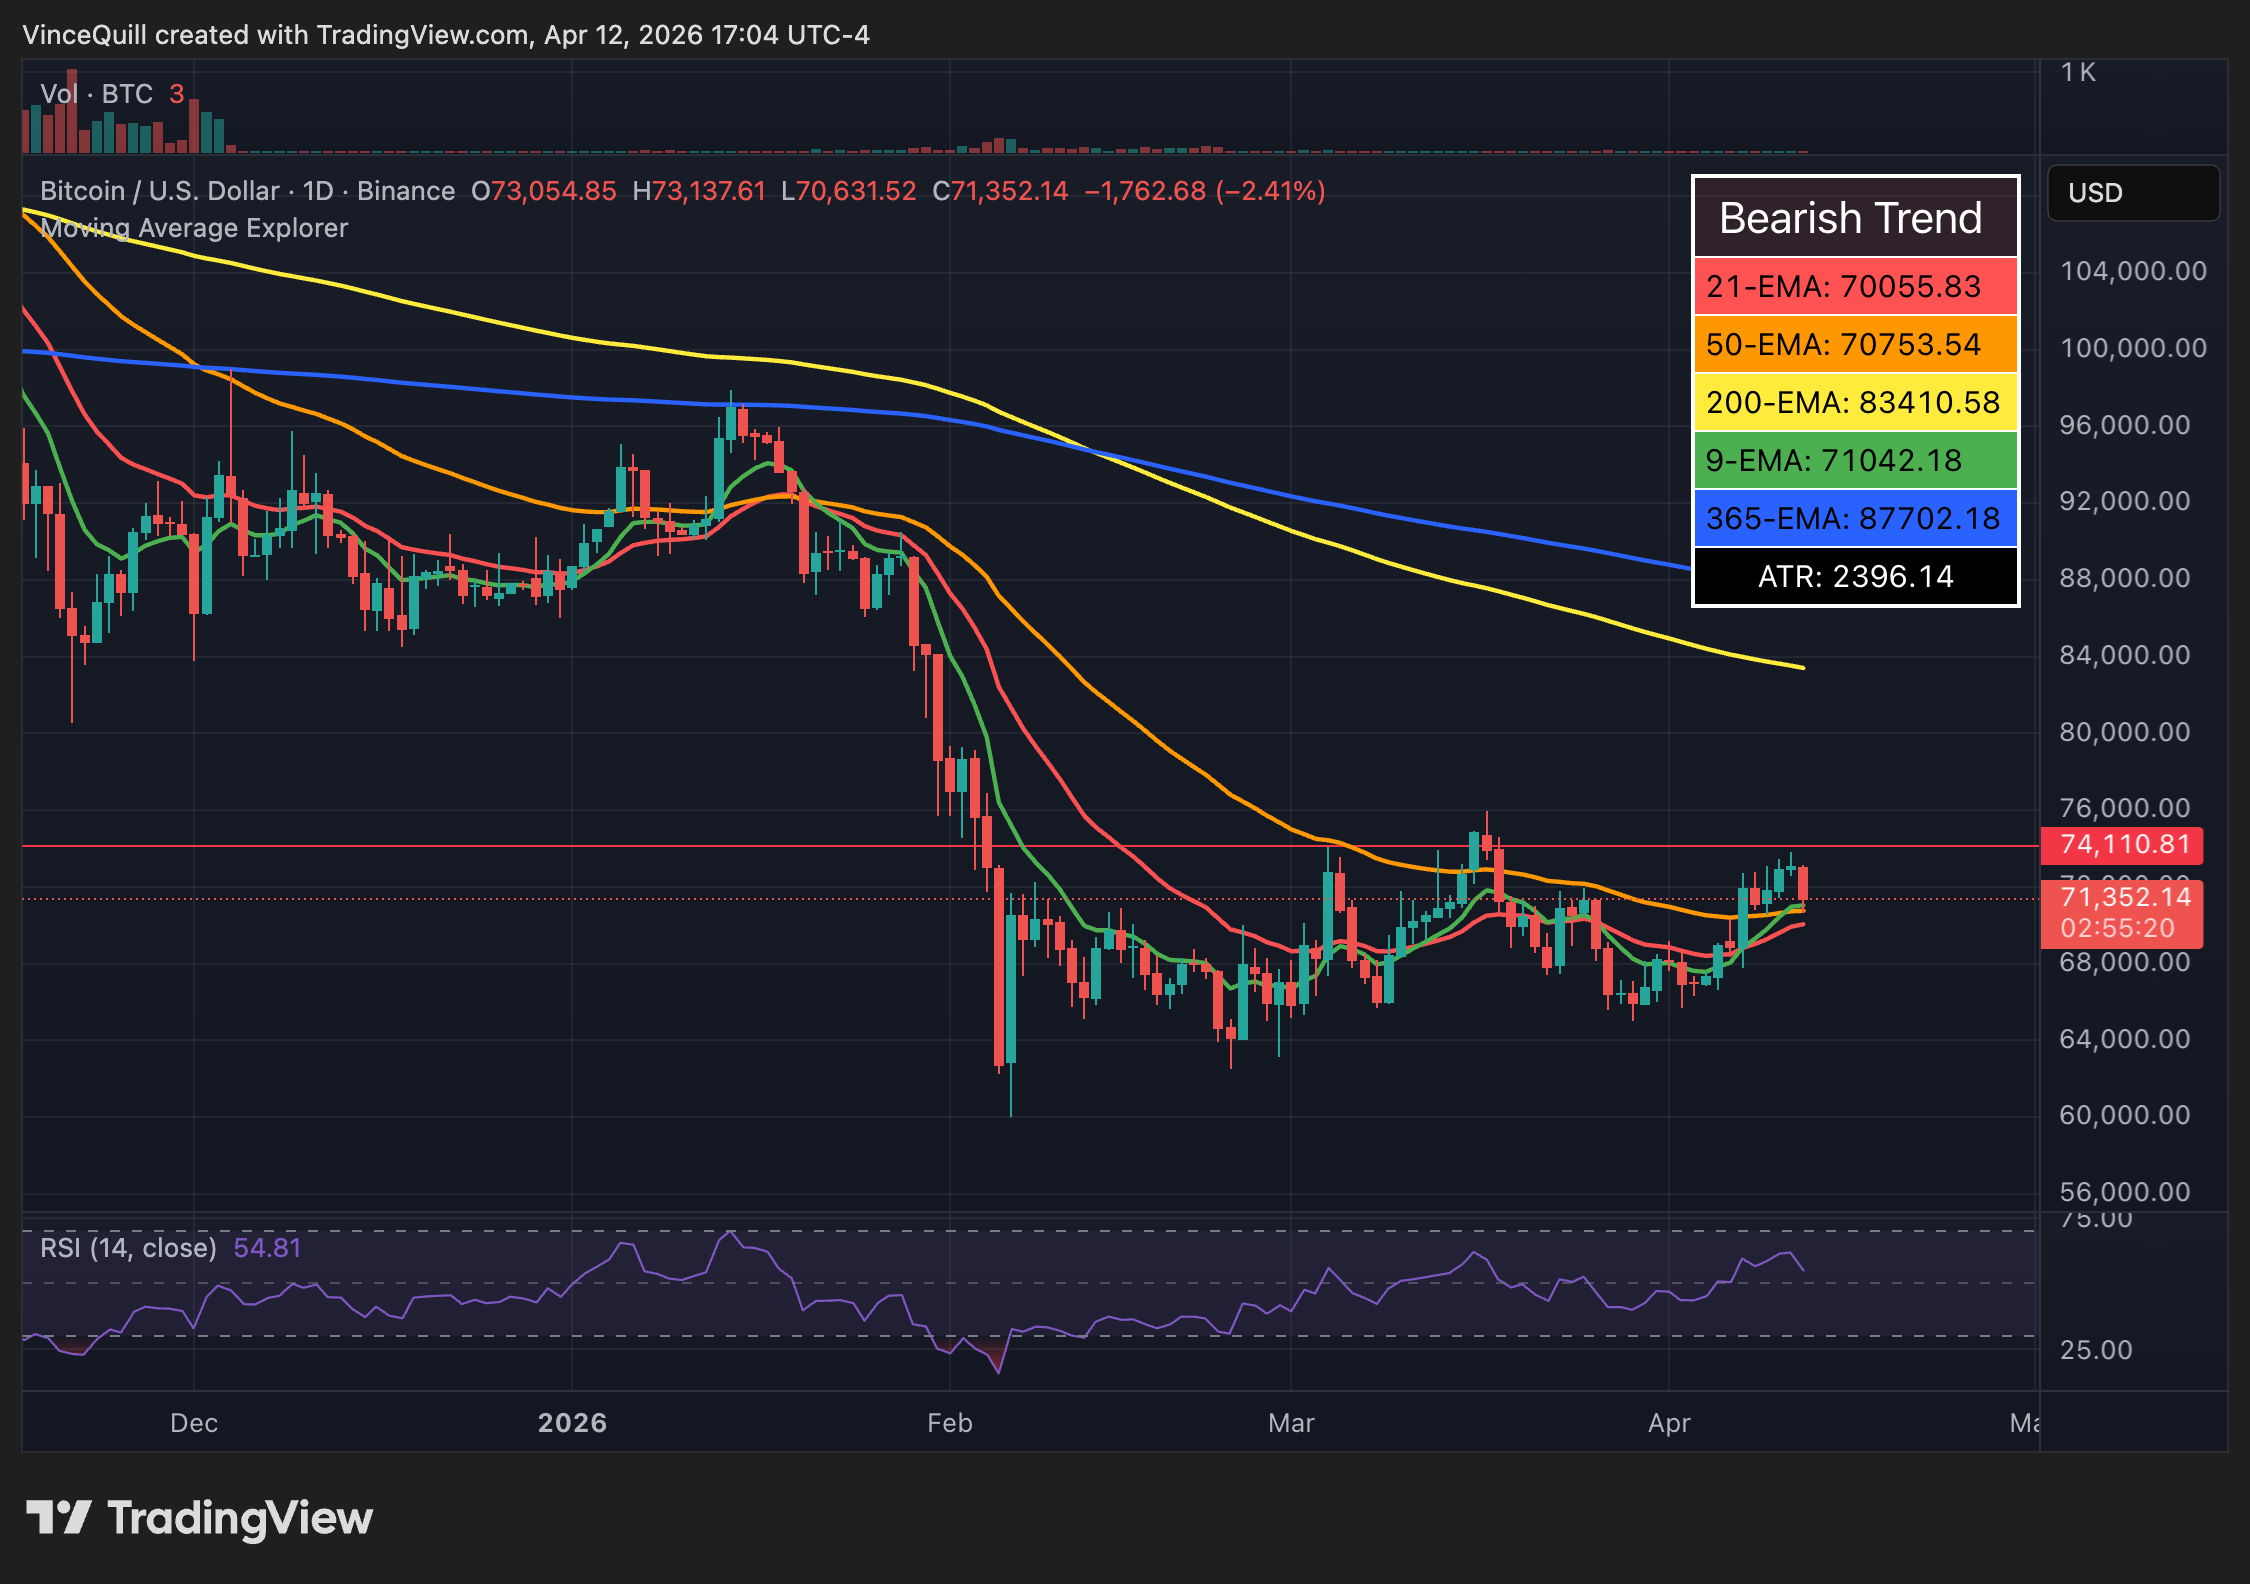
Now almost a week old, the Bitcoin (BTC) recovery is “fragile” as the crypto market faces geopolitical and macroeconomic headwinds from the ongoing war in the Middle East, according to Nic Puckrin, a crypto market analyst and founder of the CoinBureau media outlet.
“Even if the war ends now, its repercussions will likely be the story of 2026, and certainly the dominant narrative for Q2. I don’t expect to see a rate cut until late Q3 or Q4, if at all,” Puckrin told Cointelegraph. He said that he sees:
“For a push toward $90,000, we would need to see a combination of factors: a ceasefire that results in the end of geopolitical tensions, a sustained drop in oil prices toward $80, and ideally also softer-than-expected economic data that calms stagflation fears.”
If Bitcoin closes the week above $71,000, it could signal continued upside for BTC, with resistance forming around the $74,000 level, he said. At last look, it was trading at about $71,276, according to TradingView data.

The ongoing conflict has caused an inflationary spike, according to the US Bureau of Labor Statistics (BLS) Consumer Price Index report, published on Friday, chilling hopes of further interest rate cuts in 2026. Rate cuts or credit easing tend to stimulate asset prices.
Related: Bitcoin, Ether near levels that could signal trend reversal: Analyst
Bitcoin stumbles as Iran negotiations fail and US President threatens major escalation
Bitcoin surged by about 5.8% beginning on April 6, reaching above $73,000, before retracing to about $71,000 on April 11, following news of failed negotiations between the US and Iran, according to the Kobeissi Letter.
“Peace talks appear to have come to a screeching halt,” Kobeissi Letter said, adding, “the outcome of talks was arguably the worst-case scenario.”
Following the failed peace talks, US President Donald Trump said he directed the US military to form a naval blockade around the Strait of Hormuz.
“I have also instructed our Navy to seek and interdict every vessel in international waters that has paid a toll to Iran. No one who pays an illegal toll will have safe passage on the high seas,” Trump said on Saturday.

Members of the Federal Open Market Committee (FOMC), which decides interest rate policy in the US, remain divided on further interest rate cuts in 2026, citing inflation concerns from the war.
The FOMC did not rule out an interest rate hike in 2026 if inflation remains elevated above its 2% target, according to the meeting minutes from the March FOMC meeting.
According to the CME Fedwatch tool, there is more than a 98% probability of the FOMC maintaining the current target rate range of 350-375 basis points at the next two meetings, on April 29 and June 17. Chances drop to about 65% for the July 29 meeting, with a 33.6% probability of a 25-bps cut.
Magazine: Big Questions: Can Bitcoin save you from the dreaded Cantillon Effect?
TLDR:
- Dogecoin completed two accumulation cycles, producing gains of 480% and 190% before each correction.
- A third accumulation zone is forming inside a descending channel with multiple failed breakout attempts.
- Analysts set upside targets at $0.50, $1, and $2, with a full cycle projection reaching near 2,700%.
- A higher-timeframe close below $0.048 remains the critical invalidation level for the current bullish fractal.
A third accumulation zone is quietly taking shape on Dogecoin’s weekly chart, tucked inside a descending channel that few are paying attention to right now.
History, however, has a way of rewarding patience in crypto markets. Two prior cycles delivered gains of 480% and 190% respectively — and analysts tracking the current structure believe the next move could dwarf them both.
Dogecoin’s Fractal Cycles Point to a Familiar Setup
The Dogecoin weekly chart spanning 2021 to 2026 outlines a recurring market structure. Two completed cycles show distinct periods of price consolidation followed by sharp upward moves.
The first cycle produced a 480% gain after an extended accumulation phase. The second followed with a 190% move under a similar setup.
Chart analysts describe this behavior as fractal repetition, where market structure rhymes across different time periods. The sequence of accumulation, breakout, correction, and expansion remains consistent across both cycles.
A third accumulation zone now appears to be forming on the weekly timeframe. Price is currently consolidating inside a descending channel, with multiple failed breakout attempts already recorded.
Analysts note that price stability at this level reflects steady demand absorption from long-term holders. The longer the price remains at this range, the stronger the eventual breakout tends to be.
Resistance Targets, Corrections, and What Traders Are Watching
The chart identifies three major upside targets for the next potential expansion. The first resistance sits near $0.50, aligned with a prior structural supply zone. Beyond that, $1 carries psychological and technical weight.
A full cycle extension places the projected target near $2. A confirmed higher-timeframe close below $0.048 remains the key invalidation level.
Losing this threshold would break the existing market structure and signal that the fractal is no longer valid. The current corrective phase has already drawn down approximately 83% from the prior cycle peak.
Some analysts believe the correction could extend further before a recovery begins. One observer remarked: “Doge is only bought when it has big and medium climbs, but during -80% corrections, no one even writes anything about it anymore.”
Certain traders have outlined entry strategies near Fibonacci retracement zones, with one planning to accumulate 100,000 DOGE at the Fibonacci level 1 area. Speculation around
Elon Musk’s potential involvement with Dogecoin in the next cycle also continues to circulate among market participants.
TLDR:
- Bitcoin trades near $72K, approaching strong resistance within a well-defined ascending channel range.
- Analysts warn a move toward $77K may trigger a liquidity grab before a possible bearish reversal.
- Strong support remains at $60K–$62K, where buyers have repeatedly prevented deeper declines.
- Market remains in a compression phase, with a breakout or rejection likely to define the next move.
Bitcoin continues to trade within a defined range after a sharp decline, with price action showing controlled recovery.
Market participants remain cautious as resistance nears, while analysts monitor whether the current structure leads to a breakout or renewed downside pressure.
Bitcoin Trades Within Ascending Channel as Resistance Nears
A recent tweet by Captain Faibik outlines a cautious outlook for Bitcoin despite short-term upward movement. He maintains that a bearish flag remains active on the daily timeframe, even as price attempts minor recoveries.
According to his view, brief rallies have repeatedly shifted sentiment, though broader control still leans toward sellers.
The chart shared alongside the tweet shows Bitcoin recovering from a steep drop near the $95,000 to $100,000 range.
That decline extended toward the $58,000 to $60,000 zone, where strong buying interest emerged. Since then, price has formed a structured recovery, building higher lows and gradually moving within an ascending channel.
Currently, Bitcoin trades near the $71,000 to $72,000 level. This places it in the upper-middle section of the channel, where momentum appears stable but constrained.
The upper boundary between $74,500 and $77,000 has acted as resistance, rejecting multiple attempts to move higher.
At the same time, the lower boundary around $60,000 to $62,000 continues to serve as a demand zone. Buyers have consistently stepped in at this level, preventing deeper declines.
As price approaches resistance again, traders are watching closely for either a breakout or another rejection.
Bearish Bias Remains Despite Altcoin Activity
Captain Faibik noted in his tweet that a move toward the $77,000 to $78,000 region could occur before a potential decline.
He pointed to a possible liquidity grab followed by a drop toward the $54,000 to $56,000 range. However, he emphasized that confirmation is still required before taking positions.
He also explained his contrasting stance on Bitcoin and altcoins. While maintaining a bearish view on Bitcoin, he has remained active in select altcoins over recent months.
His allocation strategy reflects this approach, with roughly half of his funds held in stable assets and the rest split between midterm altcoin positions and swing trades.
Meanwhile, key levels continue to guide market behavior. Immediate support sits near $70,000, while a mid-channel range between $66,000 and $68,000 acts as a balance zone.
Resistance remains firm below $77,000, and a clear break above this area would shift focus toward the $80,000 to $85,000 region.
Price action within the channel suggests a period of compression. This type of structure often precedes a sharp move once resistance or support gives way.
Until then, Bitcoin remains range-bound, with both upward continuation and downside rotation still possible.
The tweet reflects a wait-and-see approach, with no active trades opened yet. Market participants continue to monitor price behavior near resistance, as confirmation will likely determine the next directional move.
TLDR:
- JasmyCoin shows repeated falling wedge patterns, often linked with weakening bearish momentum.
- Multi-year consolidation reflects a balance between buyers and sellers before a possible trend shift.
- Current price compression near wedge support suggests a potential buildup toward a breakout move.
- A projected move toward $0.2785 depends on confirmed resistance breakout and sustained momentum.
JasmyCoin is drawing renewed attention after a technical analysis projected a potential long-term breakout toward higher price levels.
The outlook is based on multi-year chart structures that show extended consolidation, repeated falling wedge formations, and a possible transition from a prolonged downtrend into a bullish phase.
Multi-Year Structure Signals Gradual Market Shift
A recent tweet by Javon Marks outlined a macro view of JasmyCoin’s price action across several years. The analysis describes a clear transition from a sharp post-2021 decline into a more structured consolidation phase.
During the earlier cycle, the asset recorded consistent lower highs and lower lows, forming descending channels that reflected sustained selling pressure.
As time progressed, the chart began to show signs of stabilization. A falling wedge pattern emerged during the mid-cycle phase, where price action tightened within converging trendlines.
This structure often reflects weakening bearish momentum. A breakout attempt followed, leading to a short-lived upward move, which suggested early accumulation behavior.
After that move, JasmyCoin entered a broader consolidation range marked by sideways price action. The chart indicates multiple swings within this zone, showing a balance between buyers and sellers.
This range also reflects improved structural stability compared to the earlier downtrend phase. Such conditions often precede larger directional moves once market pressure resolves.
Current Compression Points to Potential Breakout Setup
More recently, the chart shows another falling wedge formation developing on the right side. Price action continues to compress toward the apex of this pattern, indicating reduced volatility and tightening market conditions. This setup often attracts attention due to its association with breakout scenarios.
The current price position remains near the lower boundary of the wedge. This area is commonly viewed as a demand zone where buyers may step in.
At the same time, the upper trendline serves as a resistance level that traders monitor for confirmation of a breakout.
Javon Marks’ tweet also pointed to a projected move toward the $0.2785 level. This target represents a large percentage increase from current prices, contingent on a confirmed breakout and sustained market support.
The projection is illustrated by a curved upward path on the chart, suggesting a gradual expansion rather than an immediate surge.
The broader structure suggests a transition from accumulation into a potential markup phase. However, this depends on whether price action can move above resistance levels with consistent momentum. If the asset fails to break out, the chart suggests continued consolidation or further compression within the wedge.
Overall, the analysis presents a technical setup where JasmyCoin approaches a key decision point. The combination of repeated wedge formations and long-term consolidation continues to shape expectations around a possible trend reversal, depending on future price behavior and market conditions.
Crypto World
XRP Tightens Near $1.33 as Market Builds Pressure Between Key Support and Resistance Levels
TLDR:
- XRP remains in a tight consolidation range near $1.33 with reduced volatility and declining trading volume in sessions.
- MACD shows a bullish crossover with the histogram turning positive, though the overall trend remains below the zero line.
- RSI stays below 50 at mid-40 levels, signaling weak momentum and a continued market indecision phase.
- Price action stays between $1.30 support and $1.50 resistance as traders wait for breakout confirmation signals.
XRP continues to trade within a tight range after months of decline, with recent data showing early signs of stabilization.
Market participants are closely watching resistance and support levels, as technical indicators signal a potential directional move.
XRP Consolidates After Downtrend as Key Levels Come Into Focus
XRP price action shows a clear shift from a prolonged decline into a consolidation phase. From November through early February, the asset recorded consistently lower highs and lower lows. A sharp drop in early February pushed prices toward the $1.20–$1.25 range.
Since that move, XRP has stabilized and now trades between defined levels. Immediate support sits near $1.30–$1.32, while resistance is seen between $1.45 and $1.50. At the time of analysis, XRP trades at $1.33168, reflecting a daily decline of 1.74%.
The narrowing price range suggests reduced volatility. Candles have become tighter, indicating a pause in aggressive selling.
Volume has also declined during this phase, pointing to reduced market participation. Traders often associate such conditions with a buildup before a larger move.
A recent post by analyst Ali Charts adds a broader perspective. The analyst notes that XRP has remained within a nine-year ascending triangle on the monthly chart. According to the post, repeated rejections at resistance have followed a consistent pattern since 2017.
The same analysis points to a potential retest of macro support between $0.75 and $0.80. This zone is described as a key level to watch if broader weakness returns. The long-term structure remains intact unless that rising trendline is broken.
Momentum Indicators Show Early Recovery but No Clear Trend Yet
Momentum indicators present a mixed picture, reflecting the ongoing consolidation. The Moving Average Convergence Divergence (MACD) shows early signs of recovery. The MACD line has crossed above the signal line, with a reading of -0.01580 against -0.01996.
The histogram has turned slightly positive at 0.00416. This shift indicates a mild increase in bullish momentum. However, both lines remain below the zero mark, which keeps the broader trend in a neutral to bearish zone.
At the same time, the Relative Strength Index (RSI) remains below the midpoint. Current readings show RSI at 43.98, with its moving average at 43.26. This level reflects weak momentum and no clear dominance by buyers or sellers.
The RSI has recovered from oversold conditions seen during February’s decline. Still, it remains below 50, suggesting that bullish strength has not fully developed. The indicator is flattening, which aligns with the ongoing sideways movement.
Market structure now depends on a breakout from the current range. A move above $1.45–$1.50 could open the path toward $1.60 and $1.70. Such a move would likely require stronger volume and confirmation from momentum indicators.
On the downside, a break below $1.30 could lead to a retest of $1.20–$1.25. If that level fails, attention may shift to lower support zones. For now, XRP continues to trade within a defined range as the market waits for clearer direction.
TLDR:
- Gold now accounts for 24% of global central bank reserves, overtaking US Treasuries at just 21%.
- Gold’s reserve share has nearly tripled since 2015, driven by central bank buying and rising prices.
- The US seizure of Russia’s reserves in 2022 triggered a global shift away from dollar-denominated assets.
- China and BRICS nations have led steady US Treasury sell-offs since 2022, accelerating de-dollarisation.
Gold surpasses US Treasuries in global central bank reserves for the first time since the mid-1990s, with gold now commanding 24% of reserves against Treasuries’ 21%, Bloomberg data confirms.
The shift, years in the making, reflects sustained central bank buying, soaring gold prices, and a deliberate move away from dollar dependency. geopolitical shocks, from the seizure of Russia’s reserves to escalating US tariffs.
All have accelerated a de-dollarisation trend that is now reshaping the foundation of the international monetary system.
Gold Overtakes US Treasuries in Reserve Composition
Gold now accounts for 24% of global central bank reserves, while US government debt sits at 21%, according to Bloomberg data.
This marks a sharp reversal from the final quarter of 2015, when Treasuries made up 33% of reserves and gold just 9%.
Gold’s share has nearly tripled over the last decade, driven by aggressive central bank purchases and a sustained rise in gold prices.
Emerging market central banks have led this accumulation. These institutions have steadily diversified away from dollar-denominated assets, accelerating purchases as part of broader reserve management strategies.
The trend gained momentum from around 2017, when USD reserve growth began to plateau, while gold continued rising in both price and share.
Gold now makes up 24% of global central bank reserves, surpassing US Treasuries at 21% for the first time since the mid-1990s.
The reallocation reflects a growing preference for assets that carry no counterparty risk. Unlike US Treasuries, gold cannot be frozen or devalued through a foreign government’s policy decisions, making it attractive to reserve managers navigating a more uncertain geopolitical environment.
Geopolitical Shocks Deepen the De-Dollarisation Trend
The pace of change accelerated sharply in 2022 when the US seized Russia’s central bank reserves following the conflict in Ukraine. The move alarmed reserve managers globally and prompted many to reassess their exposure to dollar-denominated assets.
China and the leading BRICS nations began selling US Treasury bills in earnest from that year. Selling intensified further in April 2024 after the Trump administration launched the Liberation Day tariff scheme.
Additional pressure came from Operation Epic Fury, which further undermined confidence in the US as a reliable financial partner. These events together have driven a sustained shift in reserve composition.
While the US dollar remains dominant in global trade and finance, central banks are now actively reducing its share in their reserve baskets. Gold is no longer viewed as a supplementary reserve asset.
It has moved to the center of reserve strategy, holding more weight in global central bank portfolios than US government debt for the first time in nearly three decades.
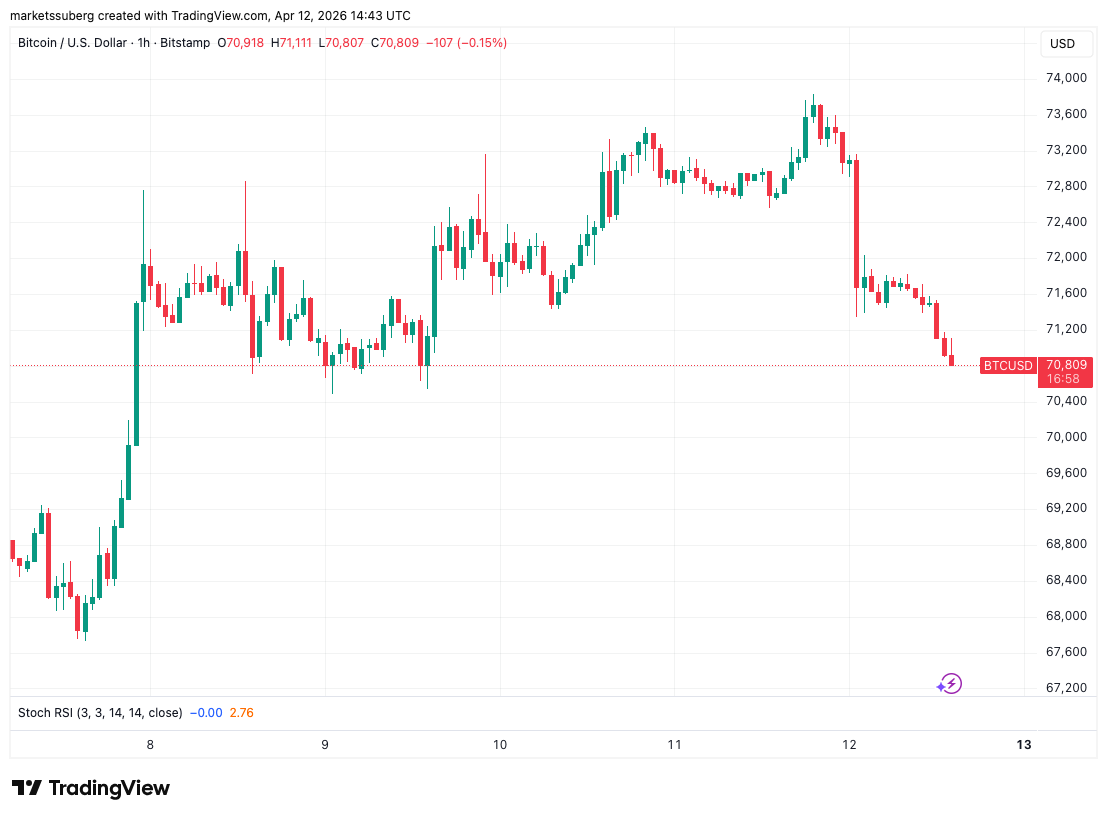
Bitcoin (BTC) fell 3% to trade below $71,000 into Sunday’s weekly close after negotiations to end the US-Iran war broke down.
Key points:
-
Bitcoin shed its gains as negotiations between the US and Iran broke down.
-
The Strait of Hormuz becomes a flashpoint again as US President Donald Trump demanded that it be reopened.
-
BTC price downside punishes late long positions.
BTC price drops on US-Iran war fears
Data from TradingView showed BTC price action dipping below $71,000 after news of a sudden breakdown in negotiations between the US and Iran in Islamabad, Pakistan.

A failure to reach an agreement on the issue of nuclear weapons resulted in both delegations leaving talks unfinished. Later, US President Donald Trump said that the US would blockade the Strait of Hormuz and “interdict” vessels paying Iran for safe passage.
“No one who pays an illegal toll will have safe passage on the high seas,” he wrote in a post on Truth Social.
A follow-up post repeated demands that Iran make Hormuz, a major oil transit route, fully operational.

Ahead of futures markets opening, reactions to the latest events spelled out the risks for the wider economy.
“If the path forward is continued war, escalation, and a prolonged closure of the Strait of Hormuz, then the Iran War has just entered a new era,” The Kobeissi Letter wrote in its latest analysis on X.
“US CPI inflation just jumped from 2.4% to 3.3% and further escalation of the Iran War would lead to 4.0%+ inflation, according to our models.”

Kobeissi referred to the US Consumer Price Index (CPI) inflation, a gauge particularly sensitive to oil prices. Earlier this week, the March CPI print came in slightly below expectations, despite the highest jump in its oil-price component in 60 years.
“There are currently no plans for additional talks, according to Iranian media,” Kobeissi added.
“So, will Trump choose to push harder for diplomacy or double down on military action? Today, we find out.”
Bitcoin liquidations mount as longs suffer
As the only 24-hour-traded asset class, Bitcoin and crypto were the only ones reacting to the chaos in real time.
Related: Bitcoin analysis sees $55K BTC price ‘iron bottom’ by December 2026
Data from CoinGlass showed BTC/USD slicing through long liquidations, with the liquidation total for the past 24 hours nearing $350 million.

“Volatility remains high and it’s clear that there won’t be a path forward where risk-on assets will do well if this continues to be the consensus,” trader Michaël Van de Poppe wrote in an X response.
Van de Poppe suggested that the economic weakness as a result of the returning war could force the Federal Reserve to inject liquidity despite rising inflation.
“On a larger scale, I think that we’re currently in a sufficiently weak economy and the FED has no other option than to start printing again to positively influence the economy,” he argued.
Earlier, Cointelegraph reported on rising odds of the US entering a recession in 2026.
Next week will bring more inflation cues from the March Producer Price Index (PPI) print, while multiple senior Fed officials will speak on the economy.
This article is produced in accordance with Cointelegraph’s Editorial Policy and is intended for informational purposes only. It does not constitute investment advice or recommendations. All investments and trades carry risk; readers are encouraged to conduct independent research before making any decisions. Cointelegraph makes no guarantees regarding the accuracy or completeness of the information presented, including forward-looking statements, and will not be liable for any loss or damage arising from reliance on this content.

Crypto Market Update: Massive ETF Inflows Push BTC to New Heights!

Plans for ‘moveable structure’ in Ramsbottom pub beer garden
Ethereum Faces Resistance Near $2,300 as Momentum Weakens Within Tight Trading Range


-

 Business7 days ago
Three Gulf funds agree to back Paramount’s $81 billion takeover of Warner, WSJ reports
-

 Politics2 days ago
US brings back mandatory military draft registration
-

 Fashion2 days ago
Weekend Open Thread: Veronica Beard
-

 Tech5 days ago
How Long Can You Drive With Expired Registration? What Florida Law Says
-

 Politics7 hours ago
World Cup exit makes Italy enter crisis mode
-
 Sports2 days ago
Man United discover Nico Schlotterbeck transfer fee as defender reaches Dortmund agreement
-

 Fashion6 days ago
Massimo Dutti Offers Inspiration for Your Summer Mood Board
-

 Crypto World3 days ago
Canary Capital Files SEC Registration for PEPE ETF
-

 Fashion5 days ago
Let’s Discuss: DEI in 2026
-

 Business2 days ago
Tesla Model Y Tops China Auto Sales in March 2026 With 39,827 Registrations, Beating Cheaper EVs and Gas Cars
-

 Crypto World4 days ago
Bitcoin recovers as US and Iran Agree a Ceasefire Deal
-

 Politics3 days ago
Malcolm In The Middle OG Turned Down ‘Buckets Of Money’ To Appear In Reboot
-

 Business2 days ago
OpenAI Halts Stargate UK Data Centre Project Over Energy Costs and Copyright Row
-

 Business1 day ago
Ireland Fuel Protests Enter Day 5 as Blockades Spark Shortages and Government Prepares Support Package
-

 Tech7 days ago
Italian court says Netflix must refund customers up to $576 over price hikes
-

 Tech7 days ago
Haier is betting big that your next TV purchase will be one of these
-

 Tech7 days ago
Gamer Restores the Original PlayStation Portal From Two Decades Ago
-

 Tech7 days ago
The Xiaomi 17 Ultra has some impressive add-ons that make snapping photos really fun
-

 Tech7 days ago
Samsung just gave up on its own Messages app
-

 Politics3 days ago
LBC Presenter Mocks Trump Over Iran War Failures
You must be logged in to post a comment Login