
Crypto World
Coinbase launches pre-IPO markets, SpaceX first asset

Coinbase has unveiled a new suite of pre-IPO markets, kicking off with SpaceX. The offering provides users outside the United States exposure to private-company valuations before they go public, via a USDC-settled perpetual futures contract that tracks SpaceX’s estimated pre-listing price. The product is designed to operate around the clock, with no expiry or rollover, and profits and losses settled in USDC, according to a Coinbase blog post published Thursday.
According to Coinbase, positions can be opened and closed at any time, mirroring existing perpetual futures on the platform. If SpaceX eventually completes an IPO, those pre-IPO positions will automatically transition into a post-IPO perpetual futures contract that references the public listing. The rollout is not yet available to U.S. persons at launch and begins with eligible users in jurisdictions where private-market exposure is not restricted, reflecting ongoing regulatory considerations on offering private securities exposure in the United States.
Coinbase described the product as a way to broaden access to private market exposure, a space traditionally reserved for venture capital firms and institutional investors. SpaceX was chosen as the initial listing due to robust global demand for exposure to Elon Musk’s space and satellite company, the blog notes, underscoring the market’s appetite for high-profile private firms ahead of a potential public listing.
Key takeaways
- Coinbase launches a USDC‑settled pre-IPO perpetual futures market for SpaceX, expanding access to private-market exposure outside the United States.
- The contract features 24/7 trading with no expiry and automatic conversion to a post-IPO contract upon an IPO, with settlements in USDC.
- US-based users remain restricted at launch, as Coinbase rolls out the product to eligible non-U.S. jurisdictions where private-market exposure is accessible.
- The move is part of a broader push among crypto exchanges to tokenize or synthesize private-market exposure, intensifying competition in this space.
Coinbase’s pre-IPO markets: SpaceX as the inaugural listing
In its blog, Coinbase frames the SpaceX pre-IPO product as a first step in democratizing access to private markets—arena traditionally dominated by seasoned investors and institutions. The perpetual contract tilts toward a straightforward, trader-friendly model: trustless, 24/7 access to a synthetic representation of SpaceX’s pre-listing value, settled in stablecoins. The company emphasized that users can open and close positions at will, offering liquidity for a market that historically has lacked retail visibility.
Importantly, Coinbase confirms that a future IPO would trigger an automatic transition of these pre-IPO positions into post-IPO instruments, aligning with a seamless lifecycle from private to public market exposure. The announcement underscores the ongoing tension between investor demand for private-market visibility and the strict regulatory frameworks governing private securities in the United States. Coinbase did not respond to a request for comment by publication, according to the report.
A race to normalize pre-IPO exposure across major exchanges
The Coinbase move is not happening in a vacuum. It sits within a burgeoning trend as large crypto platforms seek to position themselves at the intersection of tokenized or synthetic private markets. Kraken’s parent company, Payward, announced a parallel initiative this week that would offer tokenized access to pre-IPO companies, aiming to broaden retail participation in upcoming listings.
Meanwhile, other exchanges have already rolled out analogous offerings. Binance has launched derivative products tied to high-profile private firms, including SpaceX, as part of a broader push into pre-IPO exposure. Bitget has also pushed forward with IPO Prime, a platform dedicated to pre-IPO investments, starting with a SpaceX-linked offering in its suite of services. These moves reflect a wider market appetite for fractionalized exposure to coveted private assets, even as traditional markets grapple with regulatory and valuation uncertainties.
The industry’s momentum toward private-market tokenization aligns with broader research about real-world assets (RWA) entering crypto platforms. A Bernstein study released in May estimated the RWA market at about $51 billion, up approximately 42% year-to-date, as investors chase fractional ownership of illiquid private assets. Other industry analyses note that tokenized stocks still form a modest share of RWAs, with activity concentrated in a few major tech names traded on offshore platforms.
Private-market momentum, valuations, and the road ahead
SpaceX remains a focal point of attention in private markets, with private valuations numbering in the trillions depending on the methodology and secondary pricing. Reuters has reported estimates placing SpaceX’s private-market value as high as roughly $1.75 trillion, illustrating the scale of demand for pre-IPO exposure to the company.
The market’s trajectory raises important questions for investors and builders alike. If pre-IPO products become more widespread, they could offer new avenues for portfolio diversification and risk management, but they also heighten concerns about liquidity, price discovery, and the reliability of private-valuation signals during times of market stress. Regulators have repeatedly warned that offering private-market securities exposure to retail investors involves intricate compliance hurdles, and firms launching these products may face evolving guidelines as more platforms participate in pre-IPO trading ecosystems.
Beyond SpaceX, the broader pre-IPO ecosystem continues to evolve as exchanges partner with banks, liquidity providers, and regulatory authorities to establish guardrails around timing, disclosures, and settlement practices. In this climate, investors should monitor how pre-IPO instruments price in relation to actual IPO timelines, how transitions to post-IPO listings are managed, and whether inflows or outflows align with the expected cadence of private-market activity.
Implications for investors, traders, and builders
For investors and traders, the emergence of pre-IPO perpetual futures presents a structured way to gain directional exposure to coveted private firms before public confirmation. It also introduces new considerations around risk tolerance, leverage, and liquidity—particularly in markets where the underlying private valuation is less transparent than a publicly traded equity. The US regulatory environment remains a critical variable; as long as access outside the United States is allowed, participants must weigh the trade-offs between convenience and the evolving oversight around private-market instruments.
From a builder’s perspective, the expanding appetite for real-world asset tokenization and pre-IPO access creates opportunities to design more robust risk controls, more transparent valuation methodologies, and more durable settlement mechanisms. The competition among exchanges to attract retail users with these products could spur faster innovation but also demands rigorous compliance and disclosure standards to protect less sophisticated participants.
What markets will watch next is how broadly the pre-IPO model is adopted across other high-profile private companies, how regulatory guidance evolves globally, and how price discovery for pre-IPO assets compares with post-IPO performance once a listing occurs. If the SpaceX product proves successful outside the US, it could catalyze a wider rollout with other blue-chip private firms, powering a more liquid, cross-border pre-IPO ecosystem—or, alternatively, highlighting the fragility of valuations detached from eventual public-market realities.
As readers track these developments, the central questions remain: Will pre-IPO synthetic exposure become mainstream among retail traders, or will it remain a niche tool for strategic players? How will valuation signals hold up as listings approach, and what safeguards will regulators demand to ensure fair access and transparent pricing? The coming quarters are likely to reveal how quickly the market can balance appetite for private-market exposure with the need for robust risk management and regulatory clarity.


Russia’s FSB says Telegram founder Pavel Durov faces a terrorism-related charge and an international arrest warrant, while a separate French case remains open.


US spot Bitcoin ETFs recorded four straight sessions of outflows totaling $526 million as Bitcoin faced renewed selling pressure after failing to hold $65,000.
Crypto World
The Most Unpredictable FOMC Meeting in Years Is Here: What Bitcoin Investors Should Know

The United States Federal Reserve will announce its interest-rate decision later today, but, unlike essentially every meeting in the past six years, markets remain divided over what comes next.
Bitcoin investors seemingly de-risked yesterday in what appeared to be a blatant sell-off ahead of the key event. The question now is what follows.
Why So Much Unpredictability Now
The Federal Open Market Committee began its two-day meeting on July 28 and will publish its decision at 2:00 p.m. ET today. Chairman Kevin Warsh’s press conference will follow approximately 30 minutes later, in which investors will seek clues for what the central bank’s policy will be for the remainder of 2026.
The current benchmark rate stands between 3.50% and 3.75%. Although most experts still believe it will be left unchanged, futures markets recently assigned a probability of up to 38% to a surprise 25-basis-point hike. According to the analyst at the Kobeissi Letter, these expectations are among the most divided in recent history.
They explained that nearly every Fed meeting since the COVID-19 pandemic in March 2020 entered decision day with roughly 99% agreement about the outcome. The situation now is different for the first time in over six years, given the aforementioned odds on futures markets and prediction platforms.
The uncertainty partly stems from Warsh’s decision to reduce the central bank’s reliance on forward guidance. Minutes from the June meeting showed that policymakers discussed shortening the Fed’s statement and removing language indicating the likely direction of the next move. Warsh’s approach is expected to preserve flexibility, but it has also left traders without the clear policy signals they became accustomed to under Jerome Powell.
Change or No Change
The Kobeissi Letter analysts said they believe the Fed will leave rates unchanged. A recent Reuters survey of over 100 forecasters reached the same conclusion, with more than three-quarters predicting no policy shift until the end of the year. ING economists shared the same opinion.
One of the reasons for this is the softer-than-expected inflation data for June. The labor market has also shown signs of weakening, giving the Fed another reason not to tighten financial conditions further.
There’s also the opposite side of the coin, though, as some experts believe the central bank might lose credibility if it waits too long. Inflation remains well above the 2% target, while renewed geopolitical tension, tariffs, and energy-market instability could push prices higher again.
Several Fed officials have reportedly become more open to the idea of raising rates if inflation fails to improve. Warsh has also avoided giving markets a clear roadmap, meaning that a hike cannot be easily dismissed simply because officials did not prepare investors for one in advance.
Crypto Impact
Crypto analytics platform Santiment Intelligence outlined a notable rise in social-media discussions about the interest-rate hikes ahead of today’s meeting. The data showed a similar spike in such fears before the previous meeting on June 16. However, as it typically happens, the social chatter was wrong as the Fed left rates unchanged.
“Crowd conviction can get loud right before it gets wrong, especially when traders are trying to price Fed uncertainty into Bitcoin,” said Santiment.
Let’s talk prices. BTC dipped by $3,000 yesterday in a de-risking development ahead of the meeting. It has recovered half of the losses, currently sitting above $64,000.
If the Fed doesn’t change rates and Warsh doesn’t signal strongly for a September hike, BTC could rebound further as the uncertainty might have already been priced in. If there’s no rate change but the Chairman sounds hawkish, bitcoin might jump initially as there would be no hike now, but it’s likely to retreat toward $60,000 in the next few weeks.
A surprise 25-basis-point increase, though, will be the most bearish immediate outcome for the cryptocurrency. The decision will likely strengthen the dollar, push Treasury yields higher, and cause investors to further reduce exposure to speculative assets.
The post The Most Unpredictable FOMC Meeting in Years Is Here: What Bitcoin Investors Should Know appeared first on CryptoPotato.


Jump Capital has closed a $350 million venture fund with a stronger focus on crypto investments.
Summary
- Jump Capital has closed a $350 million venture fund with a stronger focus on early stage crypto investments.
- The firm said the new fund will back blockchain infrastructure, DeFi, Web3, fintech, and enterprise software startups.
- Jump Capital has expanded its crypto portfolio through investments in Securitize, Shelby, and KGeN over the past year.
- The venture firm has completed more than 100 investments and nearly 30 exits since its launch.
According to a July 29 announcement, Jump Capital has closed its seventh venture fund with $350 million in total capital commitments, describing it as the firm’s largest fund to date and outlining plans to increase investments across the crypto ecosystem while continuing to back early-stage technology startups.
The firm’s official announcement said the new vehicle will continue investing in fintech, IT and data infrastructure, future of commerce and media, and B2B SaaS, while allocating more resources to blockchain and digital asset companies.
The fund follows nearly a decade of venture investing that has resulted in more than 100 portfolio companies and close to 30 exits.
Jump Capital has expanded its crypto allocation
Founded in 2012 alongside Jump Trading, Jump Capital said it originally focused on software and technology companies outside traditional coastal venture markets while supplying Series A and Series B funding to underserved founders across the United States.
The firm said market conditions have changed considerably since then. Access to Series A and Series B capital has become more limited, while investor attention toward startups in the Midwest increased during the pandemic.
At the same time, blockchain emerged as what Jump Capital described as a technology capable of changing financial markets and introducing new models of ownership and value transfer.
According to the announcement, the venture firm began investing in crypto roughly seven years ago before building a dedicated investment team led by partners Saurabh Sharma and Peter Johnson. It said experience across distributed systems, computing infrastructure, fintech, and capital markets encouraged it to commit more resources to the sector through its latest fund.
The announcement added that Jump Capital and its affiliate Jump Trading now invest globally across the crypto market, citing increasing institutional participation, continued retail adoption, and rapid product development as factors supporting that strategy.
Crypto investments already span infrastructure and tokenization
According to Jump Capital, its crypto portfolio already includes investments across exchanges that support fiat on-ramps, lending and credit platforms, compliance software, asset management platforms, decentralized finance, gaming, Web3 infrastructure, and blockchain networks.
In May 2025, Jump Crypto, the digital asset division of Jump Trading, acquired a significant equity stake in Securitize for an undisclosed amount. At the time, Securitize said the partnership would expand institutional access to tokenized real-world assets, including U.S. Treasurys, private credit, and private equity, while improving collateral management solutions. Securitize Chief Operating Officer Michael Sonneshein said the investment demonstrated growing institutional conviction in tokenization and its role in capital markets.
The company made another infrastructure-focused move in June 2025, when Aptos Labs and Jump Crypto introduced Shelby, a decentralized hot storage network designed to provide cloud-grade infrastructure for Web3 applications. Aptos Labs said Shelby would deliver decentralized, monetizable storage with sub-second data access across multiple blockchains, while Jump Crypto said the protocol addresses blockchains’ inability to efficiently serve large datasets at scale.
Earlier collaborators announced for Shelby included Metaplex, Pipe Network, Story, Myco, DoubleZero, and Flashback Labs, with Aptos serving as the network’s initial settlement layer.
Portfolio activity has continued across emerging Web3 projects
Jump Crypto has also continued backing consumer-facing blockchain applications.
In September 2025, Web3 distribution protocol KGeN announced a $13.5 million strategic funding round backed by Jump Crypto, Accel, and Prosus Ventures, increasing the company’s total funding to $43.5 million.
KGeN said the proceeds would support expansion of its POGE identity and reputation framework, which helps Web3 applications manage user acquisition, commerce, and loyalty programs on-chain. At the time, the company reported operations across more than 60 countries, serving 38.9 million verified users, generating $48.3 million in annualized revenue, and recording roughly 780,000 daily active users.
Following that investment, Jump Crypto Chief Investment Officer Saurabh Sharma said KGeN’s distribution model introduced more accountability into digital user acquisition, while Accel and Prosus Ventures credited the platform’s ability to scale measurable engagement.
New fund builds on nearly a decade of venture investing
Alongside its crypto activity, Jump Capital said its venture business has completed more than 100 investments and nearly 30 exits since launch.
The firm pointed to exits involving Personal Capital, acquired by Empower, Flashpoint, acquired by Audax, and Tubi, acquired by Fox, while also highlighting companies including SPIRE, Fast Radius, M1 Finance, Degreed, TradingView, LogicGate, and LinkSquares among its portfolio.
According to Jump Capital, its investment process continues to rely on sector-specific research and discussions with industry participants before identifying founders whose businesses align with the firm’s investment themes.
With Fund VII now closed, the venture firm said it plans to continue supporting early-stage technology companies while dedicating additional capital and personnel to blockchain infrastructure, decentralized finance, crypto networks, gaming, and other parts of the digital asset ecosystem.

The US dollar continues to hold the upper hand against most major currencies ahead of the outcome of the latest Federal Reserve meeting. While the base-case scenario remains for interest rates to stay unchanged, markets are also pricing in the possibility of a rate hike. The Fed’s decision, together with its comments on inflation, economic conditions and the future path of monetary policy, could determine the direction of the US dollar over the coming weeks.
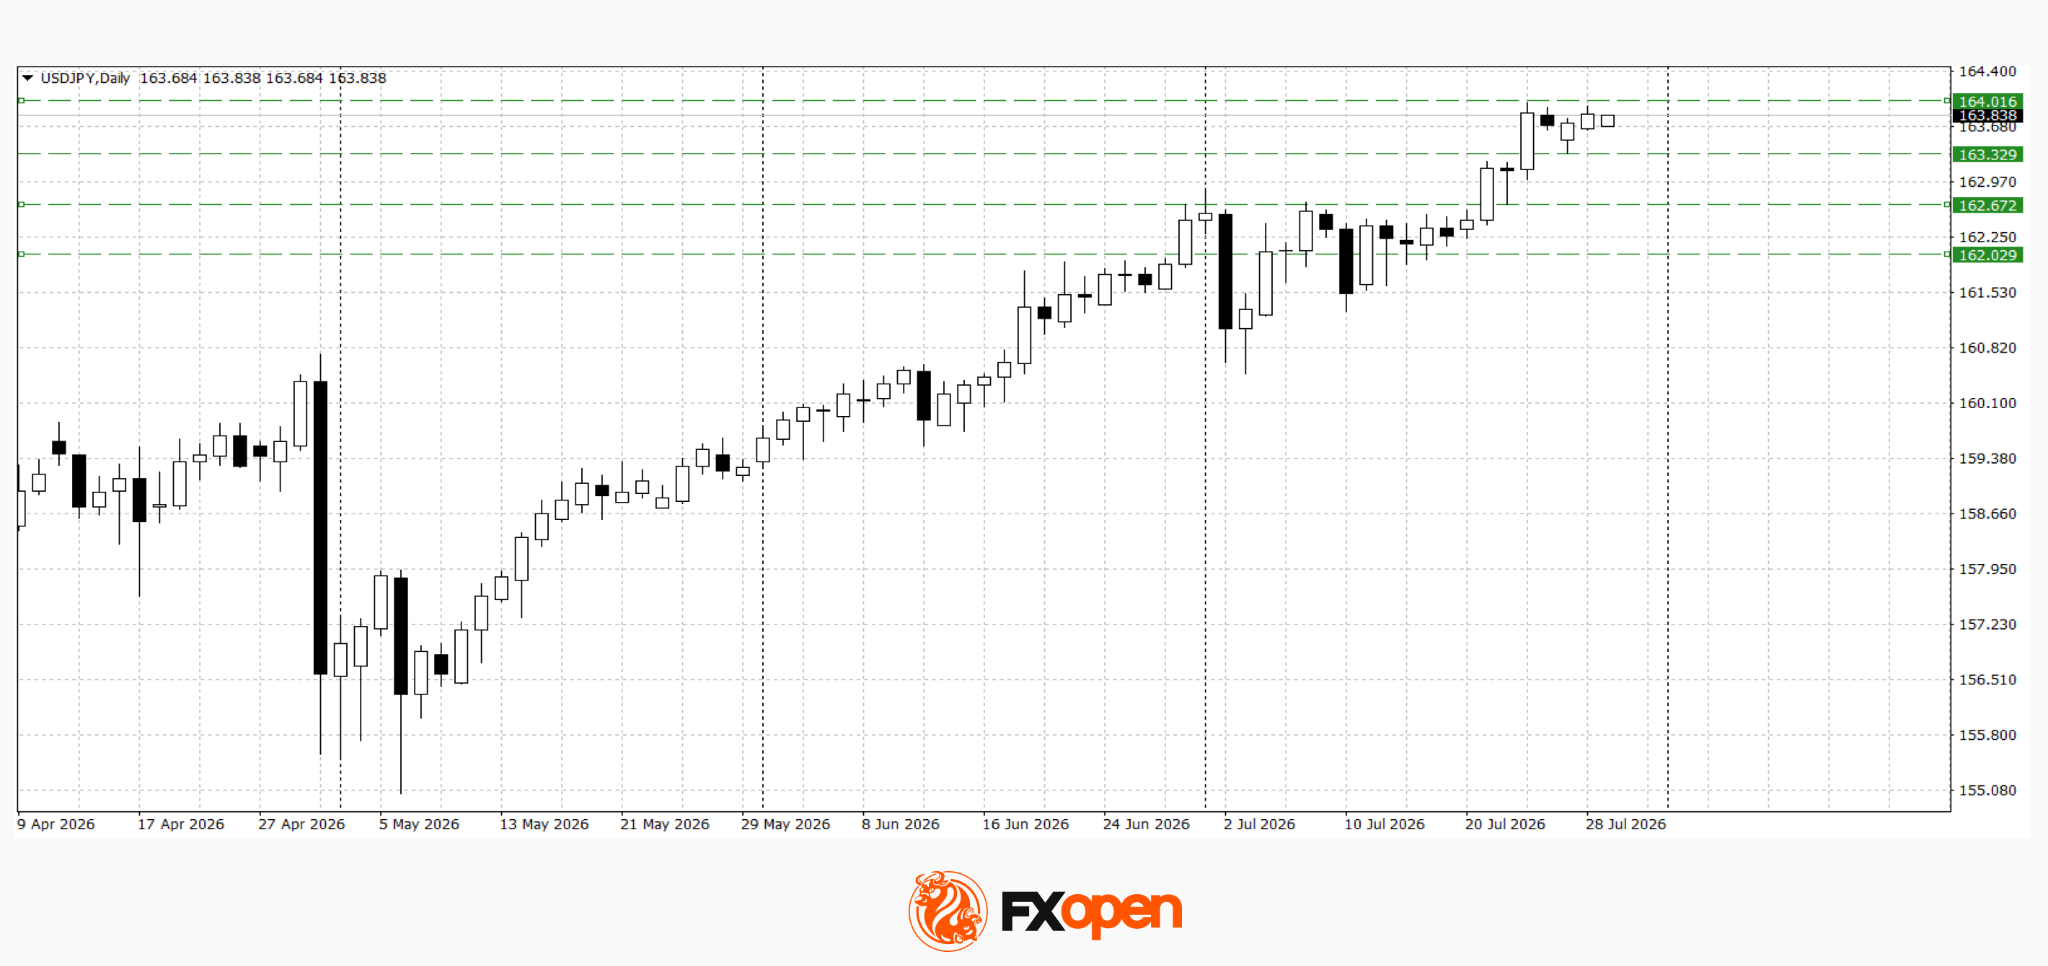
Another factor supporting the dollar is the ongoing geopolitical uncertainty in the Middle East. Despite the temporary suspension of US strikes on Iran and renewed diplomatic efforts, the risk of further military escalation remains, prompting investors to remain cautious ahead of this week’s key events. Geopolitical uncertainty continues to underpin demand for the US dollar as a safe-haven asset. At the same time, USD/JPY’s approach towards multi-year highs has increased expectations of fresh warnings from Japanese authorities and raised the risk of currency intervention. For USD/CAD, oil prices remain another important driver: weaker crude prices continue to limit support for the Canadian dollar and help preserve the pair’s bullish potential.
USD/JPY
USD/JPY tested another multi-year high near 164.00 last week. Following the strong rally, the pair has entered a modest pullback. However, if the Federal Reserve delivers a more hawkish outcome or maintains its hawkish tone, the pair could extend its advance towards 165.00–165.50. A decisive move below 163.30 could trigger a deeper correction towards the 162.00–162.60 support area.
Key events for USD/JPY:
- Today at 21:00 (GMT+3): US Federal Reserve interest rate decision;
- Today at 21:30 (GMT+3): Federal Open Market Committee (FOMC) press conference;
- Tomorrow at 15:30 (GMT+3): US Core Personal Consumption Expenditures (PCE) Price Index.
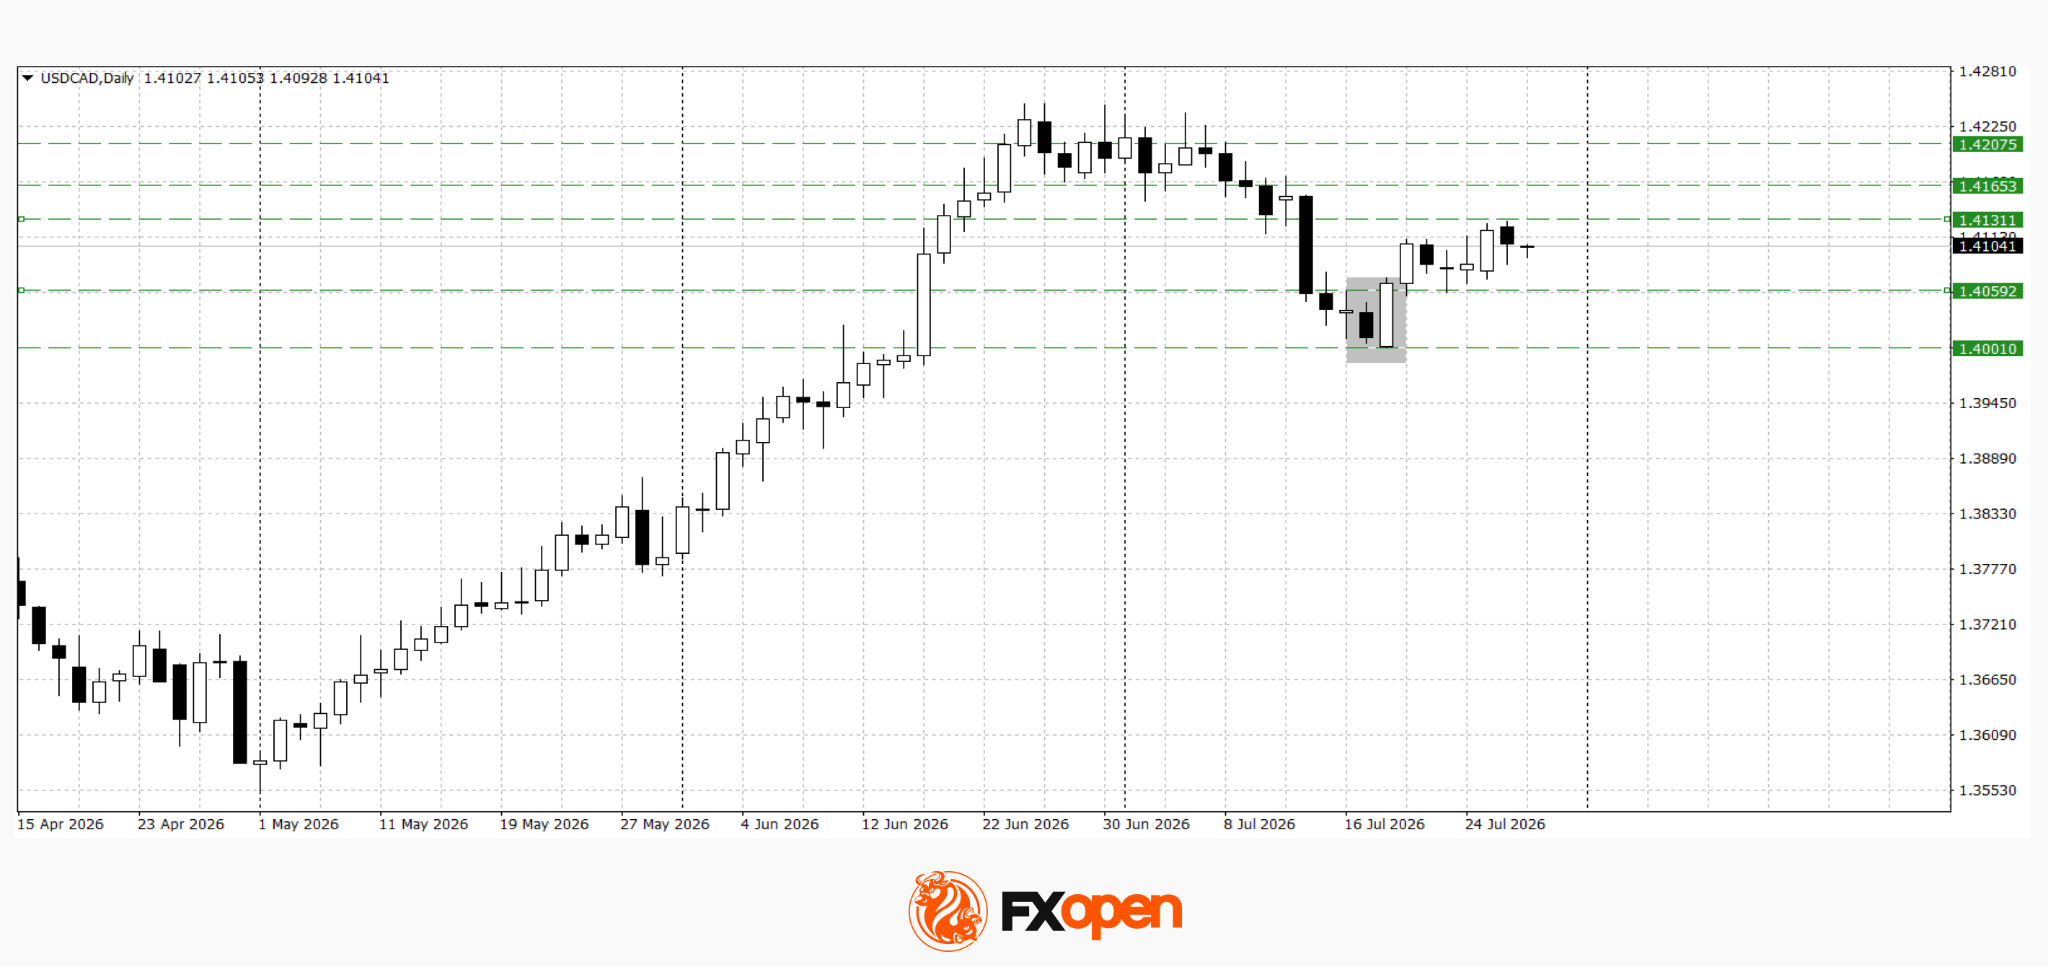
USD/CAD
USD/CAD’s recovery following the formation of a bullish engulfing pattern has stalled near resistance at 1.4130. The pair is currently consolidating within the 1.4060–1.4130 range. A decisive break above the upper boundary of this range could pave the way for further gains towards 1.4160–1.4200. Conversely, a move below 1.4060 could lead to a retest of the recent low near 1.4000.
Key events for USD/CAD:
- Today at 17:30 (GMT+3): US crude oil inventories;
- Today at 20:30 (GMT+3): Bank of Canada Summary of Deliberations;
- Tomorrow at 15:30 (GMT+3): US GDP data.
Overall, the near-term direction of both USD/JPY and USD/CAD will depend primarily on the Federal Reserve’s decision and its guidance on the future path of interest rates. A more hawkish stance could support a breakout above nearby resistance levels and reinforce the US dollar’s strength. Conversely, a more dovish message could trigger a correction in the greenback, particularly against the Japanese yen, where the proximity of multi-year highs increases the likelihood of renewed warnings from Japanese officials. For USD/CAD, oil price movements and the Bank of Canada’s Summary of Deliberations will remain important additional drivers.
Trade over 50 forex markets 24 hours a day with FXOpen. Take advantage of low commissions, deep liquidity, and spreads from 0.0 pips (additional fees may apply). Open your FXOpen account now or learn more about trading forex with FXOpen.
This article represents the opinion of the Companies operating under the FXOpen brand only. It is not to be construed as an offer, solicitation, or recommendation with respect to products and services provided by the Companies operating under the FXOpen brand, nor is it to be considered financial advice.

XRP trades near $1.06 in late July 2026, roughly 71 percent below the $3.65 cycle top set on July 17, 2025. This piece walks through the escrow-versus-ETF equation, the bull case ($4.50–$7.00 by 2030), the base case ($1.80–$3.20), and the bear case ($0.60–$1.40).


Cointelegraph is committed to providing independent, high-quality journalism across the crypto, blockchain, AI, and fintech industries.
All news, reviews, and analyses are produced with full journalistic independence and integrity. For more details on our standards and processes, please read our Editorial Policy.
Crypto World
HTX’s First TradFi “Trade to Earn” Campaign Unleashes New Trading Momentum: Rewards Exceed $23,000, Fee Savings Reach 1.8 Billion $HTX


Recently, HTX’s first-ever TradFi “Trade to Earn” campaign concluded successfully. The campaign leveraged innovative gameplay – “24/7 mining” and “up to 110% fee rebates” – to ignite significant trading enthusiasm for traditional finance assets within the crypto market.
HTX’s official data reveals impressive results: the campaign generated a total trading volume of 63.37 million USDT, crowned a top winner claiming 5,206 USDT in rewards, and collectively saved users 22,238 USDT in trading fees. These achievements underscore the event’s effectiveness in enhancing the user trading experience and reducing trading costs.
Amid current market volatility, HTX’s TradFi perpetual futures contracts offer users an excellent hedging and cross-market investment tool. Through the “mining via trading” model, users can capture macro opportunities such as surging U.S. equities and gold volatility using familiar USDT capital without trading fee friction.
Enjoy Negative Trading Fee Rates 24/7
Official data reveals that the inaugural “Trade to Earn” campaign generated a robust trading volume of 63.37 million USDT. Over the campaign period, the platform distributed 23,477 USDT in rewards while saving traders 22,238 USDT in fees (an equivalent of roughly 1.8 billion $HTX). These impressive metrics highlight HTX’s trading innovations with negative fee rates and 24/7 continuous rewards.
During the campaign, users trading designated TradFi perpetual futures contracts earned $HTX rewards of up to 110% of their actual trading fees incurred. This means the platform not only covers all trading costs but also provides additional rewards, transforming trading costs from an expense into profit and truly achieving “the more you trade, the more you earn.” Additionally, the platform offered a daily prize pool of 6,000 USDT, distributed hourly to ensure round-the-clock incentives.
Notably, the campaign-designated trading assets span a diverse range of core TradFi instruments: from safe-haven and inflation-hedging tools like gold (XAU) and crude oil (USOIL), to major indices like the Nasdaq (QQQ) and tech giants including NVIDIA (NVDA) and Microsoft (MSFT). This diverse selection of assets offers users versatile macro allocation, hedging, and cross-market trading opportunities, further expanding practical use cases at the intersection of Web3 and traditional finance.
Fees for $HTX Buyback and Burn, Constructing a Positive Cycle of Trading and Ecosystem Value
Beyond trading rewards, another standout feature of this campaign is its deep integration of user trading activity with $HTX ecosystem value.
During the campaign, all trading fees generated from designated TradFi contracts were allocated to buy back $HTX tokens, with buybacks executed and burned according to the platform’s quarterly burning schedule. This mechanism links platform trading growth with $HTX value creation, continuously incentivizing user participation while reinforcing the token’s deflationary characteristics. This fosters a positive cycle: “trading growth – token buyback and burn – value accumulation.”
With the first campaign successfully concluded, HTX’s second-phase TradFi “Trade to Earn” is now in preparation. The campaign will continue to adopt negative-fee trading and 24/7 rewards, while further expanding access to popular TradFi asset trading scenarios. This will enable users to capture global market opportunities while continuously enjoying the innovative experience of “trading as earnings.”
Looking forward, HTX will leverage more diverse products, increasingly competitive incentives, and an enhanced ecosystem to drive deeper integration between crypto and TradFi, delivering a more professional and efficient digital asset trading platform for global users.
About HTX
Founded in 2013, HTX has evolved from a virtual asset exchange into a comprehensive ecosystem of blockchain businesses that span digital asset trading, financial derivatives, research, investments, incubation, and other businesses.
As a world-leading gateway to Web3, HTX harbors global capabilities that enable it to provide users with safe and reliable services. Adhering to the growth strategy of “Global Expansion, Thriving Ecosystem, Wealth Effect, Security & Compliance,” HTX is dedicated to providing quality services and values to virtual asset enthusiasts worldwide.
To learn more about HTX, please visit https://www.htx.com/ or HTX Square , and follow HTX on X, Telegram, and Discord.
The post HTX’s First TradFi “Trade to Earn” Campaign Unleashes New Trading Momentum: Rewards Exceed $23,000, Fee Savings Reach 1.8 Billion $HTX appeared first on BeInCrypto.


Russia has escalated its long-running dispute with Telegram by charging founder Pavel Durov with facilitating terrorist activities and issuing an international arrest warrant, marking one of the most significant legal actions yet against the messaging platform’s billionaire founder.
The move comes as governments worldwide intensify pressure on technology platforms over content moderation, encryption, and their responsibilities in preventing criminal activity. The latest accusations also add to Durov’s ongoing legal challenges outside Russia, including an active investigation in France.
The post Russia Targets Telegram Founder Pavel Durov With Terrorism Charges appeared first on BeInCrypto.


Bitcoin climbed 1% to about $63,800 on Wednesday while Asian equity markets suffered one of their worst stretches of the year, the second time in a seven-day period that crypto has held through a sharp unwind in the artificial intelligence trade.
The majors moved with it. Ether rose 1% to $1,899, XRP added 2% to $1.07, BNB gained to $567, solana held at $73, and dogecoin edged up. Hyperliquid’s HYPE was the only major in the red, down 3% to $54.
The damage in equities was concentrated in chipmakers. South Korea’s benchmark tumbled 11%, following an 11% drop on Tuesday and putting the index on course for a record two-day decline. SK Hynix fell about 17% after reporting a 557% surge in quarterly profit that still came in below expectations, and
Samsung slid 12% ahead of its own results on Thursday. The MSCI Asia Pacific index dropped 2% to its lowest since mid-April, and Nasdaq 100 futures fell 1%, extending a five-day losing streak for the tech-heavy gauge, its longest this year.
He attacked family and passers by at retail park a year after killing nan

all 106 sites to shut 10 September

Telegram founder Pavel Durov internationally wanted, Russia’s FSB says


-

 Fashion5 days ago
Weekend Open Thread: Brooks Brothers
-
 Sports2 days ago
Commonwealth Games boxing: Jadumani Singh seals dominant 5-0 win over Pakistan’s Sumama Rehman to enter quarter-finals | Commonwealth Games News
-

 Tech2 days ago
Intel is reversing course and bringing hyper-threading back to its server chips
-

 Crypto World6 days ago
Ethics, other provisions in crypto Clarity Act to be further discussed
-

 Politics2 days ago
Luke Littler dismantles Gerwyn Price to retain title in Blackpool
-

 Sports5 days ago
2026 3M Open leaderboard: Scottie Scheffler finds putter in Round 1, sits three back
-

 Fashion5 days ago
16 Dresses for the High Summer Event
-

 Politics23 hours ago
The Part of the Electric Transition Nobody Wants to Discuss
-
 Entertainment5 days ago
A New Post-Apocalyptic Gundam Anime Series Blasts Into SDCC
-

 News Videos2 days ago
BITCOIN JUST ENTERED THIS CRITICAL ZONE…
-

 News Videos6 days ago
The Peugeot Family: How 200 Years of an “Old Money” Dynasty Died in A Boardroom
-

 Crypto World4 days ago
Ripple bought a bank in pieces. The $4 billion audit
-

 Politics3 days ago
Spain sweeps the board at 2026 World Cup with individual awards
-

 Business3 hours ago
Major shareholder moves on Canyon
-

 Crypto World3 days ago
XRP Ledger adds $2.6B as RWA inflows rank second
-

 Crypto World6 days ago
Uniswap (UNI) pushes deeper into tokenized RWAs with permissioned trading pools
-

 Tech4 days ago
Anthropic launches Claude Opus 5, a cheaper AI model for coding, agents and enterprise workflows
-
 Entertainment13 hours ago
‘Stargate’ Creator’s New Sci-Fi Series Returns for Season 3 Tomorrow
-
Crypto World6 days ago
SEC Agrees to Overhaul Recordkeeping After Settling Coinbase Lawsuit Over Gensler’s Lost Texts
-

 Business5 days ago
Alliance Entertainment Holding Corporation (AENT) Discusses Evolution Into Omnichannel Distribution and Fulfillment Platform for Media and Collectibles Transcript
You must be logged in to post a comment Login