
Crypto World
CoinDesk 20 performance update: Ethereum (ETH) price rises 5.4%

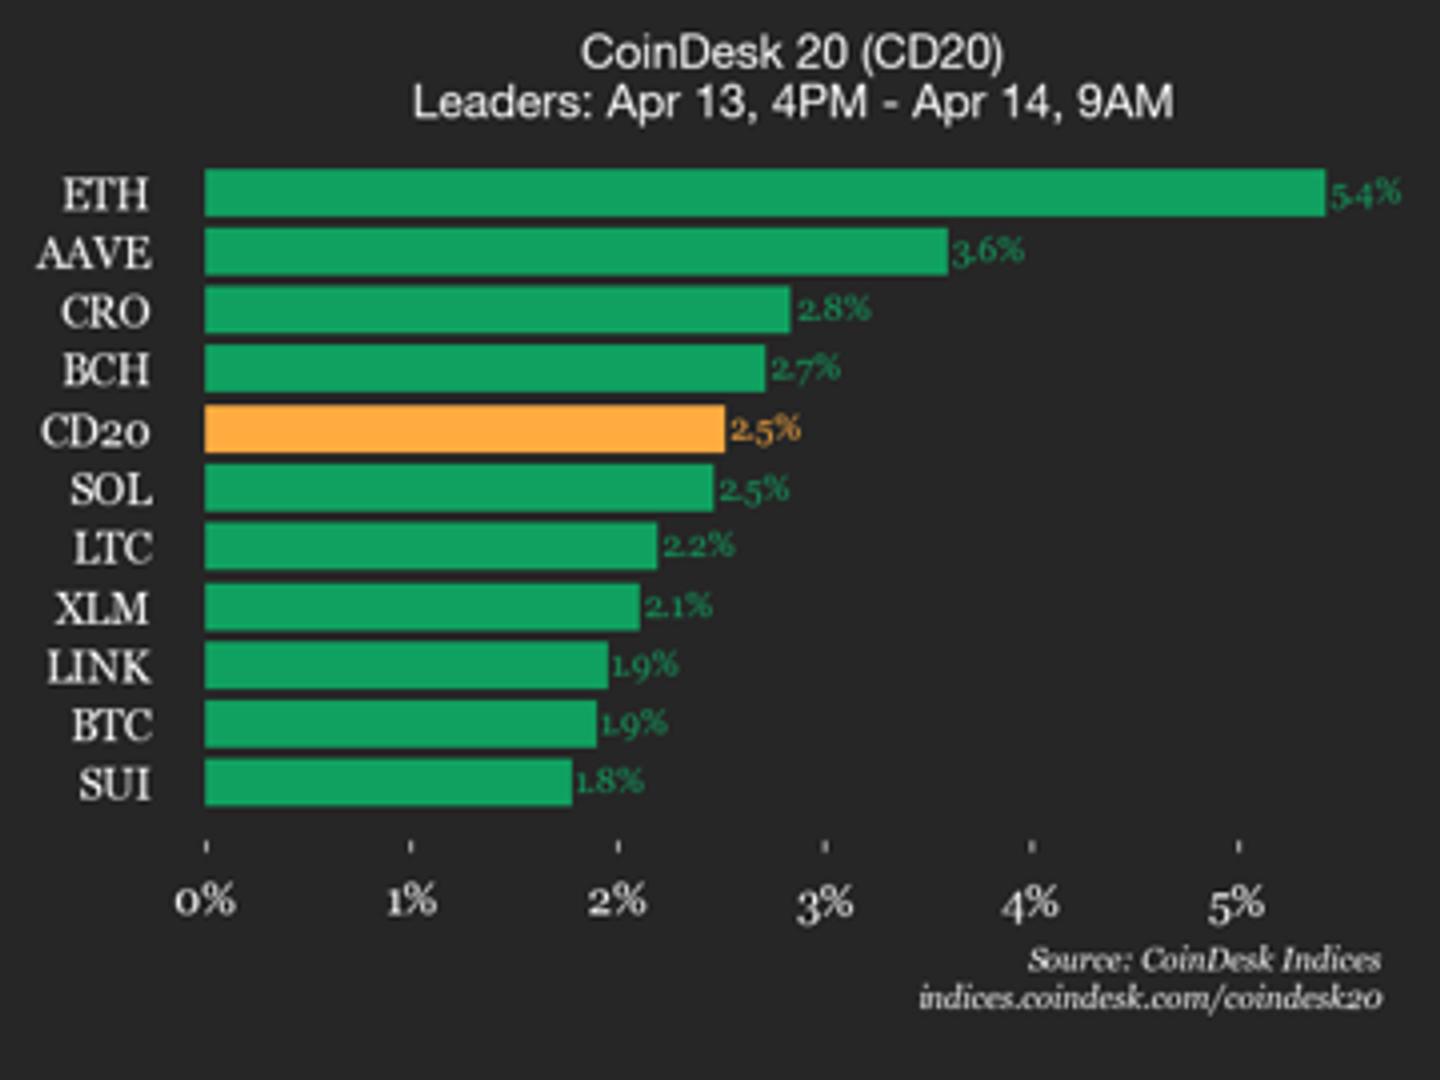
Aave (AAVE), up 3.6% from Monday, joined Ethereum as a top performer.


Paradigm Bitcoin general partner Dan Robinson published a proposal on May 1 for Provable Address-Control Timestamps, or PACTs, a system that lets dormant Bitcoin holders privately timestamp proof of key ownership before quantum computers arrive, creating a potential rescue path for Satoshi Nakamoto’s estimated 1.1 million BTC.
Summary
- PACTs use three steps: a secret salt, a BIP-322 ownership proof, and an OpenTimestamps commitment anchored on-chain, all without any public on-chain transaction.
- If Bitcoin later implements a quantum sunset soft fork, PACT holders can submit a STARK zero-knowledge proof to reclaim coins while keeping their keys hidden.
- Robinson wrote that Satoshi revealing keys in any forced migration would mean having to “tell the world that they are alive and still in possession of their keys.”
Robinson published PACTs on May 1, framing the design as a hedge against what he calls the Satoshi Problem inside Bitcoin’s quantum threat discussion. The official Paradigm post outlined the dilemma: if quantum computers arrive before Bitcoin adapts, old addresses with exposed public keys face theft.
If Bitcoin rushes a sunset soft fork to freeze those addresses, dormant holders face a forced, public coin migration. PACTs offer a third path, letting holders timestamp proof of ownership silently in 2026 without doing anything further until a rescue mechanism is standardised.
As crypto.news reported, approximately 1.7 million BTC remain in quantum-exposed address types, including Satoshi-linked wallets worth roughly $75 billion.
The proposal builds on BIP-361, authored by Casa CSO Jameson Lopp, which defines a phased migration away from legacy signatures after which unmigrated coins would be frozen.
Bitcoin.com noted that Robinson acknowledged multisig, complex scripts, and hardware wallet support would all require further standardisation, and that Bitcoin may never implement a quantum sunset.
As crypto.news documented, Bitcoin’s quantum debate has been intensifying in 2026 after Blockstream CEO Adam Back argued at Paris Blockchain Week for optional, opt-in quantum-resistant upgrades rather than forced wallet freezes, directly challenging the BIP-361 approach PACTs are designed to complement.
As crypto.news tracked, Naoris Protocol CEO David Carvalho warned that dormant wallets including Satoshi’s would be “ripe for the picking” once quantum computers reach sufficient capability, and that a quantum hack on Bitcoin “would lead to a real loss of trust” in the asset.


ZeroStack CEO Daniel Reis-Faria says the CLARITY Act stablecoin deal reduces investor uncertainty but has not resolved institutional hesitation yet.
Summary
- Senators Tillis and Alsobrooks reached a CLARITY Act yield compromise on May 1, banning passive stablecoin yield and preserving activity-based rewards.
- Polymarket odds of the CLARITY Act passing in 2026 jumped from 46% to 64% hours after the stablecoin deal landed.
- Reis-Faria says larger investors will still hold back until implementation rules are fully in place, not just agreed in principle.
The stablecoin deal was finalised on May 1 by Senators Thom Tillis and Angela Alsobrooks, drawing a clear line: crypto platforms cannot pay interest on stablecoins in any way that functions like a bank deposit. Activity-based rewards tied to payments and platform use are still permitted.
As crypto.news reported, the Senate Banking Committee is now targeting a markup during the week of May 11, with a Senate floor vote targeted before the May 21 Memorial Day recess.
“With lawmakers getting closer to a deal on stablecoin rules, that takes away one of the bigger reasons investors have been holding back,” said Daniel Reis-Faria, CEO of ZeroStack.
The institutional hesitation that remains
But Reis-Faria stopped short of calling this a turning point. “Right now, it’s not the rules themselves. It’s not knowing how they’re going to play out over time. That’s what’s keeping larger players from stepping in,” he said.
As crypto.news documented, JPMorgan had previously described CLARITY Act passage by midyear as a “key positive catalyst” for digital asset markets. The SEC, CFTC, and Treasury are directed to jointly issue implementation rules within one year. That one-year window is precisely the ambiguity Reis-Faria is pointing to.
Blockchain Association CEO Summer Mersinger said the yield resolution “brings us meaningfully closer to comprehensive market structure legislation becoming law” and urged the committee to move without delay.
As crypto.news tracked, five steps remain: Senate Banking markup, committee vote, a 60-vote floor threshold, reconciliation with the Agriculture version, and reconciliation with the House text.
“This advancement helps, but it’s not a full shift yet,” Reis-Faria said. “Until there’s more clarity, you’re still likely to see a more cautious approach from bigger players.”
As crypto.news noted, Standard Chartered estimated that uncapped stablecoin yield could redirect up to $500 billion in deposits from traditional banks by 2028, explaining the banking lobby’s sustained resistance throughout negotiations.

Elon Musk’s net worth crossed $800 billion this weekend, and the Tesla and SpaceX chief is not slowing down. Pressed on the figure, Musk fired back with a $10 trillion target.
Musk’s wealth now equals 2.7% of the US gross domestic product. That share is unmatched since John D. Rockefeller’s Standard Oil era in 1913.
Using World Bank 2024 data, the average GDP across 176 countries was about $612.36 billion. So, Musk is now worth more than the average national economy.
Wealth Concentration Last Seen in 1913
Diamandis posted the comparison on X. He noted that no individual had matched Rockefeller’s grip on the American economy in more than 100 years. Rockefeller built his fortune on oil. Musk built his on electric vehicles, rockets, satellites, and artificial intelligence.
Tesla, SpaceX, Twitter, or X, and xAI together form the bulk of his paper wealth. Tesla shares carry its largest exposure, while privately held SpaceX is now valued near $400 billion in secondary markets. Both companies also retain meaningful Bitcoin reserves on their balance sheets.
His exposure stretches beyond corporate treasuries. His father has claimed the brothers hold more than 23,000 BTC, valued at more than $1.6 billion at current prices. Musk has vocally backed Bitcoin and Dogecoin in the past.

Musk’s Path to $10 Trillion
Reaching $10 trillion would require Musk’s combined holdings to multiply more than twelvefold from current levels.
Supporters point to autonomous taxis, Optimus humanoids, Starship cargo missions, and xAI data centers as the primary drivers of growth. Tesla’s market capitalization alone would need to rival the largest publicly traded companies in history.
X, now bundled with xAI, sits at the center of his consumer strategy. The platform has rolled out X Money in select US states and is testing in-feed crypto trading features. Musk has also signaled future integration of Dogecoin, though X has not confirmed any specific token.
Critics see the target as theatrical. Tesla’s stock trades on aggressive growth assumptions. Regulators are sharpening their review of SpaceX launch operations. Antitrust watchdogs are tracking X’s expansion into financial services. Any setback could quickly compress Musk’s paper wealth.
Musk’s reply drew 1.3 million views within hours. It reignited debate over whether any founder should hold this much of the American economy. Rockefeller’s record may stand or fall based less on Wall Street. The deciding factor may be how regulators define the limits of private wealth concentration.
The post Elon Musk Is Now Worth More Than an Average Country’s GDP appeared first on BeInCrypto.
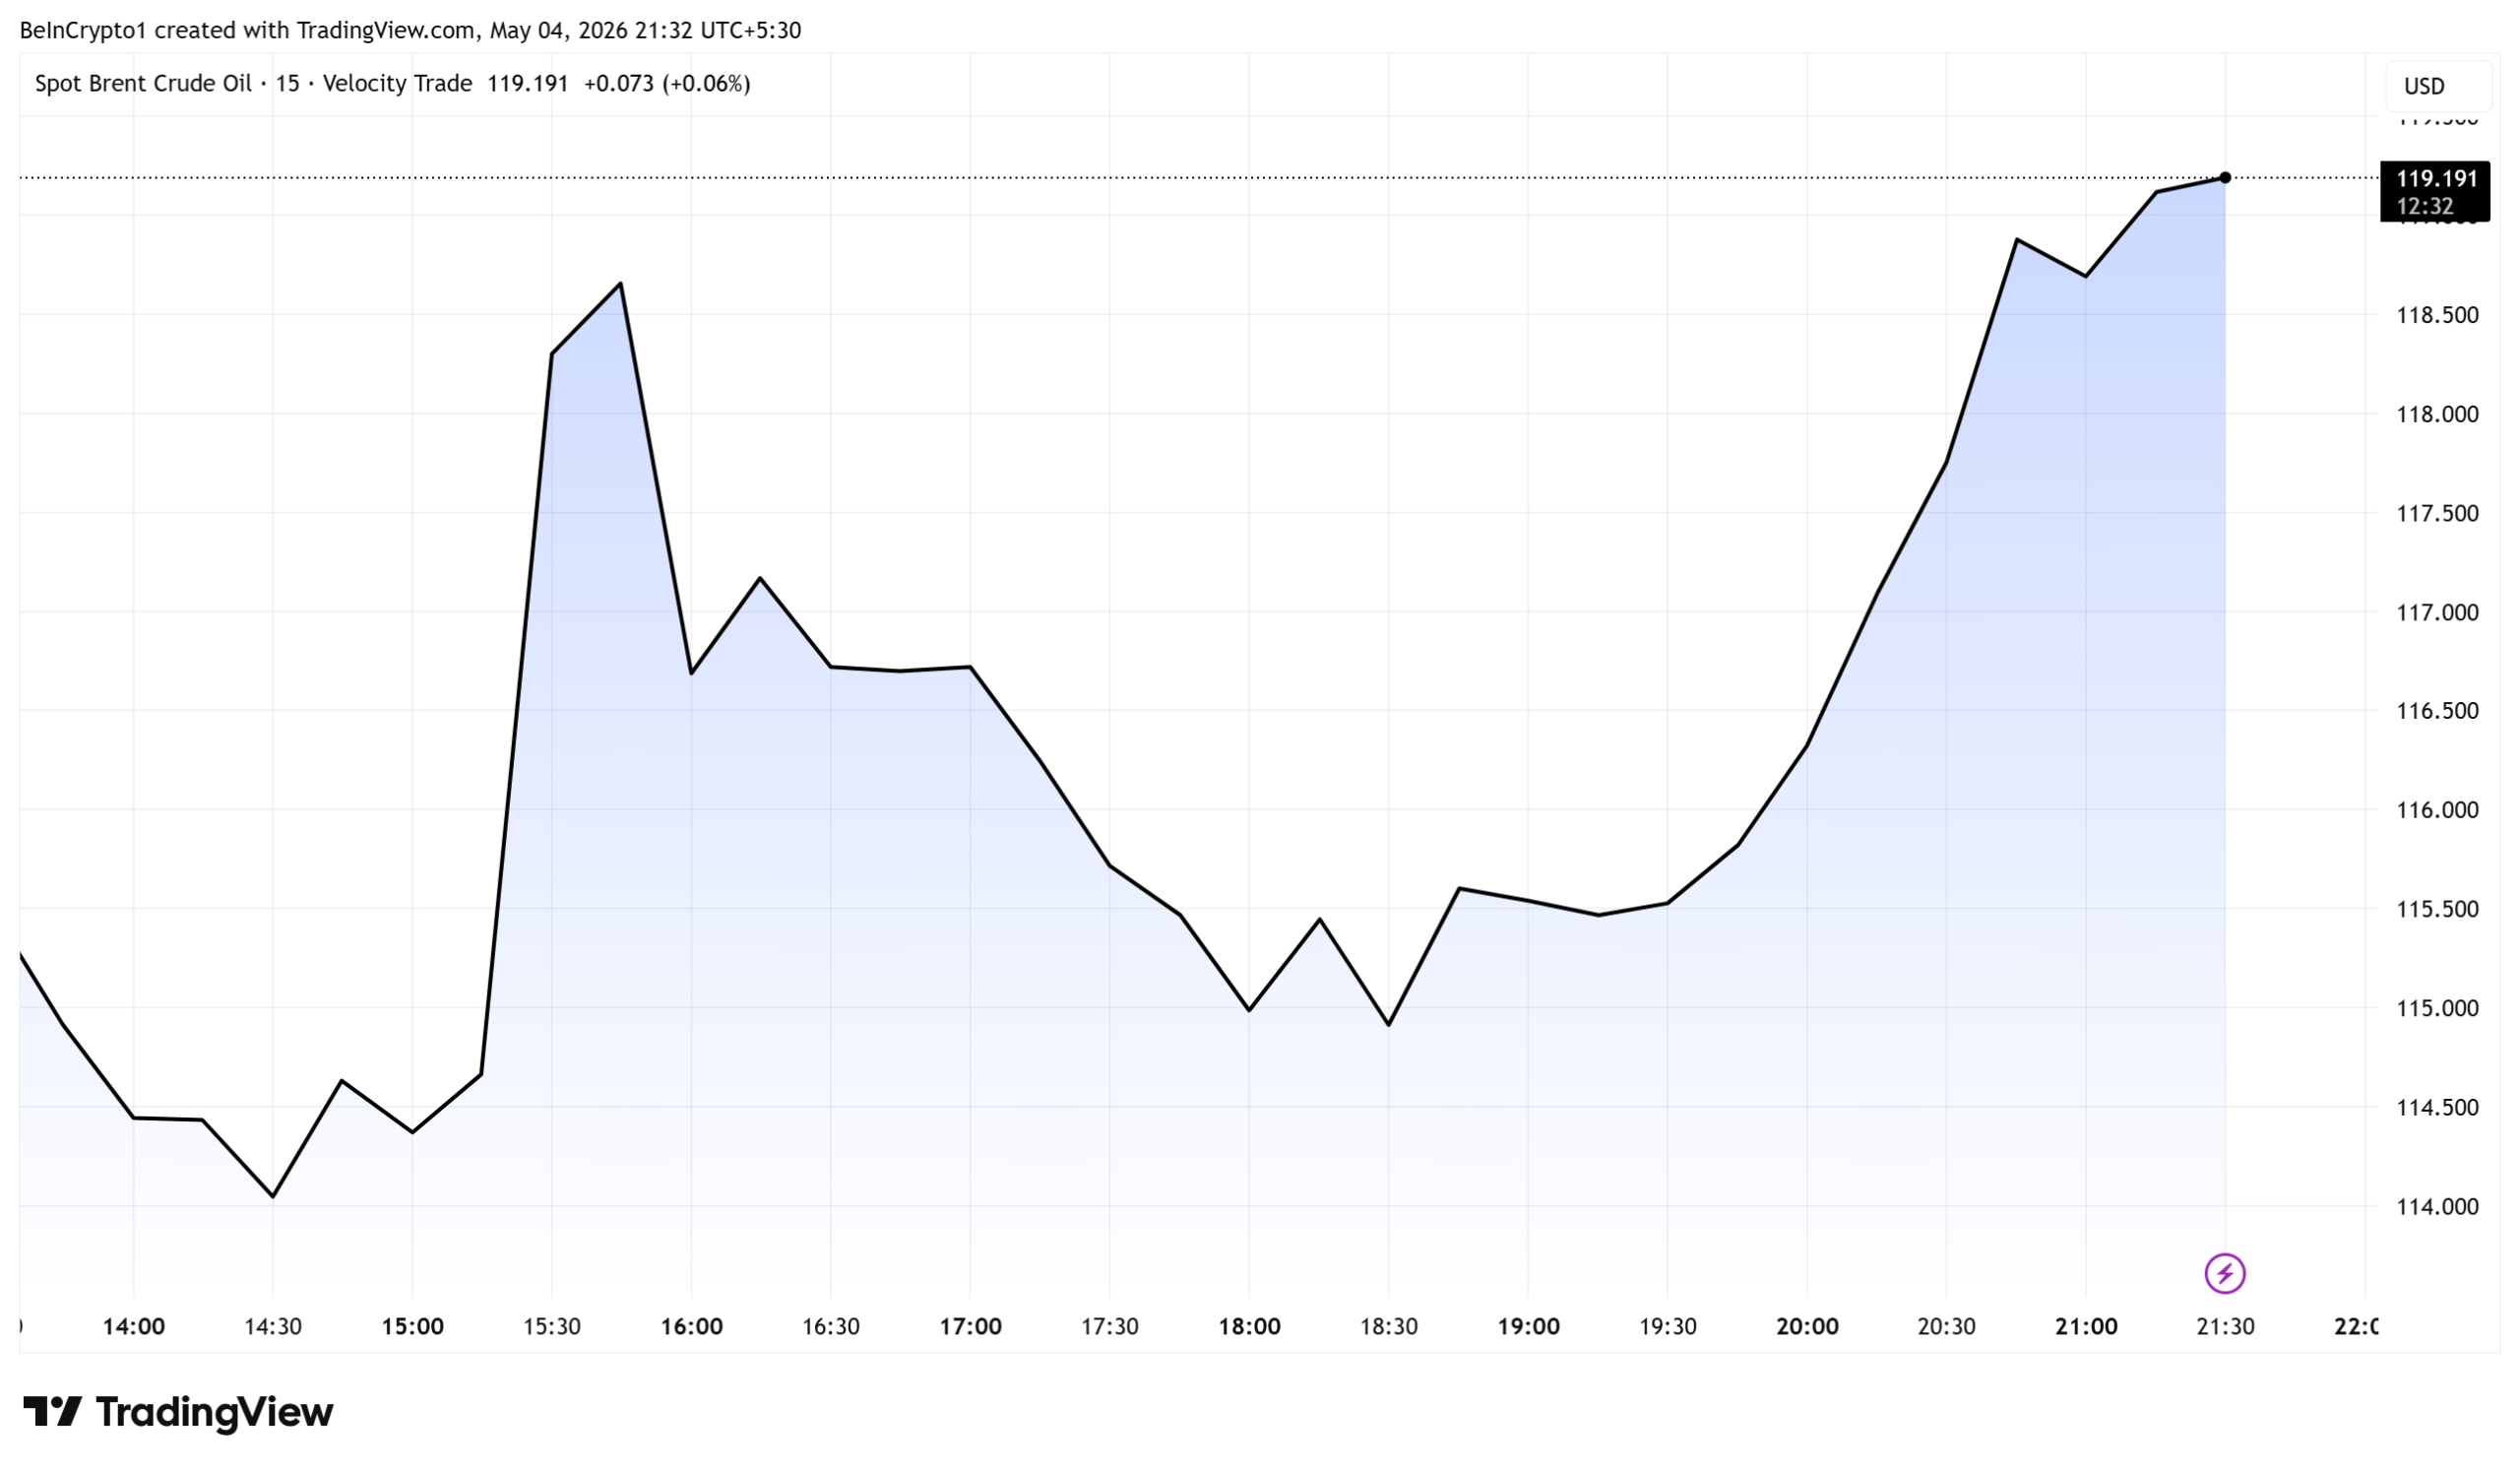
Oil price neared $120 a barrel on Monday after a drone strike on a UAE oil tanker in the Strait of Hormuz. The UAE has blamed Iran for the attack, the 24th on regional shipping since the war began.
The Abu Dhabi National Oil Company tanker Barakah was hit by two drones near Fujairah. The strait is now effectively shut to commercial traffic for a second time this spring.
Iran Blamed for Drone Strike on Empty ADNOC Tanker
As of this writing, the Brent crude oil price was trading for $119,191, after establishing an intra-day high of $120.363, before investors started booking early profits.

The Barakah, operated by ADNOC’s maritime logistics unit, was transiting the strait empty when the strike hit. UKMTO, the British military’s maritime warning service, said the tanker was struck by “unknown projectiles.”
No crew members were injured, the UAE Ministry of Foreign Affairs said in a statement. Officials directly accused Iran’s Islamic Revolutionary Guard Corps of carrying out the strike. The ministry called the incident a “terrorist attack” and “acts of piracy.”
The UAE called the strike a “flagrant violation” of UN Security Council Resolution 2817 on freedom of navigation.
It demanded Iran halt all attacks and commit to a cessation of hostilities. Abu Dhabi also pressed for the unconditional reopening of the strait to global shipping.
Hormuz Closure Resumes as US Prepares Project Freedom
A separate strike on a northbound cargo ship off Sirik on Iran’s southern coast was reported on Sunday. UKMTO described the regional threat level as “critical” and said all crew were unharmed. It was the first reported attack in the area since April 22.
Iran first closed the strait on February 28, 2026, when the war began. Tehran re-imposed restrictions on April 18 after Washington refused to lift its counter-blockade.
The waterway carries roughly one-fifth of global oil supply. Brent crude futures had already gained about 8% over the past week on rising supply fears.
US President Donald Trump said last week that the Navy would begin escorting stranded vessels through Hormuz on Monday. The humanitarian operation, called Project Freedom, is backed by US warships.
“Countries from all over the World… have asked the United States if we could help free up their Ships, which are locked up in the Strait of Hormuz… We have told these Countries that we will guide their Ships safely out of these restricted Waterways… God Bless All Our Troops Engaged in Project Freedom,” Trump indicated.
Iran has warned it will strike any US or Israeli forces entering the strait. Iranian state media has claimed the country’s navy turned back “enemy destroyers” and hit US vessels. US Central Command has denied those reports.
The next 48 hours will test Project Freedom’s ability to clear backlogged shipping without triggering wider escalation. Markets are watching whether oil holds the gains or fades the geopolitical risk premium.
The post Oil Tops $120 as Iran Strikes UAE Tanker and Hormuz Closes Again appeared first on BeInCrypto.
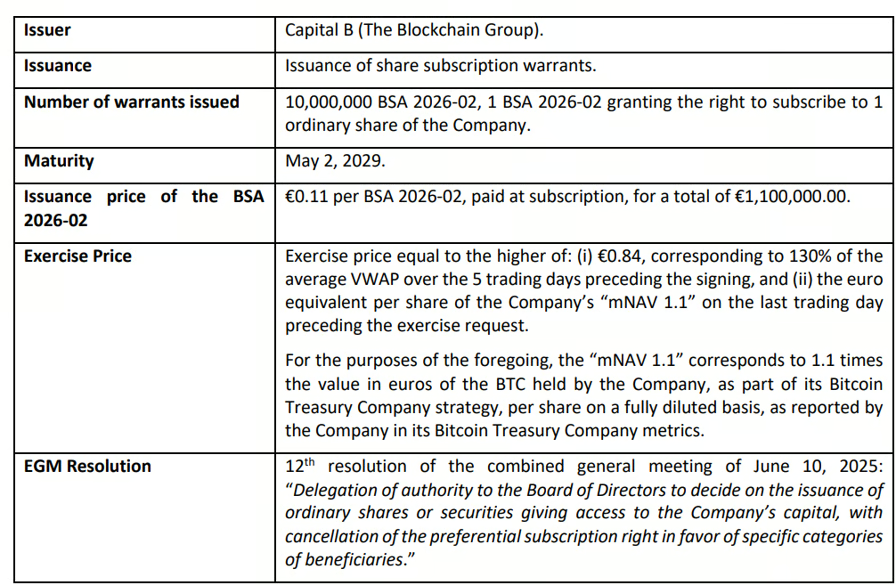
Capital B raised 1.1 million euros ($1.28 million) through a warrant issuance subscribed by Blockstream CEO Adam Back, extending the cryptographer’s backing of the French-listed Bitcoin treasury company.
Back subscribed to 10 million subscription warrants at $0.13 each, according to a Monday announcement from Capital B. Each warrant gives Back the right to buy one new share of future company stock at the exercise price of $0.98, corresponding to the company’s market net asset value (mNAV) of 1.1 per share, the company said.
The deal would increase Back’s exposure to Capital B, where he is already one of the company’s largest strategic investors. Back now holds over 39.5 million shares or 9.97% of Capital B’s shares on a fully diluted basis. Back is best known as the inventor of Hashcash, the proof-of-work system cited in the Bitcoin white paper.
The raise comes as some Bitcoin treasury companies continue seeking capital for accumulation strategies, while others are using derivatives or asset sales to manage balance sheet risk during Bitcoin’s downturn. Capital B and the United Kingdom-based Connecting Excellence Group (XCE) were the only Bitcoin treasury companies to raise capital in Europe over the past month.
XCE’s $794,000 capital raise on April 23 was also backed by Adam Back.

Capital B raises $1.28 million from Adam Back. Source: Capital B
Capital B shares rise 6% after capital raise announcement
Capital B said the new capital will be used to “accelerate” its Bitcoin treasury strategy, which was perceived as a positive signal from shareholders.
Capital B’s stock price rose by over 6.5% on Monday, but is still down over 16% since the beginning of 2026, data from Yahoo! Finance shows.

Capital B (ALCB.PA) stock price, year-to-date chart. Source: Yahoo! Finance
Capital B is the 25th largest Bitcoin treasury company, holding 2,943 BTC currently worth about $234 million, according to Bitcointreasuries.net data.
Related: Adam Back says Bitcoin’s post-quantum shift may reveal true Satoshi stash
Other Bitcoin treasury companies are reducing the balance sheet risk associated with Bitcoin’s downturn.
On April 24, Nasdaq-listed Bitcoin treasury company Nakamoto announced an actively managed Bitcoin derivatives program seeking to generate recurring income from volatility and hedge part of its corporate BTC holdings against downside exposure.
Nakamoto is the 20th-largest Bitcoin treasury firm and the largest to disclose selling part of its holdings earlier this year. The company announced a sale of 284 Bitcoin (worth about $20 million at the time) in a March 30 filing with the US Securities and Exchange Commission.
A month earlier, in February, Bitcoin treasury company Genius Group said it liquidated its entire treasury holdings of 84 BTC for about $5.7 million, which it used in repaying an $8.5 million debt obligation, according to an SEC filing.
Magazine: Bitcoin vs. the quantum computer threat — Timeline and solutions (2025–2035)
Crypto World
Bitcoin Realized Profits Hit $207.56M Monthly High as Price Breaks $80K for First Time in 3 Months

TLDR:
- Bitcoin’s net realized profits hit $207.56M on Sunday, marking the highest on-chain profit spike in a month.
- BTC crossed $80,000 for the first time in three months, absorbing heavy sell pressure without a price breakdown.
- New buyers entering at $80K are unlikely to sell at a loss quickly, creating a stronger price support floor.
- Santiment data shows profit-taking during price strength historically signals mid-bull momentum, not a market top.
Bitcoin realized profits surged to their highest level in a month as the asset crossed the $80,000 mark for the first time in three months.
On Sunday, the network recorded net realized profits of $207.56 million. Analysts view this as a constructive signal for the market.
The data comes from on-chain analytics firm Santiment, which tracks profit and loss activity across the Bitcoin blockchain in real time.
Strong Demand Absorbs Heavy Sell Pressure
Realized profit measures the difference between what a holder paid for Bitcoin and its current value at the time of movement.
When coins bought at $50,000 move on-chain after Bitcoin crosses $80,000, that gap becomes recorded profit. Santiment shared the data on Sunday, noting the chart reflects total network-wide gains and losses over a given period.
The $207.56 million in realized profits occurred while Bitcoin was climbing, not falling. That timing matters because it shows buyers absorbed hundreds of millions in sell-side pressure without the price breaking down.
Markets that hold firm under heavy profit-taking tend to reflect strong underlying demand rather than speculative weakness.
According to Santiment, “when a high level of profit taking occurs while markets are on the rise, it’s generally a bullish signal that the uptrend can continue.”
This pattern has historically appeared more in the middle stages of bull markets than at their peaks. The price response to Sunday’s selling supports that view.
The fact that Bitcoin held and pushed higher despite the volume of exits tells a straightforward story. Buyers were ready and willing to step in at those prices.
That kind of demand absorption is often treated as a market resilience test, and Sunday’s data suggests the market passed it.
Cost Basis Reset Builds a Stronger Support Floor
One structural outcome of mass profit-taking is a shift in the network’s average cost basis. When long-term holders sell their coins into strength, those coins transfer to new buyers entering at around $80,000. This process raises the average price paid across the network as a whole.
New buyers who entered at $80,000 are statistically less likely to sell at $79,000. They just acquired their position and have little incentive to exit at a loss so quickly.
Over time, this creates a denser support zone beneath current prices, making sharp downside moves harder to sustain.
It is also worth noting that Sunday’s spike was a monthly high, not an all-time record. Bitcoin has absorbed similar and larger profit-taking events in prior cycles and continued moving higher afterward. A moderate profit event that the market shrugs off tends to reflect resilience rather than a top signal.
Taken together, the on-chain data points to a market that is digesting supply efficiently. The combination of rising prices, elevated realized profits, and strong demand absorption presents a relatively steady picture for Bitcoin heading into the days ahead.

Western Union launched its U.S. Dollar Payment Token (USDPT) on Solana today. Anchorage Digital Bank issues the asset, which routes regulated digital dollars through the company’s 400,000-agent global network.
Anchorage is the first federally chartered crypto bank in the United States. Western Union’s existing compliance and payout infrastructure handles the rest, giving USDPT a footprint no crypto-native stablecoin owns.
Western Union Builds Crypto’s Largest Cash Off-Ramp With USDPT on Solana
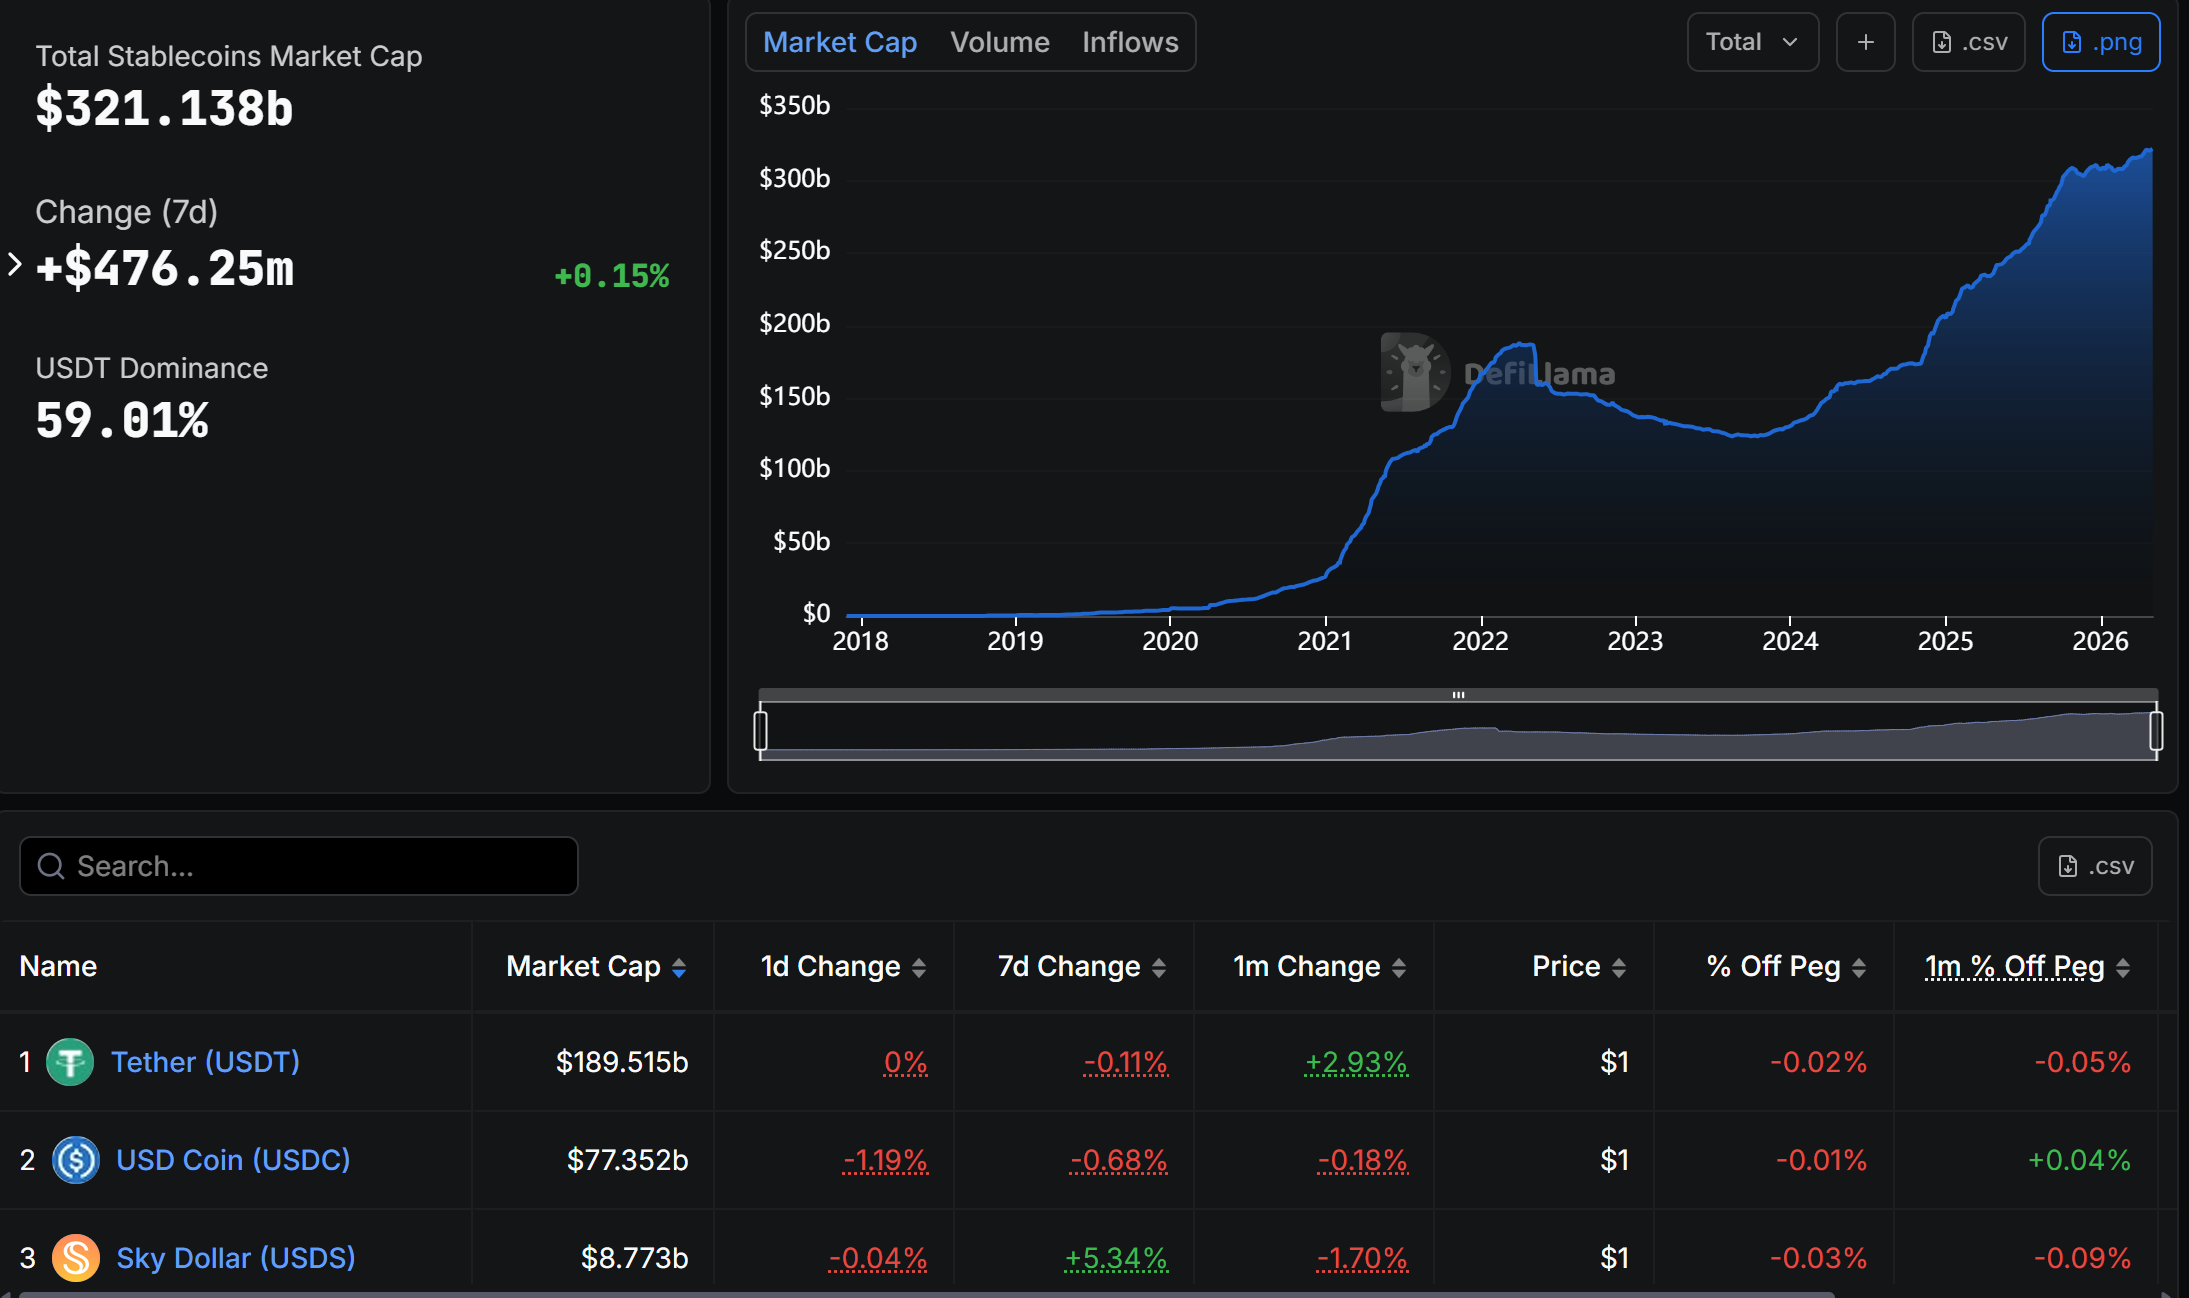
The launch shifts the conversation from blockchain mechanics to physical reach. Tether (USDT) and USD Coin (USDC) together control roughly 80% of the $321 billion stablecoin market.

Neither owns retail cash points in Manila, La Paz, or Lagos. Western Union runs hundreds of thousands of agent locations across 200 countries. Most sit in regions where banking access stays thin.
Tether and Circle compete on yield and integrations across DeFi protocols. Neither has built a parallel network of physical retail outlets in emerging markets.
From Settlement to Consumer Spending
USDPT first targets internal treasury and agent settlement. The setup replaces correspondent banking flows with near-instant transfers on Solana.
Pilot corridors include the Philippines and Bolivia, two high-volume remittance markets.
A consumer product called Stable by Western Union arrives in 2026 across 40 countries. The Digital Asset Network will connect licensed exchanges and custodians to the agent payout system. Fireblocks provides the settlement infrastructure.
Whether USDPT dents Tether’s dominance is the wrong question. The bigger one is what Western Union has shown. Owning the token and the last mile lets the company capture float and reach customers far from any exchange.
The post Western Union’s USDPT Hands Crypto a 500,000-Location Cash Network on Solana appeared first on BeInCrypto.
GameStop proposed an unsolicited, non-binding $55.5 billion acquisition of eBay in a cash-and-stock deal, as the video game retailer looks to push further beyond its legacy retail business.
The company on Sunday submitted a non-binding proposal to acquire 100% of eBay at $125 per share in cash and stock, according to an announcement.
The offer includes a 46% premium to eBay’s unaffected closing price on Feb. 4, 2026, when GameStop began building its position in the company. GameStop also disclosed it has accumulated a roughly 5% economic stake in eBay through derivatives and common stock holdings.
The proposal comes as GameStop tries to reposition itself beyond physical video game retail, including through a Bitcoin treasury strategy approved in 2025. But the bid also raises financing and execution questions because eBay’s market value is several times larger than GameStop’s.
Potential cost cuts and integration plans
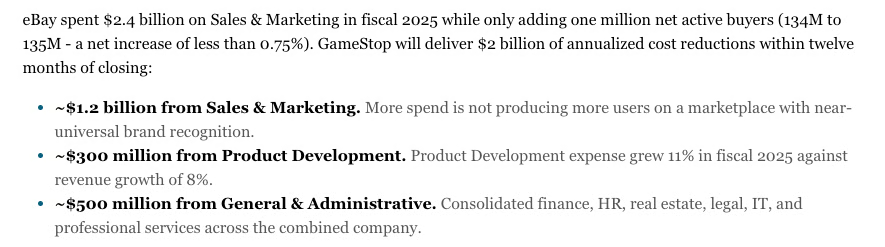
GameStop outlined potential cost savings of around $2 billion annually if the deal closes. It said those reductions would come from marketing, product development and administrative consolidation.
The company said eBay spent around $2.4 billion on sales and marketing alone in fiscal 2025, while only adding one million net active buyers.
“More spend is not producing more users on a marketplace with near-universal brand recognition,” GameStop added.

Source: GameStop
GameStop also pointed to its retail footprint of roughly 1,600 US stores as a possible asset for eBay’s logistics and authentication services. It suggested these locations could be used for product intake and fulfillment support.
It also said the proposal stipulates that the GameStop CEO would serve as CEO of the combined company if the acquisition succeeds.
Related: Bakkt completes acquisition of stablecoin payments firm Distributed Technologies Research
“EBay should be worth — and will be worth — a lot more money,” Cohen reportedly said, adding: “I’m thinking about turning eBay into something worth hundreds of billions of dollars.”
According to TradingView, eBay’s market capitalization stands at $46.2 billion at the time of writing. GameStop’s market cap is around $12 billion.

eBay stock price, all-time chart. Source: TradingView
GameStop has attracted attention for its growing ties to crypto markets, particularly after adding Bitcoin (BTC) to its corporate treasury strategy in 2025. The move positioned the company alongside a small group of public firms experimenting with digital assets as part of their balance sheet diversification.
The retailer also became a central figure in the 2021 meme stock frenzy, when retail investors coordinated buying activity that sent its shares sharply higher and triggered extreme volatility.
Magazine: Why is Ethereum Foundation selling? BTC futures warning signs: Market Moves


South Korea’s crypto industry has reportedly warned that proposed Anti-Money Laundering (AML) rule changes could create operational confusion by forcing virtual asset service providers (VASPs) to report all overseas-linked virtual asset transfers worth 10 million Korean won (about $6,800) or more as suspicious transactions.
According to a Yonhap News report on Sunday, the Digital Asset eXchange Alliance (DAXA), an industry body representing South Korean exchanges, submitted comments on the proposed changes to the Enforcement Decree of the Specific Financial Information Act and related supervisory rules. The comments reflected the views of 27 registered VASPs, including the country’s five major exchanges: Upbit, Bithumb, Coinone, Korbit and Gopax.
DAXA said the proposal could increase suspicious transaction reports from South Korea’s five largest exchanges by 85 times, from about 63,000 cases last year to over 5.4 million, making compliance difficult in practice. The group also objected to a proposed requirement to verify the accuracy of customer information, arguing that lower-level rules add obligations not clearly set out in the underlying law.
The pushback highlights growing tension between South Korea’s effort to tighten crypto AML oversight and the industry’s concern that compliance rules are being expanded beyond what exchanges can reasonably process.
The Financial Services Commission (FSC) and the Financial Intelligence Unit (FIU) proposed the amendments on March 30, opening a public notice period through May 11. Under the proposal, domestic VASPs conducting virtual asset transfers with overseas VASPs would have to report transactions of 10 million won or more as suspicious regardless of risk level. The rules are expected to be finalized in July after regulatory and legal review.
Related: South Korea tightens crypto withdrawal-delay exemptions after scam losses
Courts halt FIU’s AML sanctions on major exchanges
The industry pushback comes as South Korean exchanges are already challenging AML-related sanctions imposed by the Financial Intelligence Unit in court.
On April 9, Upbit operator Dunamu won a first-instance ruling canceling a three-month partial business suspension tied to alleged violations involving customer due diligence and transactions with unregistered foreign virtual asset service providers. However, the regulator appealed the decision on April 30, according to Yonhap.
On Friday, crypto exchange Bithumb also received court relief after the Seoul Administrative Court suspended enforcement of a six-month partial business suspension until the main case is decided. The FIU imposed the sanction after an inspection found alleged violations of South Korea’s Financial Information Act, including failures tied to transactions with unregistered VASPs.
Coinone, which received a three-month partial business suspension and a 5.2 billion won fine over alleged AML failures, also received a temporary reprieve after challenging the sanctions. Local reports said the case involved customer verification issues and transactions with unregistered overseas virtual asset service providers.
Magazine: AI-driven hacks could kill DeFi — unless projects act now
Key takeaways:
- Improved Bitcoin mining profitability and massive ETF inflows have calmed investors’ fears that miner selling could cap BTC price.
- Bitcoin dominance hits its highest level since July 2025 as investor interest shifts away from struggling altcoin sectors.
Bitcoin (BTC) surged to $80,000 for the first time in three months on Monday, triggering $270 million in liquidations across leveraged short (sell) futures contracts. This positive momentum for Bitcoin coincided with tech stocks jumping to an all-time high, signaling a broad risk-on environment. Currently, three key indicators point to further upside momentum for Bitcoin.

Nasdaq 100 futures (left) vs Bitcoin/USD (right). Source: TradingView
Bitcoin’s price action maintained a tight correlation with the tech-heavy Nasdaq 100 Index. Yet while the US stock market nears its highest-ever level, Bitcoin sits 36% below its $126,200 peak from October 2025.

Bitcoin Hashprice Index by Luxor, USD. Source: HashrateIndex
Profitability for Bitcoin miners has also improved. The expected daily return for 1 pentahash/second has climbed to $37, a high not seen since Jan. 30. This shift is crucial because the total hashrate has dropped 13% over the last quarter. Major publicly listed mining firms have recently liquidated their Bitcoin treasuries to reduce debt and support AI data center investments.
Bitcoin miners, ETF flows and options demand back BTC’s momentum
For a time, traders feared that a decline in network hash power would spark additional sell pressure. Data from BGometrics shows miner reserves hitting 10-year lows and on Thursday, Riot Platforms (RIOT US) confirmed that it sold $250 million in Bitcoin last quarter. Fortunately, the recent jump in mining profitability is beginning to alleviate these structural concerns.

Bitcoin market share, excluding stablecoins. Source: TradingView / Cointelegraph
Bitcoin’s market share, excluding stablecoins, has jumped to its highest level since July 2025. This move reflects a declining demand for memecoins, governance tokens, and blockchain applications in general. Reduced interest in decentralized exchanges and numerous hacks within finance applications have also contributed to the negative sentiment surrounding altcoins.
Combined assets under management for Bitcoin and Ether (ETH) exchange-traded products reached $147 billion, according to a CoinShares report from April 27. In comparison, similar products for Solana and XRP have failed to break above $3 billion each. Investors’ expectations for institutional demand for major altcoins proved too high, as BTC and ETH now account for 95% of that market.
Related: Bitcoin short-term cost basis approaches profitability, but $80K must flip to support first

Deribit Bitcoin options premium put-to-call, USD. Source: Laevitas
Demand for call (buy) option premiums exceeded that for equivalent put (sell) options on Monday by 24%. This data represents a major turnaround from levels seen during the weekend, when premiums paid for call options were 25% lower than those for put options. While it seems premature to conclude that traders are flipping bullish, the fear of an imminent price decline is no longer present.
Friday’s strong $630 million net inflows into US-listed spot exchange-traded funds (ETFs) likely contributed to the improved sentiment. Regardless of the high correlation with tech stocks, Bitcoin’s path to $85,000 remains valid given the increased mining profitability, dominance versus altcoins and Bitcoin options data.
Global Market Today: Asian shares mixed as Iran tensions flare up again

Paradigm launches PACTs Bitcoin quantum proposal

Focal Omada Speakers Are Now Up to 35% Off
Manchester United reach agreement with Casemiro over contract clause amid transfer speculation

US brings back mandatory military draft registration

Steven Gerrard disagrees with Gary Neville over ‘shock’ Chelsea and Arsenal claim | Football

Princess Beatrice WITHDRAWS Support From Royal Charity After Financial Irregularities Found

Stop Wasting Money on Waders (Watch This First)

styleDoor-Opening Prayers: ScripturalDecrees for Financial Breakthrough andDivine Favor #prayer
-

 Business6 days ago
Most Commercial Energy Audits Miss the Real Losses
-

 Fashion6 days ago
Kylie Jenner’s KHY Enters a New Era with ‘Born in LA’
-

 NewsBeat1 day ago
Channel 5 – All Creatures Great and Small series 7 new post
-
 Tech3 days ago
Trump’s 25% EU auto tariff breaches Turnberry Agreement that also covers semiconductors and digital trade
-
 Sports3 days ago
Paul Scholes issues Marcus Rashford reality check as agreement emerges over Man United star
-

 Crypto World7 days ago
CFTC’s AI will review U.S. crypto registration applications, chairman tells CoinDesk
-

 Business6 days ago
Barclay Brothers Avoid Bankruptcy: HSBC Drops High Court Petitions After IVA Deal
-
 Business5 days ago
Tesla Officially Registers Elon Musk’s Stock: What Investors Need to Know
-
Crypto World7 days ago
Robinhood Phishing Scam Exploits Gmail Dot Feature to Bypass Security
-

 Tech6 days ago
Get Ready for More Brain-Scanning Consumer Gadgets
-

 Crypto World7 days ago
Gmail Dot Trick Underpins Robinhood Phishing, Sending Real-Looking Emails
-

 Business4 days ago
Two Powerball Tickets Split $143 Million Jackpot in Indiana and Kansas
-

 Tech5 days ago
Texas Instruments made a new flagship graphing calculator: the TI-84 Evo
-
 Crypto World4 days ago
CoreWeave (CRWV) Stock Climbs 8% Despite $45M Insider Share Dump
-

 Entertainment7 days ago
How A Fantasy Flop Finally Found Success On HBO Max
-
 Business7 days ago
Global Market Today: Asian shares hold near eight-week high
-
Business2 days ago
Winning Numbers Drawn as Jackpot Resets to $20 Million
-

 Business7 days ago
Top 10 AI Companies Leading New Zealand’s Tech Boom in 2026
-

 Tech7 days ago
Bambu Lab H2C review: the Cadillac of 3D printers
-

 Tech7 days ago
Robinhood account creation flaw abused to send phishing emails
You must be logged in to post a comment Login