

Crypto World
Could Stellar (XLM) Be Preparing for a Long-Term Breakout as Institutional Adoption Grows?

TLDR:
- Stellar (XLM) is attracting institutional interest through fast, low-cost cross-border payment infrastructure.
- Growing stablecoin activity and real-world asset tokenization are strengthening Stellar’s on-chain economic case.
- Potential CBDC integrations and institutional partnerships could serve as major long-term catalysts for XLM.
- Continuous network upgrades and scalability improvements position Stellar for sustained growth beyond short-term volatility.
Stellar (XLM) is showing signs that a long-term breakout may be forming as blockchain adoption moves toward real-world utility. The network has built a foundation around fast, low-cost cross-border payments and institutional integration.
With growing activity across stablecoins and tokenized assets, Stellar’s infrastructure is drawing closer attention from market observers and financial institutions alike.
Institutional Adoption Could Be the Catalyst Behind XLM’s Breakout
Stellar’s growing institutional presence is one of the strongest arguments for a potential long-term breakout. Financial institutions are increasingly evaluating networks that offer practical payment solutions at low cost. Stellar fits that profile more directly than most competing blockchain networks currently available.
Payment providers are also beginning to build on Stellar’s infrastructure at a measurable pace. As more real transactions flow through the network, its on-chain economic activity grows steadily.
That kind of organic growth tends to support sustained price movement over time rather than short-term speculation.
Crypto commentator SylvianGuibal on X captured this sentiment, noting that Stellar “continues to attract growing institutional interest while expanding its footprint across payments, stablecoins, and tokenized assets.”
If that trajectory holds, institutional adoption alone could serve as a meaningful breakout trigger for XLM going forward.
Real-World Asset Tokenization and Stablecoins Could Push XLM Higher
Tokenization of real-world assets is emerging as a strong driver for Stellar’s long-term growth outlook. Institutions exploring regulated digital finance are looking for networks that can handle asset issuance reliably. Stellar’s architecture is built to support exactly that kind of activity at scale.
Stablecoin usage on the network is also growing at a notable rate. Stablecoins need fast, affordable infrastructure to move value efficiently across borders. Stellar meets those technical requirements, positioning it well within a rapidly expanding stablecoin market.
Beyond that, potential central bank digital currency integrations could further strengthen XLM’s long-term case. Several central banks are actively researching CBDC frameworks, and Stellar has been part of those early discussions. A confirmed CBDC partnership would represent a considerable step toward a sustained breakout scenario.
Continuous Network Upgrades Keep XLM Positioned for Long-Term Growth
Stellar’s development team has maintained a steady schedule of technical upgrades aimed at improving scalability and interoperability.
These improvements ensure the network remains competitive as global financial infrastructure evolves. Consistent development is one of the clearer signs that the project is building for the long term.
The network’s ability to handle high transaction volumes without sacrificing speed or cost remains a core strength.
As adoption grows, this technical capacity reduces the risk of bottlenecks that have slowed other blockchain networks.
That reliability makes Stellar a more credible choice for institutions considering long-term infrastructure commitments.
As @SylvianGuibal stated, “the real question is whether Stellar can continue capturing meaningful economic activity on-chain.”
If adoption across payments, tokenized assets, and stablecoins keeps accelerating, XLM may already be laying the groundwork for the breakout that many in the market are watching for.


Crypto companies already licensed under the European Union’s Markets in Crypto-Assets Regulation (MiCA) could still exit the market as compliance costs mount, according to Gate Europe’s CEO.
Giovanni Cunti told Cointelegraph’s Chain Reaction on Monday that stricter regulatory requirements have made it increasingly difficult for new entrants to compete and that some licensed firms could ultimately be unable to absorb the ongoing costs of operating under the framework.
“I think there are going to be quite a few more of the ones that acquire MiCA license that will not be capable to sustain the cost and the resources that are needed to carry on this business in the long term,” Cunti said.
MiCA is the EU’s regulatory framework for crypto assets. The bloc’s 18-month transition period ended on July 1, requiring crypto firms serving EU customers to operate under authorization or cease offering regulated services.
The deadline prompted several exchanges to restrict or withdraw services in parts of Europe while licensed firms began operating under the new regime. Binance, the world’s largest crypto exchange by trading volume, was not able to secure a MiCA license before the deadline.
Compliance costs reshape Europe’s crypto market
Cunti also warned that MiCA’s stricter regulatory requirements could drive some crypto startups and projects outside Europe. While the framework has strengthened investor protections, he said it leaves less room for innovation than jurisdictions with lighter rules.
He said some projects may choose to launch in jurisdictions with less restrictive regulatory requirements instead of navigating the bloc’s compliance regime.
“We may need to be prepared that some projects, possibly some important projects, may be looking at other jurisdictions with different guidelines,” he said.
Related: ESMA MiCA warning puts Binance EU service changes under scrutiny
To be sure, the number of companies authorized under MiCA continues to grow, albeit at a slower pace.
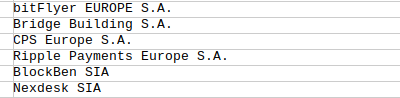
On Friday, the European Securities and Markets Authority added 14 crypto-asset service providers (CASPs) to its register, bringing the total to 294 after adding 37 firms in ESMA’s first update following the July 1 transition deadline.
Cunti said the higher regulatory burden is reshaping Europe’s competitive landscape, but the shrunken market also presents an opportunity for those remaining crypto service providers.
“There was a market with thousands of operators, and now there is a market with only hundreds,” Cunti said.
“So definitely there is a big opportunity for all of us. There is an ongoing migration because customers do not want to lose access to this market,” he added.
Magazine: The British Virgin Islands are a top crypto hub no one ever talks about: Here’s why


Grayscale filed an S-1 registration statement with the U.S. Securities and Exchange Commission on July 20, 2026, to launch a spot Worldcoin ETF, according to the filing's EDGAR record. The filer entity, Grayscale Worldcoin ETF, is registered under file number 333-297570 and accession number… Read the full story at The Defiant


Lending protocol Morpho has launched Morpho Midnight on Base, adding fixed-rate, fixed-term loans to its onchain credit network alongside the variable-rate markets offered through Morpho Blue.
In an announcement sent to Cointelegraph, Morpho said the offer-driven protocol lets lenders and borrowers propose their own interest rates, maturities and other loan terms instead of relying on a protocol-defined utilization curve. Loans are issued as fixed obligations, with terms set through competing offers rather than algorithmic pool pricing.
Predictable rates and defined maturities are standard features of traditional credit markets. However, they remain uncommon in decentralized finance (DeFi), where borrowing costs generally fluctuate based on market utilization. Fixed terms could make onchain lending more attractive to institutions and businesses that need to manage funding costs, returns and risk exposure in advance.
A Morpho spokesperson told Cointelegraph that Midnight is live on the Base mainnet, initially supporting cbBTC and USDC across multiple maturity dates. The spokesperson said Morpho deliberately kept the launch contained as part of a progressive rollout that prioritizes security.
The spokesperson said crypto-native lenders, borrowers and curators already active on Morpho Blue had shown interest in Midnight. Several unidentified enterprises and institutions are also building products on the protocol in beta, with announcements expected as those products go live.
Morpho’s fixed-rate lending plans take shape
Morpho first outlined the fixed-rate system in 2025 under a broader “Morpho V2” roadmap. It described an intent-based, peer-to-peer marketplace where users could submit custom offers, price loans through market demand and keep capital earning variable yield until a fixed-rate offer was matched.
In April, Morpho named the fixed-rate protocol Midnight and clarified that it was not a replacement for Morpho Blue. While Blue provides open-ended, variable-rate lending pools, Midnight externalizes loan risk, interest rate and duration to market participants.
The protocol then released Midnight’s whitepaper and codebase in May, saying that its “offered capital” model was intended to avoid a recurring problem for fixed-rate DeFi protocols: liquidity being locked or fragmentation across maturity dates.
Related: Grayscale plans regular cash payouts from ETH, SOL staking rewards
Midnight’s launch follows Morpho’s $175 million funding round in June, led by Paradigm, Andreessen Horowitz’s a16z crypto and Ribbit Capital. At the time, Morpho said it planned to expand integrations with banks, asset managers and large platforms while adding features associated with traditional credit markets.
Morpho’s infrastructure already underpins variable-rate lending products distributed through major crypto platforms. In April, Coinbase launched Morpho-powered USDC loans for United Kingdom users, allowing them to borrow against Bitcoin (BTC), Ether (ETH) and cbETH on Base.
The loans carried variable rates and no fixed repayment schedule, illustrating the open-ended borrowing model that Midnight intends to complement.
Magazine: Ethereum’s EEZ could pull other blockchains into its orbit

XRP Ledger’s v3.2.0 software has reached 66% validator adoption, with 99 validators now running the release as the network approaches a July 29 amendment activation.
Summary
- XRP Ledger v3.2.0 now runs on 66% of tracked validators and 57.33% of nodes.
- The fixCleanup3_2_0 amendment holds 85.71% support ahead of its July 29 activation.
- The update fixes vault, lending, and permissioned DEX issues while renaming rippled to xrpld.
According to recent XRPL Explorer data, 481 nodes, or 57.33% of the tracked network, have installed v3.2.0. The figures show that the latest software has gained ground since its June rollout, although a sizeable share of operators remain on the previous release.
Version 3.1.3 still runs on 42 validators, equal to 28% of the validator set covered by the tracker. Another 323 nodes, representing 38.41% of the 825 observed nodes, also continue to use the older software.
Software adoption and amendment approval are separate processes on the XRP Ledger. Installing v3.2.0 gives operators access to the latest fixes, while an amendment requires support from at least 80% of trusted validators for two consecutive weeks before its rules can take effect.
The fixCleanup3_2_0 amendment has already crossed that voting threshold. XRP Ledger governance data shows 85.71% support, with 30 validators voting in favor and five opposing the proposal.
Having secured the required backing, the amendment is scheduled to activate on July 29, 2026, at 09:57 UTC. Support must remain at or above 80% throughout the countdown; otherwise, the network’s two-week timer will restart.
Validator backing keeps the amendment on schedule
XRPL validator Vet has urged node operators to update their software before activation so their infrastructure remains compatible with the amended protocol. Operators using unsupported versions can become amendment-blocked once new rules go live, preventing their servers from determining the valid state of the ledger.
Unlike a feature release built around new user-facing products, fixCleanup3_2_0 combines maintenance changes for functions already available on XRPL. The official v3.2.0 release announcement identifies fixes covering Single Asset Vaults, the Lending Protocol, the Permissioned decentralized exchange, Multi-Purpose Tokens, and Permissioned Domains.
For Single Asset Vaults, the package addresses accuracy and rounding issues that can affect how deposited assets and shares are calculated. Lending Protocol changes correct related accounting behavior, while the Permissioned DEX and Permissioned Domains receive fixes for problems found after their earlier implementation.
Amendment voting allows validators to decide whether those consensus-level changes should become binding across the ledger. Even though v3.2.0 is already running on most tracked validators, the amendment will not alter mainnet behavior until the waiting period ends successfully.
Crypto.news reported earlier in July that fixCleanup3_2_0 had entered its final activation window after approval moved above 80%. The current 85.71% reading leaves a buffer of 5.71 percentage points, but XRPL rules still require support to hold until the scheduled activation time.
XRPSCAN’s amendment tracker lists fixCleanup3_2_0 as a proposal introduced through version 3.2.0. Its status also means operators must install compatible software even though running the release does not automatically count as an affirmative amendment vote.
Version 3.2.0 prepares XRPL infrastructure for new activity
Released in mid-June, v3.2.0 has also changed the name of the XRP Ledger’s core server software from “rippled” to “xrpld.” The rename follows XLS-0095, a technical proposal intended to align the server’s identity more directly with the XRP Ledger.
The change affects more than the executable’s name. Under XRPL’s migration instructions, operators moving from version 3.1.3 must update the configuration file from rippled.cfg to xrpld.cfg, along with related paths and deployment settings.
Node operators may also need to revise database directories, package references, scripts, service definitions, and server metadata. XRPL documentation provides a migration process designed to preserve existing node data while replacing the former server naming conventions.
Beyond the rename, the XRP Ledger development team describes v3.2.0 as a cleanup and maintenance release. The software retires amendments that have remained active for more than two years and continues work to divide the libxrpl codebase into smaller modules, which can make future development and maintenance easier.
Those infrastructure changes arrive while projects are testing new payment uses on the ledger. Ripple-backed t54.ai recently reported that XRPL had processed more than 1 million AI-driven payments through the x402 protocol and launched an AI Hub for agents, developers and payment services.
According to t54.ai, the hub was developed with support from Ripple developers and the XRP Ledger Foundation. It collects AI projects, autonomous agents, developer tools, payment services and technical resources in one place for teams building XRPL applications.
With eight days remaining before the scheduled amendment date, validator voting has kept fixCleanup3_2_0 on course. The remaining task falls to node operators still running older software, as the July 29 activation will apply the maintenance rules across the XRP Ledger if approval stays above the required level.


Disclosure: This article does not represent investment advice. The content and materials featured on this page are for educational purposes only.
Bitcoin’s recent rally and ETF inflows are boosting market sentiment as traders look beyond BTC to emerging projects such as Remittix.
Summary
- Bitcoin’s rally shifts attention to Remittix as its presale surpasses $31 million and ecosystem expansion continues.
- Remittix tops $31 million in presale funding as Bitcoin’s rebound fuels interest in emerging crypto projects.
- Remittix nears a $32 million presale milestone as Bitcoin strength revives demand for altcoin opportunities.
Bitcoin has returned to the centre of market attention after climbing to around $65,500, its highest level in roughly two weeks. The move came as risk appetite improved, chip stocks rebounded and U.S. spot Bitcoin ETFs recorded five straight sessions of inflows worth more than $600 million.
The return of Bitcoin momentum is now pushing traders to look across the wider crypto market for altcoins with stronger growth potential. One of the projects gaining attention is Remittix, which has now passed $31 million in its presale after announcing a major ecosystem expansion through Remittix Markets.
Bitcoin momentum puts altcoins back on watch
Bitcoin remains the biggest signal for the wider crypto market. Recent coverage showed Bitcoin reaching the $65,500 area before traders began watching whether the move could hold, while CoinDesk also reported that Bitcoin had previously pulled back after hitting a similar monthly high as profit-taking entered the market.
That matters because Bitcoin strength often helps bring attention back to higher-growth altcoin plays. When Bitcoin stabilises or pushes higher, investors usually begin searching for smaller projects with clearer catalysts, stronger upside narratives and upcoming launch events.
Remittix surpasses $31m as RTX momentum builds
Remittix has now passed $31 million in its presale, putting the project close to the key $32 million milestone where the team is expected to reveal the official launch date.
That gives RTX a clear near-term catalyst at a time when traders are looking beyond Bitcoin for new opportunities. The project has also confirmed a wider ecosystem direction, with PayFi, Remittix Markets and future Earn products becoming the core story around RTX.
This is why Remittix is starting to stand out. It is not only a presale with a launch countdown. It is becoming a product-led ecosystem built around crypto payments, trading access and real-world utility.
PayFi targets a massive payments problem
The strongest part of the Remittix story is still its PayFi platform.
Crypto is easy to buy, hold and trade, but using it for normal bank payments remains difficult. Users often need exchanges, wallet transfers, conversions and withdrawal steps before digital assets can become usable fiat.
Remittix is designed to solve that problem by letting users send crypto to any bank account in the world, while the recipient receives fiat directly. That gives the project a clear use case in the global payments industry, which Remittix positions as a $19 trillion opportunity.
The platform is now fully developed and has already been tested by members of the community. That gives RTX a stronger foundation before launch than projects relying only on future promises.
Remittix markets expands the ecosystem
Remittix has also revealed Remittix Markets, its new perpetual futures trading platform.
This adds a second major growth layer to RTX. PayFi gives Remittix its real-world payments angle, while Remittix Markets adds trading activity, perps demand and another reason for users to engage with the ecosystem.
As Bitcoin hits a two-week high and traders search for the next high-growth altcoin story, Remittix is building momentum with a developed PayFi platform, a major ecosystem expansion and a $32 million launch date reveal milestone now approaching.
Discover the future of PayFi with Remittix by checking out their project here.
FAQ
Why is Bitcoin in focus right now?
Bitcoin is in focus after climbing to around $65,500, its highest level in roughly two weeks, supported by renewed risk appetite and spot Bitcoin ETF inflows.
How much has Remittix raised so far?
Remittix has now passed $31 million in its presale and is approaching the $32 million milestone for its official launch date reveal.
What makes Remittix different from other presales?
Remittix has a fully developed PayFi platform tested by community members and has expanded the RTX ecosystem with Remittix Markets, its new perps trading platform.
Disclosure: This content is provided by a third party. Neither crypto.news nor the author of this article endorses any product mentioned on this page. Users should conduct their own research before taking any action related to the company.

Wrapped Ethereum (WETH) recorded 113,000 whale transactions worth more than $100,000 over the past week. This figure is its highest level since May 2021, according to on-chain analytics platform Santiment.
The surge indicates that significant capital is moving through Ethereum’s trading, lending, liquidity, and decentralized finance (DeFi) infrastructure rather than remaining idle in wallets.
WETH Whale Activity
Santiment, in its latest post on X, revealed that the increase coincides with several signs of rising demand for Ethereum. These include accelerating inflows into US spot Ether ETFs, with BlackRock’s ETH products absorbing a large share of recent inflows, as well as growing activity on Robinhood Chain, which uses ETH for gas and has processed heavy decentralized exchange (DEX) volume since its July 1 launch.
The analytics firm also pointed to increasing corporate treasury participation, as it highlighted Bitmine’s holdings of around 5.8 million ETH and backing from Bitmine, SharpLink, and Joe Lubin for Ethlabs to cater to the increasing institutional demand for Ethereum.
While they do not guarantee a price rally, these factors are worth paying attention to.
Next Key Levels
As for ETH’s price, the world’s largest altcoin by market cap, climbed to $1,934 on Wednesday, rising by almost 9% on the week and 4.5% on the day. Earlier, crypto analyst Ali Martinez said Ethereum remains above the “must hold” level of $1,850; its next upside target would be $2,300.
MN Trading founder Michaël van de Poppe also believes that if the crypto asset holds the crucial support zone above $1,800, it should “trigger a continuation upwards.”
A similar projection was made by another analyst, Tony Research, who said ETH could first climb above $2,000, with a move toward the $2,200 area possible if Bitcoin reaches $70,000. However, the rally is expected to be followed by seven to 10 days of distribution before Ethereum falls into a final bottom zone between $1,260 and $890, which the analyst described as a dollar-cost averaging (DCA) opportunity.
According to the forecast, that decline would pave the way for a new bull cycle, with Ethereum eventually targeting $7,000.
The post Wrapped Ethereum Just Logged a Five-Year Whale Record: Here’s Why It Matters for ETH appeared first on CryptoPotato.
Bitcoin (BTC) built on gains at Tuesday’s Wall Street open as crypto echoed resilient US stock markets.
Key points:
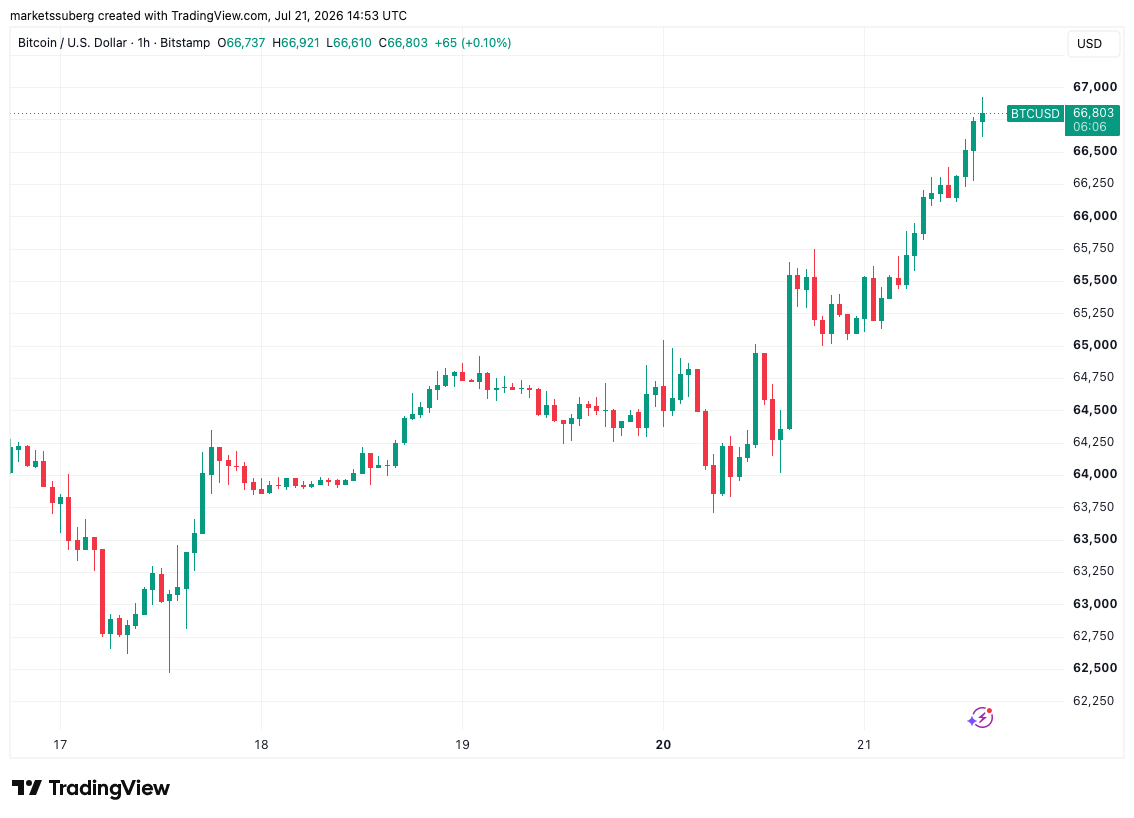
- BTC price action approached $67,000 despite new geopolitical and macroeconomic pressures.
- Neither the US-Iran war nor proposed international trade tariffs were able to disrupt risk-asset upside.
- Bitcoin needed a reclaim of its 21-week simple moving average to challenge the bear market, analysis warned.
Bitcoin, stocks ignore Iran war, fresh US tariffs
Data from TradingView showed BTC/USD approaching $67,000, closing in on seven-week highs.

BTC/USD one-hour chart. Source: Cointelegraph/TradingView
Upward momentum that began the day showed little signs of stopping despite macro conditions that seem to favor a risk-off mindset.
The US-Iran war saw further escalation on the day as Iran struck Amazon facilities in Bahrain in response to US strikes, while the Strait of Hormuz oil route remained closed.
As a result, WTI crude oil prices reached their highest levels in over a month, nearing $85 per barrel.
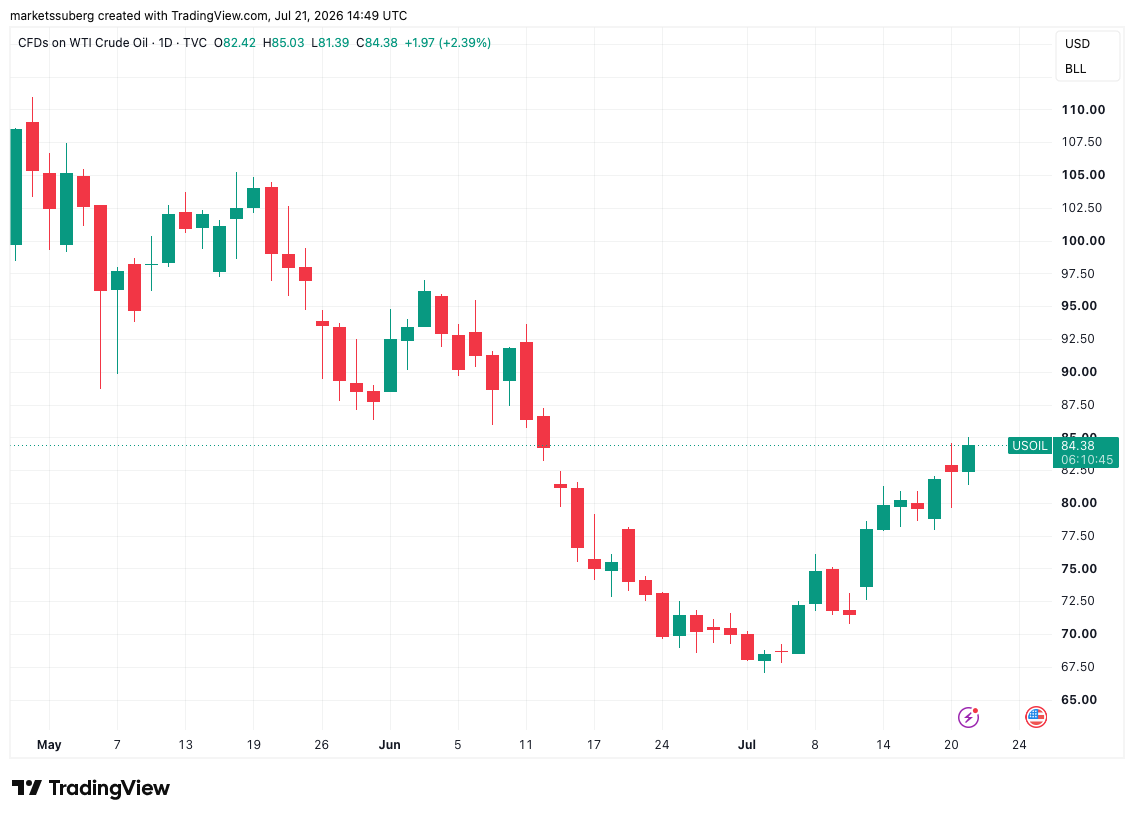
CFDs on WTI crude oil one-day chart. Source: Cointelegraph/TradingView
Multiple media reported US president Donald Trump plans to introduce new 10% international trade tariffs. These would follow 50% measures imposed on Canada this week.
Despite these notional headwinds for crypto and risk assets, traders attributed the lack of bearish reactions to expectations that the situation would ultimately resolve in markets’ favor.
“Markets are pricing in peace,” YouTube channel host Crypto Rover summarized in a post on X to their 1.6 million followers.
Caleb Franzen, creator of Bitcoin and macro analysis resource Cubic Analytics, was confident about the near-term trend in the S&P 500 index.
“I reiterate… I have zero fear, concern, or worry with S&P 500 futures looking like this,” he told X followers on Monday.
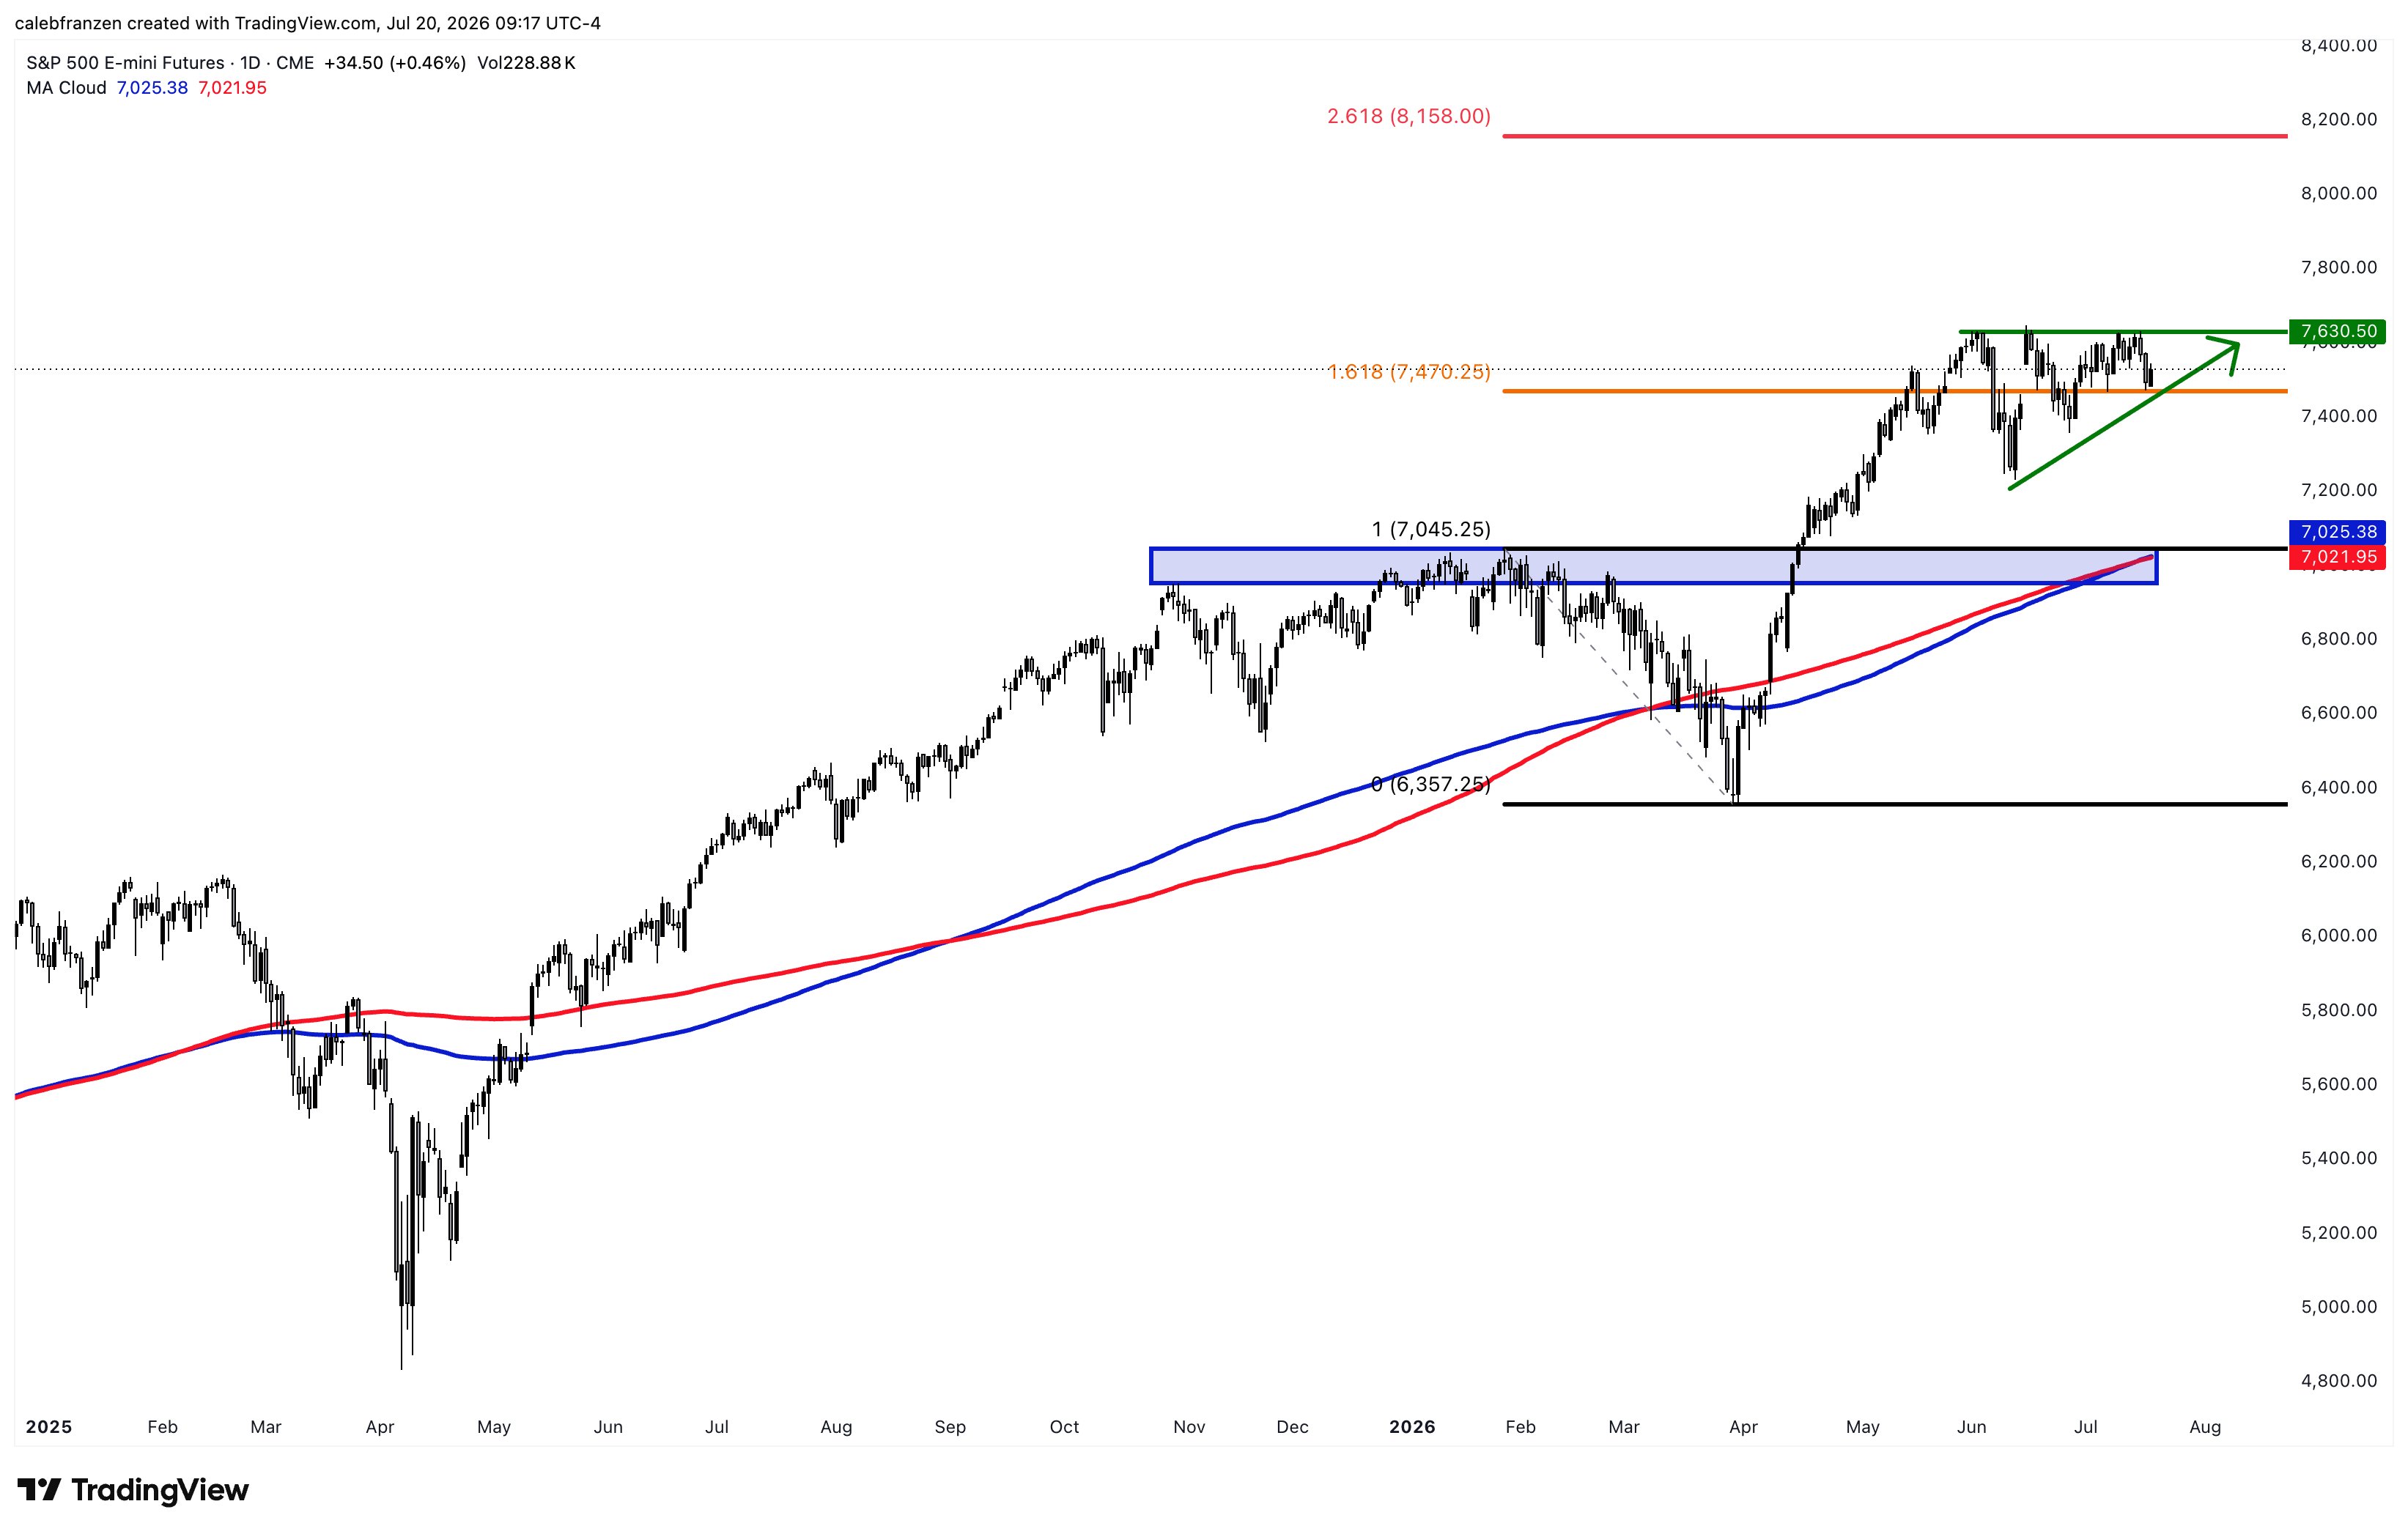
S&P 500 futures one-day chart. Source: Caleb Franzen/X
To be sure, words of caution came from figures such as JPMorgan CEO, Jamie Dimon, who warned that markets were treating current risks too lightly.
BTC price needs 21-week trendline reclaim: Analyst
While some traders looked for a retest of levels up to and including $70,000, Keith Alan, cofounder of trading resource Material Indicators, was conversely cautious on the BTC price outlook.
Related: Trader maintains $67K BTC price target: Five things to know in Bitcoin this week
Despite a “golden cross” involving the 21-day and 50-day simple moving averages (SMAs) on Monday, the bear market, he warned, had gone nowhere.
“Bear Markets don’t always look like Bear Markets, especially in lower timeframes,” he wrote in his latest X analysis.
“The macro trend will be challenged if Bitcoin pushes above the 21-Week SMA. Until that happens, the Bear Market remains intact.”
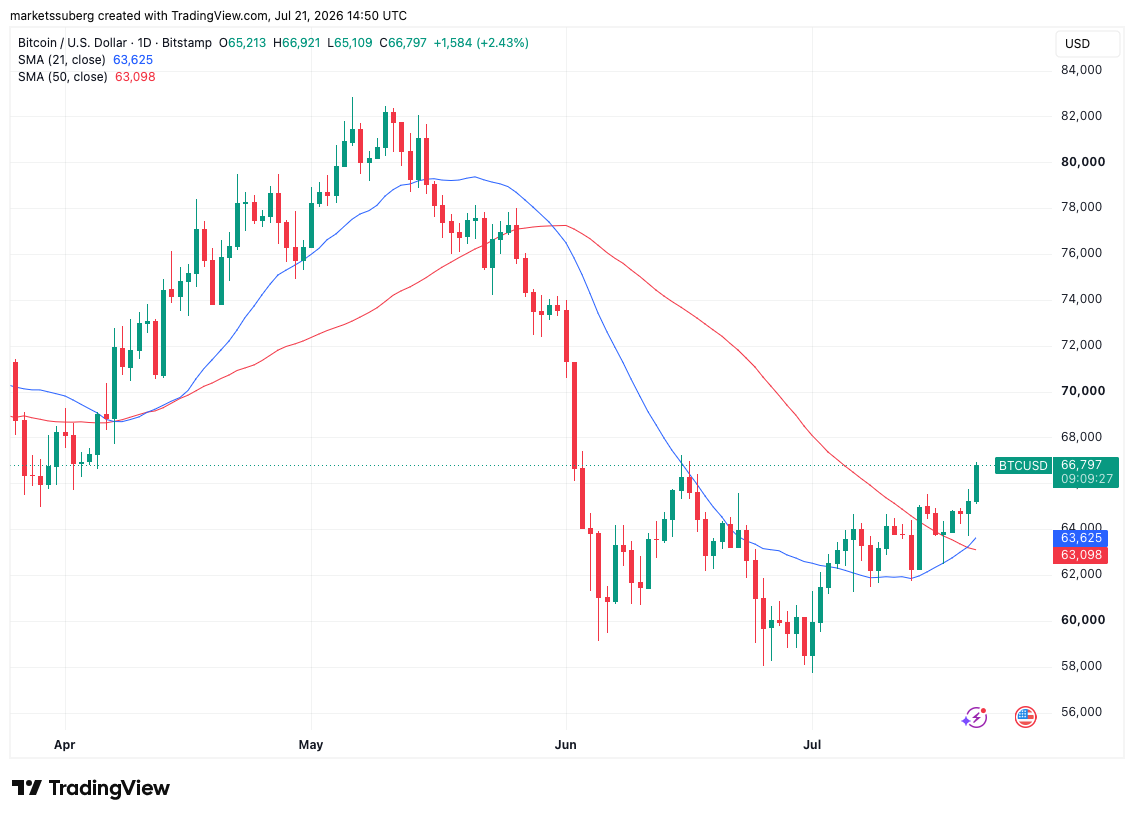
BTC/USD one-day chart with 21-week, 50-week SMA.
Source: Cointelegraph/TradingView
The 21-week SMA stood at $69,720 at the time of writing, coinciding with Bitcoin’s then-all-time high from 2021.
Alan acknowledged that there was “no real resistance” until $67,250.

Speculative activity in the Bitcoin market is showing signs of recovery even as spot market participation remains subdued, according to Glassnode’s latest findings.
The analytics firm said spot trading activity continues to lack conviction, as Spot Volume fell below the lower statistical band of $4.5 billion, which was indicative of persistently weak liquidity and muted investor participation. Such low trading volumes typically accompany periods of consolidation, where markets struggle to build enough momentum for a decisive breakout.
At the same time, Spot Cumulative Volume Delta (CVD) showed that aggressive taker selling has eased compared to the previous week. Although the metric remains in negative territory, the narrowing deficit signals that sellers are becoming less aggressive. The reading is now sitting comfortably within its statistical range as traders reassess their market direction.
While spot markets remain quiet, derivatives data points to a gradual return of speculative appetite.
Derivatives Activity Picks Up
Futures Open Interest, for one, has climbed to $32 billion. Glassnode said the steady increase indicates traders are gradually re-establishing leveraged positions, which has led to higher participation across the futures market.
Long-Side Funding Payments, however, have declined to $1.7 million and are now close to the upper statistical threshold. According to the report, this suggests bullish positioning is still dominant, but traders are paying a smaller premium to maintain long positions. This means that aggressive bullish conviction has moderated compared to recent sessions.
Meanwhile, Perpetual CVD has recovered sharply and has reversed from a net selling bias to a positive $123.2 million. The move into positive territory points to a shift in taker behavior, as aggressive buyers are now exerting greater influence on price action than sellers.
Options Positioning Shifts
Activity in the options market has also strengthened. Options Open Interest rose to $30 billion, as capital committed to derivatives positions increased, although the figure remains slightly below the lower statistical band of $30.3 billion. Glassnode said the trend suggests traders are actively opening new positions. This potentially raises the chances of volatility around major options strike prices.
Simultaneously, the Volatility Spread has narrowed sharply and now sits comfortably within its statistical range, which indicates that implied volatility has largely aligned with realized market movements and that options traders are demanding a smaller risk premium.
This trend was also evident in the Options 25-Delta Skew, which has retreated significantly amidst weaker demand for protective put options and a moderation in bearish hedging activity as sentiment becomes more neutral.
The post Bitcoin’s Spot Market Remains Sluggish, but Derivatives Tell a Different Story appeared first on CryptoPotato.
Ether (ETH) is back under fresh pressure from leveraged traders after a sharp push toward the $1,950 area. Tuesday’s uptick helped trigger around $62 million in liquidations tied to bearish positions, as ETH rose roughly 29% from its June 26 low near $1,500 and briefly tested $1,950 for the first time in about seven weeks.
The price move also mirrored a broader improvement in risk appetite. Bitcoin climbed above $66,500, while US equities strengthened after investors reassessed concerns about stretched valuations following the rapid rally in artificial intelligence-related shares.
Key takeaways
- ETH’s breakout attempt near $1,950 came with meaningful leverage-driven liquidations, signaling traders were positioned for downside.
- Ethereum’s fundamentals are not keeping pace: DApp revenues and weekly DEX volumes remain weak versus prior months.
- Record staking participation (34% of ETH supply, per StakingRewards) may dampen sell pressure, but it hasn’t yet translated into stronger onchain demand.
- Derivatives indicators are less bearish than late June, yet ETH perpetual funding has struggled to stay in the typical neutral band.
- Next week’s catalysts from major US tech earnings could determine whether the market’s optimism extends to crypto.
Price rally meets uneven participation across Ethereum
Despite the renewed bullish momentum, Ethereum’s activity metrics suggest caution. The network’s onchain data points to a market that is moving more because of broader sentiment than because usage is clearly re-accelerating.
According to DefiLlama, weekly revenue generated by Ethereum decentralized applications (DApps) fell to $9.8 million—the lowest level since September 2024. That matters because DApp revenue is often seen as a proxy for real demand and user willingness to pay for services, while price strength alone can be driven by derivatives positioning and macro flows.
DefiLlama data also shows decentralized exchange (DEX) volumes sliding to about $7.2 billion per week. In that environment, traders appear to be less enthusiastic about the kinds of high-turnover assets that typically boost activity, including memecoins and certain utility tokens.
The revenue picture is similarly mixed among top applications. DefiLlama notes that some prominent projects have been under pressure on the year, with losses of 50% or more year-to-date reported for tokens including Ethena (ENA), Mantle (MNT), and Arbitrum (ARB). While individual performance doesn’t automatically determine Ethereum’s direction, broad weakness in major ecosystems can limit organic demand during upswings.
Derivatives coolness suggests traders aren’t fully convinced
ETH’s rally has been accompanied by shifts in derivatives sentiment, but not a decisive reset to confident positioning. Laevitas data indicates that the annualized funding rate on ETH perpetual futures has had trouble remaining consistently in a “neutral” 6%–12% range during the past month.
That is an important nuance: when funding stays near neutral, it often indicates more balanced long and short demand. When funding persistently drifts away from that zone, it can suggest one-sided positioning that raises the risk of reversals.
Still, sentiment has improved compared with late June, when funding rates turned negative and reflected stronger bearish demand. The improvement aligns with expectations that staking activity could help reduce downside exposure.
Staking hits a new participation record, but the market still wants catalysts
A key support factor for ETH’s structure has been staking. StakingRewards data shows that a record 34% of the total ETH supply is now staked, up from 33% just one month earlier. In practical terms, higher staking participation can reduce the amount of liquid ETH available for selling, which may lower immediate sell pressure during price rebounds.
The staking narrative is reinforced by continued institutional accumulation activity. The article’s source references Tom Lee’s Bitmine Immersion (BMNR US), which reportedly added 156,719 ETH over the past month, bringing its stake to 4.8% of available supply. Separately, earlier coverage from Cointelegraph highlighted Bitmine’s Ethereum staking generation, underscoring how large holders are positioning through staking rather than liquid trading.
Even so, staking participation alone may not be enough to sustain an upswing if onchain demand remains subdued. The same onchain picture that shows low DApp revenue and declining DEX volumes also helps explain why the derivatives market hasn’t fully “opened the throttle” for longs. In other words: the capital on the sidelines may be more willing to absorb downside than to chase upside.
ETH is also still far from its August 2025 all-time high—reported as 61% below that peak—which can weigh on risk appetite. Traders may remain reluctant to pile in until they see clearer evidence that activity and demand are broadening beyond a macro-driven bounce.
Earnings from US megacaps could influence whether ETH breaks higher
Ether’s ability to extend gains toward the next major psychological level—often framed as $2,100—likely depends on whether risk appetite stays elevated across both traditional markets and crypto. On Tuesday, the immediate backdrop was favorable: stock strength helped ease concerns tied to valuation worries after a fast-moving AI-driven rally.
Looking ahead, the market will be watching corporate results for cues on whether the “risk-on” trend can persist. The report points to 3M Company’s (MMM) earnings after Tuesday’s open as part of the early week catalyst calendar. More importantly for the crypto complex, it also highlights Alphabet’s earnings scheduled for Wednesday after US markets close.
Investors are reportedly focused on cloud services growth, with expectations cited as 64% growth in cloud revenue, amid heavy AI investment. If results and guidance reinforce a stable macro backdrop, it could help restore confidence across risk assets—potentially giving ETH the additional momentum it needs to test higher levels without relying primarily on liquidation-driven moves.
For traders and long-term observers alike, the next signals to watch are straightforward: whether ETH can hold above the recent breakout zone after the liquidation wave, whether DEX volumes and DApp revenue continue to stabilize instead of drifting lower, and whether derivatives funding moves back toward a more sustainably neutral range as macro catalysts land.


BIS researchers have found that dollar-backed stablecoin inflows across more than 130 economies remain largely unaffected by capital controls, exposing a growing challenge for emerging-market governments.
Summary
- BIS found stablecoin inflows remain largely unaffected by capital controls across more than 130 economies.
- Dollar-backed tokens are expanding in emerging markets facing inflation, weak currencies and limited foreign exchange access.
- Nigeria and Latin America show growing stablecoin use for remittances, trade settlement and cross-border payments.
The BIS study compared stablecoin inflows with foreign-currency bank deposits to examine how households and businesses gain exposure to the U.S. dollar during periods of financial stress. Both forms of dollarization increased alongside sovereign crises, banking problems and strong exchange-rate pass-through, but only traditional deposits responded clearly to restrictions on foreign currency and capital flows.
Unlike bank deposits, dollar-pegged tokens can move through crypto exchanges, peer-to-peer markets and self-hosted wallets without passing through domestic banks. According to the researchers, this difference likely exists because “stablecoins are partly circulating outside the regulatory perimeter.”
The results indicate that restrictions designed for bank accounts may have limited influence over digital tokens. While governments can require approval for foreign-currency deposits or restrict transfers through financial institutions, users can still receive, hold, and send stablecoins through blockchain networks.
Researchers also found that deposit and stablecoin dollarization tend to persist once established. Their analysis showed little evidence that users simply replace foreign-currency deposits with stablecoins, suggesting the two channels can expand at the same time instead of competing for the same demand.
Capital controls are failing to contain stablecoin demand
Dollar-pegged tokens could weaken monetary sovereignty if households and companies increasingly store or transact in U.S. dollars outside regulated banks, the BIS study warned. The risk is more pronounced in emerging and developing economies where inflation, currency depreciation or restricted access to foreign exchange makes dollar assets attractive.
Capital controls have historically reduced some forms of deposit dollarization because banks must enforce domestic rules. Stablecoin inflows, however, were broadly similar in economies with and without such restrictions, according to the BIS.
Digital tokens have bearer-like features and can be transferred through unhosted wallets, making complete enforcement difficult. The BIS Annual Economic Report 2026 noted that blocking domestic intermediaries from handling unapproved stablecoins may limit some transactions, but such measures are likely to remain imperfect.
Despite the concern over monetary sovereignty, the study found little evidence that moderate deposit dollarization materially weakens monetary-policy transmission. Economies with higher foreign-currency deposits did, however, show a somewhat higher risk of elevated inflation.
Stablecoins may present different policy problems because their use can extend beyond savings into payments, trade settlement and remittances. As transactions leave the banking system, authorities may also lose access to information normally collected by regulated financial institutions, limiting their view of capital movements.
The BIS findings suggest policymakers may require controls designed for blockchain-based assets rather than relying only on rules created for bank deposits. Any response would need to account for foreign exchanges, peer-to-peer transfers and self-hosted wallets, all of which can keep activity outside domestic financial channels.
Emerging markets are driving stablecoin payment adoption
Nigeria illustrates how economic pressure can push stablecoins into daily financial activity. The International Monetary Fund found that stablecoins accounted for more than 65% of the country’s cross-border crypto inflows in 2024, with total inflows approaching the value of recorded remittances by 2025.
According to the IMF, Nigerian households use USDT and USDC for family remittances, crypto investments and access to dollar-denominated value. Small and medium-sized importers have also used the tokens to pay foreign suppliers, while some large companies have tested them for trade settlement.
Inflation, naira depreciation and limited access to foreign currency made stablecoins more attractive during 2023 and 2024, the IMF reported. When the Central Bank of Nigeria restricted banks from serving crypto users in 2021, activity moved toward less regulated peer-to-peer markets instead of disappearing.
Stablecoins can cut payment time and reduce dependence on correspondent banks, according to the IMF. However, the institution warned that heavy use of dollar tokens could lower demand for the naira and move more transactions beyond the reach of Nigerian regulators.
A similar pattern has emerged in Latin America. Bitso Business reported an 81% year-over-year increase in stablecoin payment volume during the first half of 2026. The company also found that Tether’s USDT and Circle’s USDC represented 40% of regional crypto purchases in 2025, overtaking Bitcoin for the first time.
Across the crypto market, stablecoin capitalization has risen to about $309.7 billion from roughly $260 billion a year earlier. The increase gives dollar-backed tokens a larger role in payments and savings while adding urgency to the regulatory concerns identified by the BIS.
BIS research has also separated privately issued stablecoins from tokenized bank money. Through Project Agorá, eight central banks and more than 40 regulated institutions have tested cross-border settlement using tokenized commercial-bank deposits and central-bank reserves, according to the institution’s 2026 report.
That model keeps tokenized payments inside a regulated two-tier banking system, while stablecoins can circulate beyond it. For policymakers, the contrast explains why existing capital controls may struggle to contain digital dollarization even as demand for faster cross-border payments continues to grow.

More MiCA-Licensed Crypto Firms Could Leave EU Market: Gate Europe CEO

Midtown Athletic Club honours its founder with 20-year community tennis and fitness initiative

Meta is testing an AI bedtime story app for people with no imagination


-
 NewsBeat5 days ago
London Mayor Sadiq Khan handed a peerage by Keir Starmer alongside 15 other Labour figures… just days before the PM leaves No10
-

 Fashion4 days ago
Weekend Open Thread – Corporette.com
-

 Politics4 days ago
The House | The City of London can help the new chancellor deliver growth in every postcode
-

 Politics7 days ago
Young campaigners urge incoming PM to act on outdoor junk food ads
-
 Crypto World5 days ago
Two July Windows Left: The CLARITY Act’s Senate Fight and What Failure Means
-

 Crypto World6 days ago
CFTC blocks Kalshi from unwinding Michigan trades after court order
-
 Crypto World4 days ago
Ripple Payments Joins MiCA With 14 Firms, Does It Mean Anything For XRP?
-

 Business6 days ago
Nvidia Stock Slips After Big Tuesday Rally as Huang Confirms Vera Rubin Chip Is Now in Production Today
-

 Politics2 days ago
Democrats look to World Cup watch parties to register thousands of voters
-
 Entertainment6 days ago
Disney’s Most Ambitious Failed Star Wars Attraction Is Coming to SDCC
-

 Crypto World4 days ago
Ripple wins EU-wide access as ESMA adds it to MiCA register
-

 Crypto World16 hours ago
Grayscale Files For Worldcoin ETF, WLD Registers Sharp Rise
-

 Crypto World5 days ago
Injective Submits SEC Transfer-Agent Registration to Onchain Ownership Records
-

 Business6 days ago
Palantir Shares Rise After Expanded Nvidia Partnership and Fresh Analyst Upgrades Ahead of Earnings Day
-
 Tech1 day ago
Sail Virtually Aboard The “Itanic” With IA-64 Emulator
-
 Tech22 hours ago
Turtle Beach Command Series KB7 review: a nifty screen-equipped gaming keyboard
-

 NewsBeat5 days ago
Registration is now open for March for Men with Kev 2026
-

 NewsBeat2 days ago
Unregistered fitter used Gas Safe logo on business flyers
-
 Sports6 days ago
New Cornerback Enters Vikings Trade Rumor Mill
-

 News Videos5 days ago
Money | Class 12 Economics | CBSE Board Exam 2026-27
You must be logged in to post a comment Login