

Crypto World
Crypto isn’t the Problem with the US Economy, Says Senator
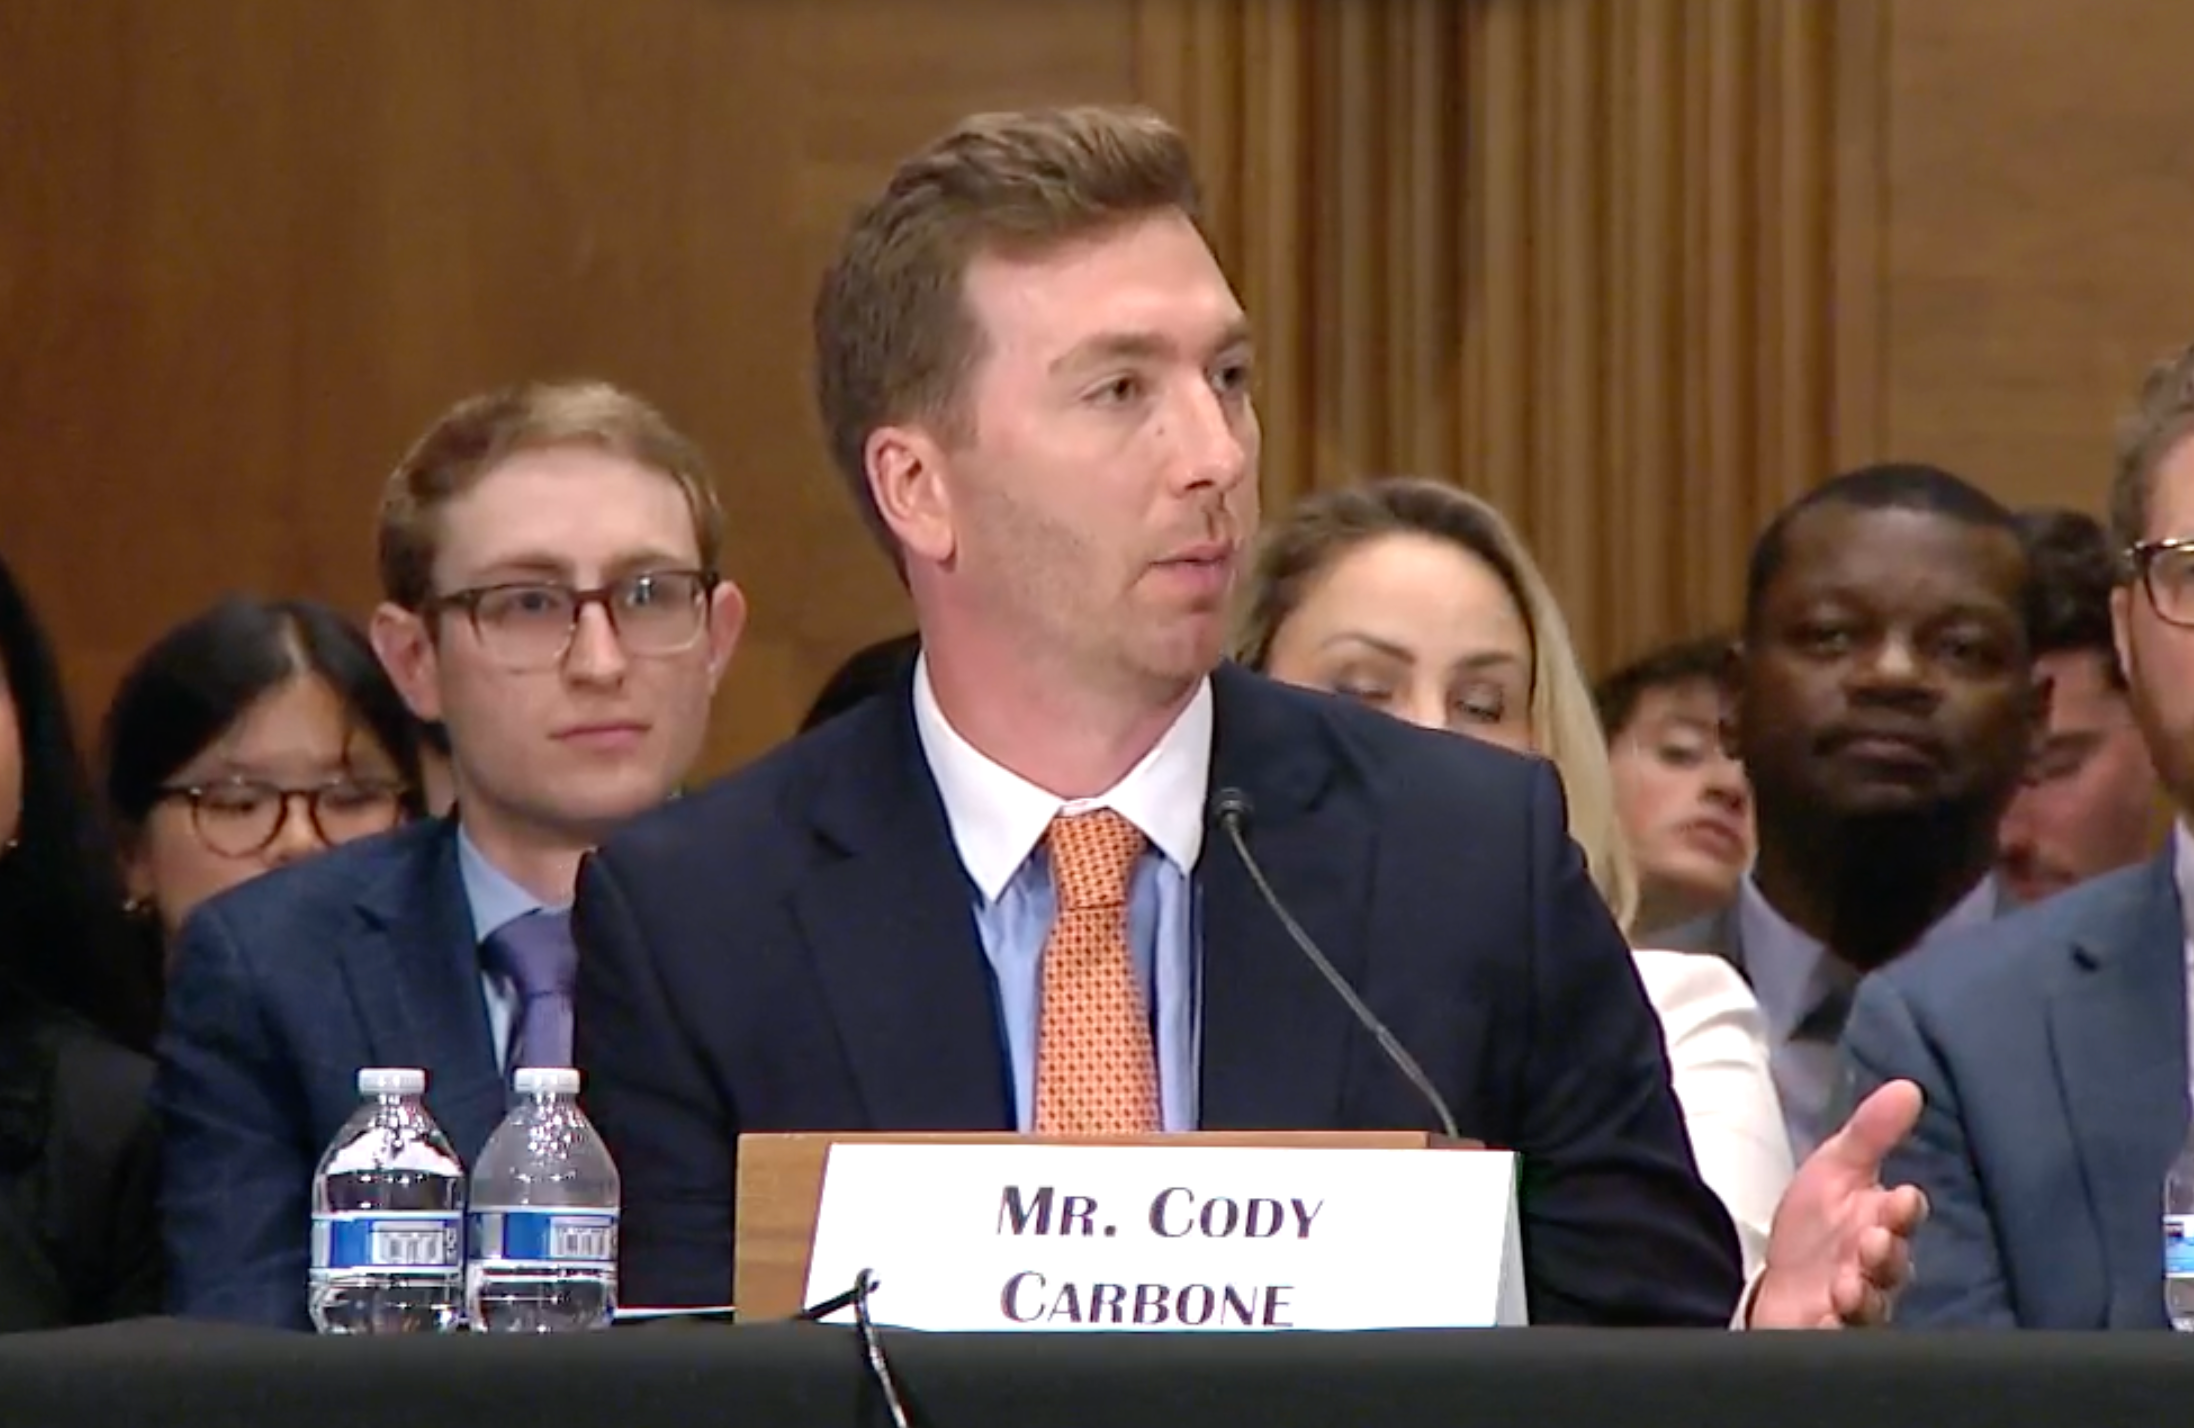
Cody Carbone, CEO of the cryptocurrency advocacy group The Digital Chamber, received a largely muted response to his testimony at a Senate Banking Committee hearing on affordability.
In a Tuesday hearing titled The Affordability Agenda, Carbone said that the digital asset industry could help solve affordability problems in the United States, including through faster and cheaper transactions, putting “competitive pressure” on existing payment systems, and reducing barriers to “owning and transferring assets.”
However, the majority of lawmakers present did not question Carbone directly or inquire about digital assets, with the exception of Indiana Senator Tim Banks and Louisiana Senator John Kennedy. Banks asked the Digital Chamber CEO about the costs related to foreign remittances compared to US dollar-pegged stablecoins, while Kennedy largely dismissed Carbone’s testimony.
“Mr. Carbone, you seem to be here to promote cryptocurrency,” said Kennedy. “I love cryptocurrency, but I don’t think that’s the problem with our economy.”
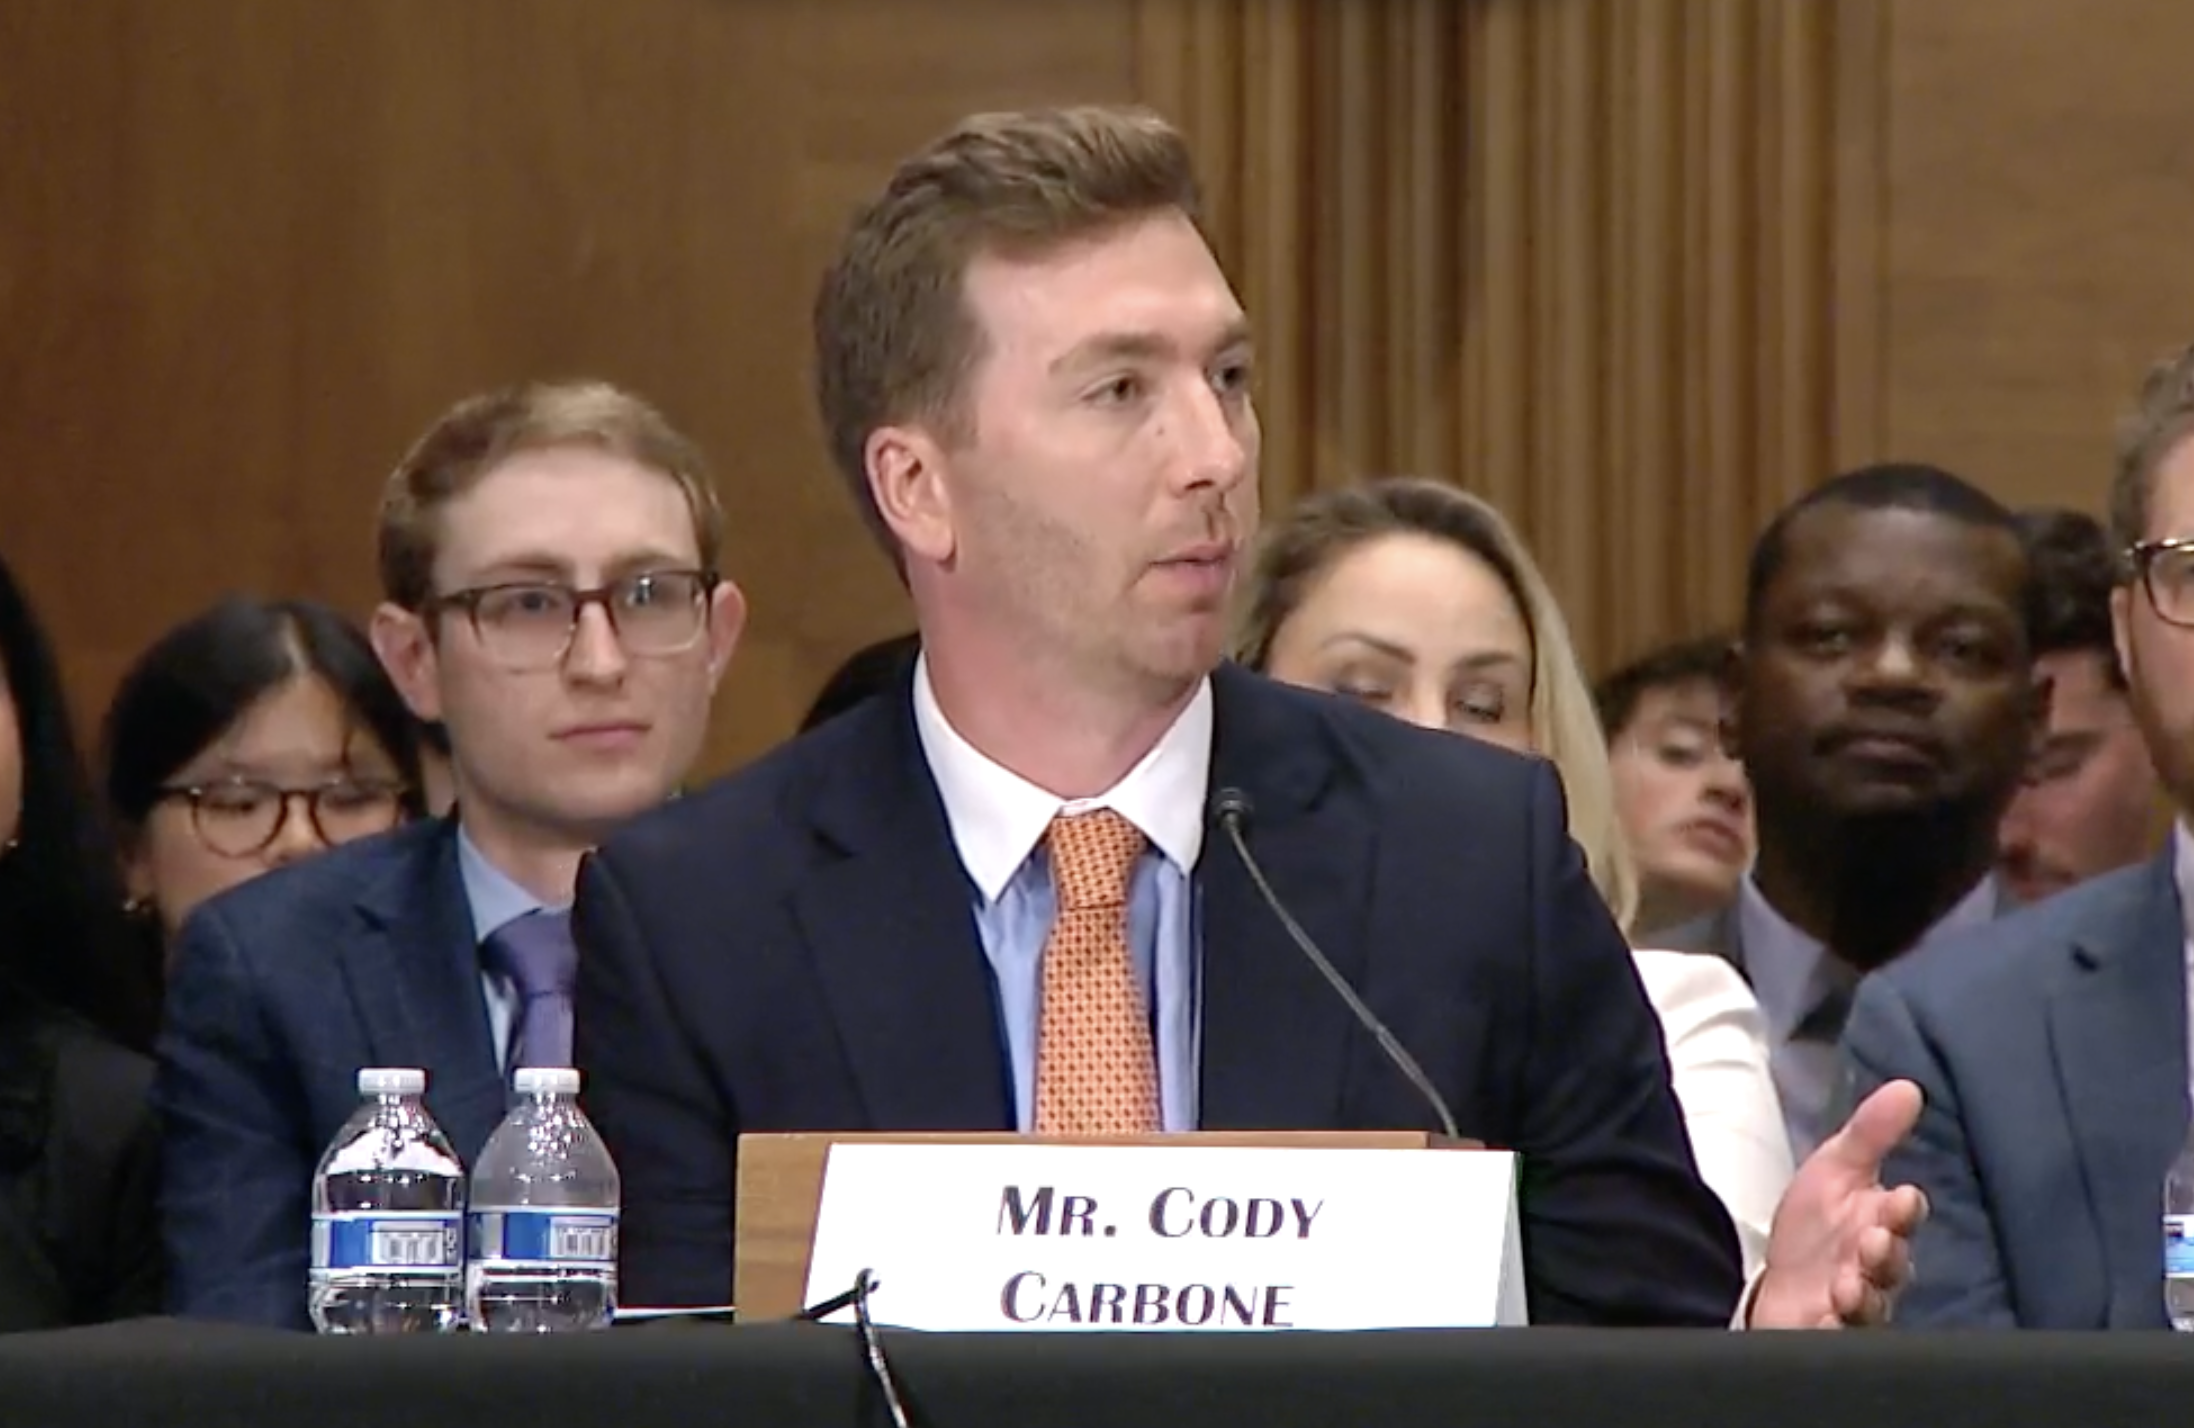
The Digital Chamber CEO Cody Carbone speaking on Tuesday. Source: Senate Banking Committee
Carbone’s remarks centered around the US Senate moving forward on the Digital Asset Market Clarity (CLARITY) Act, which the banking committee advanced in May. The full chamber is expected to vote on the legislation in a matter of weeks, but many lawmakers are calling for additional ethics provisions, potentially complicating passage in the Senate.
Related: Crypto lobby urges Congress to pass staking and mining tax bill as is
CLARITY Act still in limbo amid pushback from interest groups
In addition to lawmakers’ concerns about ethics in the crypto market structure bill, last week gambling industry groups called for the Senate to clarify that the legislation would not allow the US Commodity Futures Trading Commission (CFTC) to oversee sports betting in prediction markets. The financial regulator, under Chair Michael Selig, has claimed “exclusive jurisdiction” over platforms such as Kalshi and Polymarket.
Some lawmakers expect that the CLARITY Act will pass through the Senate before the chamber breaks for an August recess. As of Tuesday, no floor vote was scheduled in the Senate.
Magazine: Japanese pension fund tips 1% in crypto, G7 urges action on NK hackers: Asia Express


The bitcoin market has found a new support level, and Thursday’s U.S. core PCE release may test its mettle.
That level is $59,000, which has emerged as strong support, capping downside moves in recent days.
A support level in trading is a specific price point or range where a downtrend tends to pause or reverse, paving the way for a bounce as concentrated buying interest becomes strong enough to counter selling pressure. However, a single instance does not make a level a strong support. Traders typically look for at least two instances of price holding or bouncing from a specific level before identifying it as new support.
On Wednesday, as the sell-off gathered pace, prices fell to nearly $59,000 before bouncing back to $61,000 overnight. As of this writing, BTC is trading near $60,800, according to CoinDesk data. A similar move occurred earlier this month on June 5, when the sell-off lost steam near $59,000, paving the way for a bounce to $67,000 in the following days.
That explains why $59,000 is now the key support, a new line in the sand that bulls need to defend to avoid a deeper slide.
Ripple has launched its dollar-backed stablecoin Ripple USD (RLUSD) in Japan with SBI Group, following approval from the country’s Financial Services Agency.
Customers can now access RLUSD through SBI VC Trade’s VCTRADE platform. The rollout opens the regulated token to both institutional and retail users in Japan.
Ripple Opens RLUSD to Japanese Users
Japan reshaped its stablecoin rules this month. A new framework took effect on June 1, letting qualifying foreign stablecoins operate as regulated payment tools.
Under the rules, foreign-issued stablecoins are classified as electronic payment instruments under the Payment Services Act. RLUSD is also categorized as a new type of instrument under the Act.
Ripple’s Senior Vice President of Stablecoins, Jack McDonald, said RLUSD will act as a bridge for payments, tokenization, and collateral management. He framed it as a link between Japanese businesses and global liquidity.
“Japan has long been a leader in digital asset adoption, underpinned by both regulatory clarity and financial innovation. This launch marks an important step in expanding access to transparent, regulated USD-backed stablecoins like RLUSD for financial institutions, consumers, and businesses in Japan,” McDonald said.
Follow us on X to get the latest news as it happens
The launch fulfills a memorandum of understanding signed in August 2025. It also builds on a Ripple and SBI partnership that dates back to 2016.
The deal reflects SBI’s broader XRP push nationwide. Ripple’s wider Japan footprint also grew this year, with XRP gaining a spot listing on Rakuten Wallet.
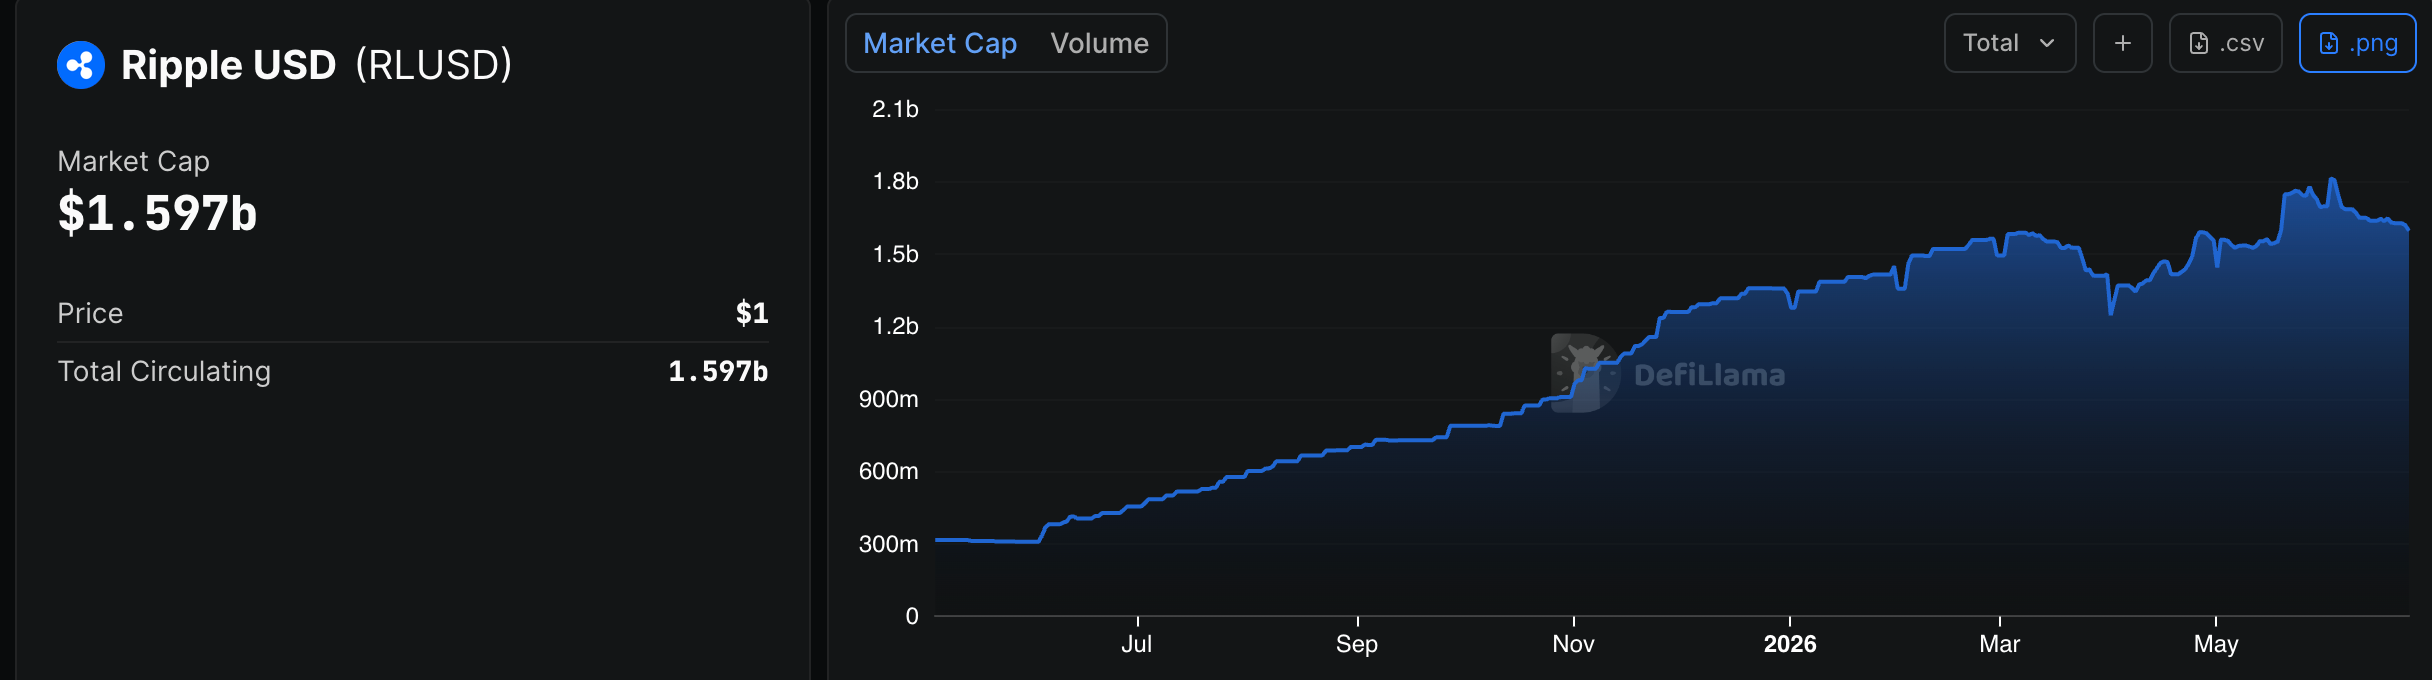
Meanwhile, the stablecoin has cooled since its early-June peak. Its market cap hit an all-time high of $1.8 billion then, but has since slipped to about $1.59 billion, according to DeFiLlama data. Even so, the market cap remains up roughly 271% over the past year.

The Japan entry follows RLUSD’s global expansion into other regulated markets. The coming months may show whether RLUSD can challenge incumbents in Japan’s regulated stablecoin market.
Subscribe to our YouTube channel to watch leaders and journalists provide expert insights
The post Ripple Targets Japanese Payments and Tokenization With New RLUSD Launch appeared first on BeInCrypto.


The pressure on crypto has become its own. The break below $60,000 reflects continued outflows from U.S. spot bitcoin ETFs, the Federal Reserve’s hawkish turn and a U.S. dollar that climbed to a seven-month high, said Alex Kuptsikevich, chief market analyst at FxPro, in an email to CoinDesk.
A stronger dollar makes dollar-priced assets like bitcoin costlier for foreign buyers and tends to pull money out of risk trades.
FxPro also flagged a longer-term warning. Bitcoin is hovering near its 200-week moving average, the average price over the past roughly four years and a closely watched long-term trend line.
The last three times bitcoin sank to that line, the weakness was prolonged rather than brief, lasting around nine months in 2015, six months in 2018 and roughly six quarters after the 2022 collapse. The firm said the pattern points to a crypto winter, an extended stretch of depressed prices, rather than a quick rebound.
For now, Kuptsikevich sees a band around $61,800 to $62,000 as the next test, a cluster of resting orders that could either pull the price up as short sellers are forced to buy back, or cap the bounce as resistance.
If support breaks, he said, $55,000 is a plausible cycle low. He urged traders to treat risk management as the priority rather than chase direction.


Abracadabra has started emergency measures after Magic Internet Money, its dollar-pegged MIM stablecoin, slid sharply below its $1 target.
Summary
- MIM’s 50% slide pushed Abracadabra into emergency rate hikes across active and deprecated Cauldron markets.
- Borrowers now have a cheaper repayment window as Abracadabra tries to shrink outstanding MIM supply.
- Paused Curve bribes and incentives show the protocol is shifting from growth rewards to stabilization.
The DeFi lending protocol said it was “acutely aware” of the depeg and would act to reduce the amount of MIM in circulation.
The team said it would raise interest rates across all Cauldrons, including older markets that users no longer actively use. Cauldrons are Abracadabra’s lending markets, where users post collateral and borrow MIM. Higher rates make open debt more costly, which can push borrowers to repay sooner.
The rate plan covers both live and deprecated markets, so older debt positions remain part of the response. Abracadabra has not set a fixed end date for the emergency changes.
Repayment becomes the main tool
Abracadabra framed the market discount as part of its recovery route. When MIM trades far below $1, borrowers can buy the stablecoin cheaper in the market and use it to repay debt at face value. That repayment burns or removes MIM from debt positions, reducing supply.
The protocol said the current depeg creates a “natural incentive” for borrowers to repay at a discount. It also said direct incentives and Curve bribes would stop until MIM returns to its peg. That marks a shift from rewards for liquidity to a narrower focus on repayment and supply control.
Liquidity pressure hits Curve pools
MIM relies on collateral, borrower activity and liquidity pools to stay near $1. Its main trading venues include Curve pools, where stablecoins need balanced liquidity to support swaps. When liquidity thins or becomes one-sided, selling pressure can move the token further from its target.
Abracadabra had already added $100,000 of MIM, USDT and USDC to a new Curve liquidity pool earlier in June. The team said at the time that the move aimed to restore pool balance after withdrawals linked to DeFi incentive changes. The latest rate action shows that the earlier liquidity step did not fully stop pressure on the peg.
Broader stress and recovery test
Market data showed MIM near $0.50 during the latest depeg update. The break came as crypto markets also weakened. As crypto.news reported, Bitcoin fell below $60,000 for the second time in June and triggered more than $850 million in liquidations.
The MIM crisis also follows a difficult stretch for DeFi security and lending markets. In a previous article, crypto.news discussed an Abracadabra exploit in October 2025, when attackers drained about $1.8 million from Cauldrons after using a logic flaw. That event was separate from the current depeg, but it kept attention on the protocol’s risk controls.
Abracadabra said its priority was to “restore confidence, improve market structure, and return MIM to a healthy peg.” The team also said it was reviewing more recovery plans and would share them once finalized. For now, the plan centers on making debt expensive to hold and cheaper to close.
The next test will come from borrower response and market liquidity. If repayments rise, MIM supply may contract and reduce pressure on the peg. If liquidity stays thin, the stablecoin could remain exposed to sharp moves across Curve and other trading venues.
Markets track debt closures, pool balances and price spreads closely.
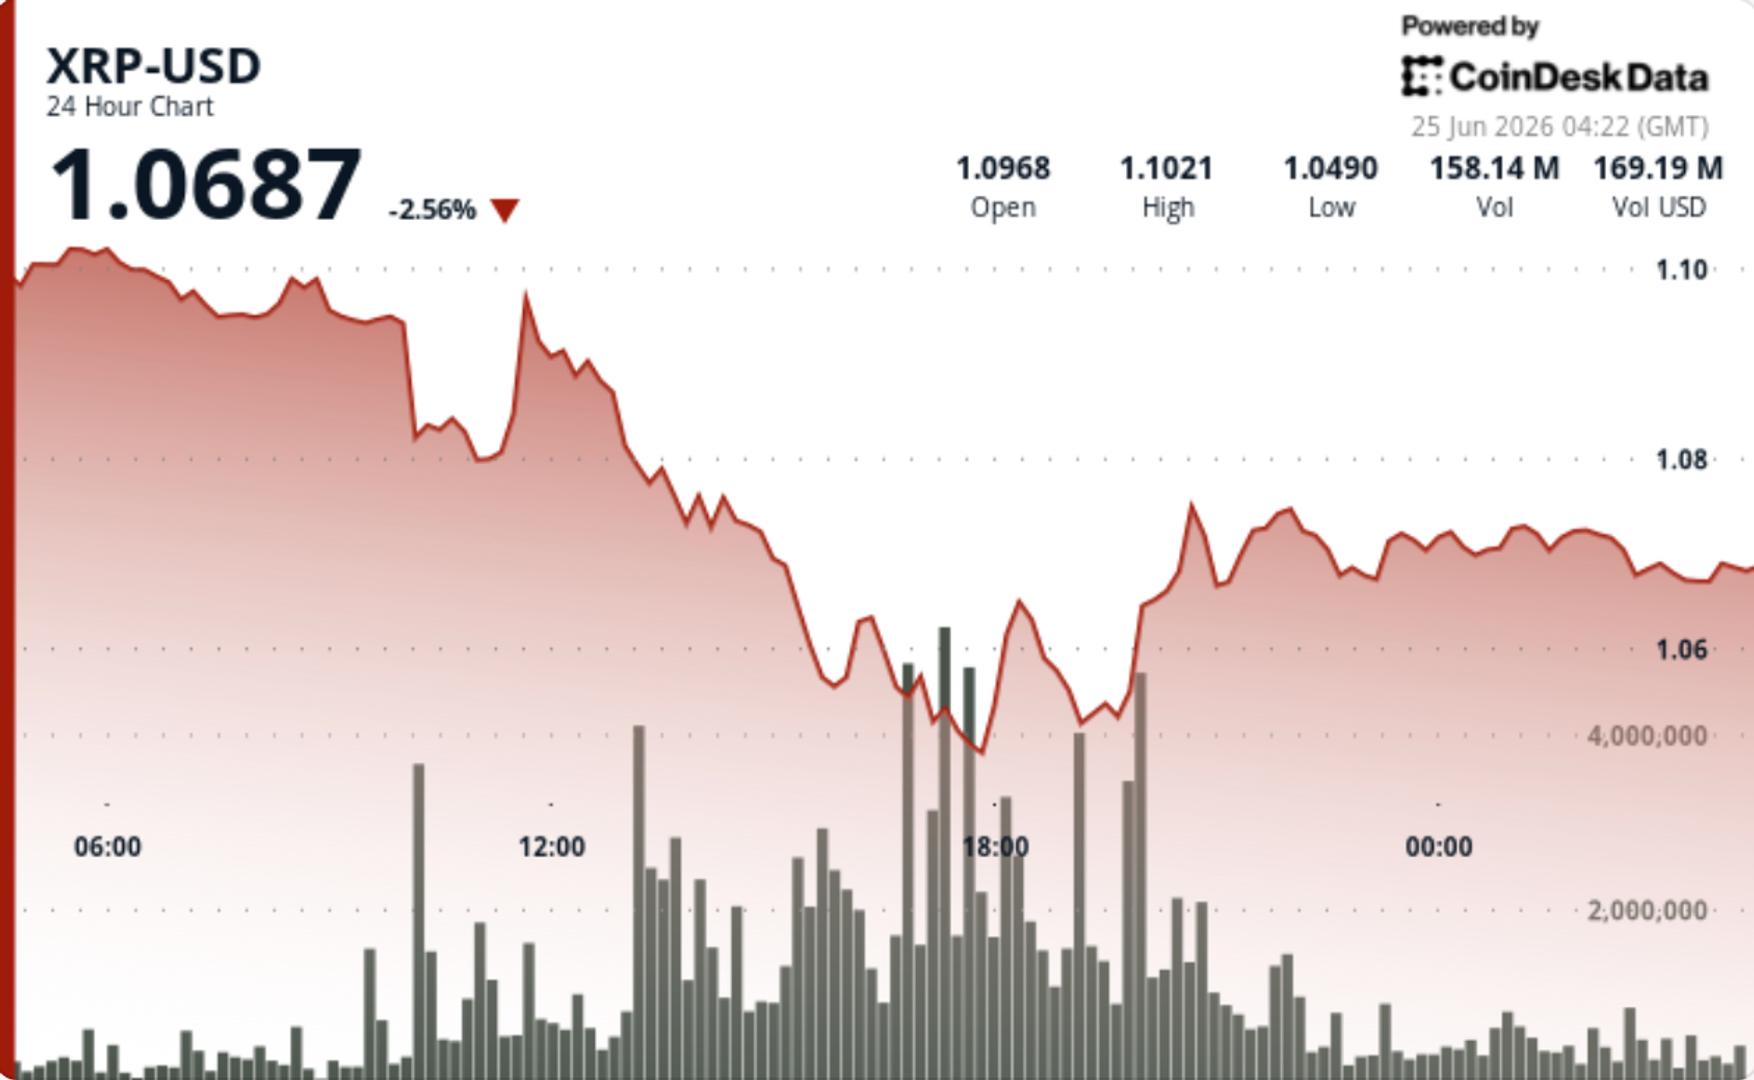

XRP lost $1.0850 during Tuesday’s selloff, then failed to win it back. That leaves the token sitting near the lower end of its June range, with buyers still defending the $1.05-$1.07 area but no longer pushing price far enough to change the tape. Every failed bounce makes $1 look a little closer.
News Background
• XRP traded lower alongside a broader crypto market pullback, with CD5 dropping nearly 3% as bitcoin and major tokens came under pressure.
• Analysts continue to frame the $1.05-$1.10 zone as a key support area for XRP, with a break below it likely shifting attention toward the psychological $1 level.
• Longer-term bulls still point to a multi-year falling wedge structure, but near-term price action remains defined by lower highs and repeated failed recoveries.
Price Action Summary
• XRP fell from $1.1020 to $1.0708 during the 24-hour session, losing 2.8%.
• The main breakdown came at 13:00 UTC, when volume surged to 117.26 million XRP and pushed price through support at $1.0850.
• Selling later drove XRP to an intraday low near $1.0446 before a modest rebound carried price back toward $1.07.
Technical Analysis
• The loss of $1.0850 shifted that level from support into resistance, leaving buyers with another overhead level to reclaim.

Ripple and SBI Group have launched Ripple USD, known as RLUSD, in Japan after approval from the Japan Financial Services Agency.
Summary
- JFSA approval now gives RLUSD a regulated Japan entry point through SBI VC Trade’s platform.
- Ripple’s stablecoin rollout targets payments, tokenization, and collateral management for Japanese users and institutions alike.
- The launch extends RLUSD’s Asia push after recent market access wins in Türkiye and beyond.
The dollar-backed stablecoin is now available through SBI VC Trade, the licensed crypto arm of SBI Group.
The launch gives both retail and institutional users access to RLUSD through the VCTRADE platform. Ripple said the approval places RLUSD under Japan’s Payment Services Act as a new type of electronic payment instrument for foreign-issued stablecoins.
As crypto.news reported, Ripple and SBI first outlined the Japan rollout in August 2025 through a memorandum of understanding. That agreement named SBI VC Trade as the local distribution partner and set an early 2026 target for market entry.
The official launch completes that plan and brings RLUSD into one of Asia’s closely regulated digital asset markets. SBI VC Trade already holds the required local license, giving Ripple a direct route to serve Japanese users under the country’s stablecoin rules.
Ripple targets payments and tokenization
Ripple has positioned RLUSD as a dollar stablecoin for payments, tokenized assets, and collateral use. The company said RLUSD has reached $1.7 billion in market value since its late 2024 launch.
Jack McDonald, Ripple’s senior vice president of stablecoins, said the launch expands access to “transparent, regulated USD-backed stablecoins” in Japan. He also said RLUSD can support payments, tokenization, and collateral management for businesses and users.
SBI VC Trade CEO Tomohiko Kondo called the rollout a “major milestone” in the long partnership between Ripple and SBI Group. He said the companies plan to expand services around RLUSD and develop more use cases for customers.
Global rollout reaches Japan
The Japan launch comes as Ripple continues to push RLUSD across markets and networks. As previously reported, Ripple made RLUSD available to institutions in Türkiye through BiLira, Bitexen, and Bitlo earlier in June.
Previously, crypto.news explored RLUSD’s expansion across more than 40 blockchain networks through Wormhole’s Native Token Transfers framework. That rollout moved RLUSD beyond its initial support on XRP Ledger and Ethereum, adding access through several Ethereum layer-2 networks.
In a previous article, crypto.news discussed Ripple’s role in tokenized finance after a tokenized Treasury settlement test on XRP Ledger. RLUSD served as part of the cash settlement layer in that broader institutional setup.
Japan has built a clear legal path for stablecoins through its Payment Services Act. That framework has attracted global issuers seeking regulated access to the market.
For Ripple, the launch adds another country to RLUSD’s global distribution map. For SBI Group, it adds a dollar stablecoin product to a platform that already serves Japanese crypto users.
The launch also extends a relationship that began in 2016, when Ripple and SBI started working on digital asset and blockchain-based finance in Japan and Asia-Pacific. Their latest step focuses on regulated stablecoin access rather than only cross-border payment rails.
RLUSD’s next test will depend on adoption from Japanese users, institutions, and businesses. The stablecoin enters Japan with regulatory approval, but usage will depend on liquidity, pricing, and demand for dollar-based digital settlement.
Bitcoin slipped to fresh two-week lows at the start of the Wall Street session on Wednesday, falling below $60,000 for the first time since June 10. The move reflects traders’ growing concern that the market is building pressure in the short term, even as many participants still frame the action as part of a broader range.
On the macro side, US stocks showed little immediate reaction to reported progress around US-Iran de-escalation efforts. Even with updated comments from President Donald Trump referencing the Strait of Hormuz route, risk assets remained largely stuck, limiting follow-through for a bullish impulse in crypto.
Key takeaways
- BTC traded below $60,000 for the first time since June 10, marking fresh two-week lows.
- Traders pointed to rising short interest and higher funding rates as reasons downside could extend before any bounce.
- A number of market commentators still expect a relief rally from lower time frames, with upside targets discussed closer to $70,000.
- US stock moves at the open were subdued despite Trump’s additional comments tied to the Strait of Hormuz.
BTC edges through $60,000 as traders watch for a low-timeframe bounce
TradingView data cited in market commentary showed BTC/USD dropping under the $60,000 level for the first time since June 10. For traders focused on intraday structure, the key question became whether this break signals a true trend change—or whether it represents a “range low” test that invites dip-buying.
Several participants suggested that conditions were becoming more conducive to a capitulation-style move. One recurring theme was the combination of rising short interest and increased funding rates, which can amplify sell pressure when leverage is positioned against the market.
Trader Killa argued that this was the time to begin looking for a bounce on lower time frames, using the “LTF” framing in his ongoing X commentary. In a separate post, he shared a chart scenario pointing to a relief move toward the vicinity of $70,000, described as something that should occur following the bounce structure he highlighted.
Another trader, RektProof, expressed a broadly similar view: Bitcoin, in his assessment, remained range-bound, with $60,000 acting as the “floor” that could hold for the remainder of the month. He added that the market could first move up to supply areas and then drop back toward “EQ lows” to set up a later sequence toward “poor highs + 70k,” keeping both the downside and the eventual rebound in play.
Why funding and positioning are getting attention
The focus on funding rates and short interest matters because it speaks to how much leverage is likely sitting on the wrong side of the move. When funding rises alongside increasing short activity, it can signal that traders are paying to maintain short exposure—or that crowded positioning is building a reflexive response if price stabilizes.
In that setup, analysts who expect a quick relief rally typically rely on a behavioral catalyst: once downside extends enough to trigger forced exits or reduce the viability of additional shorts, price can rebound sharply off the lower time frame structure. The reports from traders did not claim certainty, but they did converge on a similar near-term narrative: a downside attempt is plausible, yet a bounce from the range low is still the base case for many.
US market reaction appears muted despite Hormuz transit assurances
While crypto traders watched BTC’s chart levels, macro headlines were also in the background. According to the article’s reporting, US stocks appeared to have largely priced in relief related to US-Iran peace progress, leading to limited upside at the open.
President Trump described additional elements of cooperation on Truth Social, specifically referencing the Strait of Hormuz oil transit corridor. The post stated there would be “no tolls, no insurance costs, & no other charges of any kind being sought or received by Iran on ships traveling” via the route. Even with that detail, immediate price action in equities did not translate into strong risk-on momentum for the session.
At the time of writing in the source, the S&P 500 was up 0.4%, while the Nasdaq Composite had dipped slightly negative. This split—positive broad-market performance with a softer tech-heavy index—helped explain why the macro impulse was not strong enough to clearly lift sentiment across risk assets, including Bitcoin.
Traders also look ahead to upcoming data and earnings volatility
Crypto’s sensitivity to risk sentiment is often reinforced by scheduled economic and corporate catalysts. The earlier coverage referenced in the source highlighted factors that could keep enthusiasm restrained, including forward earnings guidance from Micron Technologies and the upcoming Personal Consumption Expenditures (PCE) index data due out on Wednesday and Thursday, respectively.
That matters because PCE is a key inflation gauge that can influence expectations for monetary policy. If inflation readings surprise, market pricing for rates can shift quickly—often affecting both equities and liquid crypto markets through broader liquidity and risk appetite channels.
For the next trading sessions, the main thing to watch is whether BTC holds the $60,000 area after this break and whether funding/positioning dynamics cool alongside any bounce attempts toward the $70,000 zone. If the market fails to reclaim support quickly, the range-low thesis may lose credibility; if it rebounds sharply, traders’ low-timeframe “relief” expectations could regain traction.
Bitcoin (BTC) is “compressed” at low levels but its classic cycles remain intact, say new research.
Key points:
- Bitcoin is acting similar to prior cycles as it circles a key four-year trend line.
- Analysis says that BTC price action is currently “compressed” as it trades below a $76,400 target.
- A new estimate put the bear market as just over 70% complete.
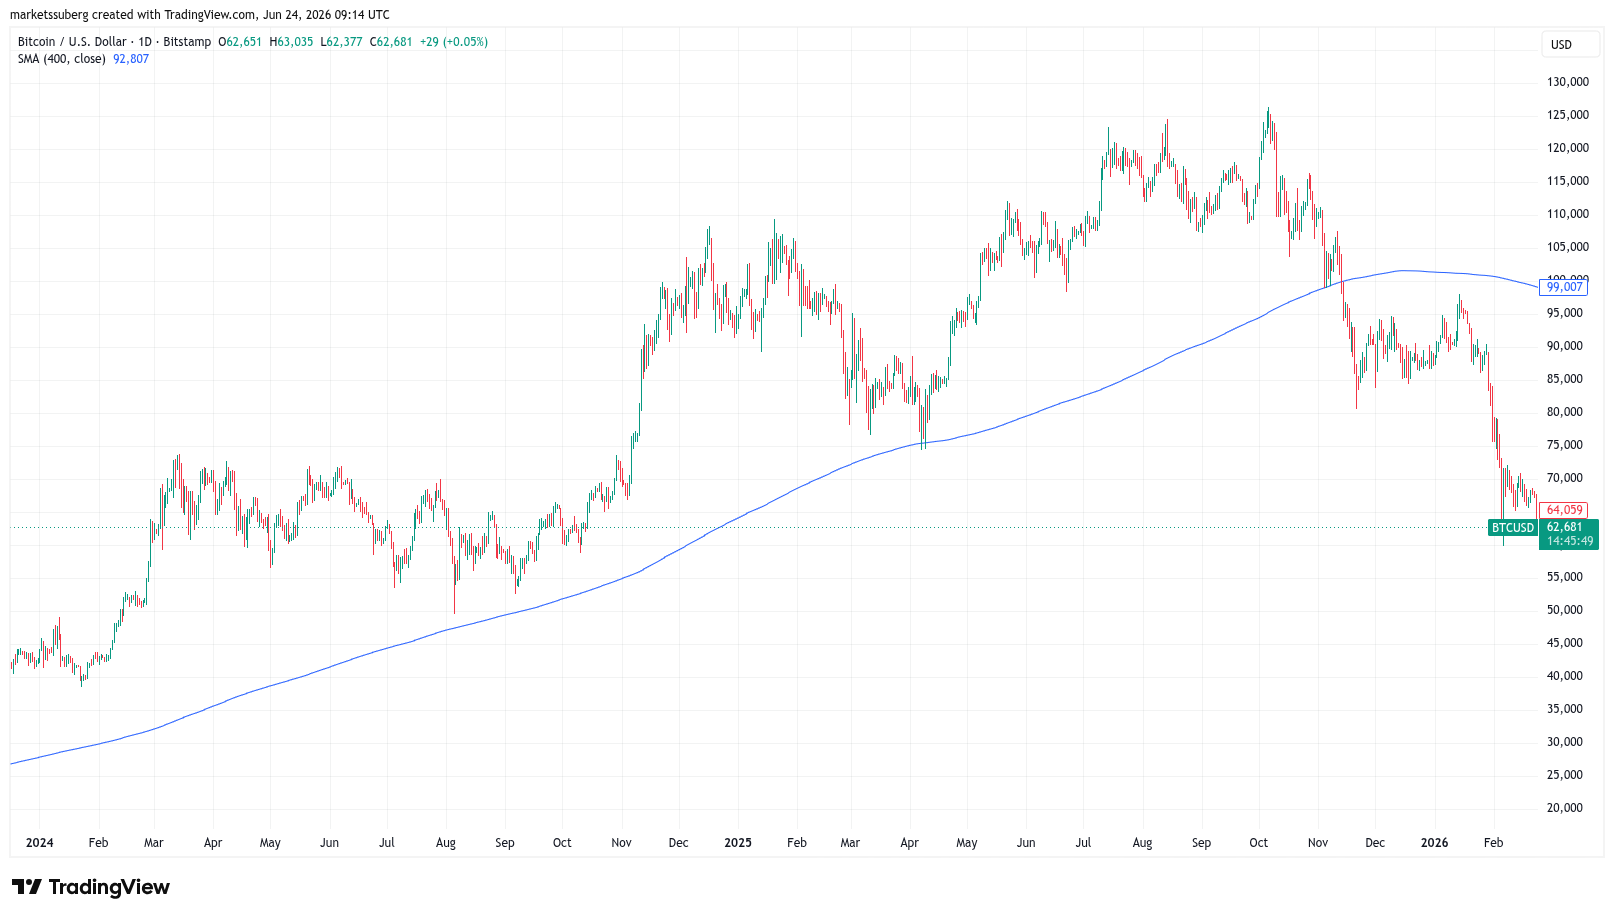
Analysis on $62,000 BTC price: Bitcoin “not broken”
In an X post on Wednesday, analyst David Eng said that BTC price action still “runs on two clocks.”
“400-day clock, $BTC looks cyclical. ~4-year clock, the cycle noise gets filtered out and the adoption structure appears,” he summarized.
Marking time for Eng are the 400-day simple moving average (SMA), as well as its four-year equivalent. The former is notable for its ability to act as support throughout Bitcoin bull markets, seeing no daily candle closes below it this cycle or last.

BTC/USD one-day chart with 400SMA. Source: Cointelegraph/TradingView
On four-year time frames, meanwhile, a cleaner uptrend emerges, with price fluctuating above and below the trend line depending on its position in the cycle.
“The point is that Bitcoin keeps stretching away from this adoption structure and then reverting back toward it,” Eng summarized.
Currently, the four-year trend line suggests a fair price of around $76,400, making BTC/USD undervalued by around 20%. A chart uploaded by Eng also shows Bitcoin’s Power Law price, this now well into uncharted territory at nearly $135,000.
“$BTC is not broken,” he concluded.
“It is compressed below its adoption structure.”
Bitcoin bear market losses could resume in August
As Cointelegraph reported, historical comparisons suggest that Bitcoin’s current bear market will continue for some months yet.
Related: US dollar strength hits highest since May 2025: Five things to know in Bitcoin this week
The latest estimates from trader and analyst Rekt Capital put the current downtrend at around 71% complete.
His analysis continues to focus on the fate of the 50-month exponential moving average (EMA), currently at $63,900.
“At this stage, if June Monthly Closes just like this at $62k then that would confirm the breakdown from the 50-Month EMA. So it July turns into a green month, then that could see price turn the 50 EMA into new resistance,” he told X followers.
“Then August would cancel out July and send Bitcoin into downside continuation.”
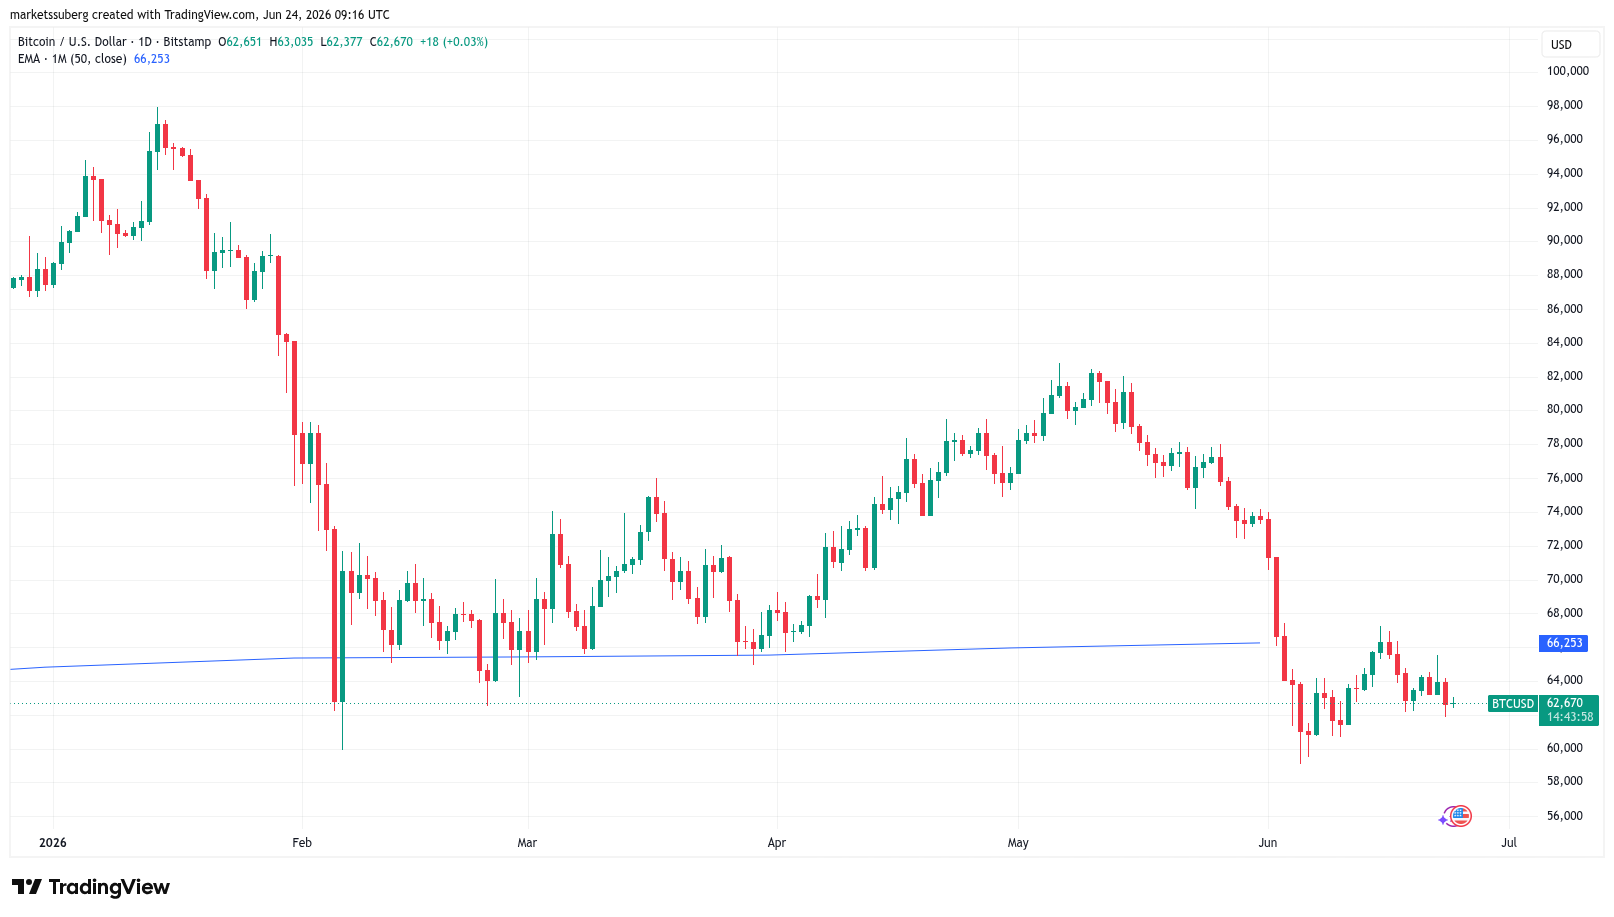
BTC/USD one-day chart with 50-month EMA. Source: Cointelegraph/TradingView
Michael Saylor’s Strategy (MSTR) is testing a technical setup that last appeared before the stock’s 99% collapse during the dot-com bubble burst in the early 2000s.
Key takeaways:
- MSTR is testing a monthly head-and-shoulders setup similar to the one that preceded its dot-com-era collapse.
- Strategy’s shrinking cash reserve and rising dividend obligations are increasing dilution risk for MSTR common shareholders.
MSTR bearish reversal pattern points to 80% downside risk
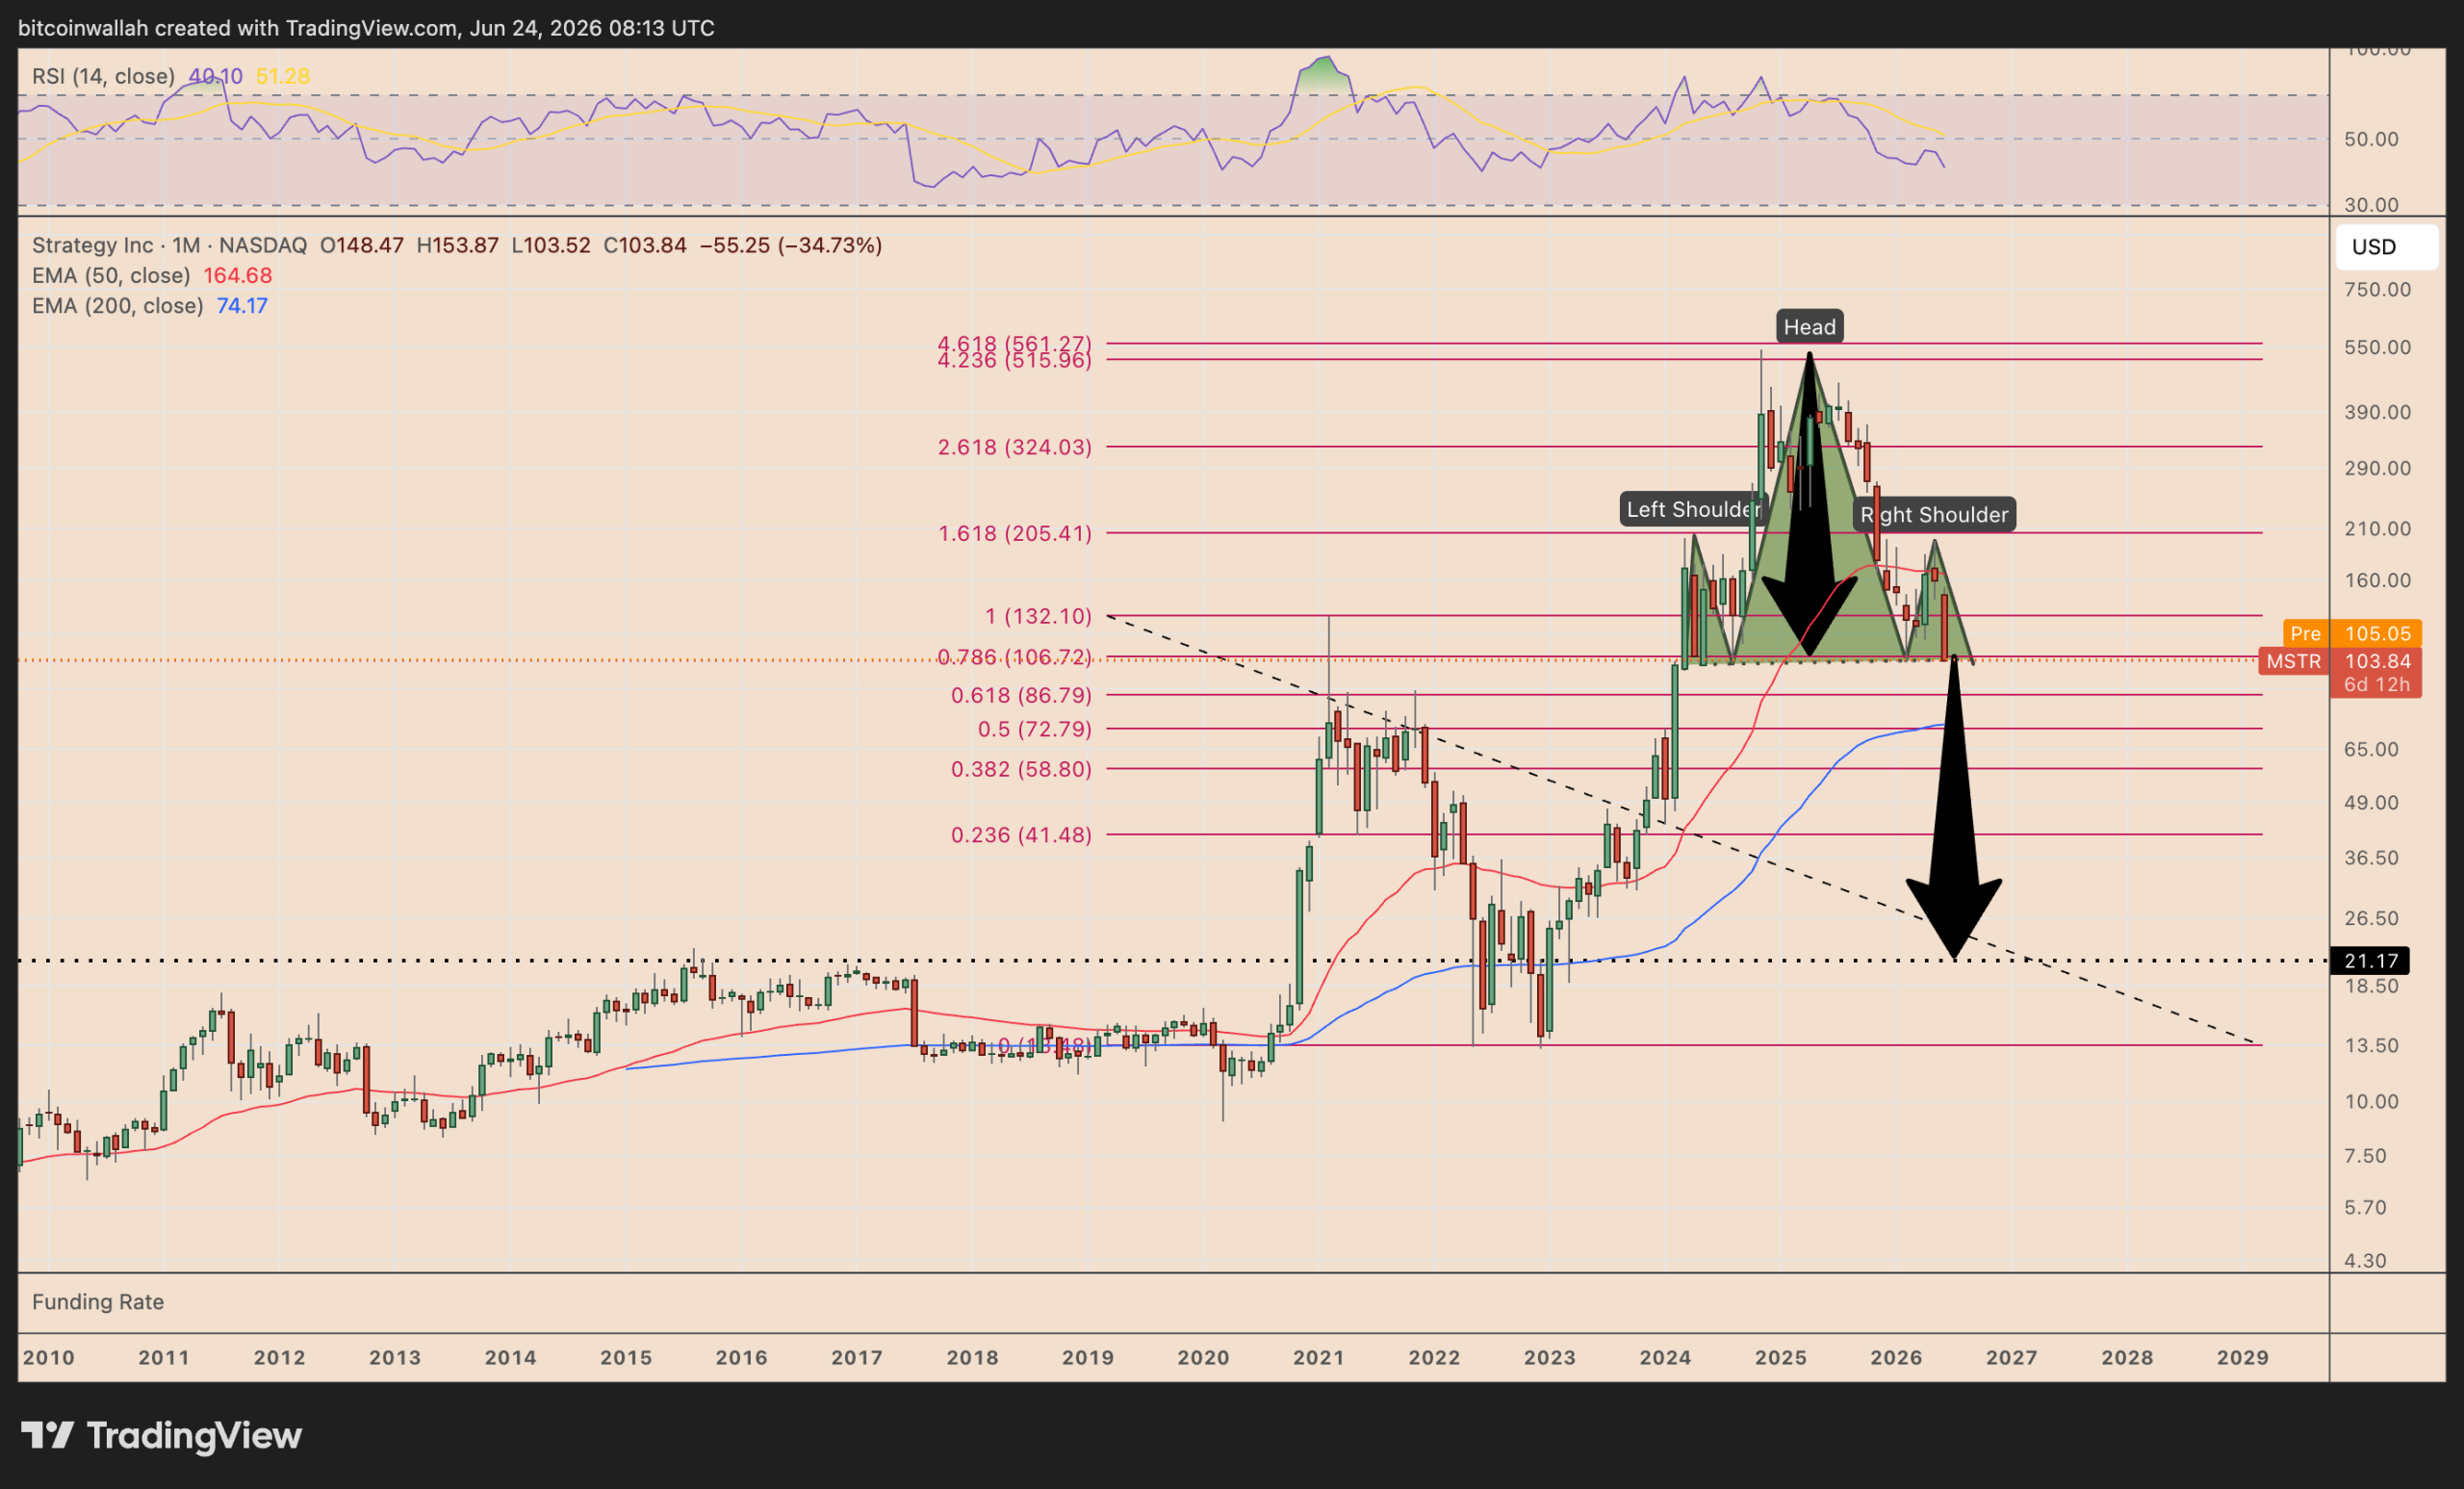
As of late June, MSTR’s monthly chart was painting a potential head-and-shoulders (H&S) pattern.
An H&S pattern develops when the price forms three peaks, with the middle peak, called the “head,” being steeper than the other two, which are called “shoulders.” The neckline is the support level connecting the major pullbacks between those peaks.
The pattern typically resolves when the price breaks below the neckline and, in a perfect scenario, falls by as much as the maximum distance between the head and the neckline.

MSTR monthly performance chart. Source: TradingView
MSTR has formed a near-perfect H&S pattern since March 2024 and risks a breakdown below the neckline support at $100–$105.
A decisive move below it would confirm the bearish setup. It could open the door to a deeper, multi-year correction toward the measured target of around $20, down approximately 80% from current levels.
The structure looks similar to the head-and-shoulders top MSTR formed during the dot-com bubble era. Back then, the stock broke below a comparable neckline setup before collapsing by more than 99% from its peak in two years.
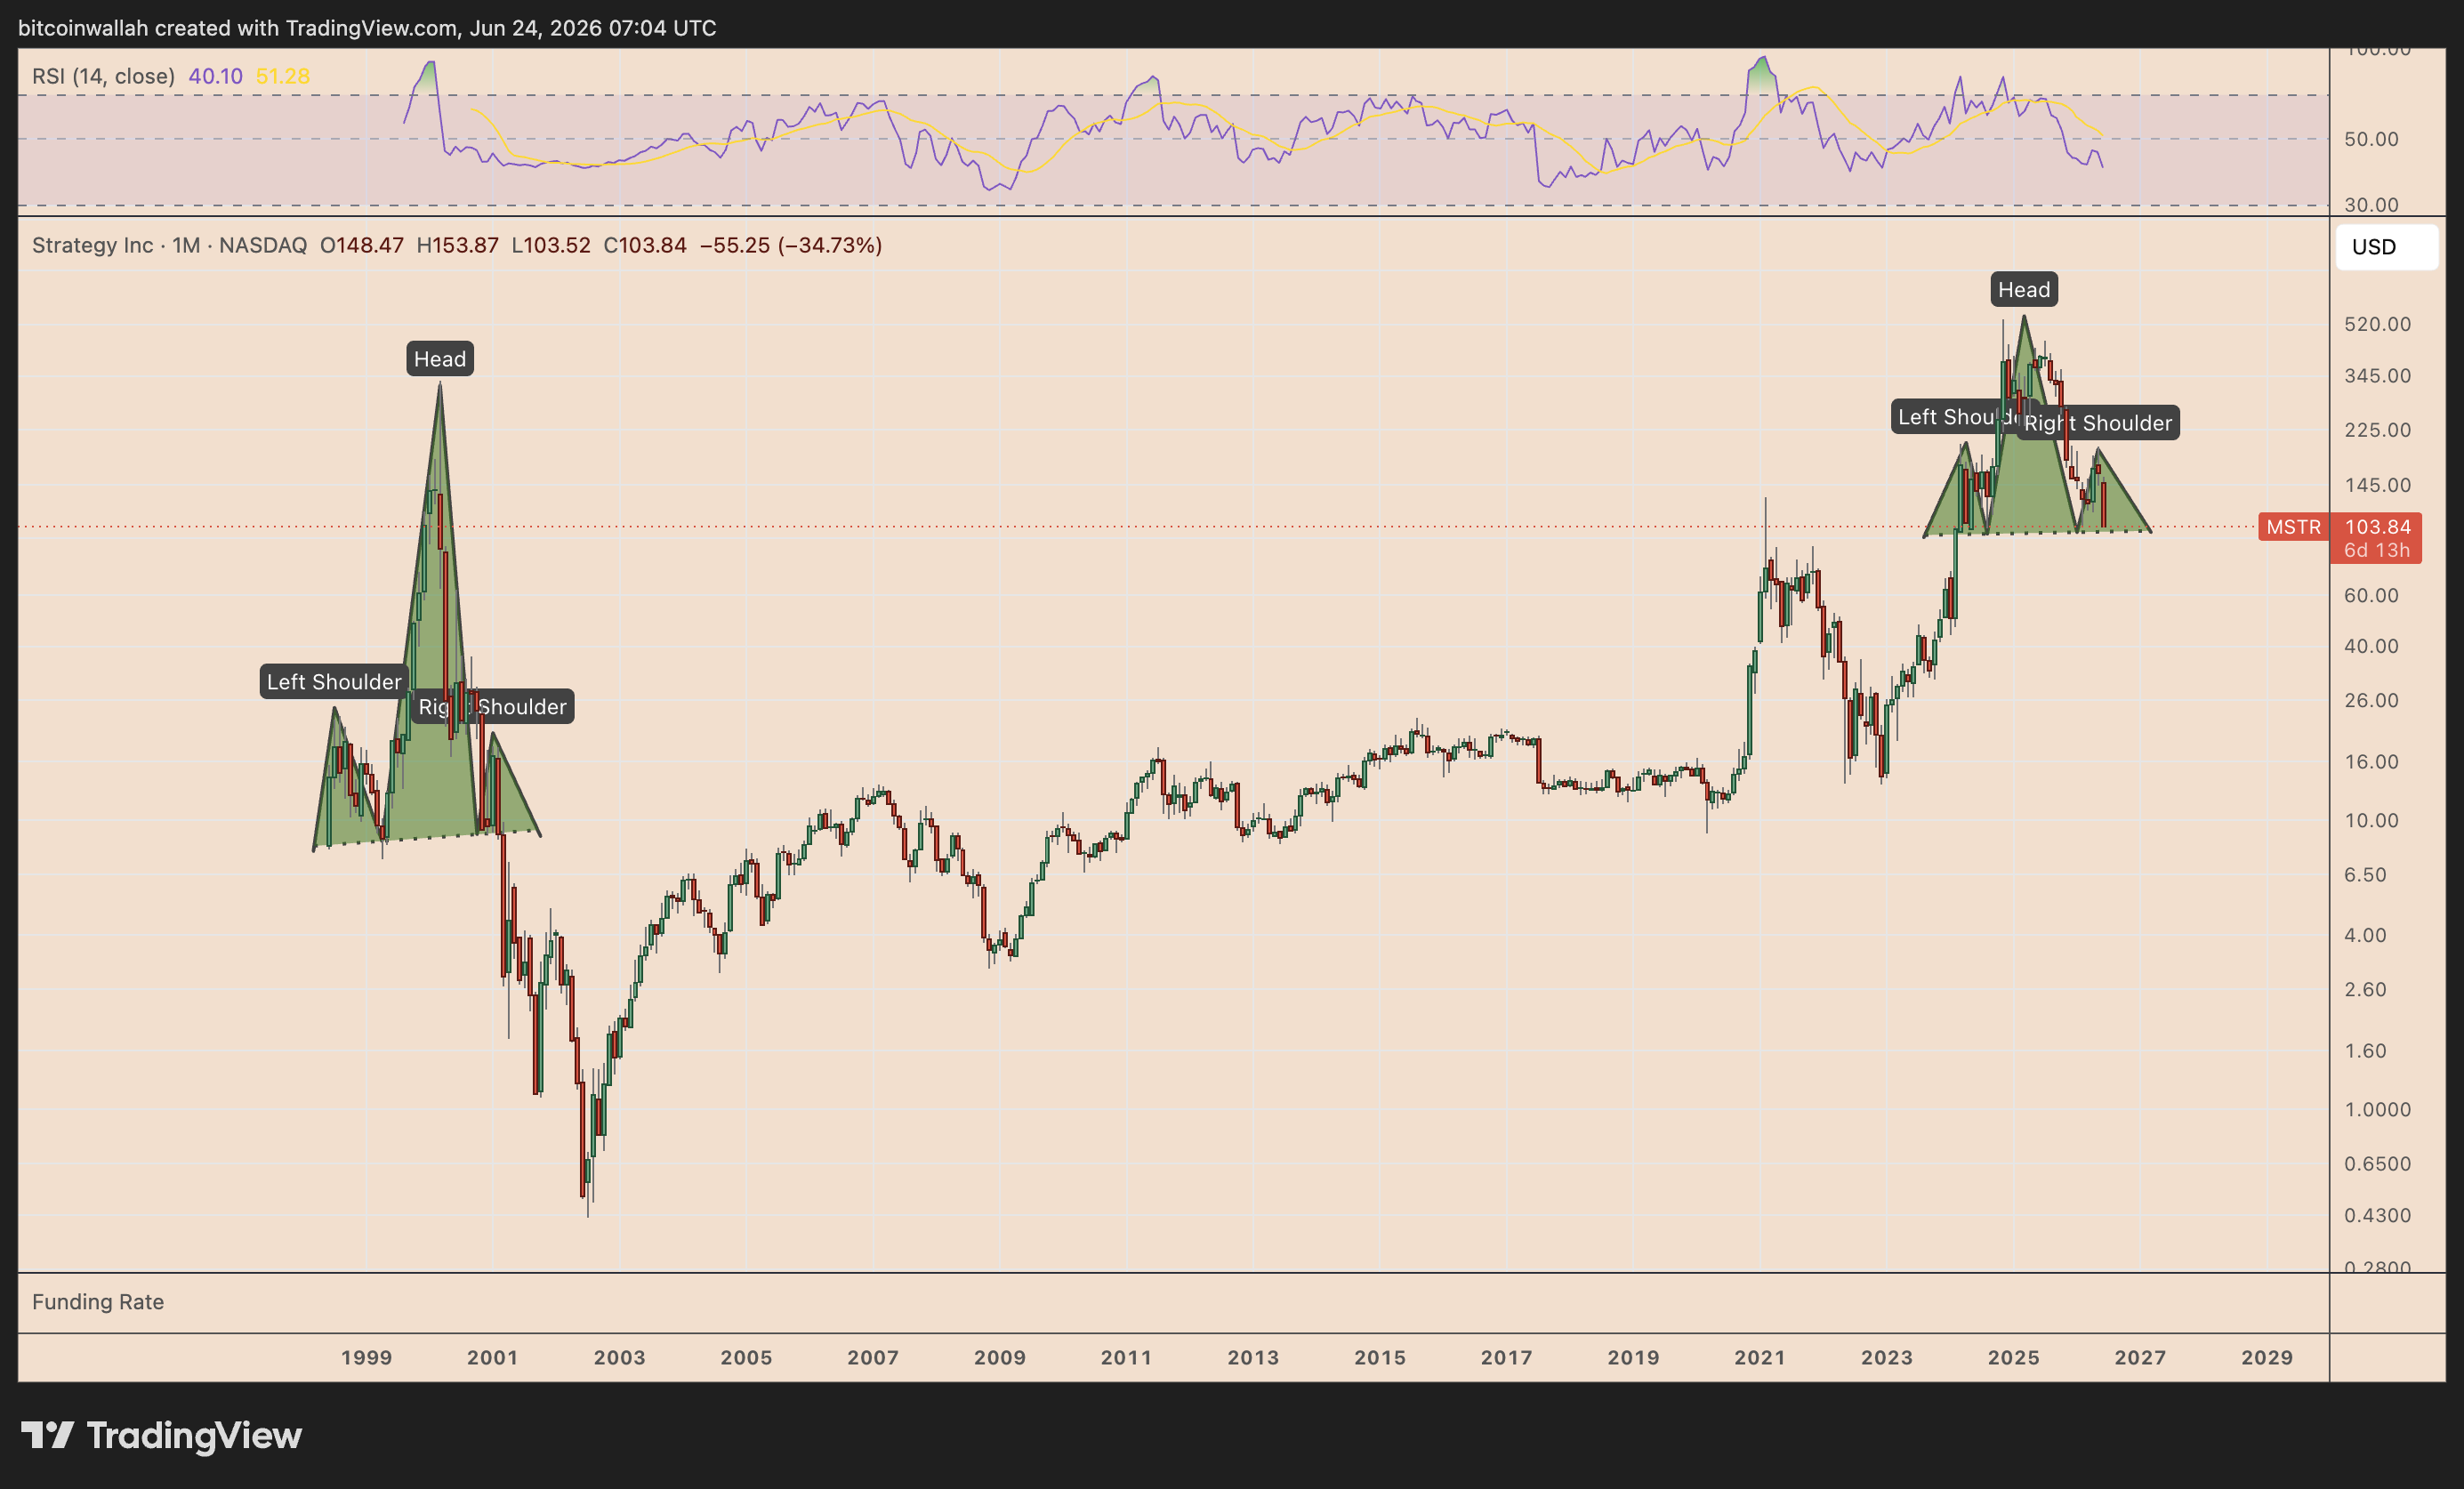
MSTR monthly performance chart. Source: TradingView
Strategy cash squeeze raises dilution risk for MSTR shareholders
Strategy’s common stock, MSTR, is facing fresh dilution risk as the company’s cash reserve shrinks and its preferred-stock dividend burden grows.
As of June, Strategy’s US dollar cash reserve had fallen 38% since the start of 2026, while its yearly dividend obligations had nearly quadrupled to $1.2 billion, according to CryptoQuant analyst Julio Moreno.
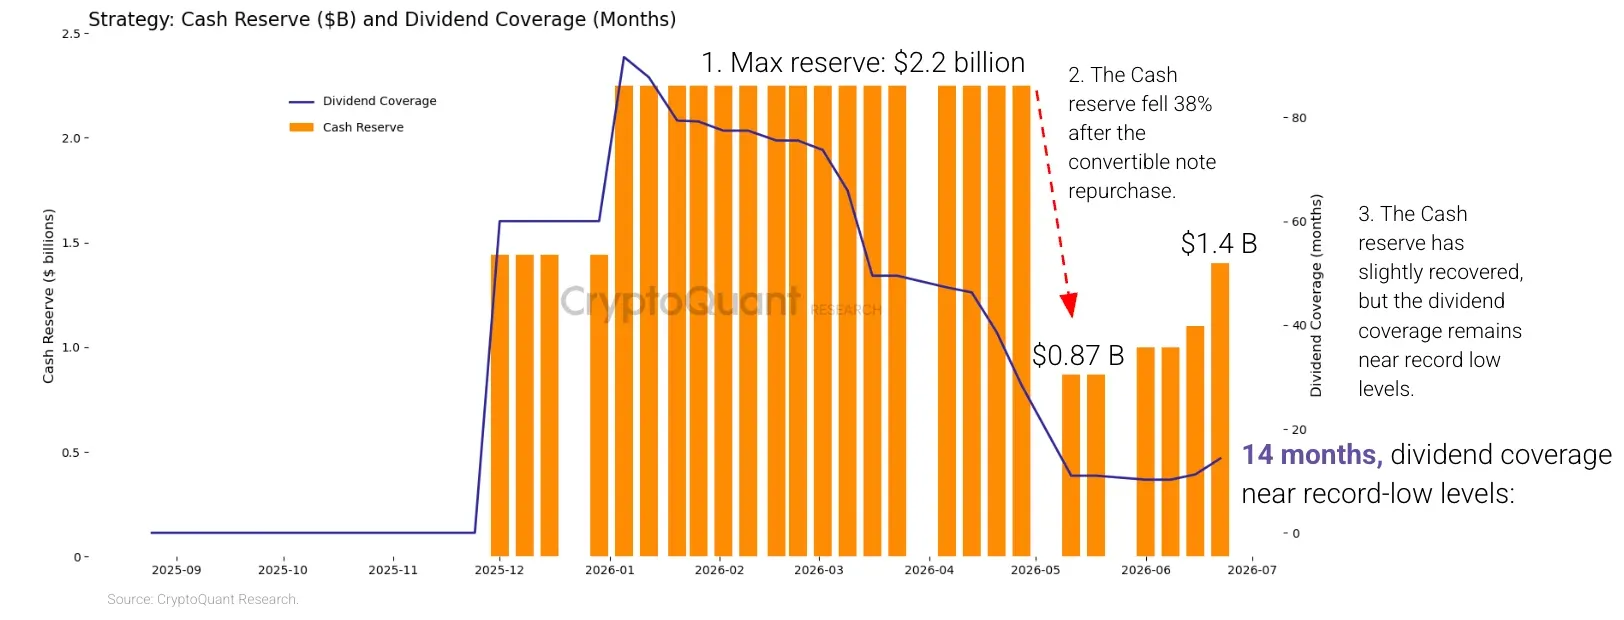
Strategy cash reserve and dividend coverage. Source: CryptoQuant
The company uses cash to pay dividends on its preferred stocks, primarily Stretch (STRC).
But Moreno said Strategy’s preferred-dividend coverage has dropped to about 14 months from more than seven years, meaning it now has enough cash to cover just over one year of STRC dividend payments.
That pressure has shown up in STRC’s market price. STRC fell to a record low of $82.50 last week and has since stayed mostly between $82 and $89, well below its $100 par value.
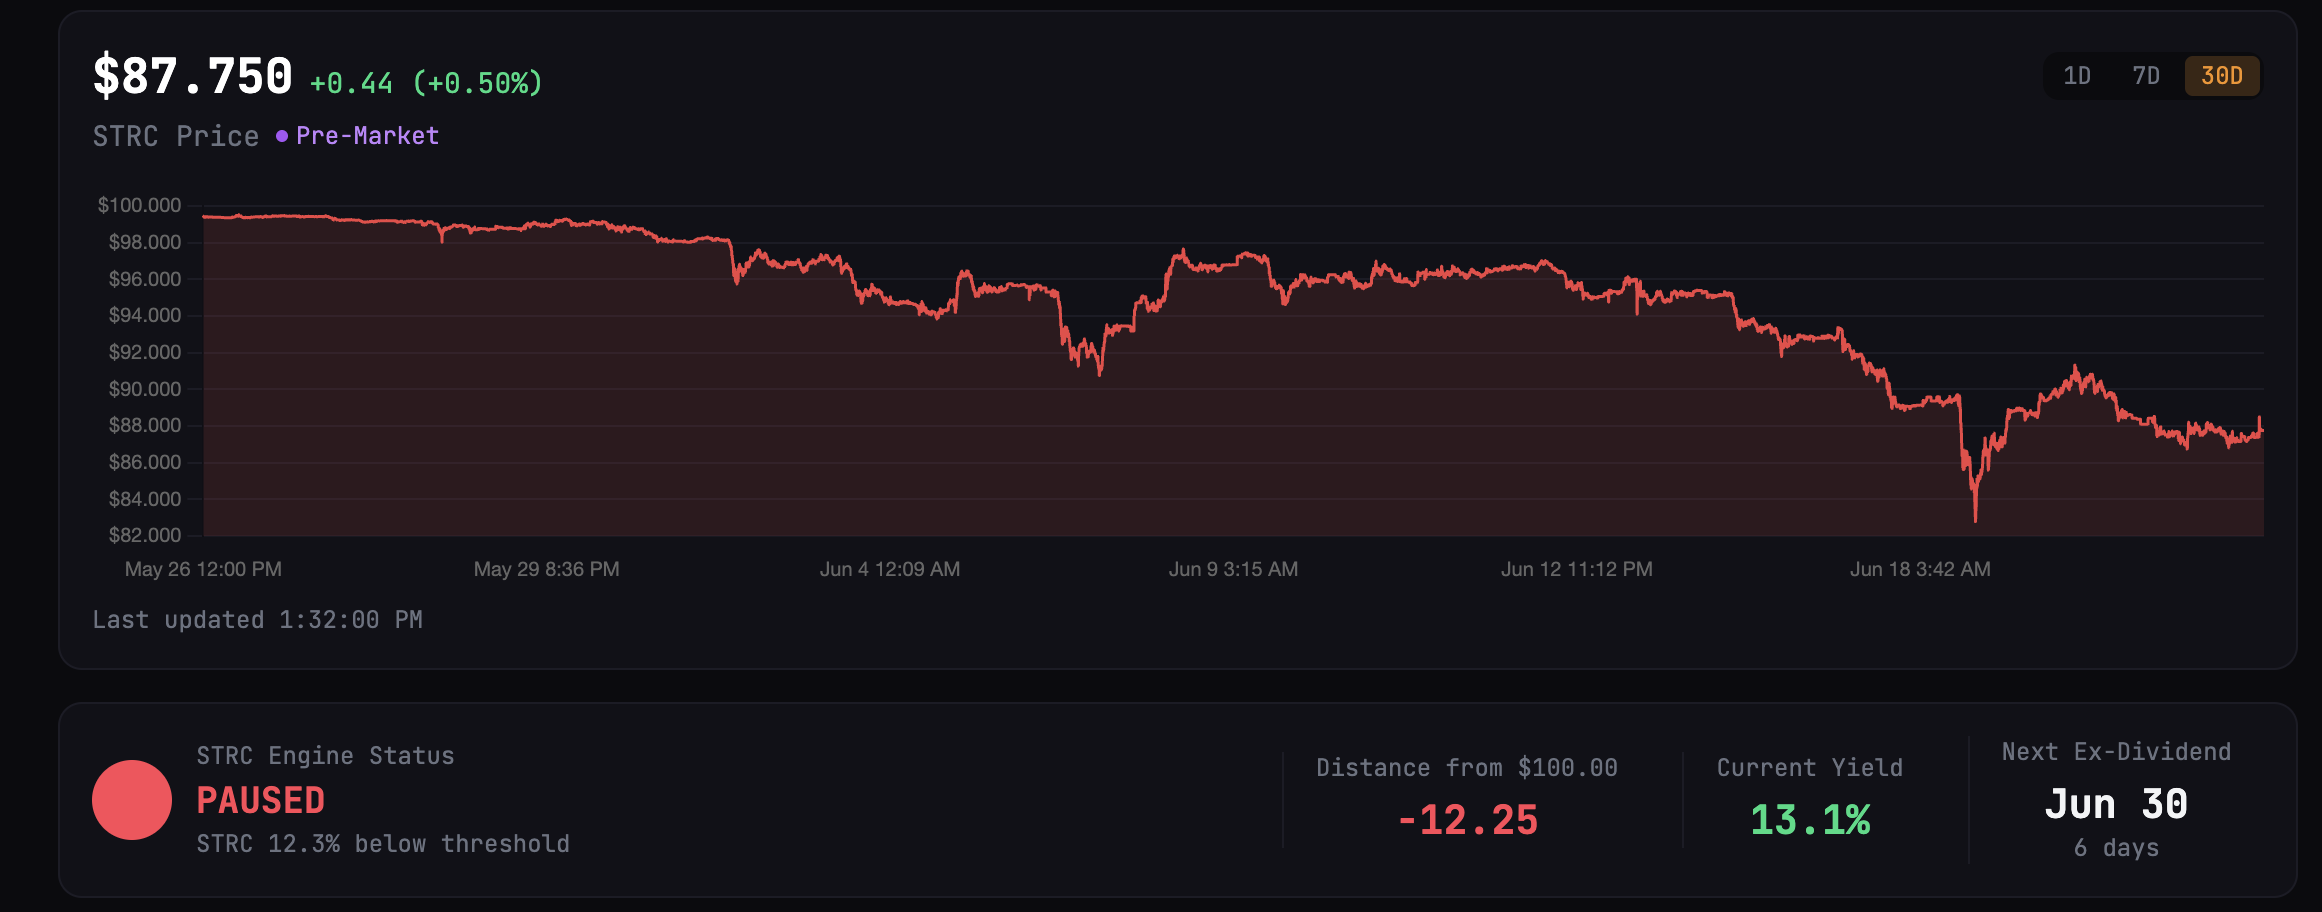
STRC price and yield chart. Source: STRC.LIVE
The decline has pushed STRC’s effective yield above 13%, compared with its stated dividend rate of about 11.5%, showing investors are demanding a higher return to hold it.
“At current dividend obligations of $1.2 billion per year, restoring 24 months of coverage would require a cash reserve of approximately $2.8 billion, roughly twice what Strategy holds today,” Moreno said, adding:
“A higher cash reserve is the most direct signal the market needs to regain confidence in STRC.”
Strategy holds 847,363 BTC, acquired at an average price of about $75,650 per coin, higher than today’s BTC price of around $62,600. Selling Bitcoin during a downturn could lock in losses and weaken its long-running accumulation narrative.
Instead, Strategy has raised STRC’s dividend rate and issued more MSTR common shares to raise cash. For instance, the company sold 2.71 million MSTR common shares for about $335.5 million in June, while using only $34.9 million of the proceeds to buy 520 BTC.
That keeps Strategy’s Bitcoin holdings largely intact, but it increases dilution risk for existing MSTR shareholders.
Related: Bitcoin price is down over 40% since STRC launched: Is Strategy ‘fine’?
If STRC remains below $100, Strategy may need to keep issuing common shares, slow Bitcoin purchases, or rebuild cash reserves. Each option could weigh on MSTR as the stock tests a bearish technical breakdown.

Ippei Naoi | Getty Images
Investors continue to rely on professional financial advisers for their final investment decisions, even as artificial intelligence becomes more widely used in the initial stages of research, according to a survey by HSBC.
The survey, which polled around 10,000 affluent and high-net-worth individuals across 10 markets, found that 62% use financial professionals and institutions as their main source of investment ideas.
About 37% of respondents said human financial experts had the greatest influence on their final investment decisions, three times as many as those who cited AI, according to HSBC.
Reassurance and strategic expertise were among the main reasons professional human advisors are preferred for the final decision, HSBC said. Unlike AI, human advisors can apply judgement, validate information, spot mistakes in AI-generated data and interpret complex data, it noted.
Still, younger investors are leading the charge for AI adoption. HSBC found that 86% of Gen Z respondents and 82% of millennials surveyed use AI for their financial and investment decisions.
However, AI is most commonly used by Gen Z to identify potential risks and avoid mistakes, while Millennials use AI mainly to speed up research and analysis, HSBC found.
Although AI plays a limited role in final investment decisions, nearly half of respondents said it has made them more confident and willing to take on calculated risks, especially among Gen Z and Millennials.
By markets, HSBC found that the effect was more pronounced in parts of Asia and the Middle East such as India, the United Arab Emirates, Malaysia and Hong Kong. Investors in the U.S., Singapore, Taiwan and the U.K, on the other hand, were “more measured in their approach.”
“Clients are increasingly using AI to explore their options, but when it comes to making investment decisions, they value judgement, context, and accountability from a trusted wealth adviser,” said Barry O’Byrne, CEO of International Wealth & Premier Banking at HSBC.

Seahawks partner with Accenture to revamp team’s tech capabilities and boost fan engagement
Nike Shares Dip as Sportswear Giant Faces Headwinds in Competitive Retail Landscape

Bitcoin (BTC) bulls have found a new support level. Will it hold?


-

 Fashion5 days ago
Weekend Open Thread: Miami – Corporette.com
-

 Entertainment4 days ago
Renter of Home in Anne Heche Crash Denies Settlement With Son
-
 Sports1 day ago
Two goals and an assist by sheer aura: Cristiano Ronaldo just entered the World Cup chat
-

 Tech3 days ago
Microsoft accidentally kills epic Outlook email threads
-

 Business4 days ago
Soccer-U.S. defends Iran World Cup travel restrictions, says discussions ongoing
-
Crypto World1 day ago
Bitcoin (BTC) Dips Below $62K, Ethereum (ETH) Plunges 6% Daily: Market Watch
-

 Politics5 days ago
Andy Burnham and the meaning of Makerfield
-

 Politics6 days ago
BBC Reporter Discusses Cross Party Criticism Of Trumps Iran Deal
-

 Crypto World22 hours ago
Securitize Wraps Roubini's SEC-Registered ETF as Dubai VARA Digital Security
-
Business1 day ago
Entergy settles forward sale agreements, raises $672 million in cash proceeds
-
 Business5 days ago
Wall Street Week Ahead: Investors see Micron earnings as pulse check of AI rally momentum
-

 NewsBeat6 days ago
Keir Starmer Allies Question His Chances For No 10
-

 Tech7 days ago
AWS enters the context layer race with a graph that learns from agents, not manual curation
-
 Crypto World5 days ago
Can Charles Hoskinson Really Rescue Cardano?
-

 Crypto World5 days ago
HIVE shares jump as $220M AI deal speeds Bitcoin mining pivot
-

 Crypto World5 days ago
Jake Chervinsky accuses CME of protecting derivatives monopoly
-
 Tech4 days ago
Signal’s Meredith Whittaker says AI chatbots ‘are not your friends’ and calls Copilot agents a backdoor
-

 Entertainment5 days ago
Jose Alvarado Wants Taylor Swift at More Knicks Games
-

 Tech2 days ago
Nearly 7,000 fake Amazon domains registered ahead of Prime Day 2026, researchers warn
-

 Business6 days ago
Brexit cost 6% of UK economy, Bank of England company data suggests
You must be logged in to post a comment Login