
Crypto World
Daily Market Update: Stock Futures Rise With Bitcoin at $67,200 Ahead of Inflation Report
TLDR
- U.S. stock futures advanced Thursday with Dow, S&P 500, and Nasdaq all posting gains after January jobs data showed 130,000 positions added
- Consumer Price Index report delayed by government shutdown now scheduled for Friday, expected to show 2.5% year-over-year inflation
- Federal Reserve rate cut probability stands at 5.4% for near-term action as strong employment complicates easing plans
- Bitcoin consolidates at $67,200 while trading in $62,822 to $72,000 range following recent market selloff
- Cisco stock dropped 7% after-hours on missed earnings while McDonald’s dipped slightly despite beating estimates
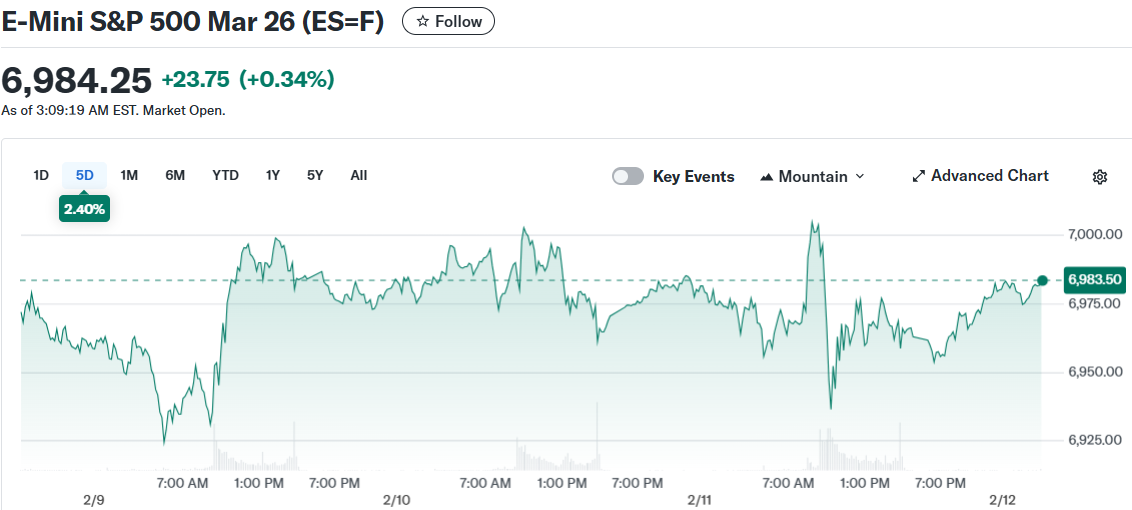
U.S. stock futures moved higher Thursday morning as traders processed January’s employment report. The data showed 130,000 new jobs added last month, surpassing analyst expectations.

Dow Jones Industrial Average futures gained approximately 0.2% in early trading. S&P 500 futures rose by a similar margin while Nasdaq 100 futures advanced 0.1%.
The futures gains followed a mixed Wednesday session on Wall Street. Major indexes closed relatively flat after the jobs data complicated Federal Reserve policy expectations.
Employment Data Reshapes Market Outlook
Markets initially rallied following the January jobs report release. However, the stronger-than-expected hiring numbers created new questions about monetary policy timing.
Year-end 2025 employment figures were revised downward in the report. The revisions revealed slower job growth last year than initially calculated.
A resilient labor market paired with persistent inflation could reduce near-term rate cut likelihood. This scenario has become a key concern for equity investors who anticipated policy easing.
CME’s FedWatch tool currently indicates a 94.6% probability of unchanged rates. The Federal Reserve is expected to maintain the 3.50%-3.75% range at upcoming meetings.
Tim Sun from HashKey Group explained that positive economic news creates challenges for risk assets. Strong employment removes urgency for the Fed to implement early policy easing.
Inflation Report Takes Priority
Investors now turn attention to Friday’s Consumer Price Index data. The report was delayed due to a partial government shutdown but will provide crucial inflation insights.
January CPI is forecast to decline to 2.5% on a year-over-year basis. This would mark a 0.2% drop from December’s reading.
Derek Lim from Caladan stated that inflation data carries more weight than employment figures. A lower-than-expected reading would increase pressure on the Fed to cut rates sooner.
Lower policy rates typically ease financial conditions and reduce discount rates. This environment has historically supported both equities and cryptocurrencies during high liquidity periods.
Conversely, hotter inflation numbers could cement a higher-for-longer rate environment. Such an outcome would likely pressure risk assets across markets.
Crypto and After-Hours Movers
Bitcoin currently trades at $67,200, down 0.5% over 24 hours. Ethereum holds steady at $1,970 according to CoinGecko.
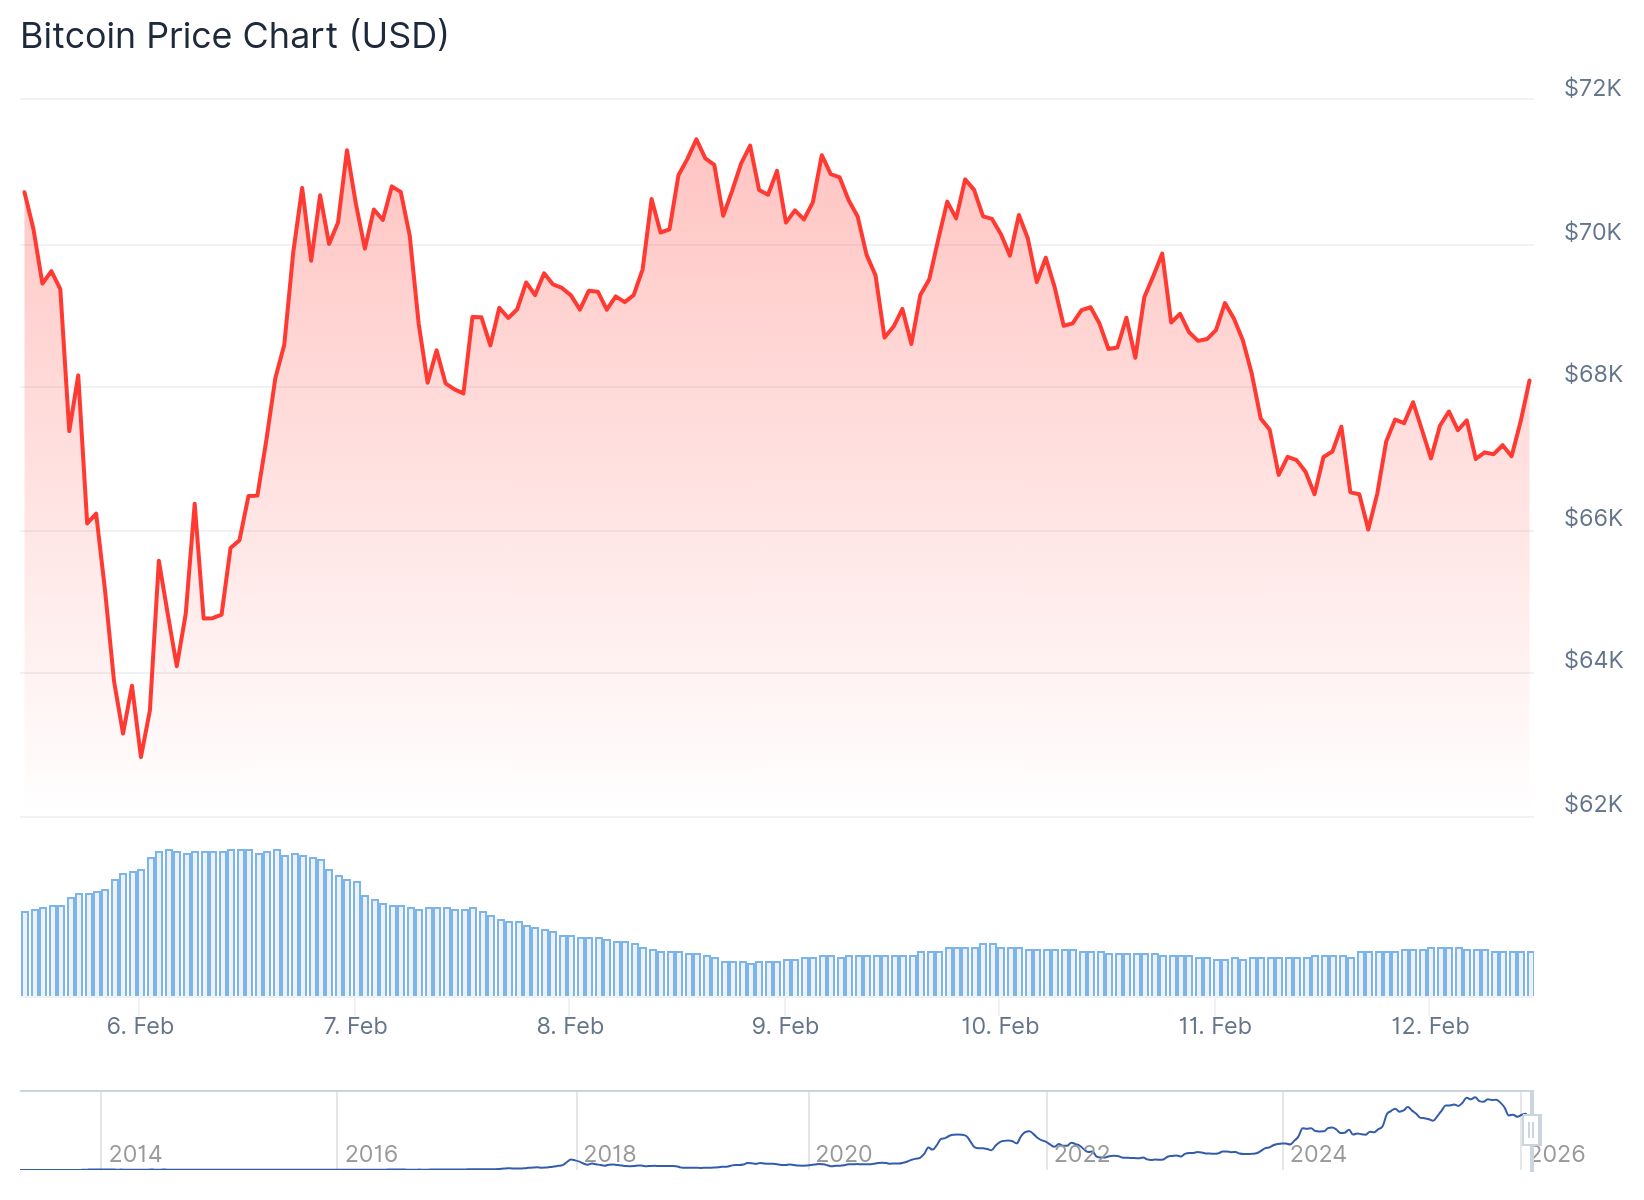
The leading cryptocurrency has traded between $62,822 and $72,000 this past week. Volatility remains relatively muted following late January and early February declines.
Sun noted that interest rate futures repriced quickly after jobs data. Rate cut expectations compressed and shifted toward the second half of 2026.
Cisco Systems fell roughly 7% in after-hours trading after missing profit forecasts. McDonald’s declined modestly despite surpassing earnings expectations.
Friday’s earnings calendar includes reports from Coinbase, Applied Materials, and Rivian. A softer inflation print would signal easing price pressures while growth continues.


Crypto bull cycles over the past 5 years have been mostly about token speculation and, more recently, institutional adoption. But the next cycle will be dominated by real-world applications, according to Clem Chambers – founder of ADVFN, Europe’s leading stocks and markets website
Speaking at BeInCrypto’s Markets Intelligence Council, Chambers argued that the industry is moving past its trading-driven cycle.
“That era has probably ended and certainly is coming to an end. And then that will be replaced by use cases,” he said, pointing to a structural change in how value is created in crypto.
The Trade Is Crowded, The Utility Isn’t
His comments come as the current cycle shows clear divergence between price action and underlying activity. Bitcoin and Ethereum continue to attract institutional flows, especially in a post-ETF environment.
However, capital is concentrating at the top, while mid-tier tokens struggle to hold attention or liquidity.
At the same time, a different layer of the market is gaining traction. Tokenized real-world assets, stablecoin-based payment rails, and blockchain infrastructure tied to AI and data are seeing steady growth.
These sectors generate usage, fees, and in some cases, real revenue — something most speculative tokens failed to deliver in previous cycles.
Forget Tokens, Think Products
Chambers framed this shift bluntly.
“Forget Fi and look for apps, not Fi, apps, applications of tokens and blockchains,” he said.
Earlier cycles focused on financial primitives — DeFi protocols, yield farming, and token trading. The emerging trend centers on applications that users interact with directly, often without focusing on the underlying token.
This aligns with broader market signals in 2026. Tokenized funds from firms like BlackRock and growing stablecoin usage in payments show how blockchain is embedding into existing financial systems.
Meanwhile, infrastructure sectors such as decentralized physical networks and AI-linked protocols are attracting developer activity and venture funding.
However, this transition is uneven. Speculative trading still drives short-term price moves, and retail participation remains largely momentum-based.
Many application-layer projects also struggle with user retention and monetization.
Even so, the direction is becoming clearer. If previous cycles were driven by narratives around tokens, the next phase may depend on whether blockchain-based applications can deliver consistent utility.
Chambers’ argument reflects a broader reality: the market is starting to reward usage over hype.
Whether that shift fully defines the next cycle will depend on how quickly these applications can scale beyond crypto-native users.
The post The Next Crypto Bull Run Won’t Be About Coins or Viral Hype appeared first on BeInCrypto.
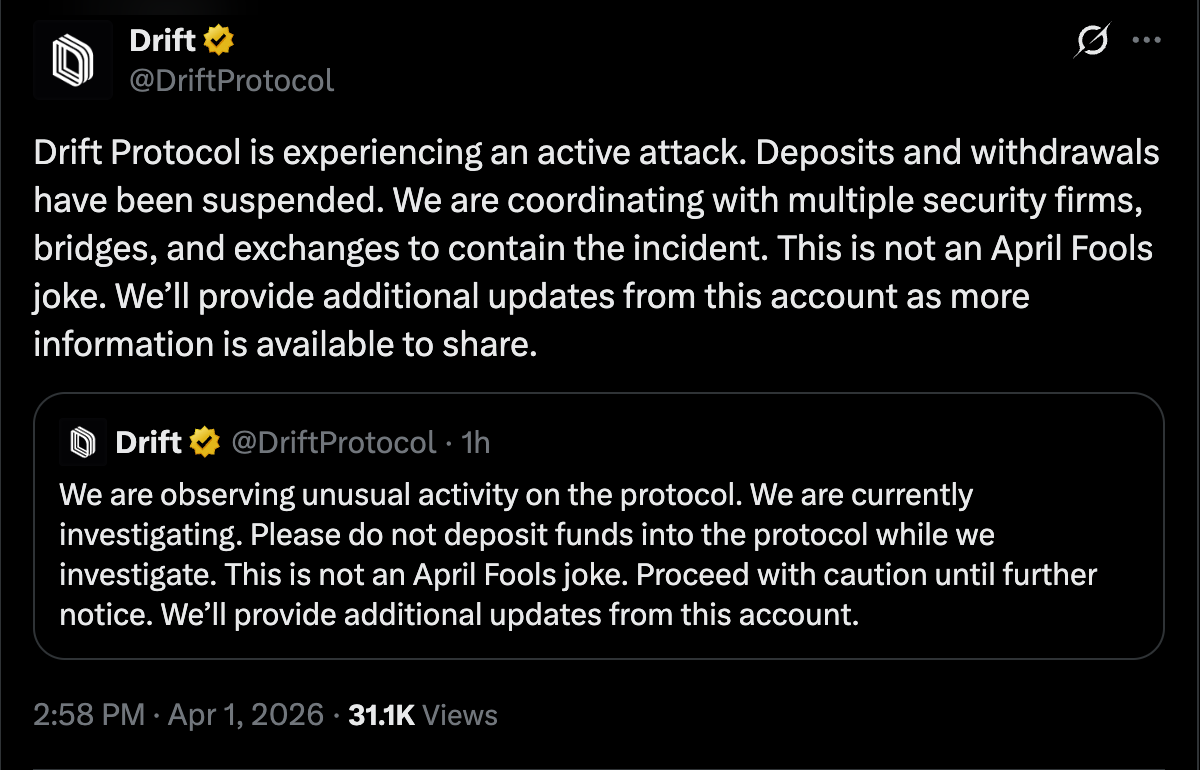
Drift Protocol, a decentralized cryptocurrency exchange (DEX), detected “unusual” trading activity on the platform on Wednesday, warning users not to deposit funds until the issue has been resolved.
The Drift team did not disclose the specific cause of the ongoing incident or the damage in its initial announcement and is currently investigating the issue.
In a subsequent update, the Drift team announced that deposits and withdrawals on the platform have been suspended.

Blockchain cybersecurity threat researcher Vladimir S said the exploit was likely due to a crypto wallet private key leak, and the total funds lost in the incident could be as high as $200 million.
“Admin signer was compromised, or whoever controls it intentionally executed these changes,” he said.
The stolen assets include wrapped versions of Bitcoin (BTC), Jito (JTO), the Fartcoin (FRT) memecoin, other altcoins, and various dollar, euro, and Japanese yen stablecoins, which have since been transferred to multiple wallets, according to Vladimir S.

The exploiter started converting the stolen assets to the USDC (USDC) stablecoin, bridging the funds to the Ethereum network and purchasing Ether (ETH), according to Solana treasury company DeFi Development Corp.
Cointelegraph reached out to Drift Protocol but did not receive an immediate response by the time of publication.
Cybersecurity exploits and hacks were responsible for $49 million in crypto losses during February, a sharp decrease from January, but a reflection of the ongoing security threats users and platforms face.
Related: Resolv temporarily halts protocol to ‘contain the impact’ of 80M USR exploit
Drift token impacted by the exploit
The price of the Drift (DRIFT) token briefly reached $0.68 on Wednesday, but fell by about 18% following news of the exploit, according to data from CoinMarketCap.

About 83% of the native crypto tokens of hacked platforms never recover to pre-hack prices, according to blockchain security company Immunefi.
“The stolen funds are only the first layer of damage,” Immunefi CEO Mitchell Amador told Cointelegraph in March.
“What follows is often more destructive: sustained token price suppression, reduced treasury capacity, leadership disruption, lost development time, and erosion of user trust,” he added.
Magazine: WazirX hackers prepped 8 days before attack, swindlers fake fiat for USDT: Asia Express
Crypto World
Paradigm Is Building a Prediction Markets Trading Terminal Targeting Professional Traders

TLDR:
- Paradigm partner Arjun Balaji has been leading the trading terminal project since late 2025 for pro traders.
- The firm is exploring prediction market indexes by bundling multiple markets into one single tradable product.
- Kalshi, backed by Paradigm, has raised at least $1 billion, pushing its valuation to a record $22 billion.
- Paradigm is raising up to $1.5 billion for a new fund expanding beyond crypto into AI and robotics sectors.
Paradigm, the prominent crypto venture capital firm, is developing a prediction markets trading terminal, sources say.
Partner Arjun Balaji has been leading the project since late 2025. The terminal targets professional traders and market makers. Paradigm has declined to comment on the initiative.
This move comes as mainstream financial institutions rush to capitalize on prediction markets’ growing popularity across sports, elections, and crypto pricing.
Paradigm Eyes Market-Making and Index Products
Beyond the trading terminal, Paradigm is weighing whether to establish an internal market-making desk. Two sources confirmed the firm has actively discussed this possibility. A market-making desk would position Paradigm as a direct participant, not just an infrastructure builder.
Separately, a third source says Paradigm is working with researchers on prediction market indexes. The concept involves bundling multiple prediction markets into one tradable product.
This mirrors how the S&P 500 packages hundreds of stocks into a single instrument. The firm has already started collecting prediction market data into a public dashboard.
Sources familiar with the matter noted that Balaji has been working on the terminal project since late 2025. They spoke on condition of anonymity to discuss private business dealings. Paradigm’s spokesperson declined to comment when approached for a response.
This activity places Paradigm squarely inside a rapidly growing sector. Prediction markets have become one of Silicon Valley’s most discussed areas over the past year. Traditional financial players are also moving in, adding further competitive pressure.
Kalshi and Polymarket Drive Sector Valuations Higher
Paradigm has been a consistent backer of Kalshi, one of the two dominant prediction market platforms. The firm joined three successive Kalshi fundraising rounds in 2025. Paradigm also led a December round that valued Kalshi at $11 billion.
Kalshi has since raised at least $1 billion in new financing, bringing its valuation to $22 billion. Paradigm co-founder Matt Huang sits on Kalshi’s board of directors.
One source confirmed that Paradigm’s trading terminal is “not competitive with Kalshi’s platform,” drawing a clear line between the two products.
Rival platform Polymarket is also seeing sharp valuation growth. The Wall Street Journal reported Polymarket is in talks to raise at a roughly $20 billion valuation.
A new venture firm focused entirely on prediction markets has also emerged, backed by the CEOs of both platforms.
Paradigm’s prediction markets push fits within a wider expansion beyond crypto. The firm is raising up to $1.5 billion for a new fund covering AI and robotics alongside digital assets.
The Wall Street Journal recently reported on the fund’s broader scope, marking a clear shift in Paradigm’s investment direction.

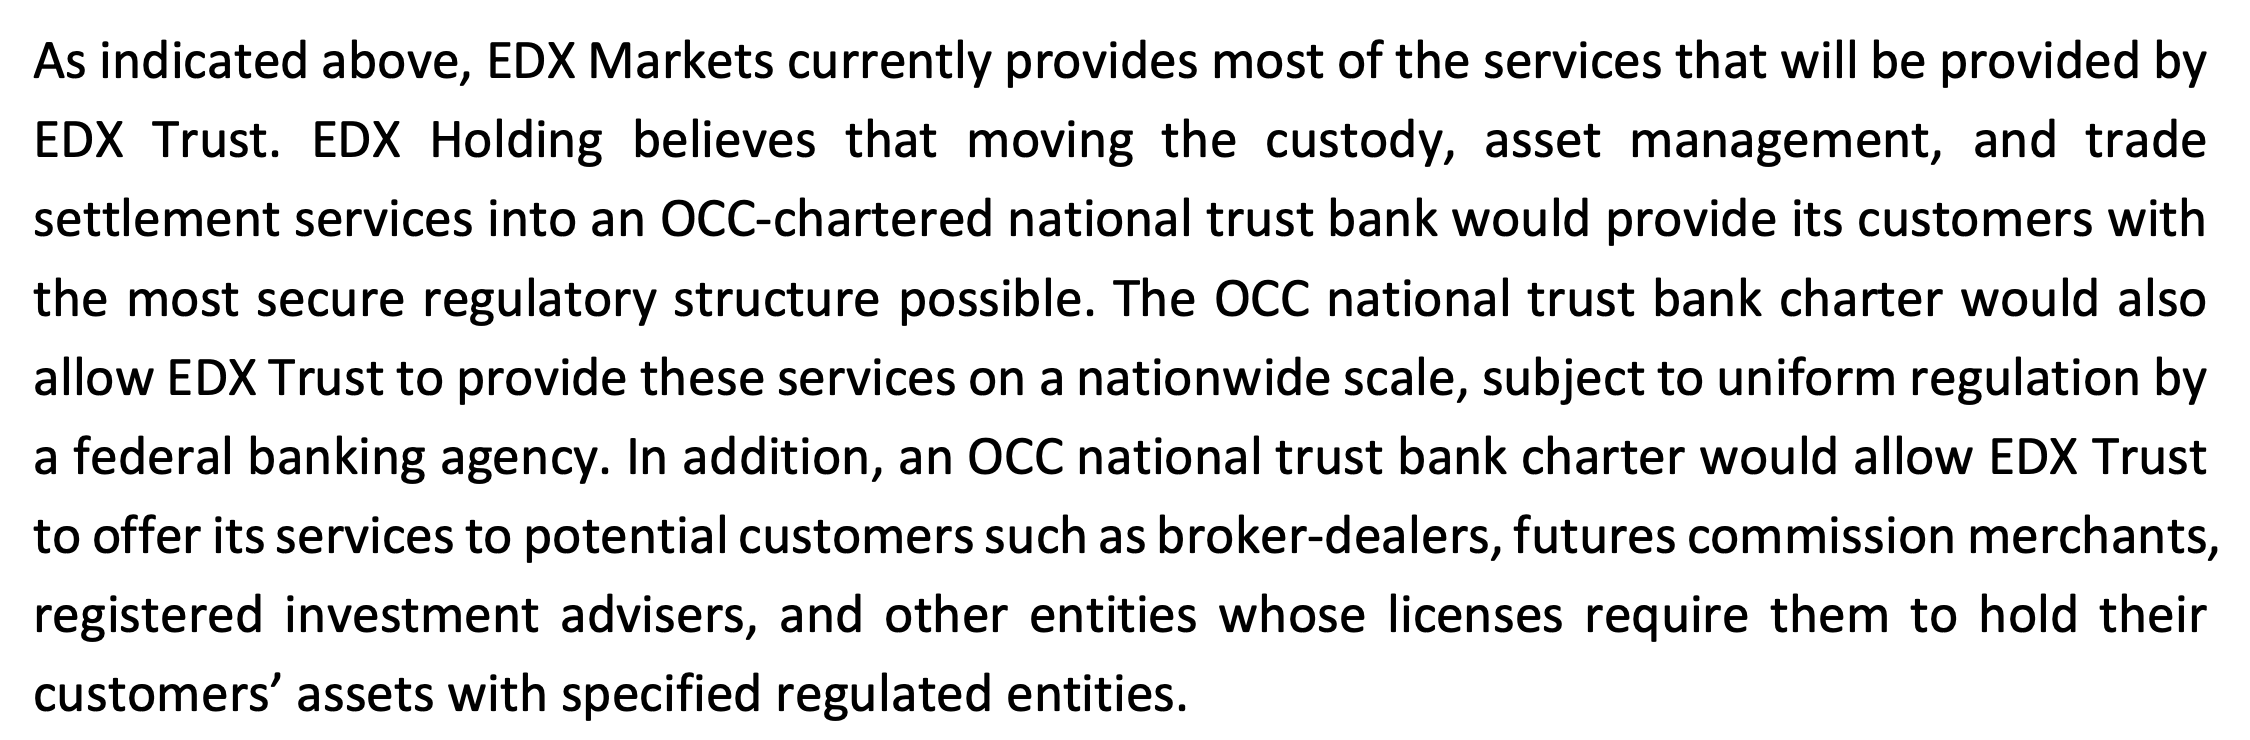
EDX Markets, an institutional crypto exchange, has applied to the US Office of the Comptroller of the Currency (OCC) to establish a national trust bank that would provide crypto custody, asset management and trade-settlement services.
The proposed entity, EDX Trust, would operate as a non-depository national bank, separating custody and settlement from trading while continuing to route order matching through EDX’s existing platform.
In its application, the company said the model is intended to address structural risks in crypto markets, where trading, custody and brokerage are often combined within a single platform, creating potential conflicts of interest and single points of failure.
EDX said the trust bank would provide fiduciary asset management services, invest client cash and stablecoin balances in highly liquid assets, and facilitate trading through a riskless principal model with end-of-day net settlement.
The bank would operate online from Chicago and target institutional clients such as broker-dealers, futures commission merchants and registered investment advisers, according to the filing.
EDX said moving these functions into an OCC-chartered entity would allow it to offer services nationwide under a single regulatory framework while meeting custody requirements for regulated institutions.
Founded in 2022, EDX Markets is backed by traditional market participants including Citadel Securities, Virtu Financial, Fidelity Digital Assets and Hudson River Trading.

Related: Fed’s Barr backs stablecoin clarity but warns of run risks
Crypto companies seek US bank charters
The application comes as crypto and financial companies increasingly pursue national trust bank charters to expand institutional services under federal oversight.
Earlier this month, Zerohash, a blockchain infrastructure company, applied for a US national trust bank charter to expand its stablecoin and custody services for banks, brokerages and fintechs.

Other recent applicants include Coinbase, which applied in October and is still awaiting a decision, as well as Laser Digital and Payoneer, which filed applications earlier this year to expand custody and stablecoin-related payment services.
Traditional financial institutions are also entering the space. In February, Morgan Stanley applied for a de novo trust bank charter to support digital asset services through a separate entity.
At the same time, the OCC has continued approving applicants, issuing conditional licenses last month to Bridge, Stripe and Crypto.com, following approvals in December for Ripple Labs, Circle Internet Group, Fidelity Digital Assets, Paxos and BitGo.
However, the pace of approvals has drawn scrutiny. In February, the American Bankers Association urged the OCC to slow the process, citing unresolved oversight under pending US stablecoin legislation.
Crypto World
Ripple Treasury Becomes First TMS to Offer Native Digital Asset Capabilities for Corporate CFOs
TLDR:
- Ripple Treasury is the first TMS to embed native digital asset capabilities directly into an enterprise platform.
- Digital Asset Accounts support XRP and RLUSD with 15-decimal precision and automated real-time transaction recording.
- Unified Treasury connects multiple custodians via ClearConnect, giving CFOs one real-time dashboard for all positions.
- Ripple’s 2026 survey found 72% of finance leaders say a digital asset solution is now needed to stay competitive.
Ripple Treasury has officially launched Digital Asset Accounts and Unified Treasury. The launch marks the first native digital asset capabilities embedded in an enterprise treasury management system.
CFOs and their teams can now view, hold, and manage both fiat and digital assets in one place. It follows Ripple’s 2025 acquisition of GTreasury, which brought over 40 years of enterprise treasury expertise. Multiple customers completed beta testing ahead of the April 1 global launch.
Digital Asset Accounts Integrate Onchain Balances Into Enterprise Treasury Workflows
Digital Asset Accounts allow treasury teams to create and manage a regulated digital asset account directly within the platform.
No external setup, third-party custody relationship, or separate system is required. XRP and Ripple USD (RLUSD) balances appear alongside cash accounts in real time.
The platform applies live fiat valuation, refreshed within seconds of each transaction. Exchange rates come from leading market data providers and update automatically.
The system also works across multiple data providers simultaneously, maintaining accuracy during volatile market conditions. Teams no longer need manual calculations or separate tools for valuation.
Transactions are recorded with 15-decimal precision, capturing onchain amounts exactly as they exist. This prevents rounding errors that typically cause reconciliation gaps.
An automated audit trail is generated for every transaction, supporting finance and control teams. Treasury managers maintain full control of records without relying on external reconciliation tools.
Each record captures the native notional amount, fiat equivalent, and market price at the moment of the event. This provides a complete, time-stamped transaction history without manual data entry. The automated recording process also supports compliance across multiple reporting frameworks.
Renaat Ver Eecke, SVP of Ripple Treasury, spoke on the shift in how CFOs now approach digital assets. “Digital assets have arrived at the CFO’s desk, and the question has shifted from whether to engage to how to do so advantageously without disrupting existing operations,” he said.
He added that the platform gives the office of the CFO a trusted place to hold and manage digital and fiat assets, with no separate interface or new workflows needed.
Unified Treasury Gives CFOs Real-Time Visibility Across All Liquidity Positions
Unified Treasury consolidates digital asset and cash positions into a single real-time dashboard. Teams holding assets across multiple custodians can connect providers through Ripple Treasury’s ClearConnect connectivity layer.
This layer is the same one already used for existing bank integrations within the platform. No new infrastructure or changes to current banking arrangements are required.
API connectivity to digital asset providers can be completed in minutes through the platform. Once connected, balances reflect automatically as transactions occur onchain.
Treasury teams no longer depend on manual imports or batch data processing to see positions. This also eliminates delays that have made digital asset reporting difficult for corporate finance teams.
Market rates are applied to digital asset balances in the reporting currency of each organization’s choice. No separate data sources or manual currency conversions are required.
The entire process runs automatically within the system, streamlining day-to-day operations. This gives treasury teams in different regions a consistent reporting experience.
Mark Johnson, VP of Global Product at Ripple Treasury, described the core design principle behind both capabilities. “The design principle behind both capabilities is that digital assets should behave exactly like cash within the platform,” he said.
Johnson further noted that treasury teams should not have to think about whether a balance is onchain or in a bank account. “They should simply see their position,” he added.
Ripple’s 2026 survey of 1,000+ global finance leaders found that 72% now consider a digital asset solution a competitive necessity.
Most, however, lack a starting point that fits within current workflows. Stablecoins processed $33 trillion in volume last year, rising 72% from 2024, showing strong demand already in the market.


New Hampshire’s Bitcoin-backed municipal bond receives Ba2 rating from Moody’s, marking the first instance of a public finance instrument backed by cryptocurrency.

Key takeaways
- Jesse Spiro of Tether is poised to chair Fellowship PAC, a crypto-backed political committee planning endorsements for the 2026 U.S. midterms.
- The group claims to have raised over $100 million from crypto-aligned backers, though transparency around contributors remains limited.
- The Fellowship PAC filed with the U.S. Federal Election Commission on Aug. 7 and had reported no contributions or expenditures as of Dec. 31, raising questions about funding sources and operational timeline.
- Industry politics are intensifying as lawmakers weigh digital-asset regulation alongside debates over stablecoins, with broader implications for the sector’s political leverage.
Industry money and the evolving political playing field
Beyond U.S. politics, observers point to a broader question: will political engagement by the crypto sector translate into tangible regulatory outcomes, or will it primarily serve as signaling to markets and builders? The coming months should reveal how the Fellowship PAC, and others like it, balance signaling with real-world policy influence, particularly as the Senate weighing of the CLARITY Act remains unsettled and as discussions around stablecoins and digital-asset markets continue to evolve.
Cointelegraph and other outlets will continue monitoring filings, endorsements, and the evolving regulatory dialogue to assess how these political moves might shape the crypto landscape through 2026 and beyond.
Readers should watch for developments on who funds Fellowship PAC, how its endorsement strategy unfolds, and whether the Senate reopens consideration of digital-asset reform in a way that aligns with or counters the industry’s political ambitions.
Regulatory crossroads: stablecoins, yield, and the CLARITY Act
What to watch next in the 2026 cycle
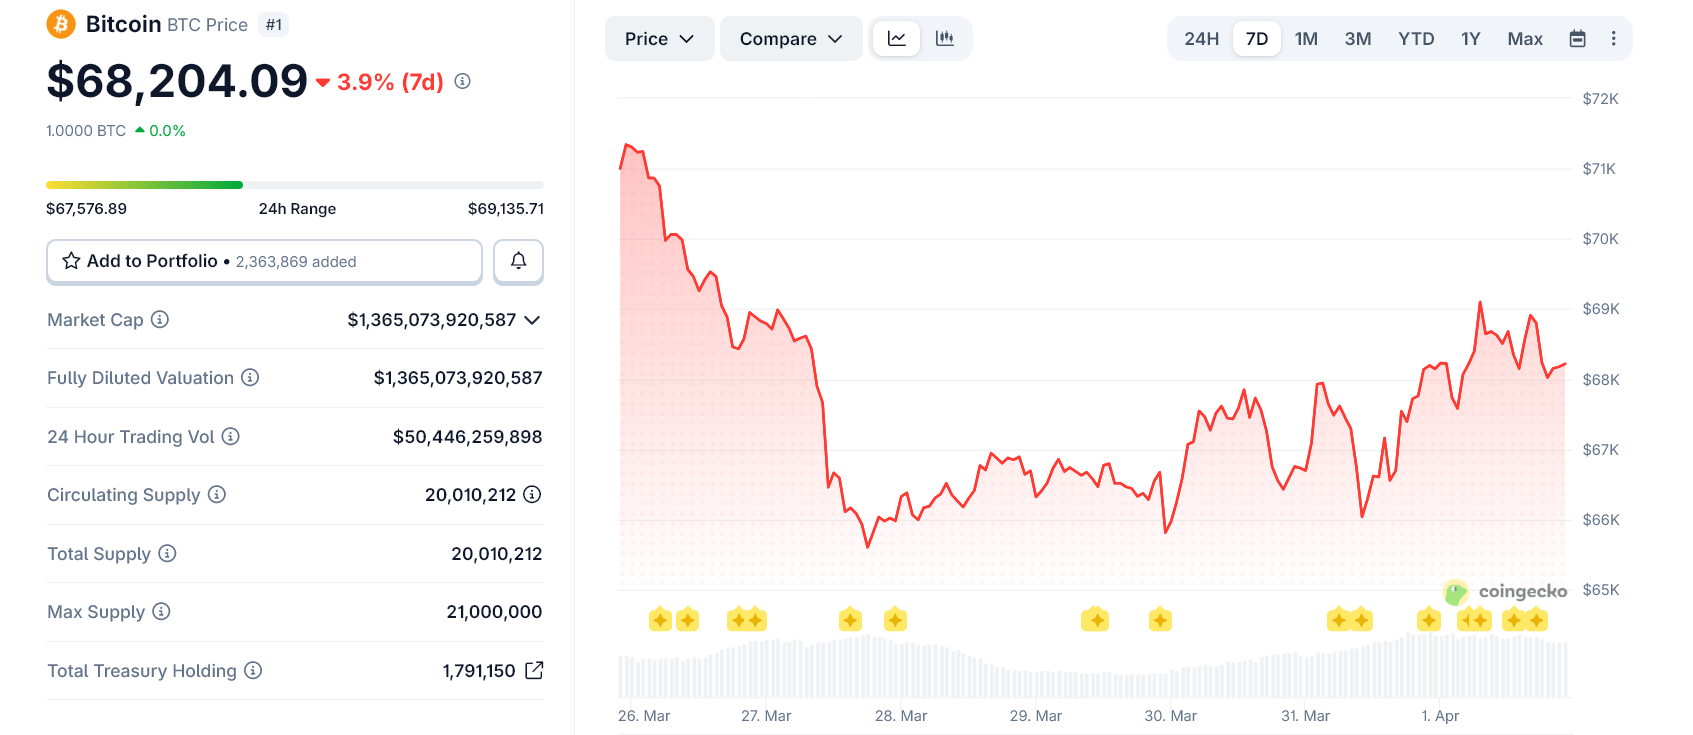
Bitcoin held steady near the $68,000 range on Wednesday as markets braced for a key speech from President Donald Trump on the Iran war. Reports suggest Trump may signal that the conflict is nearing an end, possibly within weeks, while framing recent actions as a strategic success.
However, despite the “war ending soon” narrative gaining traction, Bitcoin’s intraday data shows a more cautious market beneath the surface.
Rallies Sold, Not Built
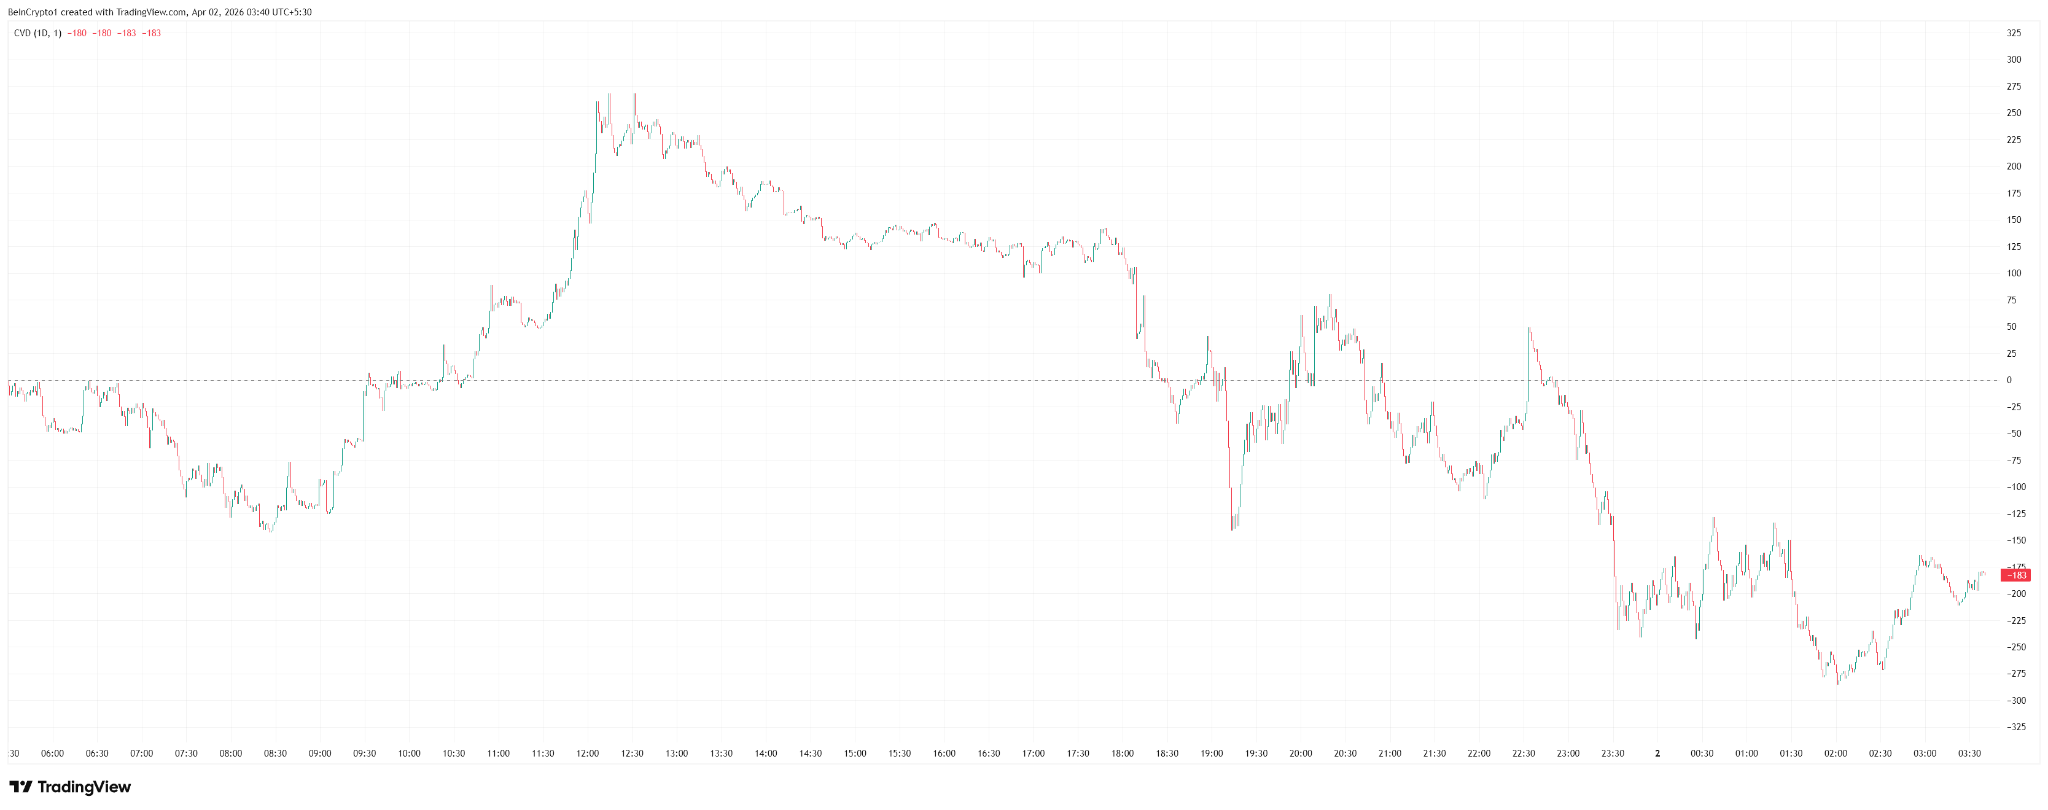
Cumulative Volume Delta (CVD) shows a clear trend: sellers dominated most of the day.
After an early push higher, CVD steadily declined into negative territory. This means more aggressive sell orders hit the market than buys. In simple terms, traders used price strength to exit positions rather than build new ones.
Even during small recoveries later in the day, selling pressure continued. That signals weak conviction behind the upside.
Volume Confirms Distribution
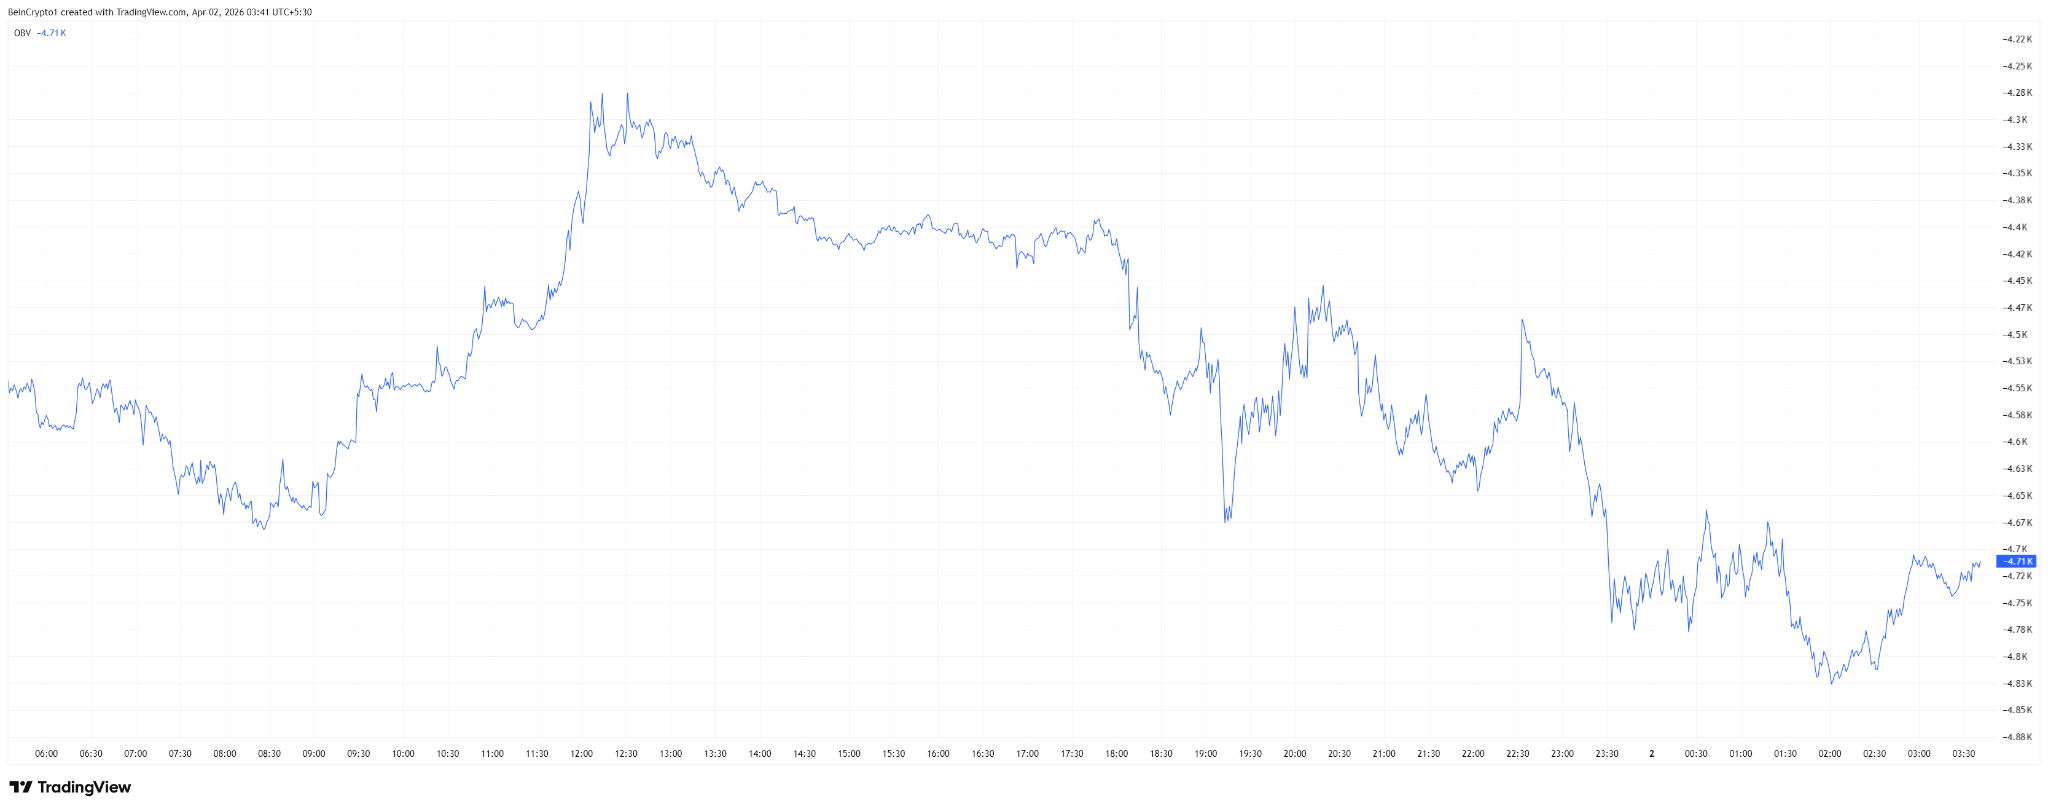
On-Balance Volume (OBV) tells a similar story.
While Bitcoin’s price moved sideways for much of the session, OBV trended lower. This divergence suggests that volume flowed out of the asset, not into it.
Put simply, the market was not accumulating Bitcoin. Instead, it was quietly distributing, with sellers outweighing buyers over the full session.
Late Buyers Step In — But Lightly
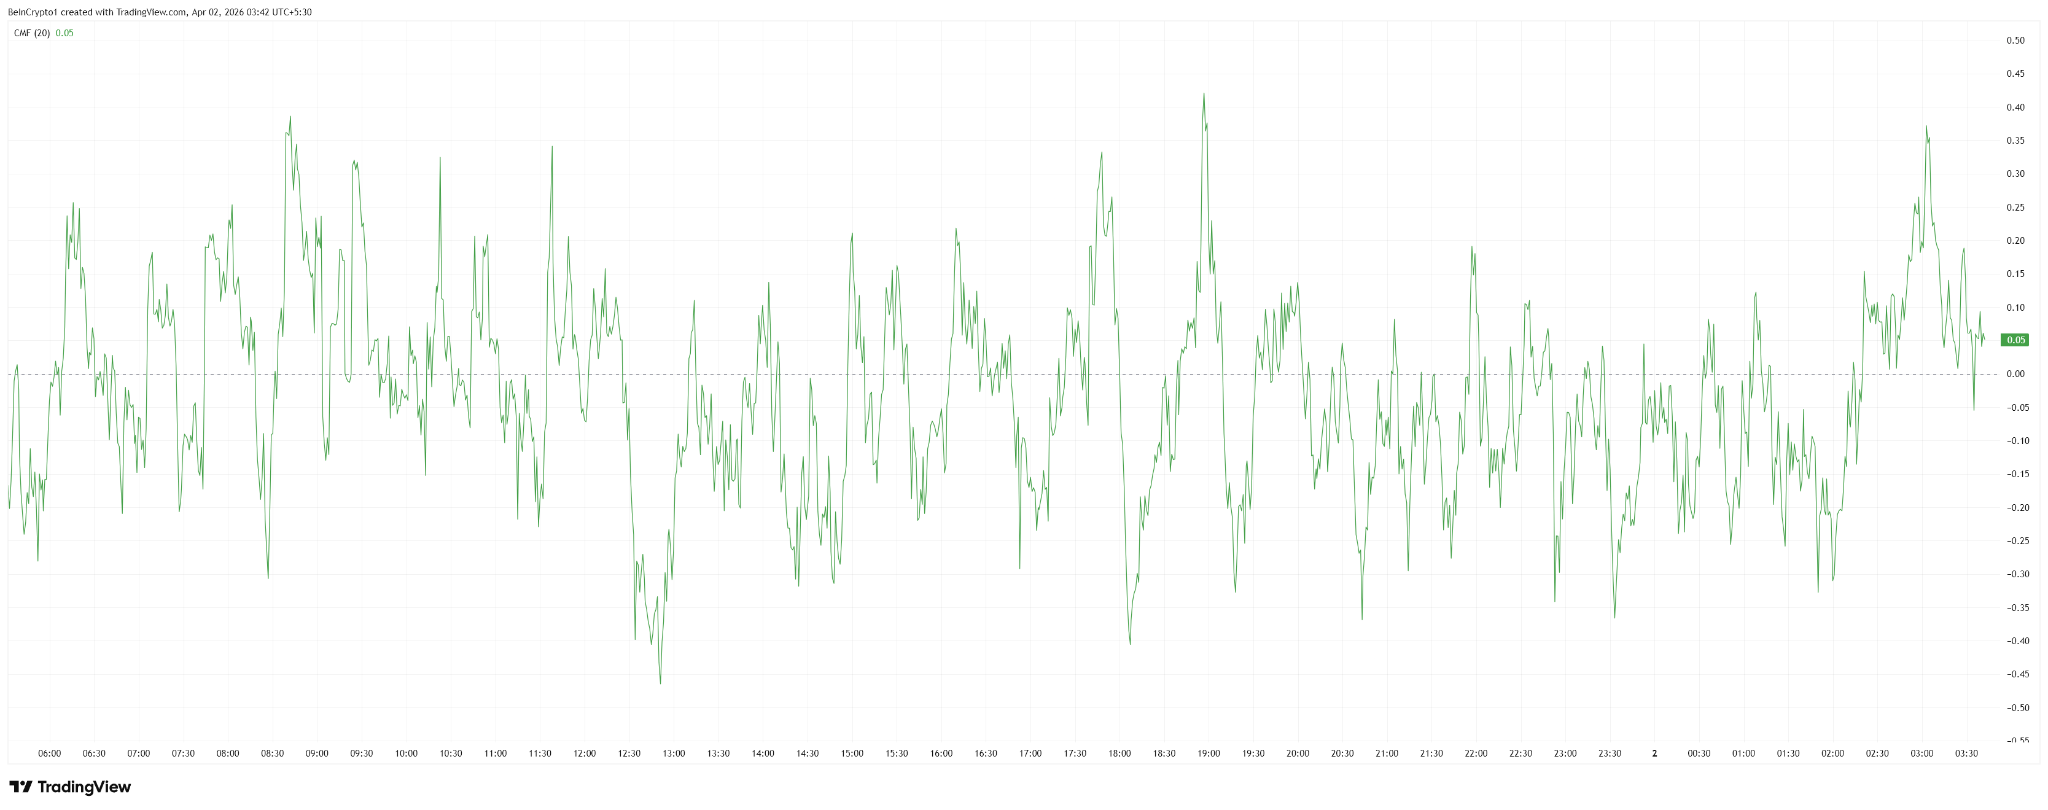
Chaikin Money Flow (CMF) adds a final layer.
The indicator flipped slightly positive toward the end of the day, showing that some buyers stepped in during the final hours. However, the move remained modest and inconsistent.
This suggests dip-buying activity, but not strong or sustained demand.
Market Prepares, But Doesn’t Commit
Taken together, the data points to a market positioning defensively.
Bitcoin appears to be pricing in the possibility of de-escalation. Yet traders are not aggressively betting on a breakout. Instead, they are selling into strength and waiting for confirmation.
The pattern aligns with a broader “sell the news” setup.
A Narrative Priced In — But Not Trusted
If Trump confirms a near-term end to the conflict, markets may react positively at first. However, Bitcoin’s flow data suggests that much of this expectation is already priced in.
For now, the market is not chasing the narrative. It is preparing for it — cautiously.
The post Bitcoin is Positioning for ‘War is Ending’ Narrative Ahead of Trump’s Iran Speech appeared first on BeInCrypto.


Square is waiving processing fees for Bitcoin payments at US merchants for two years, with instant dollar conversion to reduce adoption barriers.
Key takeaways:
-
A Hyperliquid whale placed an $80 million bet against Bitcoin and the S&P 500 while going long on Brent crude oil prices.
-
The whale’s history of massive losses and inconsistent signals suggests the trade could fall on the wrong side of the market.
Bitcoin (BTC) showed strength on Wednesday, bouncing back from Tuesday’s $66,000 low after President Donald Trump teased a potential ceasefire in the US and Israel-Iran war. Even with Bitcoin trading above $68,000, one whale used Hyperliquid DEX to place an $80 million bet on a market collapse.
Traders are now watching closely to see if this whale’s massive position signals a looming Bitcoin price drop.

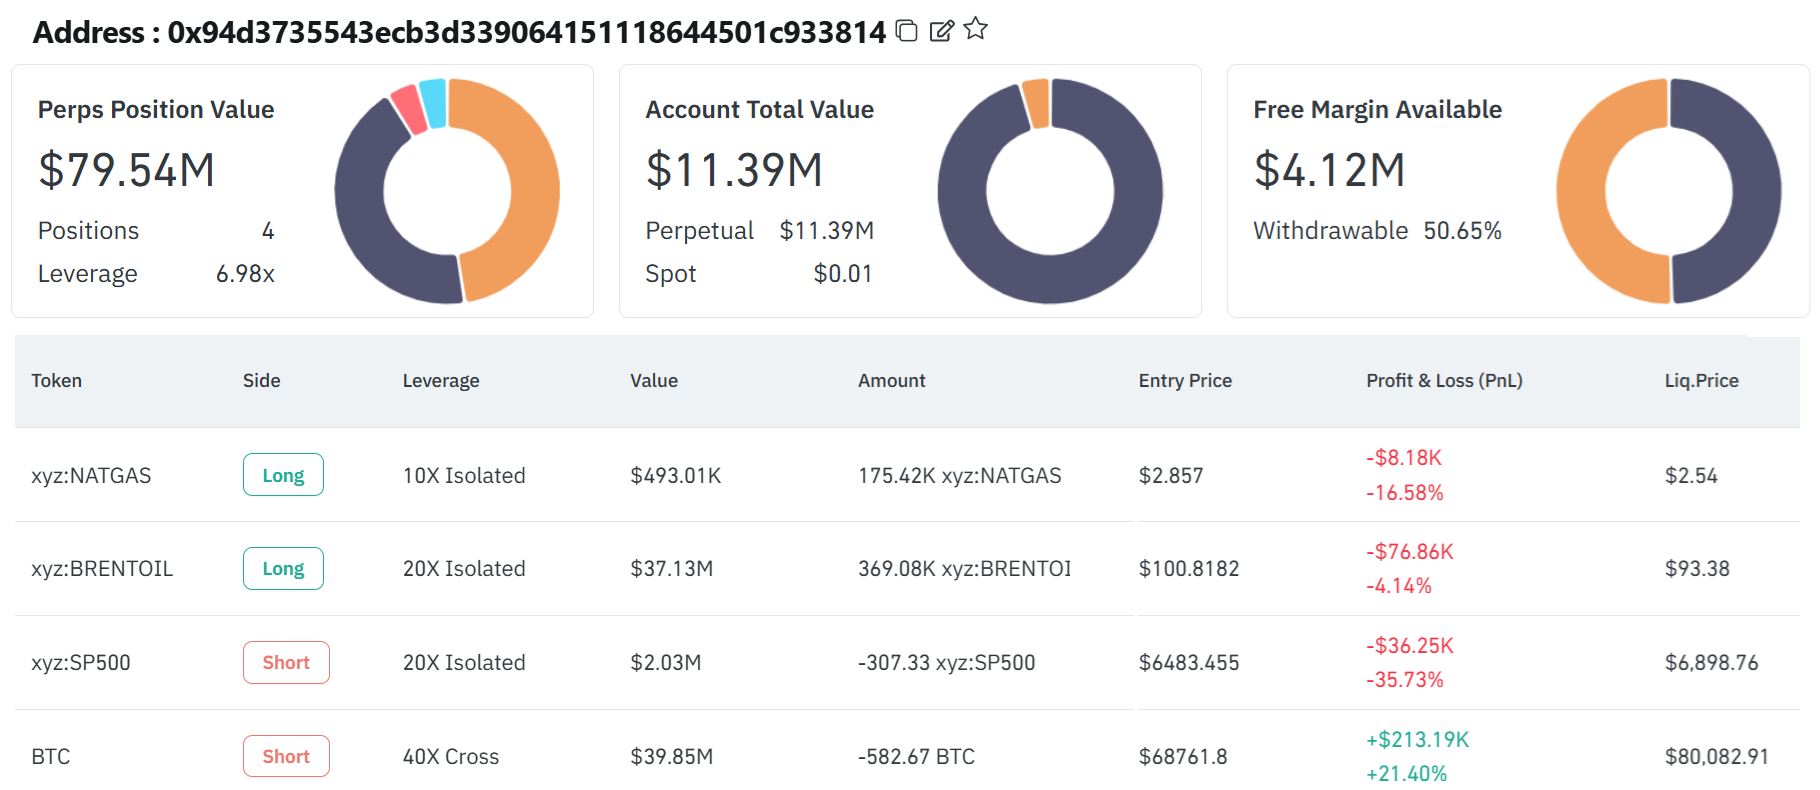
The Hyperliquid whale, linked to address 0x94d373…c933814, carefully built this nearly $80 million leveraged position between Tuesday and Wednesday. The trade includes a $40 million short (sell) on Bitcoin futures near $68,760, a $2 million short on synthetic S&P 500 Index contracts, and a $37 million long (buy) in synthetic Brent oil contracts.

The whale’s aggregate position leverage stood at 7 times, indicating high conviction. The Bitcoin futures liquidation price was $80,083, while the Brent oil position would be forcefully terminated above $93. The timing of the trade is curious as S&P 500 Index futures gained 4% between Tuesday and Wednesday as traders anticipate the US and Israel-Iran war dissipating over the next few weeks.
On Wednesday, President Trump said “Iran’s New Regime President” is considering a “ceasefire,” although the conditions to fully reopen the Strait of Hormuz remain unknown. Iran demands reparations and sovereignty. Thus, one could assume that the Hyperliquid whale is counter-trading the market’s optimistic take, betting that Brent crude oil prices will jump while Bitcoin loses its value.
This Hyperliquid whale previously lost $40 million
This address belongs to a particularly unlucky whale, or at least one who has been extremely unsuccessful since late January. The Hyperliquid whale apparently uses bots for execution, given the sheer number of small trades that build into huge positions, but it still managed to lose $37 million in its first month of activity in December 2025.
The same user was flagged by X user ‘lookonchain’ on Feb. 5 after taking a massive loss on leveraged bullish bets on Ether (ETH), Bitcoin, Solana (SOL), and XRP (XRP).

According to the analysis, the whale had previously made $25 million in profits from shorts in multiple cryptocurrencies, but decided to flip the position on Feb. 4, resulting in a $40 million loss. There is no way to know exactly what triggered this entity to place those bets, but the event proves that even whales can misinterpret the market.
Related: Warren Buffett bought $17B in US T-bills: A bad omen for Bitcoin price?
The erratic signals from President Trump regarding a potential full-on invasion and the war in Iran leave room for opposing views. Iranian Foreign Minister Abbas Araghchi denied there were talks for a ceasefire but confirmed to Al Jazeera on Tuesday that there was an intention to end the war, according to CNBC.
Given the history of this whale’s market positioning and its track record of losing trades, it’s possible that the current $80 million bet may fall on the wrong side of the market.
This article is produced in accordance with Cointelegraph’s Editorial Policy and is intended for informational purposes only. It does not constitute investment advice or recommendations. All investments and trades carry risk; readers are encouraged to conduct independent research before making any decisions. Cointelegraph makes no guarantees regarding the accuracy or completeness of the information presented, including forward-looking statements, and will not be liable for any loss or damage arising from reliance on this content.

UWA considering Karratha campus
The Next Crypto Bull Run Won’t Be About Coins or Viral Hype
Weezer’s Rivers Cuomo Graduated From This Ivy League School at the Height of Their Fame


-

 News Videos7 days ago
Parliament publishes latest register of MPs’ financial interests
-

 Business6 days ago
Instagram, YouTube Found Responsible for Teen’s Mental Health Struggle in Historic Ruling
-
 Tech6 days ago
Intercom’s new post-trained Fin Apex 1.0 beats GPT-5.4 and Claude Sonnet 4.6 at customer service resolutions
-

 NewsBeat5 days ago
The Story hosts event on Durham’s historic registers
-

 Sports5 days ago
Sweet Sixteen Game Thread: Tide vs Michigan
-
Entertainment2 days ago
Fans slam 'heartbreaking' Barbie Dream Fest convention debacle with 'cardboard cutout' experience
-
 Entertainment4 days ago
Lana Del Rey Celebrates Her Husband’s 51st Birthday In New Post
-
Crypto World1 day ago
Dems press CFTC, ethics board on prediction-market insider trades
-

 Tech3 days ago
The Pixel 10a doesn’t have a camera bump, and it’s great
-

 Sports1 day ago
Tallest college basketball player ever, standing at 7-foot-9, entering transfer portal
-

 Crypto World3 hours ago
Gold Price Prediction: Worst Month in 17 Years fo Save Haven Rock
-

 Tech2 days ago
EE TV is using AI to help you find something to watch
-

 Entertainment7 days ago
HBO’s Harry Potter Series Will Definitely Fail For One Big Reason, And It’s Not J.K. Rowling Or Snape
-

 Tech2 days ago
Apple will hide your email address from apps and websites, but not cops
-

 Tech2 days ago
How to back up your iPhone & iPad to your Mac before something goes wrong
-

 Tech2 days ago
Flipsnack and the shift toward motion-first business content with living visuals
-

 Fashion6 days ago
En Vogue in Brown Leather and Tailored Neutrals by Atelier Savoir, Styled by J Bolin
-

 Politics2 days ago
Should Trump Be Scared Strait?
-

 Crypto World2 days ago
U.S. rule change may open trillions in 401(k) funds to crypto
-

 Fashion5 days ago
Weekly News Update, 3.27.26 – Corporette.com
You must be logged in to post a comment Login