
Crypto World
Dogecoin price forms swing failure pattern; relief bounce next?
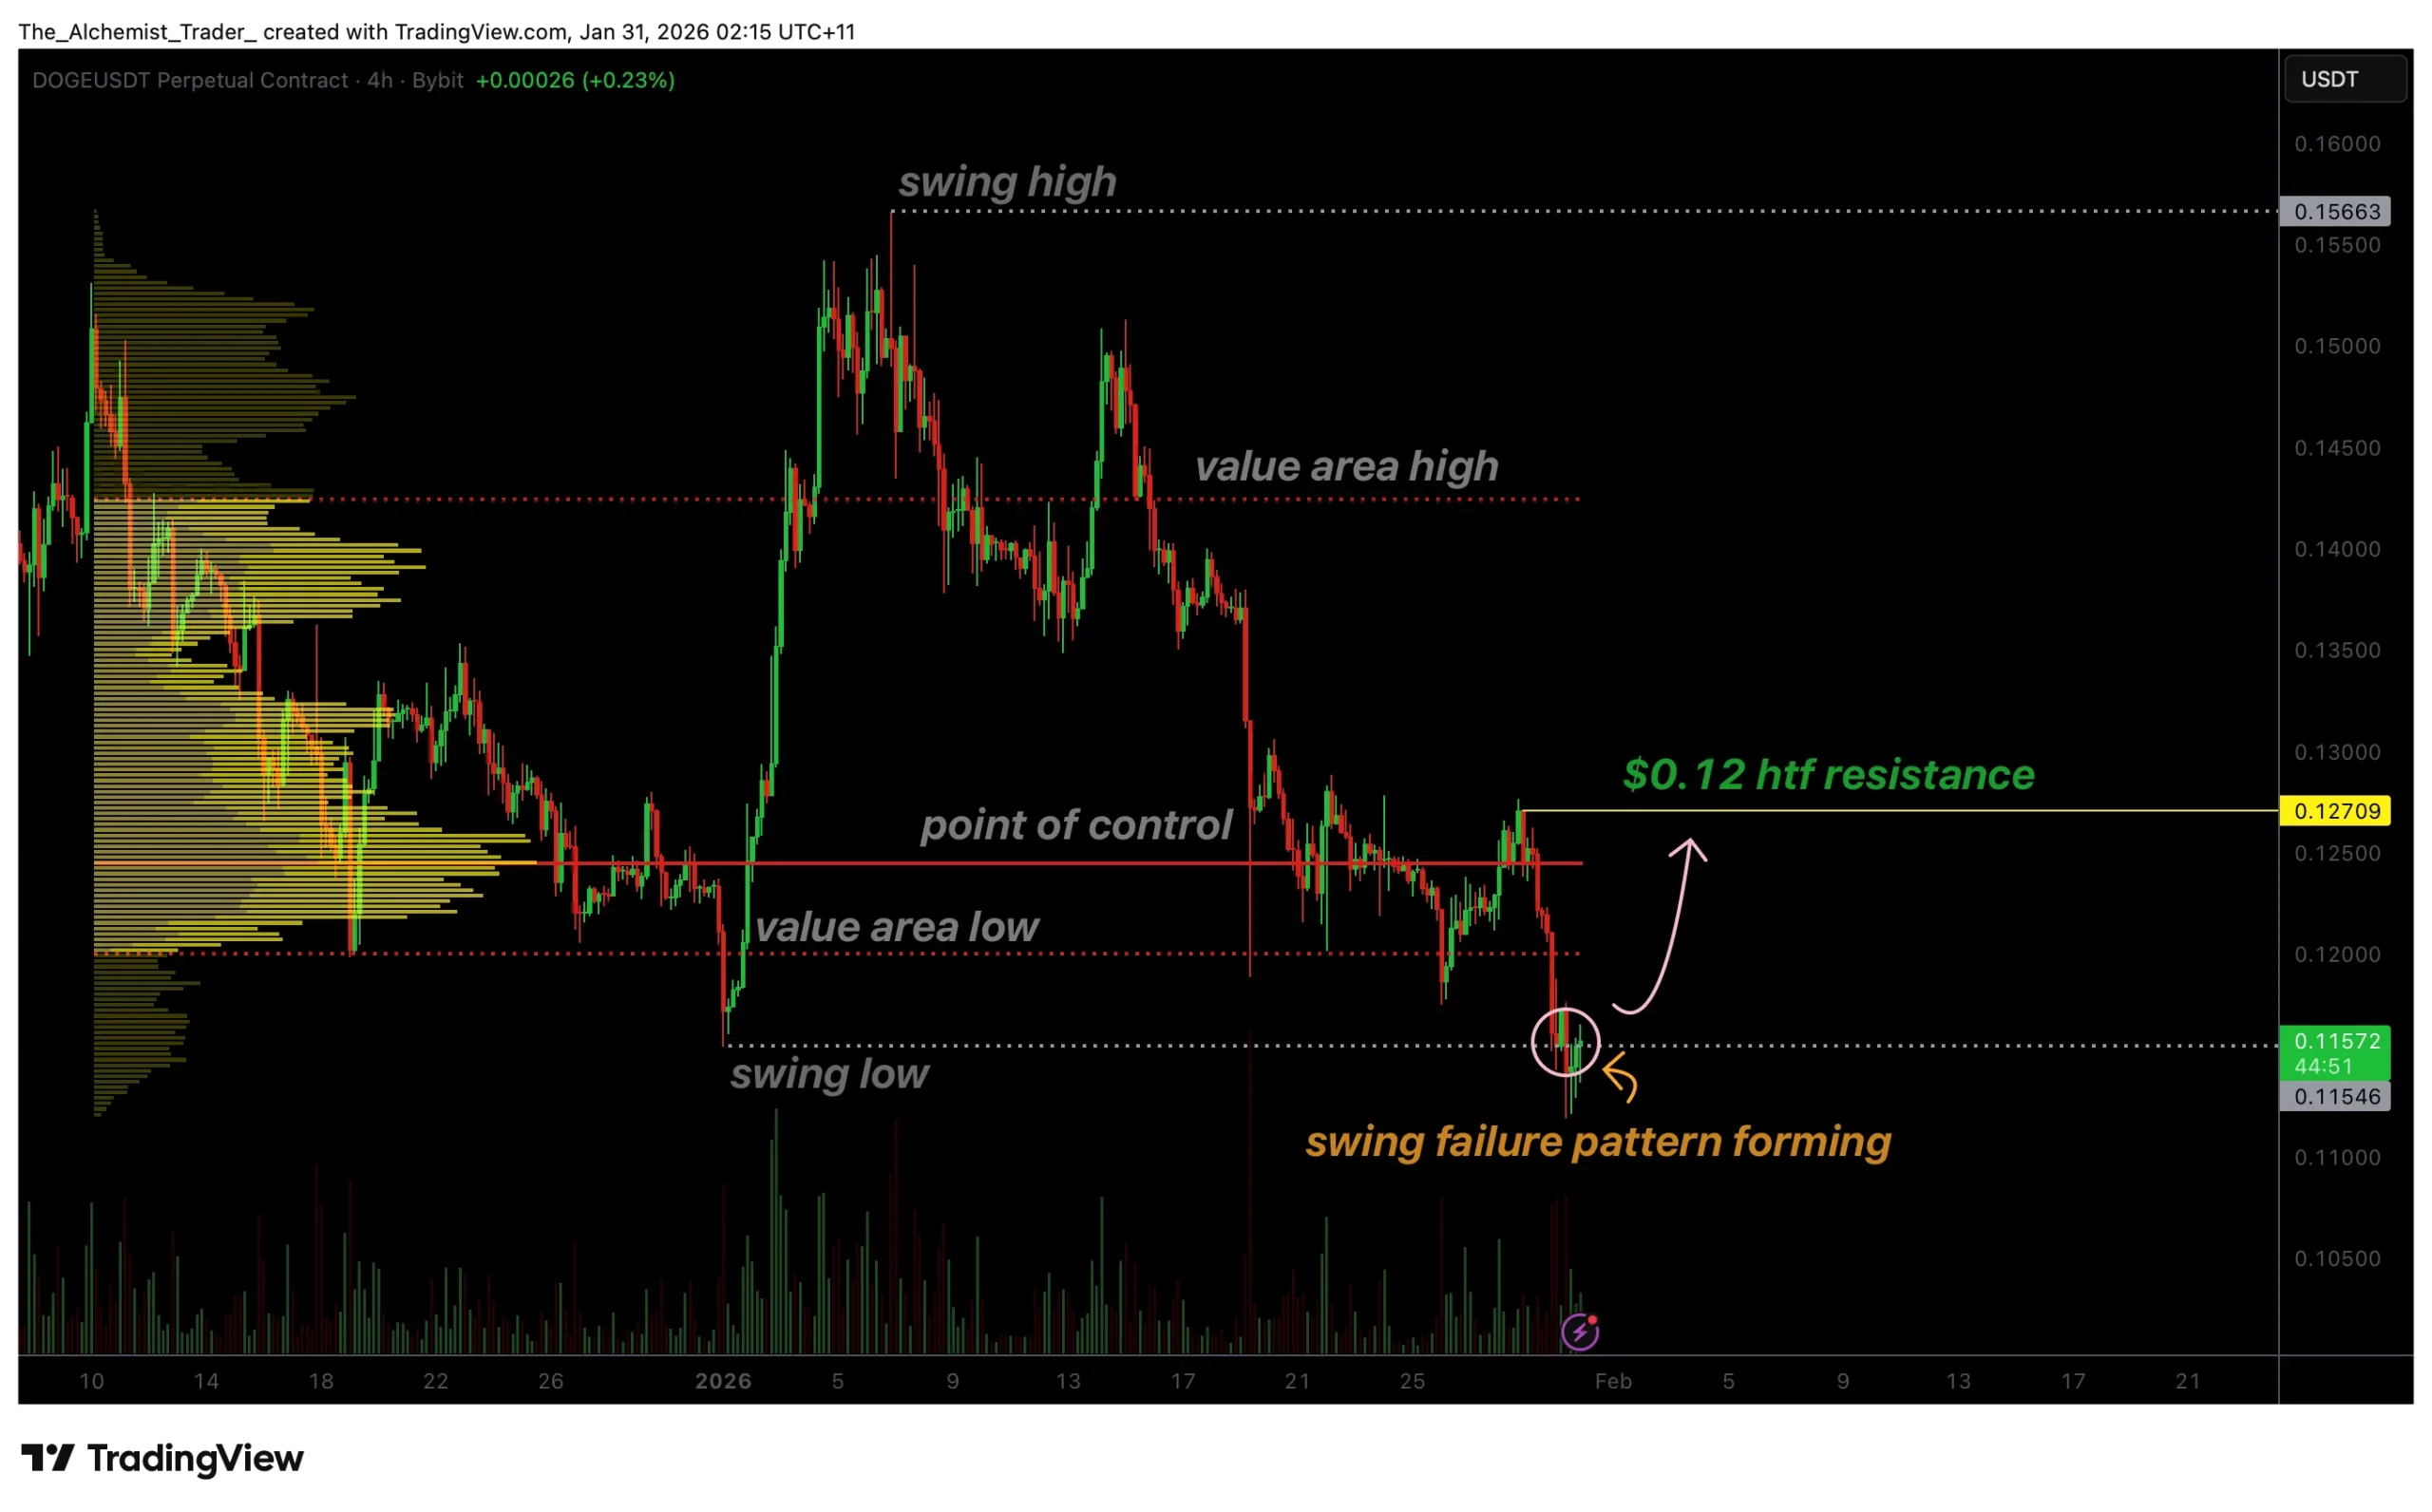
Dogecoin price is stabilizing near $0.11 after a sharp sell-off, with a developing swing failure pattern hinting that a short-term relief bounce may be forming.
Summary
- DOGE rejected from $0.12 and rotated down to the $0.11 swing low.
- Wicks below support suggest a swing failure pattern and liquidity sweep.
- Holding above $0.11 opens the path for a relief bounce toward $0.12.
Dogecoin (DOGE) price is showing early signs of stabilization following a corrective move that unfolded after price was rejected from the $0.12 high-time-frame resistance. The rejection marked a shift in short-term momentum, with DOGE losing both the point of control and the value area low, accelerating downside pressure.
Price has since rotated directly into the $0.11 swing low, where lower-time-frame consolidation is now taking place. This behavior is drawing attention to a potential swing failure pattern (SFP) a setup that often precedes short-term reversals when confirmed by price acceptance and improving demand.
Dogecoin price key technical points
- $0.11 swing low under test: Price is consolidating after a sharp downside move.
- Swing failure pattern forming: Liquidity appears to have been swept below prior lows.
- $0.12 resistance remains the upside target: A relief bounce could rotate back into prior resistance.

The recent decline began after Dogecoin failed to hold above the $0.12 resistance, a level that had previously capped upside attempts. Once price lost the point of control and the value area low, downside momentum increased rapidly. This type of move is typical when market participants who entered higher are forced to exit positions, adding to selling pressure.
Rather than finding immediate support above prior levels, DOGE traded swiftly toward the $0.11 swing low, a zone where historical demand has previously emerged.
Understanding the swing failure pattern
A swing failure pattern occurs when price briefly moves below a key swing low (or above a swing high) but fails to sustain acceptance beyond that level. Instead, price reclaims the level on a closing basis, signaling that the breakout was driven by stop-loss liquidity rather than genuine directional conviction.
In Dogecoin’s case, wicks below the $0.11 swing low suggest that sell-side liquidity was taken, but follow-through has been limited. This behavior often indicates that larger participants are absorbing supply rather than pressing price lower.
Demand begins to show at lows
While overall structure remains fragile, the fact that Dogecoin is holding above the swing low on candle closes is an important early signal. Repeated failures to close decisively below support imply that demand is beginning to respond at discounted prices.
This does not confirm a trend reversal on its own, but it does increase the probability of a short-term relief bounce, particularly if bullish volume begins to expand from this region.
Relief bounce versus trend change
It is important to distinguish between a relief bounce and a full trend reversal. A swing failure pattern typically leads to a squeeze or bounce as short positions unwind and price rotates back toward areas of prior supply. For Dogecoin, the most logical upside objective in this scenario is a move back toward $0.12, where high-time-frame resistance remains firmly in place.
A sustained move above $0.12 would be required to materially improve market structure. Until then, any upside should be viewed as corrective within a broader range.
Market structure still cautious
From a market structure perspective, Dogecoin has yet to establish higher highs or reclaim key value levels. This keeps the broader outlook cautious despite the constructive lower-time-frame signal. Swing failure patterns are most effective when they occur at well-defined levels, which is the case here, but confirmation remains essential.
Failure to hold $0.11 on a closing basis would invalidate the setup and reopen the door for deeper downside exploration.
What to expect in the coming price action
Dogecoin is at a short-term inflection point. As long as price holds above the $0.11 swing low, the developing swing failure pattern supports the case for a relief bounce toward $0.12 resistance. Increasing bullish volume would strengthen this scenario and suggest that sellers are losing control in the near term.
However, until DOGE reclaims higher value levels, any rally is likely to remain corrective rather than trend-defining. The next sessions will be critical in determining whether this pattern resolves into a meaningful bounce, or fails and leads to further downside.


The U.S. Securities and Exchange Commission (SEC) named Gibson Dunn partner David Woodcock as its new enforcement director on Wednesday, filling a vacancy left by Margaret Ryan’s abrupt resignation last month.
Woodcock will begin leading the agency’s 1,000-person enforcement division on May 4. Acting Director Sam Waldon will continue in the role until then.
Why Ryan’s Exit Still Shadows the Appointment
Ryan resigned on March 16 after just six months. She reportedly pushed to pursue fraud charges against figures in President Donald Trump’s orbit, including crypto entrepreneur Justin Sun.
SEC Chair Paul Atkins and other Republican appointees resisted those efforts, according to multiple reports.
The SEC settled its case against Sun and three affiliated companies for $10 million in March. Sun neither admitted nor denied the allegations.
He has been a major investor in the Trump family’s World Liberty Financial project.
Senator Richard Blumenthal has since demanded agency records, calling the enforcement posture under Atkins a “pay-to-play” regime.
Woodcock’s Profile and the Enforcement Slowdown
Woodcock led the SEC’s Fort Worth regional office from 2011 to 2015. He lacks clear ties to digital asset policy.
His most recent roles include partner at Gibson, Dunn & Crutcher and assistant general counsel at ExxonMobil.
His appointment comes the same week the SEC released its fiscal 2025 enforcement report. The agency filed 456 actions, down 22% from the prior year’s 583.
The division also lost 18% of its staff during that period.
I am incredibly pleased to have David rejoin the SEC at this critical time, as we continue to focus on the types of misconduct that inflict the greatest harm to investors,” read an excerpt in the announcement, citing Atkins.
Could Woodcock continue the agency’s retreat from crypto enforcement or will he chart a different course?
Subscribe to our YouTube channel to watch leaders and journalists provide expert insights
The post SEC’s New Enforcement Chief David Woodcock Has No Crypto Background appeared first on BeInCrypto.

TLDR
- Ripple recently minted 9.9 million RLUSD tokens on the Ethereum blockchain.
- The minting follows a series of large RLUSD token burns conducted by Ripple.
- The newly minted RLUSD tokens are backed 1:1 by USD cash and equivalents.
- Ripple’s strategy of minting and burning tokens helps balance RLUSD supply and demand.
- The recent minting expands RLUSD’s availability for trading and use on the Ethereum network.
Ripple has recently minted 9.9 million RLUSD tokens on the Ethereum blockchain. This follows weeks of RLUSD burns and comes as part of Ripple’s ongoing supply management. The minting process is initiated when there is demand for more RLUSD from exchanges, institutions, or retail users.
New RLUSD Minting Follows Burn Process
The official Ripple USD (RLUSD) Treasury account added 9.9 million RLUSD tokens to the Ethereum blockchain. This action comes after a series of significant burns in March and April, where Ripple removed over $230 million in RLUSD tokens from circulation. These token burns were part of Ripple’s strategy to balance the supply of RLUSD between the XRP Ledger and Ethereum.
“Minting occurs when there is demand for RLUSD, and the issuer, the Ripple Treasury smart contract, creates new tokens,” Ripple explained. These new tokens are backed 1:1 by USD cash and equivalents, held in regulated custody accounts. As such, the minted tokens are fully supported by traditional assets, ensuring their value.
With this minting, the total RLUSD supply increases, and the tokens are now available for use and trading. Ripple’s approach of minting and burning tokens is designed to keep the supply of RLUSD in line with market demand. The goal is to maintain the stablecoin’s value and ensure liquidity within Ripple’s ecosystem.
Ripple Strengthens RLUSD Presence in the Crypto Market
Ripple’s RLUSD continues to strengthen its position in the crypto market with increased demand. The recent minting adds to the ongoing expansion of RLUSD, a stablecoin designed to facilitate cross-border payments. According to a recent report, Bitrue exchange now supports trading RLUSD against tokenized gold options like PAXG and XAUT.
The stablecoin’s reserves are valued at $1.56 billion, surpassing the market supply of $1.49 billion tokens. This highlights Ripple’s ongoing growth in the stablecoin sector. Binance has also integrated RLUSD on the XRP Ledger, allowing users to transact RLUSD directly on the network.
Ripple launched RLUSD on December 17, 2024, with the aim of providing liquidity and improving cross-border payments. With multiple exchange integrations and strong backing, RLUSD is becoming more embedded in the broader crypto ecosystem.

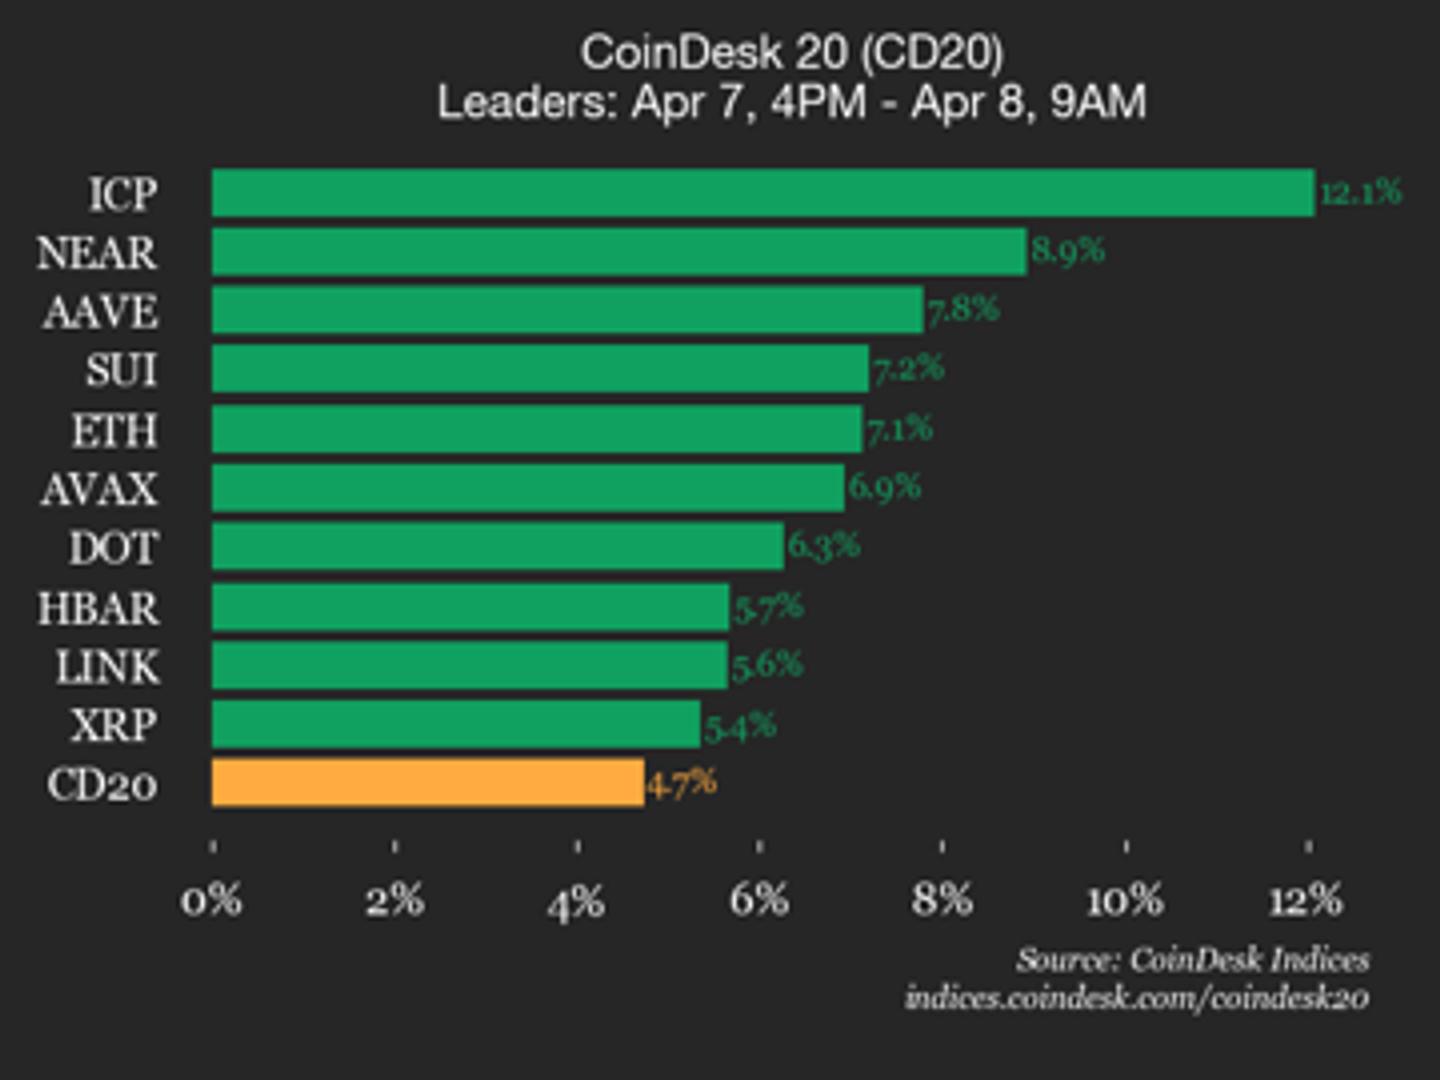

NEAR Protocol (NEAR) joined Internet Computer (ICP) as a top performer, climbing 8.9% from Tuesday.
Strategy Executive Chairman Michael Saylor rejected the New York Times investigation identifying Adam Back as Bitcoin’s (BTC) pseudonymous creator, Satoshi Nakamoto.
Saylor said stylometry is “interesting, but not proof.”
Why Saylor Demands Cryptographic Evidence
Saylor pointed to contemporaneous 2008 emails between Satoshi and Back as evidence that the two were separate people.
Back first received a message from Satoshi in August 2008 confirming the Hashcash citation in the upcoming white paper.
“Stylometry is interesting, but not proof. The contemporaneous emails between Satoshi and Adam Back suggest they were distinct individuals. Until someone signs with Satoshi’s keys, every theory is just narrative,” said Saylor.
That position aligns with his broader philosophy. Saylor has repeatedly described Satoshi’s disappearance as a deliberate act that strengthened BTC by removing any central authority figure.
He once wrote that Satoshi “created a way, gave it away, and walked away.”
What MicroStrategy Has at Stake
Strategy holds 766,970 BTC acquired for roughly $54.57 billion, making it the largest corporate holder globally.
That position depends on BTC functioning as a decentralized, leaderless monetary network, not on who designed it.
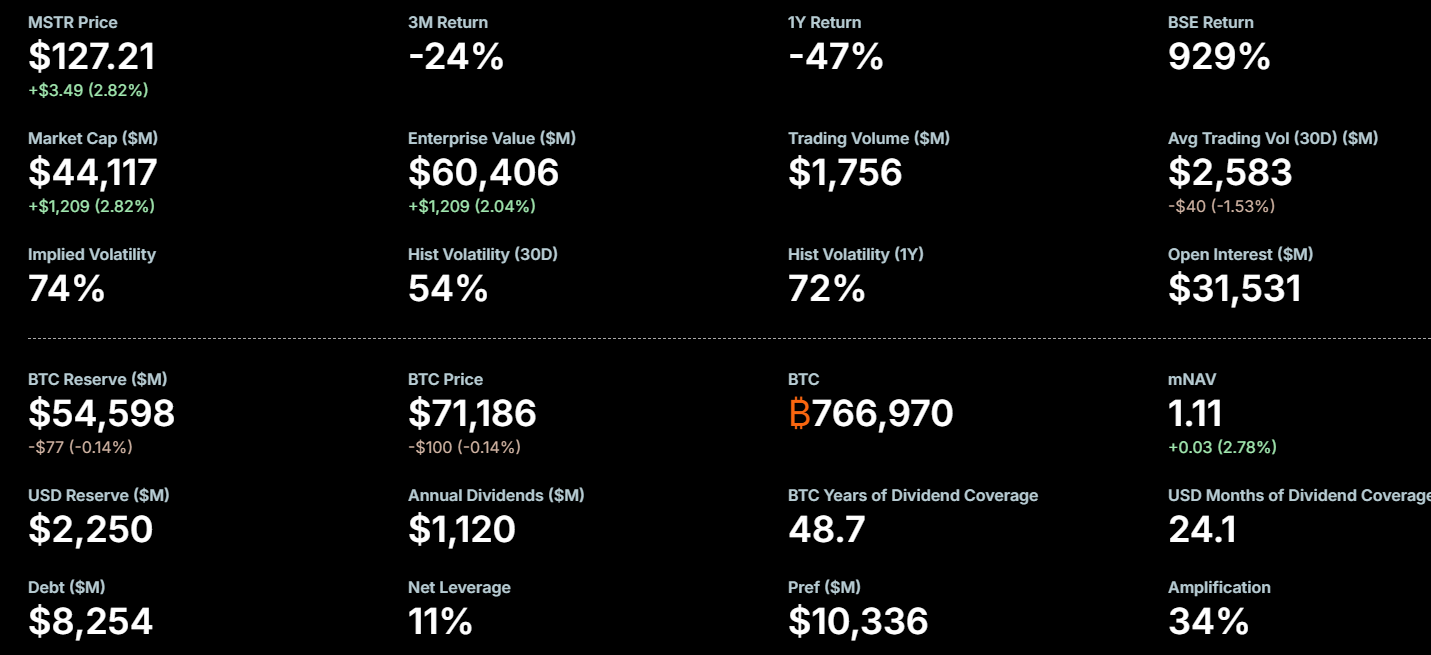
BTC dipped roughly 2.4% after the NYT article dropped, falling from $68,269 to $66,634. Saylor has previously dismissed such moves as temporary noise, calling volatility “Satoshi’s gift to the faithful.”
Back himself firmly denied being Satoshi, attributing writing overlaps to shared cypherpunk interests and confirmation bias.
The stylometric analysis, led by computational linguist Florian Cafiero, found Back as the closest match among 12 suspects but described the results as inconclusive.
For Saylor, the answer remains simple. Without a signature from Satoshi’s private keys, no investigation settles the question.
The post MicroStrategy’s Michael Saylor Doesn’t Buy The Adam Back Is Satoshi Story appeared first on BeInCrypto.

Standard Chartered is planning to reabsorb the client-facing custody operations of Zodia Custody into the digital assets division of its Corporate and Investment Bank (CIB).
The restructuring, which could be announced as early as this month, would leave Zodia operating only as a standalone Software-as-a-Service (SaaS) platform for custody technology, according to Bloomberg sources familiar with the matter.
From Incubation to Independence to Reabsorption
Standard Chartered established Zodia Custody in late 2020 through its innovation arm SC Ventures, alongside Northern Trust.
The custodian later attracted minority investors, including SBI Holdings, National Australia Bank, and Emirates NBD. It now employs around 150 people across seven offices globally.
Zodia had been gaining traction. In January 2026, it became the first custodian to support AUDM, an Australian dollar stablecoin.
The following month, it launched Zodia Switch, enabling clients to swap assets directly within the custody platform without external pre-funding.
However, Standard Chartered launched its own Luxembourg-based digital asset custody last year and rolled out institutional crypto trading separately.
The overlap between parent and subsidiary made a restructuring likely.
It remains unclear whether Standard Chartered has consulted Zodia’s minority shareholders.
Banks Are Pulling Custody In-House
The digital asset custody market currently exceeds $1 trillion and is projected to reach $7 trillion by 2035 at a compound annual growth rate of roughly 23.7%.
According to the 2026 EY-Parthenon survey, 73% of institutional investors plan to increase digital asset allocations this year.
That growing demand is pulling banks deeper into direct custody. State Street and BNY Mellon have scaled internal digital custody divisions.
Morgan Stanley filed for a dedicated national trust bank charter in February to custody and stake crypto assets under federal supervision.
Analysts see the restructuring as a turning point, with some arguing that when a Tier-1 global bank moves crypto custody into its investment bank, it stops being a contest between crypto and TradFi and becomes crypto embedded inside TradFi.
Zodia was originally built as a standalone vehicle to test the waters safely, and its reabsorption only happens when the parent sees digital assets as real, fee-generating capital markets business.
Meanwhile, others suggest a wider pattern of traditional banks pulling digital asset functions from experimental ventures into core regulated operations, noting that running parallel services was simply inefficient.
“…The suits finally realized running the same thing twice is inefficient. Revolutionary,” one user stated.
What This Says About Crypto Custody Independence
The answer appears increasingly clear. Independence for bank-backed custodians served a specific purpose during the experimental phase of 2020-2023, when regulatory uncertainty made arm’s-length structures necessary.
Now that frameworks like MiCA in Europe and the GENIUS Act in the US have reduced that friction, banks no longer need buffer entities to engage with digital assets.
“This mirrors a wider trend of traditional banks pulling digital asset functions from experimental ventures into core regulated ops – driven by frameworks like MiCA and VARA,” the user added.
Zodia’s hybrid outcome is telling. The technology retains standalone value as SaaS, but the actual safekeeping of client assets, the highest-trust and highest-margin piece of the value chain, moves back onto the parent bank’s books.
That distinction reveals what banks truly want to own versus what they are willing to license out.
Crypto-native custodians like Coinbase Custody, BitGo, and Fireblocks still hold nearly half the global market.
Can they defend that share against a banking sector now determined to bring custody in-house?
The post Standard Chartered is Taking Over Full Crypto Custody Platform Zodia appeared first on BeInCrypto.

The Federal Deposit Insurance Corporation a proposed rule that would establish a framework for stablecoin issuers supervised by the FDIC.
The Federal Deposit Insurance Corporation proposed new rules on Tuesday to oversee stablecoins issued through the banking system under the GENIUS Act. The FDIC board of directors voted to advance the proposal, which sets parameters for how stablecoins may be issued and managed by regulated depository institutions.
The proposal represents the FDIC’s formal regulatory framework for stablecoin operations within the traditional banking sector. Details on specific requirements and implementation timelines were included in the Tuesday statement.
Sources: FDIC
This article was generated automatically by The Defiant’s AI news system from publicly available sources.


Polymarket has acquired Brahma to enhance its DeFi infrastructure and trading performance capabilities.
Polymarket has acquired Brahma, a DeFi infrastructure provider, to strengthen its platform’s trading performance and underlying infrastructure. The acquisition was announced on April 8, 2026, and aims to bolster Polymarket’s capabilities in the decentralized finance ecosystem.
Brahma’s integration into Polymarket is expected to enhance the prediction market platform’s technical infrastructure and user experience. The deal represents continued consolidation in the DeFi sector as platforms seek to improve their competitive positioning.
Source: Polymarket
This article was generated automatically by The Defiant’s AI news system from publicly available sources.

Iran will collect crypto payments as transit fees from oil tankers passing through the Strait of Hormuz during the two‑week ceasefire with the U.S., an industry official told FT.
Hamid Hosseini, spokesperson for Iran’s Oil, Gas and Petrochemical Products Exporters’ Union, said that crypto-denominated tolls will be charged for fully loaded vessels as the nation seeks to “monitor what goes in and out of the strait to ensure these two weeks aren’t used for transferring weapons.”
Hosseini’s comments signal Tehran’s willingness to use cryptocurrency for toll payments, highlighting the expanding real‑world use cases of digital assets in high-stakes geopolitical developments.
This isn’t new — nations at odds with the U.S. or its allies have long turned to crypto as a way to bypass traditional banking channels that leave a paper trail. Russia has indeed used cryptocurrency as part of broader efforts to evade Western sanctions, and in Iran’s case, Tehran is exploring digital payments as it looks to unlock funds for rebuilding the war-destroyed infrastructure.
The proposed framework will require tankers to notify cargo details to Iranian authorities via email, and the toll will reportedly be calculated at $1 per barrel of oil. Authorities will then instruct on how to settle the fee in digital assets, with officials citing bitcoin as a potential payment method.
Hosseini suggested that empty tankers would transit without charge, but fully laden vessels must comply with the reporting and crypto payment process before being cleared for passage.
“Once the email arrives and Iran completes its assessment, vessels are given a few seconds to pay in Bitcoin, ensuring they can’t be traced or confiscated due to sanctions,” he said.
The comments also indicated Tehran may direct traffic along the northern route of the Strait close to its coastline, a move that could raise questions about whether Western and Gulf‑linked shipping firms are prepared to navigate the risky Iranian waters.
Crypto World
Deposit Flight Concerns Over Stablecoin Yield Are ‘Quantitatively Small’: White House Report


A White House Council of Economic Advisers study released Wednesday concludes that banning stablecoin yield would have minimal impact on bank lending and would harm consumers.
The White House Council of Economic Advisers released a study Wednesday examining stablecoin yield and its impact on deposit flight and bank lending. The report finds that eliminating stablecoin yield would increase bank lending by just 0.02%—approximately $2.1 billion—while resulting in a net welfare loss to consumers. The findings directly contradict concerns from some Senate Banking lawmakers who had pressed the White House to release the report.
The report concludes that deposit flight concerns related to stablecoin yield are “quantitatively small,” noting that most stablecoin reserves remain within the banking system with only a limited share removed from lending activity. The executive summary states: “a yield prohibition would do very little to protect bank lending, while forgoing the consumer benefits of competitive returns on stablecoin holdings.”
Sources: White House
This article was generated automatically by The Defiant’s AI news system from publicly available sources.


Standard Chartered PLC is reportedly seeking to fully acquire Zodia Custody Ltd. to merge it with one of its digital asset divisions, sources close to the matter told Bloomberg on Wednesday.
The ‘restructuring’ plan, which could come as soon as this month, contemplates merging Zodia’s crypto custody business into one of the investment bank’s divisions that provides similar services, the sources told Bloomberg.
The sources also said Standard Chartered is considering allowing Zodia Custody to continue operating as a separate software-as-a-service (SAAS) business for cryptocurrency custody.
The people close to the negotiations, according to Bloomberg, did not clarify whether Standard Chartered has approached Zodia Custody’s minority shareholders, which include Northern Trust Corp., Emirates NBD Bank PJSC, National Australia Bank Ltd. and SBI Holdings Inc.
Emirates NBD and Northern Trust declined to comment, while SBI Holdings and NAB did not immediately respond to requests for comment, Bloomberg wrote.
Standard Chartered told CoinDesk it would not comment on the news of the potential takeover. Zodia did not immediately respond to a request for confirmation.
Standard Chartered has expanded its digital asset footprint in recent years. The bank launched its own digital asset custody services out of Luxembourg in January last year and introduced crypto trading for institutional clients last summer, becoming one of the first global banks to offer spot bitcoin and ether trading.
Banks have ramped up their digital asset activities as regulatory clarity improves in key regions such as the U.S. and Europe. Crypto custody in particular has become a competitive battleground, with firms including State Street, BNY Mellon and Morgan Stanley expanding their presence, with Morgan Stanley recently naming Coinbase and BNY Mellon as custodians for a proposed bitcoin ETF.
Zodia, which was aimed at financial institutions and began custodianship of emeralds in June 2025, raised $18.5 million in a Series A funding round in July of last year to expand and develop its stablecoin payment services.
The firm was originally established in 2020 as a joint venture between Standard Chartered and Northern Trust and has since raised external capital multiple times. Zodia Custody employs around 150 people across seven offices in London, Dublin, Luxembourg, Singapore, the UAE, Sydney and Hong Kong.
SEC’s New Enforcement Chief David Woodcock Has No Crypto Background
Used Hammer & Knife To Fatally Attack Parents

Financial Derivatives – An Introduction


-

 NewsBeat6 days ago
Steven Gerrard disagrees with Gary Neville over ‘shock’ Chelsea and Arsenal claim | Football
-

 Business6 days ago
No Jackpot Winner and $194 Million Prize Rolls Over
-

 Fashion5 days ago
Weekend Open Thread: Spanx – Corporette.com
-

 Crypto World7 days ago
Gold Price Prediction: Worst Month in 17 Years fo Save Haven Rock
-

 Business5 days ago
Expert Picks for Every Need
-

 Business3 days ago
Three Gulf funds agree to back Paramount’s $81 billion takeover of Warner, WSJ reports
-

 Sports4 days ago
India men’s 4x400m and mixed 4x100m relay teams register big progress | Other Sports News
-

 Business7 days ago
Login and Checkout Issues Spark Merchant Frustration
-

 Tech23 hours ago
How Long Can You Drive With Expired Registration? What Florida Law Says
-
Business3 days ago
No Jackpot Winner, Prize to Climb to $231 Million
-

 Tech6 days ago
Commonwealth Fusion Systems leans on magnets for near-term revenue
-

 Fashion2 days ago
Massimo Dutti Offers Inspiration for Your Summer Mood Board
-

 Crypto World7 days ago
Ripple rolls out enterprise crypto treasury platform for corporates
-

 Fashion1 day ago
Let’s Discuss: DEI in 2026
-
Politics5 days ago
Wings Over Scotland | The quality of mercy
-
 Sports7 days ago
Steal Gary Woodland’s subtle power move for longer drives
-

 Business4 days ago
Akebia Therapeutics, Inc. (AKBA) Discusses Pipeline Progress and Strategic Focus on Kidney Disease Treatments at R&D Day – Slideshow
-
Sports7 days ago
Tom Pelissero Drives the Final Nail in the Coffin
-
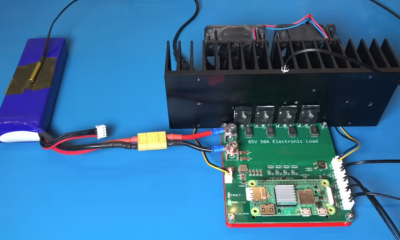
 Tech7 days ago
Battery Tester Outperforms Cheaper Options
-

 Tech7 days ago
Following Artemis II’s Journey Around The Moon
You must be logged in to post a comment Login