

Crypto World
Ethereum Bears Target $1,800 ETH Price: Here Is Why
Ether’s (ETH) price has retraced by over 5.6% to $2,275 after being rejected by resistance at $2,400. Now, multiple data points suggest ETH/USD may drop below $2,000.
Key takeaways:
- Low network activity signals declining usage and reduced onchain demand for ETH.
- Coinbase Premium remains negative as spot Ethereum ETF outflows returned, reflecting strong US-driven sell pressure.
- Ether’s falling wedge pattern targets $1,830.
Ether’s total value locked hits 12-month lows
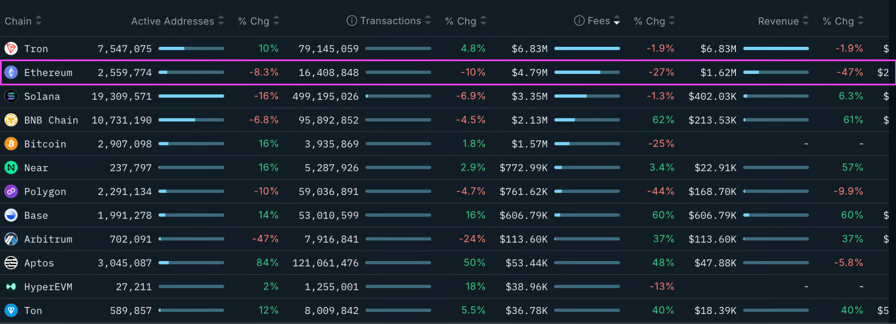
Ethereum’s network fundamentals are weakening, with weekly average transactions dropping by 10% to 4.79 million, per data from Nansen. Active addresses dropped by 8% to 2.5 million over the same period.
Related: Three reasons why Ether price rallies fizzle near $2.4K
Network fees also dropped by approximately 27%, leading to a 47% reduction in onchain revenue over the last seven days.

Blockchain comparison: Daily transactions, active addresses and network fees. Source: Nansen
Additional data from DefiLlama shows that the weekly DEX volumes dropped to $1.64 billion on May 8, a 46% drop over the last three weeks.
Low transaction count, a drop in active addresses and declining DEX volumes reflect reduced ecosystem usage. As a result, the total value locked (TVL) in Ethereum’s DeFi protocols has dropped to $124.7 billion, levels last seen in May 2025.

Total value locked on Ethereum. Source: DefiLlama
This subdued network activity signals weak user conviction, affecting Ether’s ability to sustain upside price momentum.
Ether’s exit queue jumps 72,000%
Ethereum’s unstaking queue jumped by approximately 72,000% within two weeks to 530,985 ETH on May 2.
As of Friday, over 202,000 ETH were queued for redemption, with a wait time of around three days.

Number of Ether queued for exit. Source: Validator Queue
The surge comes after a series of significant DeFi hacks, reflecting investor caution. April 2026 saw DeFi platforms suffer a record $625 million in monthly losses following 30 separate attacks, including a $292 million loss from the KelpDAO bridge hack, leading to over $15 billion in deposits withdrawn from the Aave platform.
These incidents have prompted investors to unstake ETH to regain liquidity, signaling flight from perceived risk.
“The exit queue went from ~700 ETH to ~500K ETH in 2 weeks,” analyst Pete said in a recent post on X, adding:
“DeFi yield on Ethereum is getting crushed by hacks, exploits and increasingly nasty attack surfaces.”
Despite the sharp surge in outflow pressure, 3.6 million ETH remains queued for staking entry (7x exit volume), pushing total staked ETH to 38.6 million (31.72% of supply) despite 45-day wait times.
Ether’s Coinbase Premium remains negative
The Ethereum Coinbase Premium Index, which tracks the price difference between ETH on Coinbase and Binance, has stayed negative since April 27.
A negative premium confirms that the selling pressure is originating heavily from US entities. As long as US investors are selling at a discount compared to the global market, downside momentum will likely accelerate.

Ethereum Coinbase Premium Index. Source: CryptoQuant
Additionally, US-based spot Ethereum ETFs snapped a four-day inflow streak with $103 million in net outflows on Thursday, the largest withdrawal since mid-March.

Spot Ethereum ETFs flows chart. Source: SoSoValue
Coupled with more than $81.6 million in outflows from global Ethereum investment products last week, this points to institutional selling, adding to Ether’s headwinds.
Meanwhile, ETH taker buy volume dropped to as low as -$25 million on Binance in recent days, indicating a “sharp increase in aggressive market sell orders,” CryptoQuant analyst BorisD said in a Quicktake note on Friday, adding:
“This structure raises the risk of short-term volatility and a support retest for ETH price action.”

ETH taker buy volume on Binance. Source: CryptoQuant
Ether’s rising wedge breakdown is underway
The daily chart shows the ETH/USD pair validating a rising wedge pattern after the price lost support at the pattern’s lower trend line at $2,300.
Bulls are now fighting to keep the price above $2,150-$2,200, where the 100-day and 50-week simple moving averages (SMAs) are, respectively.
Another key line of defense is the $2,000 psychological level, which, if breached, would clear the path for Ether’s drop toward the measured target of the wedge at $1,830, about 20% below the current price.

ETH/USD daily price chart. Source: Cointelegraph/TradingView
As Cointelegraph reported, the ETH price may descend to $1,750-$1,850 if support at $2,300 is not reclaimed in the short term.


The U.S. labor market continued to show at least modest strength in April, according to data released Friday by the Bureau of Labor Statistics.
The economy added 115,000 jobs during the month, well above economist expectations for 62,000, though down from 185,000 in March (revised from an originally reported 178,000).
The unemployment rate remained at 4.3%, in line with forecasts.
Bitcoin traded at $80,200 in the minutes after the release, roughly flat over the past 24 hours. U.S. stock index futures added to earlier gains, the Nasdaq 100 higher by 0.9%. The 10-year Treasury yield fell 2 basis points to 4.37%.
The report arrives at a delicate moment for markets and policymakers. Last week, the Federal Reserve left its benchmark fed funds rate range unchanged at 3.50%-3.75%, extending its holding pattern as officials weigh slowing economic growth against persistent inflation pressures.
The data also comes ahead of a new chairman taking the reins at the Fed, with Kevin Warsh expected to soon be confirmed by the Senate to replace Jerome Powell later this month.
Though off their highs, oil prices have remained elevated, with uncertainty around the Strait of Hormuz keeping energy markets on edge. Higher crude prices risk feeding into headline inflation while also weighing on consumer spending and economic activity.


Michael Saylor walked back his most absolute Bitcoin (BTC) maximalist rhetoric this week, telling investors Strategy will probably sell a portion of its 818,334 BTC holdings to fund dividend payments after a $12.54 billion first-quarter loss.
The pivot arrives roughly a year after Saylor told X followers to “sell a kidney if you must, but keep the Bitcoin” and posted his own decree that the only rules of Bitcoin were to buy and never sell.
From Maximalist Tweets to Earnings Call Reversal
In early 2025, Saylor flooded his timeline with absolutist messaging. On Feb. 2 he wrote “Never sell your Bitcoin.” On Feb. 3 he listed the “Rules of Bitcoin” as buying and refusing to sell. By March 4 he taunted shorts with “We can buy more Bitcoin than they can sell.”
The Q1 2026 earnings call delivered a different message. Saylor told analysts the firm would likely move BTC out the door to keep its preferred shareholders paid.
“We’ll probably sell some Bitcoin to fund a dividend just to inoculate the market, just to send the message that we did it.”
$12.5 Billion Loss Forces Pragmatic Pivot
Strategy booked a $14.46 billion unrealized markdown after Bitcoin fell from roughly $87,000 to $68,000 across the quarter. The firm now holds 818,334 BTC at an average cost of $75,537 per coin.
Bitcoin posted its worst opening quarter since 2018, dropping more than 23% as ETF outflows, tariff anxiety, and a hawkish Federal Reserve drained risk appetite.
CFO Phong Le said any sale would proceed only if it lifted Bitcoin per share. Saylor argued BTC needs to appreciate just 2.3% annually for the Strategy to cover its STRC dividends indefinitely through small disposals. The company carries $1.5 billion in yearly dividend obligations and roughly 18 months of cash coverage. The MSTR stock dropped after the call.
Critics Watch Saylor’s Bitcoin Pivot
Long-time skeptics pounced on the contradiction. Economist Peter Schiff has repeatedly labeled the firm’s Bitcoin-funded structure a Ponzi and questioned whether the dividend math holds without continuous BTC appreciation. He has also branded the equity itself a scam, intensifying scrutiny over how long the structure can hold.
The shift forces Saylor to reconcile two voices: the absolutist who told retail to mortgage everything, and the executive now selling to make payroll. The next earnings cycle will reveal whether that reconciliation comes quietly or through public correction.
The post Michael Saylor Backtracks From Sell a Kidney Stance to Selling Bitcoin appeared first on BeInCrypto.


Coinbase stopped working for over seven hours on Thursday after hot air in an Amazon data center threw its cloud services into disarray.
The exchange’s users found themselves unable to buy or sell crypto, while order book prices displayed hundreds of dollars higher than rival exchanges Binance and Hyperliquid.
The cause? Coinbase blames “increased temperatures in the affected AWS service.”
Amazon Web Services (AWS), which is one of the largest providers of cloud infrastructure that keeps much of the internet ticking over, claims to have suffered from a “thermal event” in one of its data centers in Northern Virginia.
Read more: Blockchain ‘alternative’ to Amazon Web Services just another crypto scam
The increase in temperature apparently affected its cloud hosting hardware, leading to a loss of power.
AWS quickly got to work on a solution, and as of this morning said it was “actively working to bring additional cooling system capacity online, which will enable us to recover the remaining affected racks in a controlled and safe manner.”
Amazon notes that its data centers rely on evaporation cooling, a system that involves filters in its air conditioning units being “dampened” with water, cooling any hot air that comes in and evaporating the water in the process.
Read more: Major crypto exchanges suffer complications after AWS outage
Whatever the fix was to the cooling system, it seems to have paid off as Coinbase noted in the last two hours that, “All markets have been re-enabled for trading on Coinbase Exchange.”
Before this, it said that it was working to re-enable trading and that it would have to place all markets “in ‘Cancel Only’ mode before we move to re-enable trading.”
After this, it moved the markets into “auction mode.”
AWS outage adds to Coinbase’s growing problems
The entire debacle adds to a pretty bad start to 2026 for Coinbase. It fired 14% of its staff last week, and suffered $394 million in losses during the first quarter of 2026.
Software engineer Gergely Orosz picked up on this, noting how the hours-long outage makes for “unfortunate optics for Coinbase… a few days after their CEO said how non-technical teams are shipping code to production.”
He said, “This outage is because Coinbase seems to have a hard dependency on AWS, and when AWS (or a part of it) is down, so is Coinbase,” adding that the whole thing is “terrible advertising.”
Crypto exchanges have already suffered outages related to AWS before in 2025, which caused Binance to suspend its withdrawals and caused issues for KuCoin, MEXC, and Rabby wallet.
In this case, data centers within the Singapore region had experienced a power loss, causing knock-on disruptions to firms reliant on AWS data centers within the area.
Got a tip? Send us an email securely via Protos Leaks. For more informed news and investigations, follow us on X, Bluesky, and Google News, or subscribe to our YouTube channel.

Cardano price has started recovering after breaking above a key descending resistance trendline, raising hopes that bulls may attempt a larger move toward the important $0.30 psychological level.
Summary
- Cardano price has rebounded after breaking above a multi-month descending trendline, with ADA climbing nearly 8% from recent weekly lows near $0.245.
- CoinGlass liquidation heatmap data showed heavy liquidation clusters between $0.28 and $0.30, pointing to a potential volatility zone if bullish momentum strengthens.
- Santiment data indicated continued whale accumulation, with large ADA holders increasing positions during recent market consolidation.
According to data from crypto.news, Cardano (ADA) was trading around $0.264 at press time on May 8, up nearly 8% from its recent weekly lows at $0.245. The token has also reclaimed levels last seen in late April after spending several months trapped under a broader downtrend structure.
The latest recovery comes as the broader crypto market stabilizes following renewed risk appetite across major digital assets. Bitcoin (BTC) holding above the $80K support level has also helped improve sentiment toward altcoins, including ADA.
On the daily chart, ADA recently broke above a descending resistance trendline that had capped upside attempts since February. The breakout followed weeks of consolidation between roughly $0.24 and $0.27, suggesting that selling pressure may gradually be weakening.
At the same time, derivatives activity indicates traders are positioning for increased volatility. CoinGlass liquidation heatmap data shows a large concentration of liquidation liquidity clustered around the $0.28 to $0.30 range. These dense liquidity pockets often act as magnetic zones for price action, especially when momentum begins building in one direction.
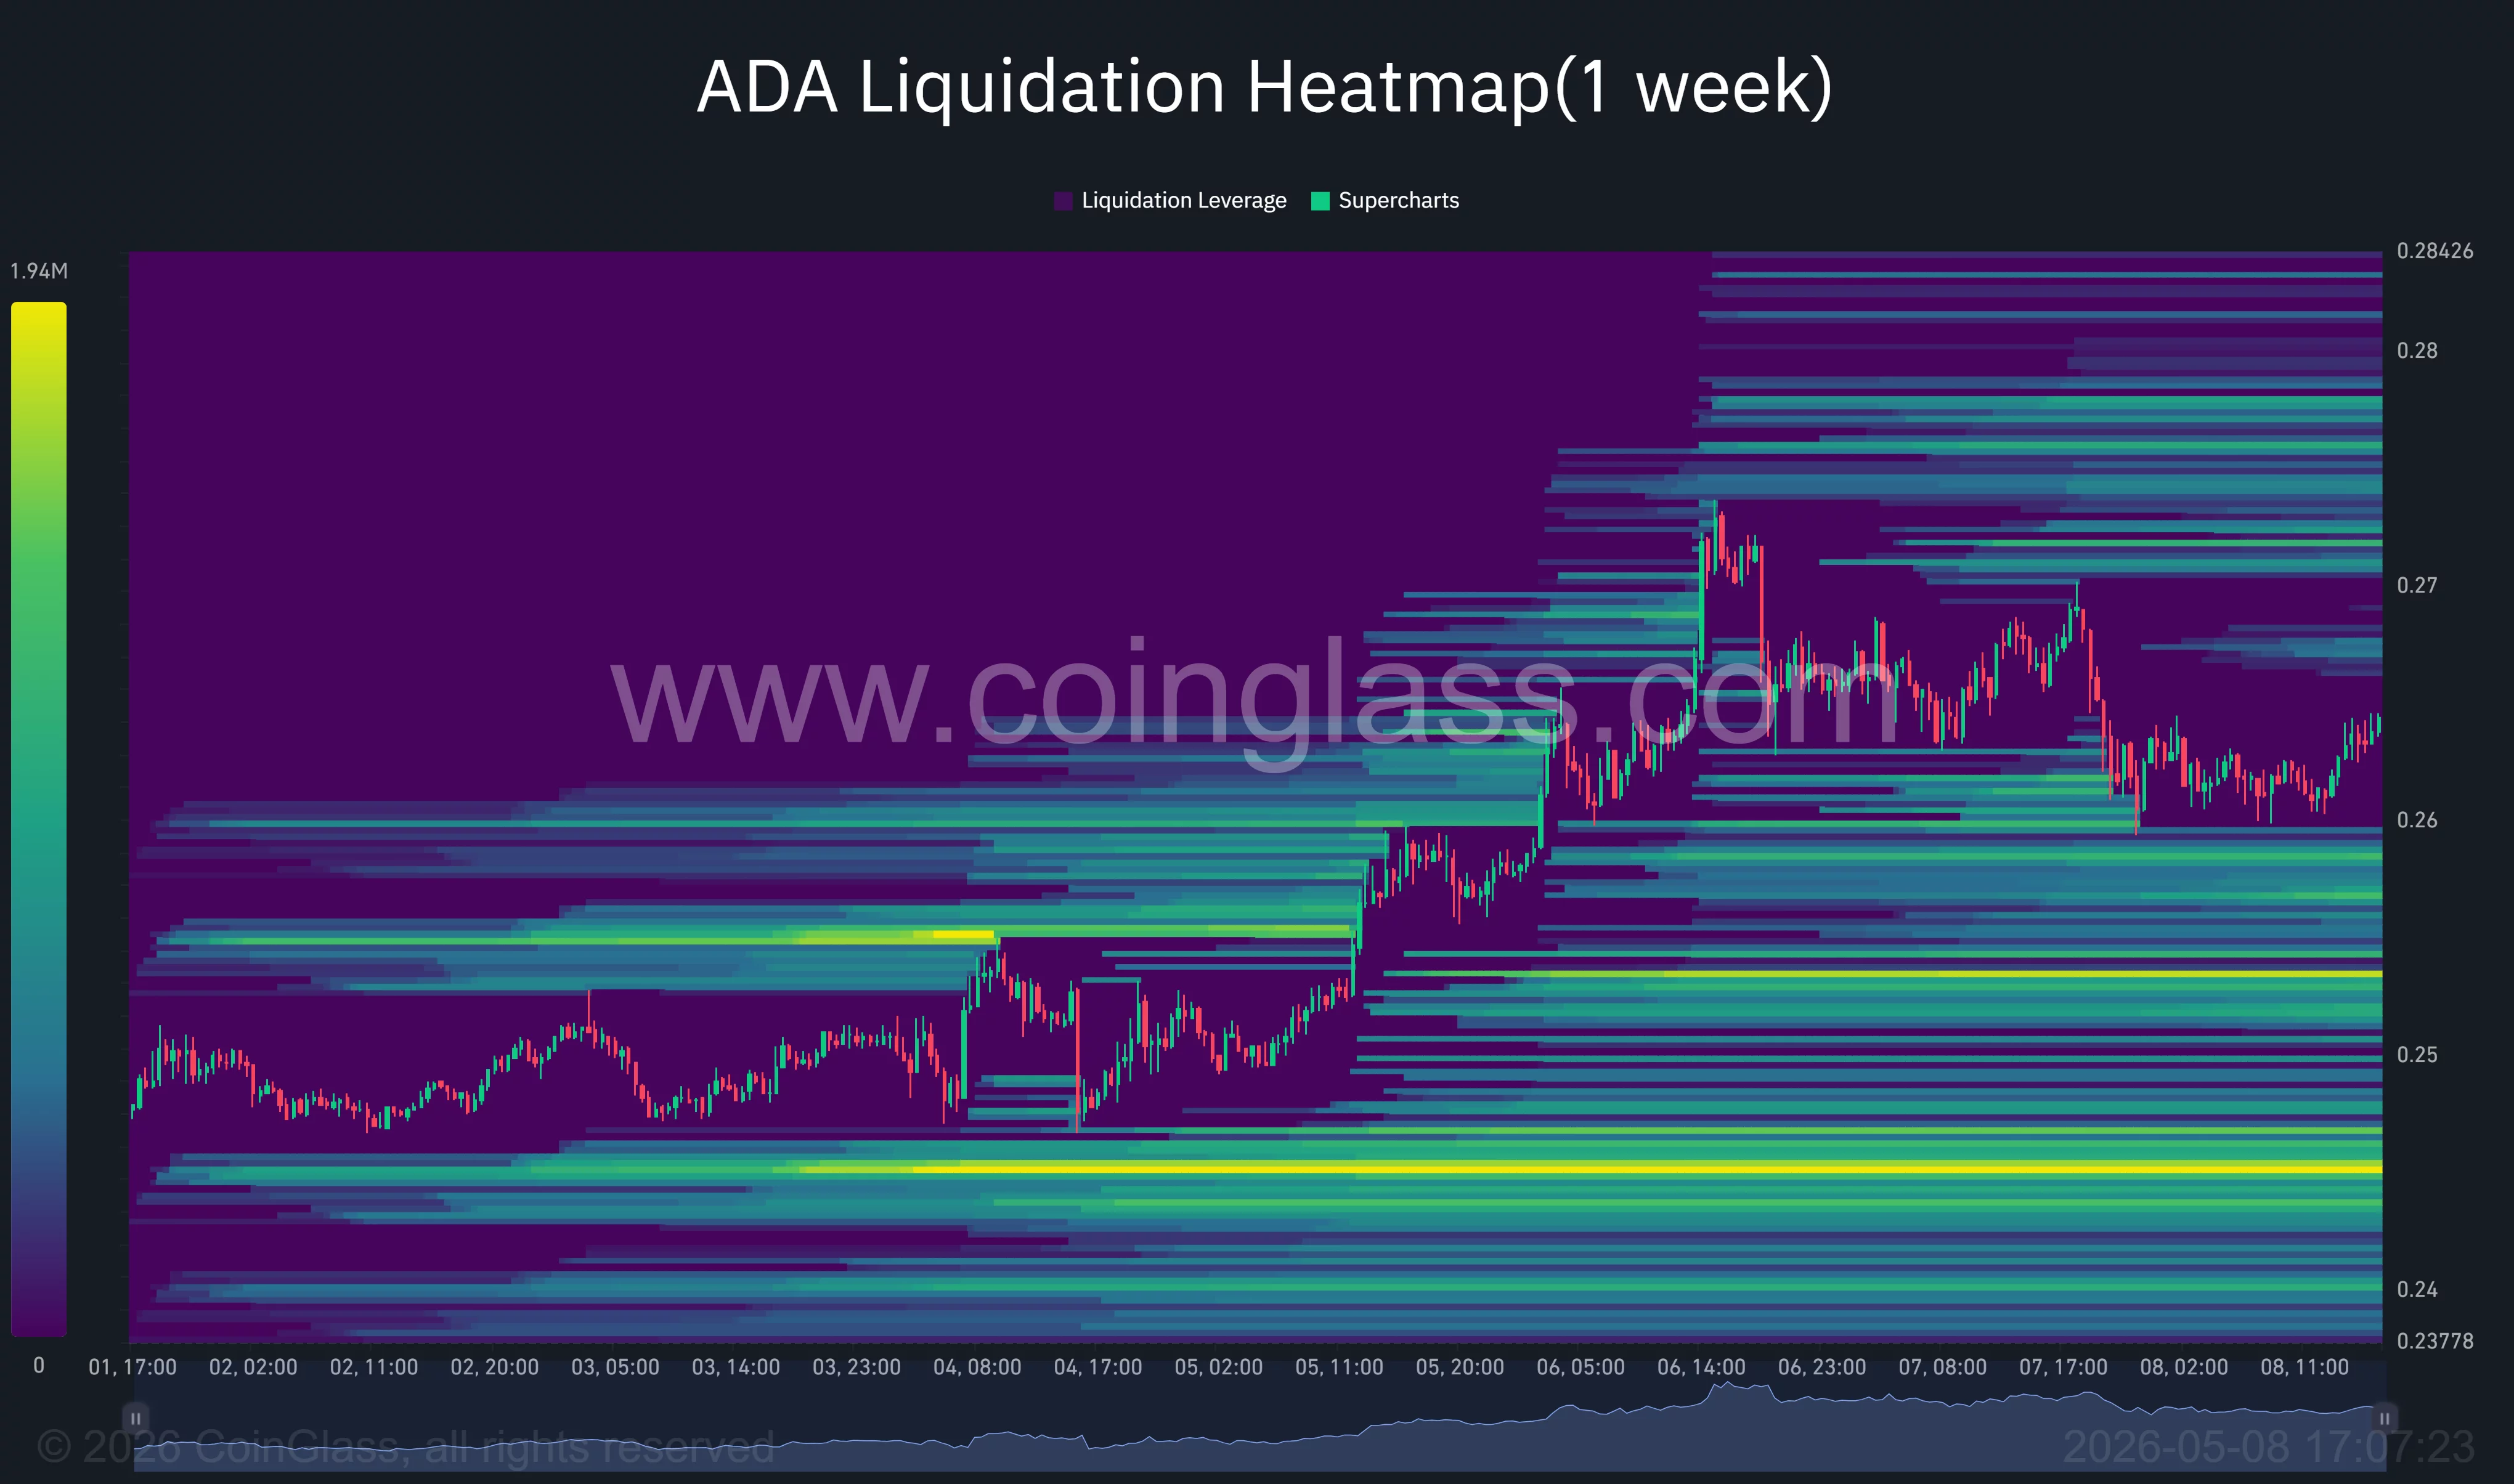
If ADA continues climbing toward those levels, it could trigger a wave of short liquidations that may accelerate upside momentum further.
Meanwhile, whale accumulation trends continue to strengthen. Recent on-chain data from Santiment indicates that large Cardano holders have steadily increased their positions over recent weeks despite the broader market consolidation. Wallets holding between 10 million and 100 million ADA reportedly continued accumulating tokens during the recent dips, signaling that larger investors may still be positioning for a longer-term recovery.
Such accumulation trends are often closely watched by traders because sustained whale buying can help absorb selling pressure while improving overall market confidence.
Cardano price analysis
The daily chart shows ADA successfully pushing above its descending trendline resistance after several failed breakout attempts earlier this year. Price has also started forming a series of higher lows since mid-April, suggesting buyers are gradually regaining control of the trend.
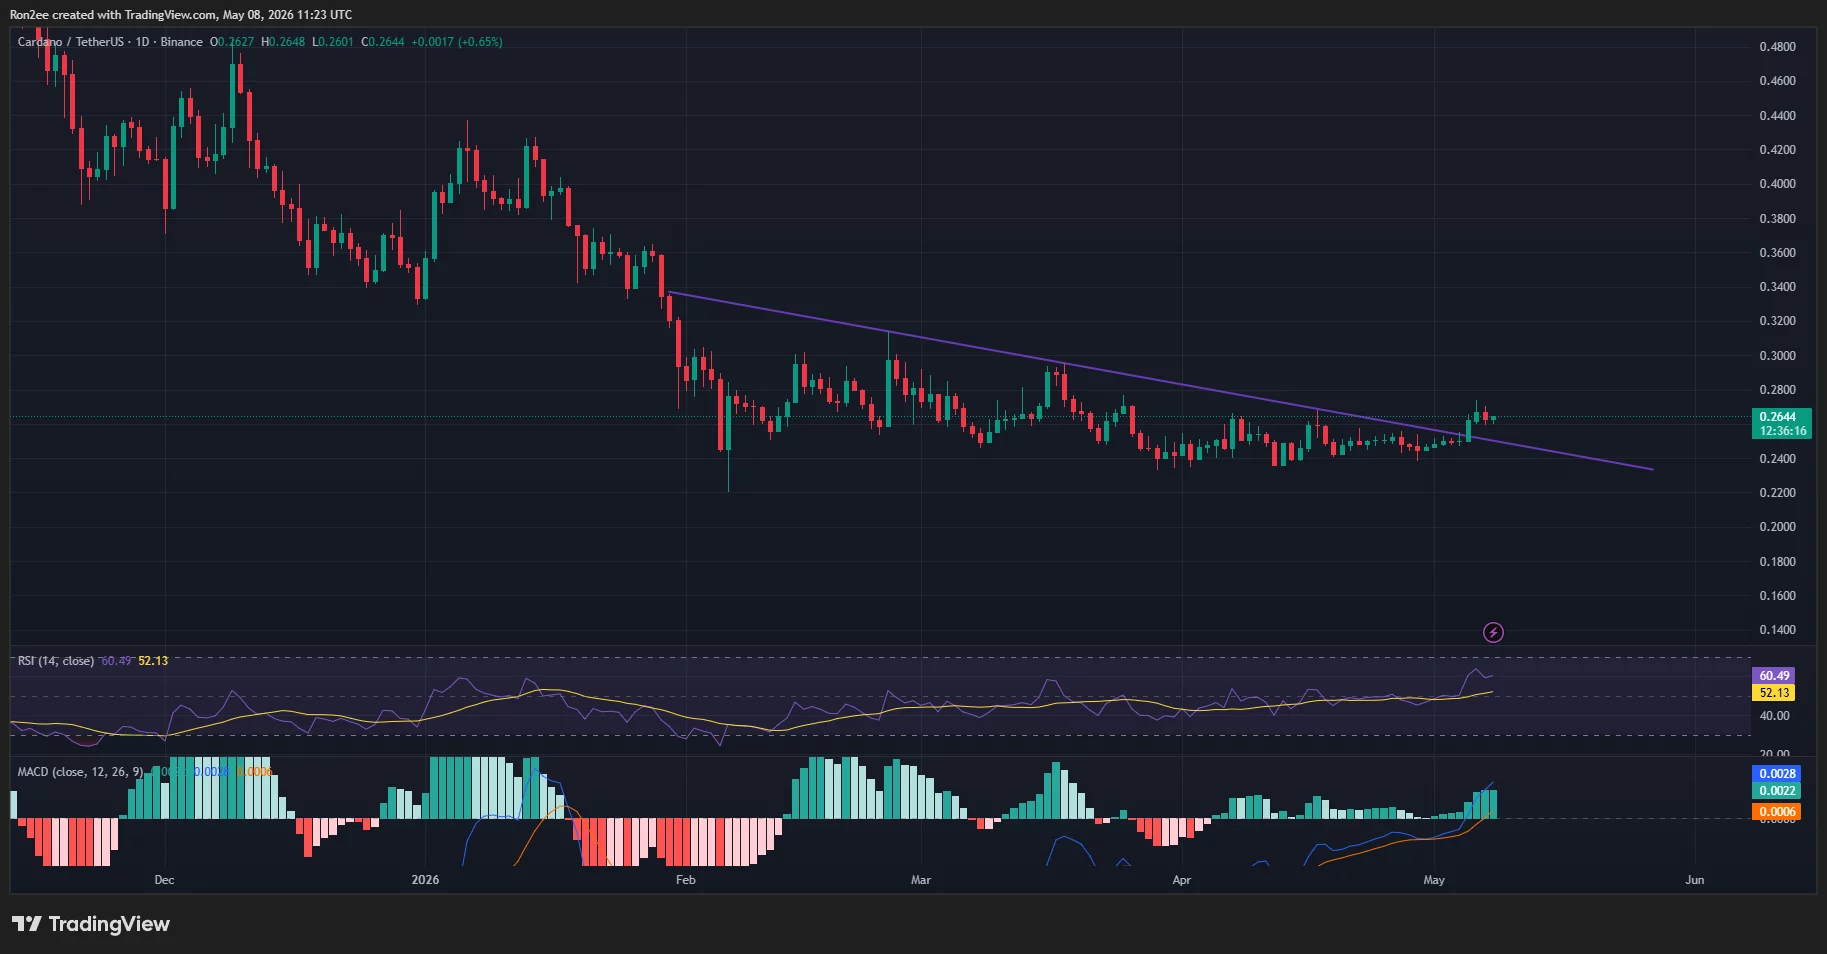
Momentum indicators are beginning to support the bullish structure. The RSI has climbed above 60 and continues trending upward while remaining above its signal line, reflecting strengthening buying momentum without yet entering overbought territory.
Meanwhile, the MACD has completed a bullish crossover and moved higher above the signal line. The histogram has also turned increasingly positive, suggesting bullish momentum is continuing to build.
Despite the breakout, ADA still faces several important resistance levels ahead. The $0.27 region remains the first key barrier, followed by heavier liquidation clusters near $0.28 and the major psychological resistance at $0.30.
If bulls manage to push price above the $0.30 zone, it could open the door for a stronger rally toward levels not seen since the first quarter of 2026.
On the downside, failure to hold above the broken trendline could invalidate the breakout setup and pull ADA back toward the $0.25–$0.24 support region, where buyers previously stepped in aggressively.
Disclosure: This article does not represent investment advice. The content and materials featured on this page are for educational purposes only.
Key Takeaways
- Futures for the S&P 500, Nasdaq, and Dow all advanced Friday morning even as US-Iran military tensions flared in the Strait of Hormuz
- Iranian forces launched coordinated missile, drone, and small-boat assaults on American warships; US military retaliated with strikes on Iranian installations
- Trump downplayed the confrontation as minor and reaffirmed the ceasefire agreement, providing reassurance to investors
- Energy markets showed muted reaction with Brent crude gaining 1.1% and WTI adding 0.7%, indicating contained anxiety over supply disruptions
- Focus shifts to April’s employment situation report, with projections calling for 65,000 new positions and unemployment steady at 4.3%
Investors largely dismissed military hostilities between the United States and Iran on Friday, pushing stock futures into positive territory as attention turned toward crucial employment statistics.
Contracts tied to the S&P 500 advanced 0.5%, with Nasdaq 100 futures gaining 0.7%. Dow futures increased 0.3%, representing approximately 137 points. The three benchmark indices had retreated on Thursday, with the Dow momentarily breaching 50,000 before settling below that psychological threshold for the second consecutive session.

Iranian military forces executed coordinated attacks involving missiles, unmanned aerial vehicles, and small naval vessels targeting US warships positioned in the Strait of Hormuz on Thursday. US Central Command characterized these strikes as “unprovoked” while emphasizing American forces did not seek further escalation.
American forces answered by targeting Iranian military installations connected to the offensive operations. President Trump communicated via Truth Social that US destroyers sustained no damage and characterized the response as measured.
Trump further minimized Iran’s attacks as trivial and confirmed the bilateral ceasefire remains operational. This messaging appeared to ease market concerns.
Wall Street Maintains Composure Amid Geopolitical Flare-Up
Henry Allen, a macro strategist at Deutsche Bank, acknowledged the obvious escalation while observing that financial markets were not incorporating a catastrophic outcome.
Oil prices climbed but remained relatively stable. Brent crude increased 1.1% to reach $101.15 per barrel. West Texas Intermediate advanced 0.7% to $95.50 per barrel.
The measured response in energy markets indicates investors do not anticipate significant interruption to global oil flows.
The greenback strengthened 0.1% versus a basket of major currencies. The benchmark 10-year Treasury yield declined one basis point to 4.38%.
Employment Data Commands Attention
Friday’s release of April’s nonfarm payrolls data represents the primary catalyst for market participants. Consensus estimates compiled by Bloomberg anticipate 65,000 positions were created during the month.
The jobless rate is projected to remain unchanged at 4.3%. Such an outcome would signal a resilient employment landscape despite persistent geopolitical headwinds.
Quarterly financial results are scheduled for release Friday from Toyota Motor, Sony, and Brookfield Asset Management.
Bitcoin retreated beneath the $80,000 threshold following reports of the US-Iran military engagement, based on earlier trading session data.
Government bond yields drifted lower during early morning trading on expectations for de-escalation in the Middle Eastern theater.
The Dow, S&P 500, and Nasdaq remain positioned for weekly gains if premarket momentum persists through the closing bell.

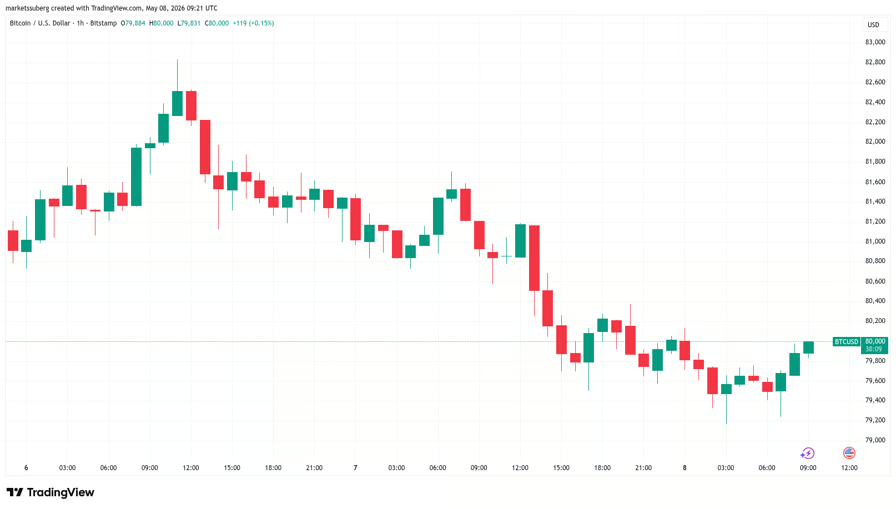
Bitcoin (BTC) revisited $80,000 on Friday after US-Iran war nerves sparked 3% daily losses.
Key points:
- Bitcoin bullish momentum slowly returns after a shakeout amid familiar geopolitical tensions.
- Traders flag support levels in the mid- to high-$70,000 zone as important for bulls to defend.
- Unprecedented Bollinger Bands data calls for more volatile conditions going forward.
Bitcoin retests $80,000 after sell-off
Data from TradingView showed BTC price downside pressure easing toward the Wall Street open.

BTC/USD one-hour chart. Source: Cointelegraph/TradingView
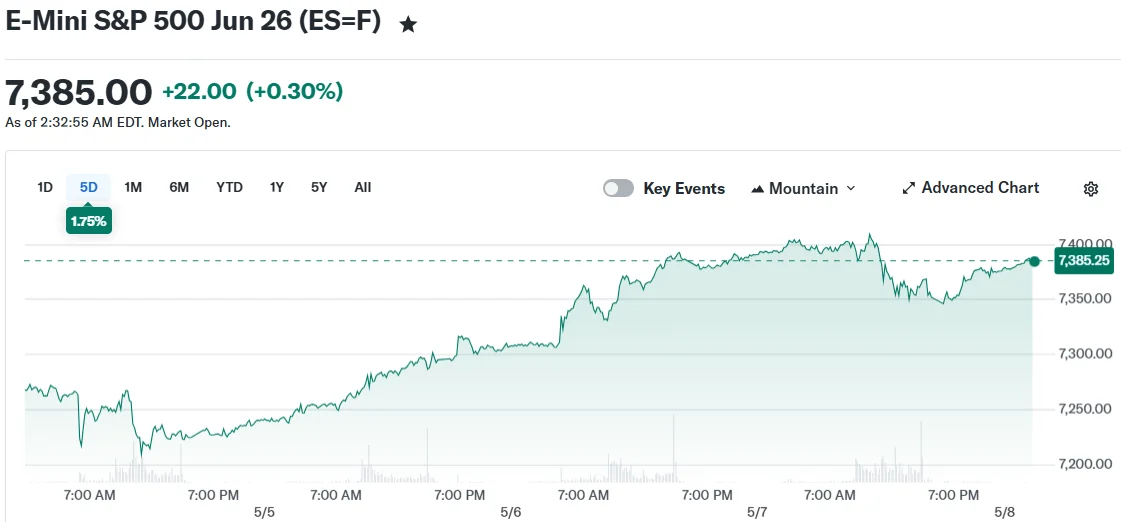
Thursday had seen risk assets lose out amid rumors of the US restarting its “Project Freedom” campaign against Iran, while military strikes from both sides placed a fragile ceasefire in jeopardy. The S&P 500 came off new all-time highs.

S&P 500 one-hour chart. Source: Cointelegraph/TradingView
Commenting, crypto trader Michaël van de Poppe said that the retracement was no “surprise” given recent brisk gains.
“Assets trend in waves. Bitcoin has seen multiple days of momentum upwards, so it’s not strange to expect it to consolidate just now,” he wrote in an X post at the time.
“As long as the trend remains intact, I think we’ll see more upside during coming weeks.”

BTC/USDT one-day chart. Source: Michaël van de Poppe/X
Van de Poppe subsequently described Bitcoin as “doing just fine,” but said $76,000 needed to hold as support.
“The first rally out of a bear market lands at that resistance, and it would give some more momentum for Altcoins,” he added.
Trader Jelle also remained optimistic on the outlook while arguing that the day’s lows near $79,000 needed to hold.
“Even in the bearish case, I believe the turquoise zone will hold the price and trigger a reversal to the upside,” he told X followers about charts showing $74,500 as a potential downside target.

BTC/USDT charts. Source: Jelle/X
Bitcoin volatility metric demands larger moves
On daily time frames, BTC/USD thus failed to sustain a break beyond the upper band of the Bollinger Bands volatility metric.
Related: Bitcoin can crash to $50K if ‘most critical’ bear market test fails: Analysis

BTC/USD one-day chart with Bollinger Bands data. Source: Cointelegraph/TradingView
As Cointelegraph reported, positive signals from the Bands even inspired their creator, John Bollinger, to take a position via his proprietary investment funds.
In an X response, trader SuperBro observed the narrowest-ever conditions for the Bands on monthly time frames — a key prerequisite for heightened volatility next.

BTC/USD one-month chart with Bollinger Bands data. Source: Cointelegraph/TradingView
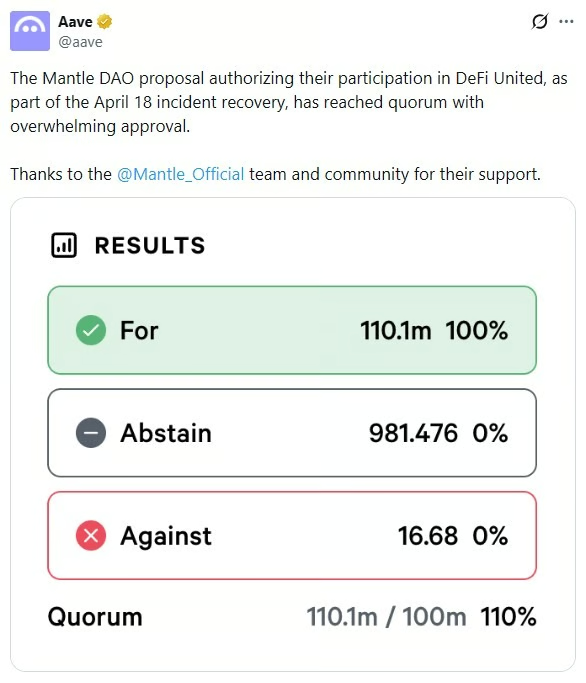
Mantle tokenholders backed a proposal authorizing a credit facility of up to 30,000 Ether (ETH), worth about $68 million, for Aave DAO, advancing remediation tied to bad debt from the April rsETH exploit.
The proposal, MIP-34, passed in a seven-day Snapshot vote that ended Friday, according to DAO governance platform Snapshot. The measure authorizes the Mantle Foundation to negotiate and execute definitive agreements with Aave DAO for a loan from the Mantle Treasury, though the facility remains subject to Aave implementing its recovery plan and the parties finalizing terms.
The credit facility is intended to help address the impact of the rsETH incident on Aave V3. The proposal said the attacker deposited 89,567 unbacked rsETH on Aave and borrowed about $190 million in WETH, wstETH and stablecoins, creating potential bad debt estimated at between $123.7 million and $230.1 million.
The vote comes as the fallout from the rsETH exploit has moved beyond the initial liquidity shock into a broader remediation phase, with Mantle positioning its treasury as a backstop while Aave works to address bad debt and restore confidence in its lending markets.

Source: Aave
Aave WETH market cools after post-exploit squeeze
The Mantle credit facility would address the shortfall that also created liquidity stress across Aave’s lending markets.
Galaxy Research said in a Thursday report that the rsETH exploit pushed Aave’s Wrapped Ether (WETH) market into a prolonged squeeze, with WETH utilization staying above 99% for 12.7 days after the incident.
“Across the full analysis horizon, WETH utilization stayed structurally elevated and close to the 100% ceiling, with an average around 99.6% and only easing to about 98.47% by the end of the snapshot period,” Galaxy said.
Related: Aave asks Arbitrum to send 30K ETH from Kelp exploiter to ‘DeFi United’
High utilization means most of the supplied asset has already been borrowed, leaving little idle liquidity available for immediate withdrawals. In Aave’s case, Galaxy said the WETH market remained strained because supply contracted faster than borrows declined, keeping utilization near full capacity even after the initial shock.

30-day WETH utilization rate chart. Source: Aavescan
The market has since cooled from the near-100% levels described in Galaxy’s analysis. Aavescan data showed Aave’s Ethereum V3 WETH market at about 91.6% utilization on Friday, with roughly 2.02 million WETH supplied and 1.85 million WETH borrowed.
Magazine: North Korea denies crypto hacks, Upbit’s bank tests Ripple: Asia Express


BlackRock has filed a comment letter with the U.S. Office of the Comptroller of the Currency, backing the agency’s proposed regulatory framework for payment stablecoin issuers under the GENIUS Act.
The world’s largest asset manager submitted seven recommendations, urging the OCC to permit broader reserve eligibility and adopt flexible compliance rules. BlackRock said the GENIUS Act framework can support real-time settlement and stronger payment system standards.
BlackRock Backs Principles-Based Framework
The OCC proposal, published on March 2, sets requirements for permitted payment stablecoin issuers (PPSIs) under the Guiding and Establishing National Innovation for U.S. Stablecoins (GENIUS) Act. It addresses reserve assets, diversification, concentration, capital, and supervisory standards.
BlackRock said it prefers the agency’s “Option A,” which pairs a principles-based approach with an optional quantitative safe harbor. That harbor carries 10% daily and 30% weekly liquidity thresholds, a 40% concentration limit, and a 20-day weighted average maturity cap.
The firm wants same-day settling government money market funds (GMMFs) counted toward the weekly liquidity floor, citing more than $6.2 trillion held in such funds. It also asked the OCC to confirm that qualifying ETFs receive equal treatment. Robert Mitchnick, BlackRock’s Head of Digital Assets, was among five executives who signed the letter.
“With the right regulatory framework in place, stablecoins can improve the payments system and drive new forms of financial utility, including real-time settlement.”
BlackRock, X
Push to Drop 20% Cap on Tokenized Reserves
BlackRock urged the OCC not to impose extra quantitative limits on tokenized forms of eligible reserves. The proposal had floated a 20% cap on tokenized assets, which the firm argues penalizes form over substance rather than risk.
The asset manager also wants U.S. Treasury Floating Rate Notes (FRNs) with up to two-year maturities added as eligible reserves. It called for separately managed accounts to remain available for professional reserve management. CEO Larry Fink has previously framed tokenization as a fresh asset class for institutional portfolios.
The framework arrives as stablecoins move further into mainstream payments use, even as BlackRock’s spot Bitcoin ETF flows have shown signs of cooling this quarter.
The comment period gives U.S. regulators a first chance to align stablecoin policy with institutional reserve standards. BlackRock’s letter signals where major asset managers want the line drawn before final rules take effect.
The post BlackRock Backs GENIUS Act Stablecoin Framework, Pushes 7 Recommendations appeared first on BeInCrypto.


- Zcash plans to launch quantum recoverable wallets within about a month.
- The system is designed to protect user funds during future cryptographic shifts.
- Full quantum-resistant security is targeted for rollout by 2027.
Zcash is preparing a major upgrade aimed at protecting users from one of the long-term risks facing modern cryptography: quantum computing.
The network is set to introduce “quantum recoverable wallets” within the next month, according to development updates shared by its core contributors at Consensus Miami on Thursday.
The broader goal is to move the protocol toward full quantum resistance by 2027.
The move comes as blockchain projects increasingly assess how future advances in quantum computing could impact existing encryption systems.
Most cryptocurrencies today rely on elliptic-curve cryptography to secure private keys.
While this system remains safe under current computing capabilities, theoretical breakthroughs in quantum computing could eventually weaken or break it.
Zcash is attempting to address that concern in stages rather than waiting for a single full replacement of its cryptographic base.
A transition layer instead of a full overhaul
The upcoming “quantum recoverable wallets” are not designed to make Zcash instantly quantum-proof. Instead, they act as a protective transition mechanism.
The idea is to give users a recovery path in a scenario where current cryptographic methods are no longer reliable in the distant future.
In simple terms, these wallets are meant to ensure that users do not permanently lose access to their funds if the underlying cryptography becomes vulnerable.
Instead of locking users into today’s encryption model, the system is being built with migration pathways that can shift funds into stronger post-quantum security systems when needed.
The rollout timeline for this first stage is relatively short, with implementation expected within approximately one month.
This places it among the earliest real deployments of quantum-aware wallet infrastructure in a major privacy-focused blockchain.
Zcash developers have framed this as a preparatory step rather than a final solution.
The architecture is being designed so that future upgrades can be layered on without forcing users to abandon their wallets or migrate manually under pressure.
Zcash is targeting to be quantum-resistant by 2027
Beyond the initial wallet release, the longer-term objective is to achieve what the team refers to as “quantum-proof” infrastructure by 2027.
This would involve integrating post-quantum cryptographic systems that are resistant to attacks from advanced quantum machines.
The timeline shows a phased approach: deploying quantum-recoverable wallets as a safety and migration layer in a month, followed by continued development of post-quantum cryptographic systems and wallet upgrades, and then a full transition to quantum-resistant security standards within the protocol set for 2027.
This approach is significant because it avoids a sudden shift in cryptographic systems, which could be disruptive for users and developers.
Instead, Zcash is building backward compatibility into its future security model.
The urgency behind this roadmap is driven by increasing attention in the cryptography and blockchain sectors to quantum risk scenarios.
While there is no operational quantum computer capable of breaking current blockchain encryption today, the pace of research has led many projects to begin preparing early rather than reacting later.
Crypto World
Recent Bitcoin Price Predictions, Shiba Inu’s Latest Achievement, and More: Bits Recap May 8

The primary cryptocurrency has experienced intense volatility over the past few days, with numerous analysts suggesting the bulls may soon regain momentum.
Meanwhile, the popular meme coin Shiba Inu hit a new record in terms of total holders, while Ethereum (ETH) is showing signs of potential weakness.
Up and Down for BTC
Bitcoin had an eventful week, with its valuation reaching nearly $83,000 on May 6, the highest level since the end of January. However, the bears intercepted the upward trajectory and suppressed the price to the current $79,800 (according to CoinGecko).
Despite the push south, many industry participants remain optimistic that the overall resurgence would continue. X user CW, for instance, noted that BTC is “rising smoothly, forming a bullish engulfing candle.
“According to candlestick pattern theory, the May candle will close with a bigger bullish candle than the April,” they added.
John Bollinger – the creator of the well-known indicator Bollinger Bands – also chipped in recently. He revealed that his fund’s “Tactica” program has opened a fresh position and is now “fully invested” in BTC after the trend model turned positive.
It is important to note that some think the bear market is far from being over. X user Chiefy described the latest revival as “the biggest Bitcoin bull trap of this cycle,” forecasting a crash to as low as $42,000.
Shiba Inu’s Record
The self-proclaimed Dogecoin killer has also taken center stage recently after its team unveiled some significant ecosystem updates. It disclosed that the total number of SHIB holders has surged by 1,100 in a single day, hitting a new all-time high of 1,585,022.
In addition, the burn rate has spiked sharply, accompanied by a noticeable rise in daily active addresses and trading volume, signaling growing network engagement.
Despite the progress, SHIB continues to struggle, and its price has fallen 53% over the past year. Moreover, it has lost its position as the second-largest meme coin, with MemeCore (M) rapidly climbing to take that spot.
Incoming Crash for ETH?
Ethereum’s price surpassed $2,400 on May 6, but that uptick was short-lived, and it now trades below $2,300. Some analysts, such as Ted, believe a further downfall could be in the cards.
He claimed that ETH has lost its “parabola,” adding that if it doesn’t soon reclaim the $2,350 level, “things could get ugly.” The whale activity reinforces the bearish scenario. According to Ali Martinez, large investors have reduced their total holdings from a peak of 15.95 million ETH in October last year to the current 12.52 million units.
This reflects weakening confidence in the asset and could trigger fear within the community, prompting smaller players to follow suit and cash out as well.
On the other hand, earlier this week, Martinez noted a formation of a so-called golden cross on ETH’s price chart, a pattern that occurred in the final days of April. This is a bullish sign that could set the stage for a potential comeback.
The post Recent Bitcoin Price Predictions, Shiba Inu’s Latest Achievement, and More: Bits Recap May 8 appeared first on CryptoPotato.

Police issue tragic update as M61 closed both directions near Bolton

Trump’s $1 million Gold Card fails to catch on among world’s wealthy

U.S. added 115K jobs in April, nearly doubling expectations
Manchester United reach agreement with Casemiro over contract clause amid transfer speculation

US brings back mandatory military draft registration

Steven Gerrard disagrees with Gary Neville over ‘shock’ Chelsea and Arsenal claim | Football


-

 NewsBeat5 days ago
Channel 5 – All Creatures Great and Small series 7 new post
-

 Crypto World1 day ago
Upbit adds B3 Korean won pair as Base token gains Korea access
-
 Crypto World4 hours ago
HarrisX Poll Found 52% of Registered Voters Support the CLARITY Act
-
 NewsBeat1 day ago
NCP car park operator enters administration putting 340 UK sites at risk of closure
-
 Tech7 days ago
Trump’s 25% EU auto tariff breaches Turnberry Agreement that also covers semiconductors and digital trade
-
 Sports7 days ago
Paul Scholes issues Marcus Rashford reality check as agreement emerges over Man United star
-

 Tech4 days ago
Image AI models now drive app growth, beating chatbot upgrades
-

 Entertainment7 days ago
Met Gala 2026 Rumored Guest List Is Turning Heads
-
Entertainment7 days ago
New on Prime Video in May 2026 — Full List of Movies and Shows
-

 Entertainment7 days ago
Kylie Jenner Hit With Second Lawsuit From Ex-Housekeeper
-

 Sports7 days ago
Cavaliers vs. Raptors Game 6 live score, updates, highlights from 2026 NBA playoffs first-round series
-
 Sports7 days ago
David Benavidez responds to team Canelo saying the fight will never happen
-
Entertainment6 days ago
New Netflix Movies in May 2026 — My Top 3 Picks to Stream
-

 Entertainment5 days ago
Melissa Joan Hart and More Stars Attend 2026 Kentucky Derby
-
 Sports7 days ago
IPL 2026: ‘Love you darling’- Hardik Pandya’s reaction to MS Dhoni steals the show |Watch | Cricket News
-

 Entertainment7 days ago
Young and the Restless Next Week: Cane Arrested & Matt’s Deadly New Scheme!
-

 Tech7 days ago
Mother’s Day 2026 Gift Guide: Audio to Upgrade Mom’s Lifestyle
-
 Crypto World6 days ago
Pi Network Mandates Protocol 23 Upgrade for All Mainnet Nodes Before May 15 Deadline
-

 Business5 days ago
Luka Doncic Injury Update: Doncic’s Hamstring Recovery Slows Lakers’ Hopes Against Thunder: Can He Run Yet?
-

 Business7 days ago
Can Victor Wembanyama Bring the NBA Ring to Spurs in 2026? Historic Playoff Run Fuels Title Dreams
You must be logged in to post a comment Login