

Crypto World
Michael Saylor Backtracks From Sell a Kidney Stance to Selling Bitcoin


Michael Saylor walked back his most absolute Bitcoin (BTC) maximalist rhetoric this week, telling investors Strategy will probably sell a portion of its 818,334 BTC holdings to fund dividend payments after a $12.54 billion first-quarter loss.
The pivot arrives roughly a year after Saylor told X followers to “sell a kidney if you must, but keep the Bitcoin” and posted his own decree that the only rules of Bitcoin were to buy and never sell.
From Maximalist Tweets to Earnings Call Reversal
In early 2025, Saylor flooded his timeline with absolutist messaging. On Feb. 2 he wrote “Never sell your Bitcoin.” On Feb. 3 he listed the “Rules of Bitcoin” as buying and refusing to sell. By March 4 he taunted shorts with “We can buy more Bitcoin than they can sell.”
The Q1 2026 earnings call delivered a different message. Saylor told analysts the firm would likely move BTC out the door to keep its preferred shareholders paid.
“We’ll probably sell some Bitcoin to fund a dividend just to inoculate the market, just to send the message that we did it.”
$12.5 Billion Loss Forces Pragmatic Pivot
Strategy booked a $14.46 billion unrealized markdown after Bitcoin fell from roughly $87,000 to $68,000 across the quarter. The firm now holds 818,334 BTC at an average cost of $75,537 per coin.
Bitcoin posted its worst opening quarter since 2018, dropping more than 23% as ETF outflows, tariff anxiety, and a hawkish Federal Reserve drained risk appetite.
CFO Phong Le said any sale would proceed only if it lifted Bitcoin per share. Saylor argued BTC needs to appreciate just 2.3% annually for the Strategy to cover its STRC dividends indefinitely through small disposals. The company carries $1.5 billion in yearly dividend obligations and roughly 18 months of cash coverage. The MSTR stock dropped after the call.
Critics Watch Saylor’s Bitcoin Pivot
Long-time skeptics pounced on the contradiction. Economist Peter Schiff has repeatedly labeled the firm’s Bitcoin-funded structure a Ponzi and questioned whether the dividend math holds without continuous BTC appreciation. He has also branded the equity itself a scam, intensifying scrutiny over how long the structure can hold.
The shift forces Saylor to reconcile two voices: the absolutist who told retail to mortgage everything, and the executive now selling to make payroll. The next earnings cycle will reveal whether that reconciliation comes quietly or through public correction.
The post Michael Saylor Backtracks From Sell a Kidney Stance to Selling Bitcoin appeared first on BeInCrypto.

Crypto World
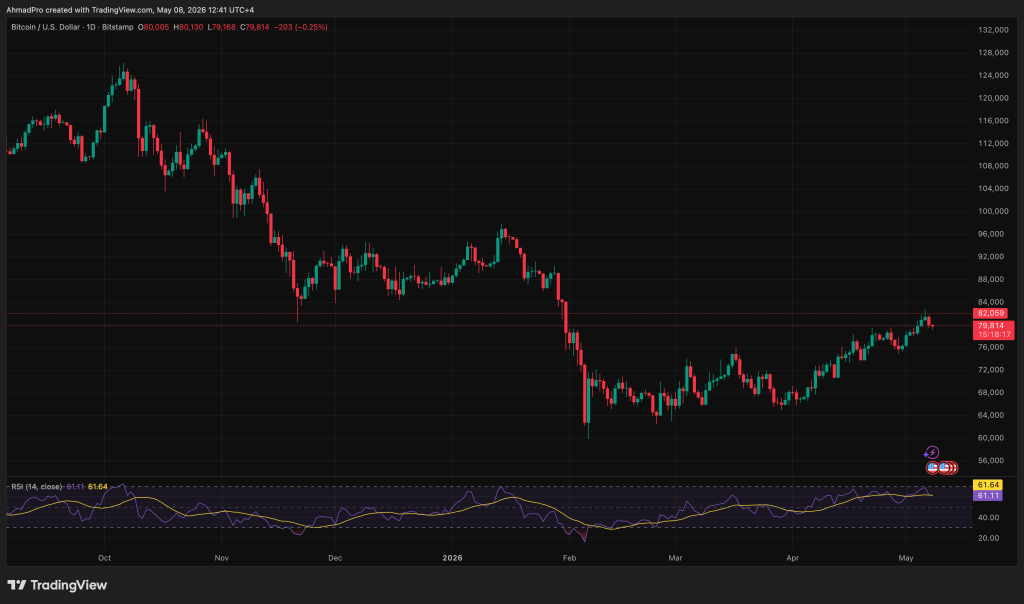
Bitcoin Price Prediction: Bitcoin Falls to $79.6k as US-Iran Escalation Dents Risk Set for 6th Weekly Gain

Bitcoin price slid to $79,679 Friday as US military strikes against Iranian vessels in the Strait of Hormuz triggered a broad risk-off prediction, yet the world’s largest crypto remains on track for a sixth consecutive weekly gain.
The 1.7% intraday drop looks alarming on the surface, but the weekly chart tells a quieter story. What happens at the weekend close could define whether BTC reclaims $85,000 or gives back the entire week’s advance.
The immediate catalyst: US forces struck back against Iran following attacks on three American warships transiting Hormuz, reigniting a geopolitical flashpoint that markets had largely priced out.
Compounding the pressure, Strategy Inc (NASDAQ: MSTR), the largest corporate Bitcoin holder, signaled it could sell portions of its holdings to fund dividend payments, though the scope and timing remain unspecified.
Despite the intraday weakness, BTC is still up approximately 3% on the week. The macro backdrop, institutional accumulation, improving US regulatory clarity, and residual post-ATH consolidation, remain broadly constructive heading into the weekend session.
Discover: The best crypto to diversify your portfolio with
Bitcoin Price Prediction: Can BTC Price Reclaim $85,000 Before the Weekly Close?
Bitcoin is trading in one of the most important structural zones of this cycle, hovering around $80K while pressure builds between key support and resistance.
The broader setup remains constructive, but only as long as $79K continues holding as the primary daily support floor. That level is doing the heavy lifting right now.
As long as buyers defend it, the post-correction recovery remains intact, with $83K–$85K still functioning as the major upside target and mean reversion zone after October’s sharp pullback.
On-chain data continues to show accumulation rather than broad distribution, which suggests larger players are still absorbing supply at current levels instead of exiting positions.
Resistance overhead remains significant, and Bitcoin needs a decisive break above that $83K–$85K region before any larger breakout narrative gains real credibility.
Until then, the market is essentially coiling. If BTC maintains this structure, the path toward stronger continuation remains open, but a breakdown below $75K would materially weaken the setup and shift focus toward the $69K long-term trendline as the next serious support zone.
Volume conditions also matter here, especially with thinner weekend liquidity increasing the probability of exaggerated moves in either direction.
The honest reality is that Bitcoin still looks structurally stronger than weaker, but this is a conditional setup where support must hold.
Discover: The best pre-launch token sales
The post Bitcoin Price Prediction: Bitcoin Falls to $79.6k as US-Iran Escalation Dents Risk Set for 6th Weekly Gain appeared first on Cryptonews.
Crypto World
XRP Price Could Start Another Rally: $7 Trillion Bank Announces Its Ripple Coin Investment
XRP price might be falling under its $1.40 support, but UBS, a Swiss banking giant managing $7 trillion in assets, has disclosed XRP exposure via a 13F filing with the SEC. The full scope of that filing reveals exactly which instruments the bank used, and why that distinction matters for price structure.
The bank accumulated 197,369 shares in the Volatility Shares XRP ETF and 317 shares in the Grayscale XRP Trust. Meanwhile, U.S.-listed spot XRP ETFs have drawn over $1.3 billion in cumulative inflows in their first 50 days, with 29 consecutive days of positive flows and a single-day peak of $13.59 million.
To put this into perspective, XRP’s exchange balances are simultaneously sitting at six-year lows, compressing available supply just as demand accelerates.
Discover: The best crypto to diversify your portfolio with
XRP Price Could Finally Have Its Awaited Rally
XRP broke out of a multi-week range earlier this week. This has preceded continuation, but instead, it had a short-term rejection. RSI sits at just under 50, after nudging the overbought threshold days ago.
Immediate support, for now, rests at the current price and the 50-period SMA. On a bullish note, a Technical analysis based on a Wyckoff reaccumulation breakout is targeting the $2.60–$2.70 zone, with an interim supply clustered at $2.15–$2.16.
To resume its rally, XRP needs to hold above $1.35, to then clear $$1.50 resistance, and ride institutional inflows toward $2.60–$2.70. Standard Chartered maintains an $8 price target on regulatory clarity.
However, a close below $1.35 would neutralize the current breakout thesis and expose the $1.20 support zone.
Institutional catalysts, including major ETF inflows and bank disclosures, have historically acted as short-term price accelerants for XRP.
Discover: The best pre-launch token sales
LiquidChain Does What XRP Can Only Dream
XRP’s institutional wave is real, but at the current price point, the asymmetric upside has compressed. Traders hunting for early-stage exposure before institutional re-rating are rotating attention toward infrastructure presales, where price discovery hasn’t yet occurred.
LiquidChain ($LIQUID) is a Layer 3 infrastructure project positioning as the cross-chain liquidity layer. It fuses Bitcoin, Ethereum, and Solana liquidity into a single execution environment.
With the 3 United, anything is possible. ⟁ — LiquidChain (@getliquidchain) May 8, 2026
 https://t.co/vqvBcdSQYC pic.twitter.com/50vrM4WX6v
Liquid’s architecture centers on a Unified Liquidity Layer with Single-Step Execution, Verifiable Settlement, and a Deploy-Once structure that lets developers access all three ecosystems without redeployment overhead.
The presale price is currently $0.01457, with more than $700K raised to date. The project is approaching the $750,000 milestone, a threshold that has historically drawn secondary attention from retail aggregators.
Readers researching cross-chain infrastructure exposure at this stage can explore LiquidChain’s presale details here.
The post XRP Price Could Start Another Rally: $7 Trillion Bank Announces Its Ripple Coin Investment appeared first on Cryptonews.
Revolut users worldwide saw Bitcoin (BTC) briefly displayed at $0.02 on Friday after a chart glitch in the fintech app, before the price snapped back within seconds.
The display problem surfaced through the app’s chart and push notifications, sparking widespread confusion across X (Twitter) and Reddit. Bitcoin continued trading above $80,000 on every major exchange during the incident.
What Happened on the Revolut App
Screenshots circulating on social media showed Bitcoin candles dropping to as low as $0.019916 on Revolut’s in-app chart, with similar anomalies appearing for Solana (SOL), XRP, and several other tokens.
“For 3 seconds, I thought I was about to buy the entire supply and become Satoshi’s final boss. Then I remembered: it’s probably just a Revolut chart glitch. Crypto never sleeps. Neither do bugs,” one user remarked.
Some users received push alerts claiming BTC had hit a 52-week low. The disruption lasted only a few seconds for most affected accounts.
Follow us on X to get the latest news as it happens
CoinGecko and CoinMarketCap showed no matching price action on tracked exchanges, indicating the issue was confined to Revolut’s display layer rather than any underlying market move.
Revolut Confirms Bitcoin Price Glitch
Revolut Support said the company was experiencing technical issues affecting some crypto functionalities, and that engineers were actively investigating the root cause.
The fintech, which holds a MiCA license through Cyprus and serves more than 68 million customers across 40 markets, has not detailed what triggered the faulty data feed.
The flash on screens arrived during a softer trading day for Bitcoin, which almost slipped below $80,000 after a modest correction that triggered almost $300 million in futures liquidations.

No user reports have confirmed any orders filling at the displayed glitch price.
Affected European and global users say balances and pending orders went unaffected, though the episode renewed concerns about how centralized apps handle third-party price feeds during volatile sessions.
Revolut has continued expanding its crypto footprint, including stablecoin settlement on Polygon, even after delisting some altcoins last year.
The post Revolut Confirms Bitcoin Price Glitch After App Briefly Shows BTC Near Zero appeared first on BeInCrypto.


Ether extended a retreat after failing to break above a key resistance zone, with ETH slipping to around $2,275 before attempting to stabilize. The move comes as a cluster of on-chain and market indicators point to softer near-term demand for Ethereum, potentially paving the way for further downside toward the $2,000 level and beyond.
Key takeaways
- On-chain activity is cooling: weekly average transactions declined about 10% to 4.79 million, while active addresses slipped 8% to 2.5 million, accompanied by a roughly 27% drop in network fees and a 47% fall in on-chain revenue over the past week.
- US-driven selling pressure persists: the Ethereum Coinbase Premium has remained negative since late April, signaling downside emphasis from US traders, alongside outflows from U.S. spot Ethereum ETFs totaling about $103 million and roughly $81.6 million pulled from global Ethereum investment products last week.
- Unstaking and liquidity exits accelerate: the Ethereum exit queue surged about 72,000% to 530,985 ETH by May 2, with more than 202,000 ETH queued for redemption by the latest update and an average wait of about three days. Total staked ETH stood at 38.6 million (31.72% of supply), despite a 45-day withdrawal lag.
- DeFi activity and TVL retreat: DefiLlama data show weekly DEX volumes dropping to $1.64 billion on May 8, a 46% decline over three weeks, while Ethereum’s DeFi TVL fell to about $124.7 billion, a level last seen in May 2025.
- Price pattern points to further downside risk: a rising wedge pattern on ETH/USD underpins a potential breakdown, with major support around $2,150–$2,200 and a pivotal threshold near $2,000. A break below $2,000 could target roughly $1,830, with scenarios suggesting $1,750–$1,850 if $2,300 support isn’t reclaimed.
Deteriorating on-chain fundamentals
Ethereum’s network activity has cooled in recent weeks as a measure of on-chain demand softens. Data from Nansen show the weekly average number of transactions dipping to 4.79 million, a 10% reduction from the prior period, while active addresses declined to about 2.5 million, an 8% drop. The ebbing activity coincides with lower fee revenue, as network fees fell roughly 27% over the past seven days, contributing to a 47% shrinkage in on-chain revenue during that span.
Analysts interpret these metrics as signaling weaker user conviction and diminished organic demand for ETH, which can complicate attempts to sustain upside momentum despite broader macro optimism. In parallel, DefiLlama’s weekly snapshot shows a sharp pullback in DeFi activity, with weekly DEX volumes sliding to $1.64 billion on May 8 — a 46% drop over three weeks — and Ether-based DeFi TVL sliding to about $124.7 billion, a level not seen since May 2025.
Liquidity drains and the staking exit queue
One of the more striking recent developments is the surge in the unstaking queue. By May 2, Ethereum’s exit queue had exploded to 530,985 ETH, up roughly 72,000% from the previous pace. By the latest readings, more than 202,000 ETH were queued for redemption, with an expected wait time of around three days. This wave of liquidity outflows has come alongside elevated risk sentiment in DeFi following a spate of hacks and attacks earlier in the year.
In April 2026, DeFi platforms suffered about $625 million in losses across 30 separate incidents, highlighted by the $292 million KelpDAO bridge exploit and a broader trend of deposits fleeing platforms like Aave — moves that intensified the perceived need for liquidity and liquidity preferences among investors. Analyst Pete, writing on X, summarized the risk atmosphere: “DeFi yield on Ethereum is getting crushed by hacks, exploits and increasingly nasty attack surfaces.”
Even as the exit queue surged, the stake base remained sizable. About 3.6 million ETH were queued for staking entry, keeping total staked ETH near 38.6 million and representing roughly 31.72% of circulating supply, despite an ongoing, roughly 45-day wait for stake withdrawal or redemption in many cases.
US flows, ETF dynamics and price follow-through
The near-term price trajectory is being shaped in part by ongoing dissemination of US-centric trading flows. The Ethereum Coinbase Premium Index has stayed negative since late April, implying that US buyers and sellers are driving price disparities relative to other markets. In tandem, spot Ethereum ETF activity reflected continued selling pressure: US-listed Ethereum ETFs logged $103 million in net outflows on a single session, marking the largest withdrawal since mid-March. Across global Ethereum investment products, outflows exceeded $81.6 million last week, underscoring a broader institutional tilt toward liquidity and risk reduction during the period.
On the market microstructure side, taker buy volume for ETH on Binance has dipped into negative territory, with figures as low as -$25 million in recent sessions, indicating a rise in aggressive market sell orders and a potential setup for near-term volatility and a retest of support levels, according to CryptoQuant commentary.
Technical setup: rising wedge and downside risk filters
From a chart perspective, ETH/USD has been trading inside a rising wedge that broke below its lower boundary near $2,300. The immediate hurdle remains at around $2,150–$2,200, where the 100-day and 50-week moving averages cluster, followed by a psychological test near $2,000. A decisive move below this threshold would open a path toward the measured wedge target near $1,830, with some analyses flagging a potential drop to the $1,750–$1,850 zone if the $2,300 level is not reclaimed promptly.
These dynamics align with recent coverage suggesting that a sustained move below critical supports could lead to a prolonged downside phase, even as headlines around DeFi security and ETF flows continue to influence price behavior in the short run. For traders watching the chart, the setup underscores the importance of monitoring both on-chain activity and macro liquidity signals in concert with price action.
Looking ahead, investors should watch how ETH behaves around the $2,000 mark, as well as the flow data from US and global Ethereum products. Ongoing security incidents in DeFi and shifting ETF allocations will likely continue to shape near-term sentiment, even as the broader crypto market narratives evolve.
This article was originally published as Four signs indicate Ethereum’s $2.4K rally is exhausted on Crypto Breaking News – your trusted source for crypto news, Bitcoin news, and blockchain updates.

Key Takeaways
- Anthropic is pursuing funding that would establish a pre-money valuation near $900 billion
- The AI company seeks to secure up to $50 billion to boost its computing capabilities
- Annual revenue projections show the company reaching beyond $45 billion soon, jumping from $9 billion in late 2024
- Major investors like Dragoneer, General Catalyst, and Lightspeed are reportedly interested
- If finalized, this funding would position Anthropic above OpenAI in market valuation
The AI firm Anthropic, creator of the Claude suite of artificial intelligence tools, is currently negotiating a fundraising effort that could bring in as much as $50 billion, the Financial Times reports. Sources indicate the company could achieve a valuation approaching $900 billion on a pre-money basis.
Should this valuation materialize, Anthropic would eclipse its competitor OpenAI in terms of market worth. Industry sources cited by the FT suggest the funding round could reach completion in the next two months.
The company’s valuation stood at $380 billion just months ago in February 2026. A leap to nearly $1 trillion would represent one of the most dramatic valuation accelerations in private technology sector history.
Annualized revenue figures for Anthropic are projected to exceed $45 billion in the near term. This represents a fivefold increase from the $9 billion figure recorded at year-end 2024.
According to the FT’s sources, investment firms including Dragoneer Investment Group, General Catalyst, and Lightspeed Venture Partners have expressed interest in participating in the funding round.
Major Tech Giants Already Invested Billions
Anthropic has previously attracted substantial financial backing from leading technology corporations. Google pledged as much as $40 billion at a $350 billion valuation, structured with $10 billion in immediate funding and an additional $30 billion contingent on hitting specific performance targets.
Amazon put $5 billion into the company with provisions allowing for up to $20 billion in additional investment. These arrangements were both negotiated at the $350 billion valuation established during February’s funding activity.
The new capital injection is earmarked for scaling up computational resources. Strong customer demand for Anthropic’s offerings has accelerated, and company representatives have indicated that supply limitations are currently constraining output capacity.
Strategic partnerships with Amazon Web Services, Google, and Broadcom have been established to guarantee sustained access to computing resources over the long term.
Claude Code and Cowork Fueling Revenue Surge
A significant portion of the demand surge stems from Claude Code, Anthropic’s specialized AI assistant engineered to accelerate software development workflows. Bloomberg’s reporting suggests this product’s explosive growth prompted the company to pursue additional funding on an accelerated timeline.
The company’s Cowork AI agent, targeted at professionals in non-technical departments, has similarly experienced rapid market uptake, company statements indicate.
Founded in 2021 by Dario Amodei alongside former OpenAI team members, Anthropic has emerged as one of the artificial intelligence industry’s most scrutinized players.
The ongoing fundraising discussions underscore the remarkable velocity at which investor interest in AI infrastructure has intensified. Anthropic is positioning itself to capitalize on this momentum through what could become one of the largest private capital raises ever recorded.
This potential funding round arrives as Anthropic continues building out partnerships with cloud computing providers to guarantee sufficient processing power for operating its sophisticated AI models.


The U.S. labor market continued to show at least modest strength in April, according to data released Friday by the Bureau of Labor Statistics.
The economy added 115,000 jobs during the month, well above economist expectations for 62,000, though down from 185,000 in March (revised from an originally reported 178,000).
The unemployment rate remained at 4.3%, in line with forecasts.
Bitcoin traded at $80,200 in the minutes after the release, roughly flat over the past 24 hours. U.S. stock index futures added to earlier gains, the Nasdaq 100 higher by 0.9%. The 10-year Treasury yield fell 2 basis points to 4.37%.
The report arrives at a delicate moment for markets and policymakers. Last week, the Federal Reserve left its benchmark fed funds rate range unchanged at 3.50%-3.75%, extending its holding pattern as officials weigh slowing economic growth against persistent inflation pressures.
The data also comes ahead of a new chairman taking the reins at the Fed, with Kevin Warsh expected to soon be confirmed by the Senate to replace Jerome Powell later this month.
Though off their highs, oil prices have remained elevated, with uncertainty around the Strait of Hormuz keeping energy markets on edge. Higher crude prices risk feeding into headline inflation while also weighing on consumer spending and economic activity.


Coinbase stopped working for over seven hours on Thursday after hot air in an Amazon data center threw its cloud services into disarray.
The exchange’s users found themselves unable to buy or sell crypto, while order book prices displayed hundreds of dollars higher than rival exchanges Binance and Hyperliquid.
The cause? Coinbase blames “increased temperatures in the affected AWS service.”
Amazon Web Services (AWS), which is one of the largest providers of cloud infrastructure that keeps much of the internet ticking over, claims to have suffered from a “thermal event” in one of its data centers in Northern Virginia.
Read more: Blockchain ‘alternative’ to Amazon Web Services just another crypto scam
The increase in temperature apparently affected its cloud hosting hardware, leading to a loss of power.
AWS quickly got to work on a solution, and as of this morning said it was “actively working to bring additional cooling system capacity online, which will enable us to recover the remaining affected racks in a controlled and safe manner.”
Amazon notes that its data centers rely on evaporation cooling, a system that involves filters in its air conditioning units being “dampened” with water, cooling any hot air that comes in and evaporating the water in the process.
Read more: Major crypto exchanges suffer complications after AWS outage
Whatever the fix was to the cooling system, it seems to have paid off as Coinbase noted in the last two hours that, “All markets have been re-enabled for trading on Coinbase Exchange.”
Before this, it said that it was working to re-enable trading and that it would have to place all markets “in ‘Cancel Only’ mode before we move to re-enable trading.”
After this, it moved the markets into “auction mode.”
AWS outage adds to Coinbase’s growing problems
The entire debacle adds to a pretty bad start to 2026 for Coinbase. It fired 14% of its staff last week, and suffered $394 million in losses during the first quarter of 2026.
Software engineer Gergely Orosz picked up on this, noting how the hours-long outage makes for “unfortunate optics for Coinbase… a few days after their CEO said how non-technical teams are shipping code to production.”
He said, “This outage is because Coinbase seems to have a hard dependency on AWS, and when AWS (or a part of it) is down, so is Coinbase,” adding that the whole thing is “terrible advertising.”
Crypto exchanges have already suffered outages related to AWS before in 2025, which caused Binance to suspend its withdrawals and caused issues for KuCoin, MEXC, and Rabby wallet.
In this case, data centers within the Singapore region had experienced a power loss, causing knock-on disruptions to firms reliant on AWS data centers within the area.
Got a tip? Send us an email securely via Protos Leaks. For more informed news and investigations, follow us on X, Bluesky, and Google News, or subscribe to our YouTube channel.

Cardano price has started recovering after breaking above a key descending resistance trendline, raising hopes that bulls may attempt a larger move toward the important $0.30 psychological level.
Summary
- Cardano price has rebounded after breaking above a multi-month descending trendline, with ADA climbing nearly 8% from recent weekly lows near $0.245.
- CoinGlass liquidation heatmap data showed heavy liquidation clusters between $0.28 and $0.30, pointing to a potential volatility zone if bullish momentum strengthens.
- Santiment data indicated continued whale accumulation, with large ADA holders increasing positions during recent market consolidation.
According to data from crypto.news, Cardano (ADA) was trading around $0.264 at press time on May 8, up nearly 8% from its recent weekly lows at $0.245. The token has also reclaimed levels last seen in late April after spending several months trapped under a broader downtrend structure.
The latest recovery comes as the broader crypto market stabilizes following renewed risk appetite across major digital assets. Bitcoin (BTC) holding above the $80K support level has also helped improve sentiment toward altcoins, including ADA.
On the daily chart, ADA recently broke above a descending resistance trendline that had capped upside attempts since February. The breakout followed weeks of consolidation between roughly $0.24 and $0.27, suggesting that selling pressure may gradually be weakening.
At the same time, derivatives activity indicates traders are positioning for increased volatility. CoinGlass liquidation heatmap data shows a large concentration of liquidation liquidity clustered around the $0.28 to $0.30 range. These dense liquidity pockets often act as magnetic zones for price action, especially when momentum begins building in one direction.
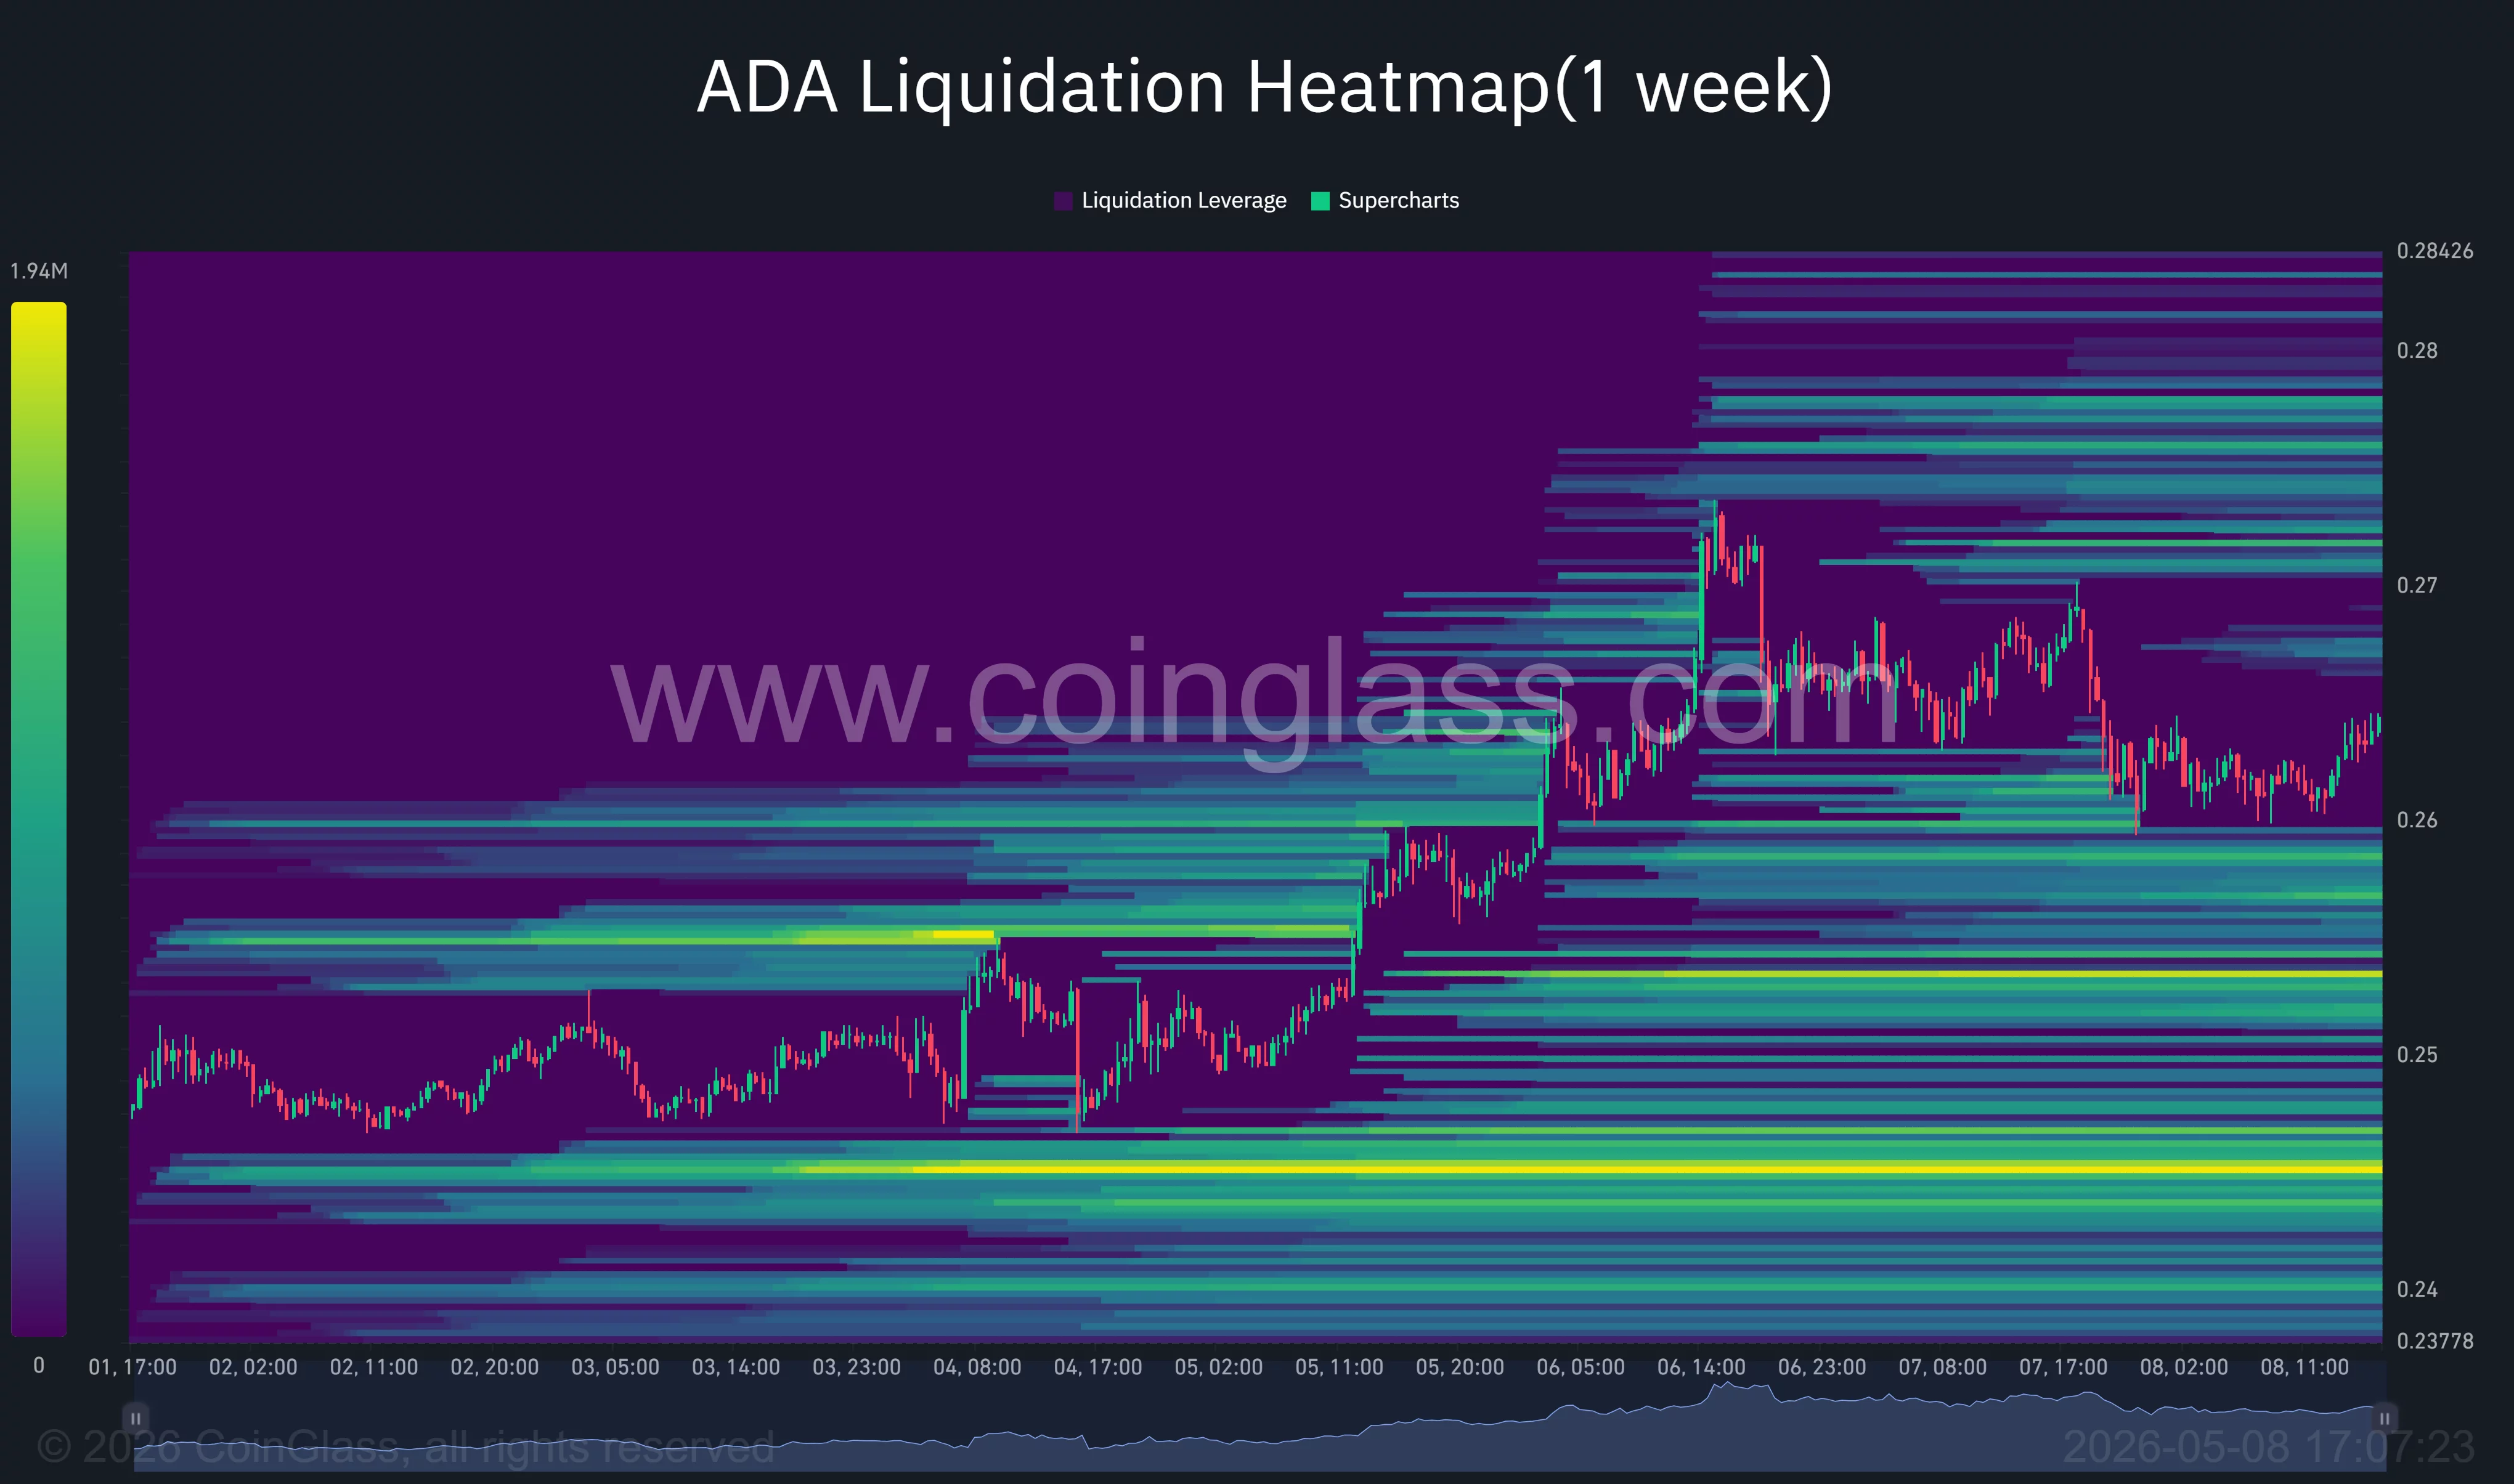
If ADA continues climbing toward those levels, it could trigger a wave of short liquidations that may accelerate upside momentum further.
Meanwhile, whale accumulation trends continue to strengthen. Recent on-chain data from Santiment indicates that large Cardano holders have steadily increased their positions over recent weeks despite the broader market consolidation. Wallets holding between 10 million and 100 million ADA reportedly continued accumulating tokens during the recent dips, signaling that larger investors may still be positioning for a longer-term recovery.
Such accumulation trends are often closely watched by traders because sustained whale buying can help absorb selling pressure while improving overall market confidence.
Cardano price analysis
The daily chart shows ADA successfully pushing above its descending trendline resistance after several failed breakout attempts earlier this year. Price has also started forming a series of higher lows since mid-April, suggesting buyers are gradually regaining control of the trend.
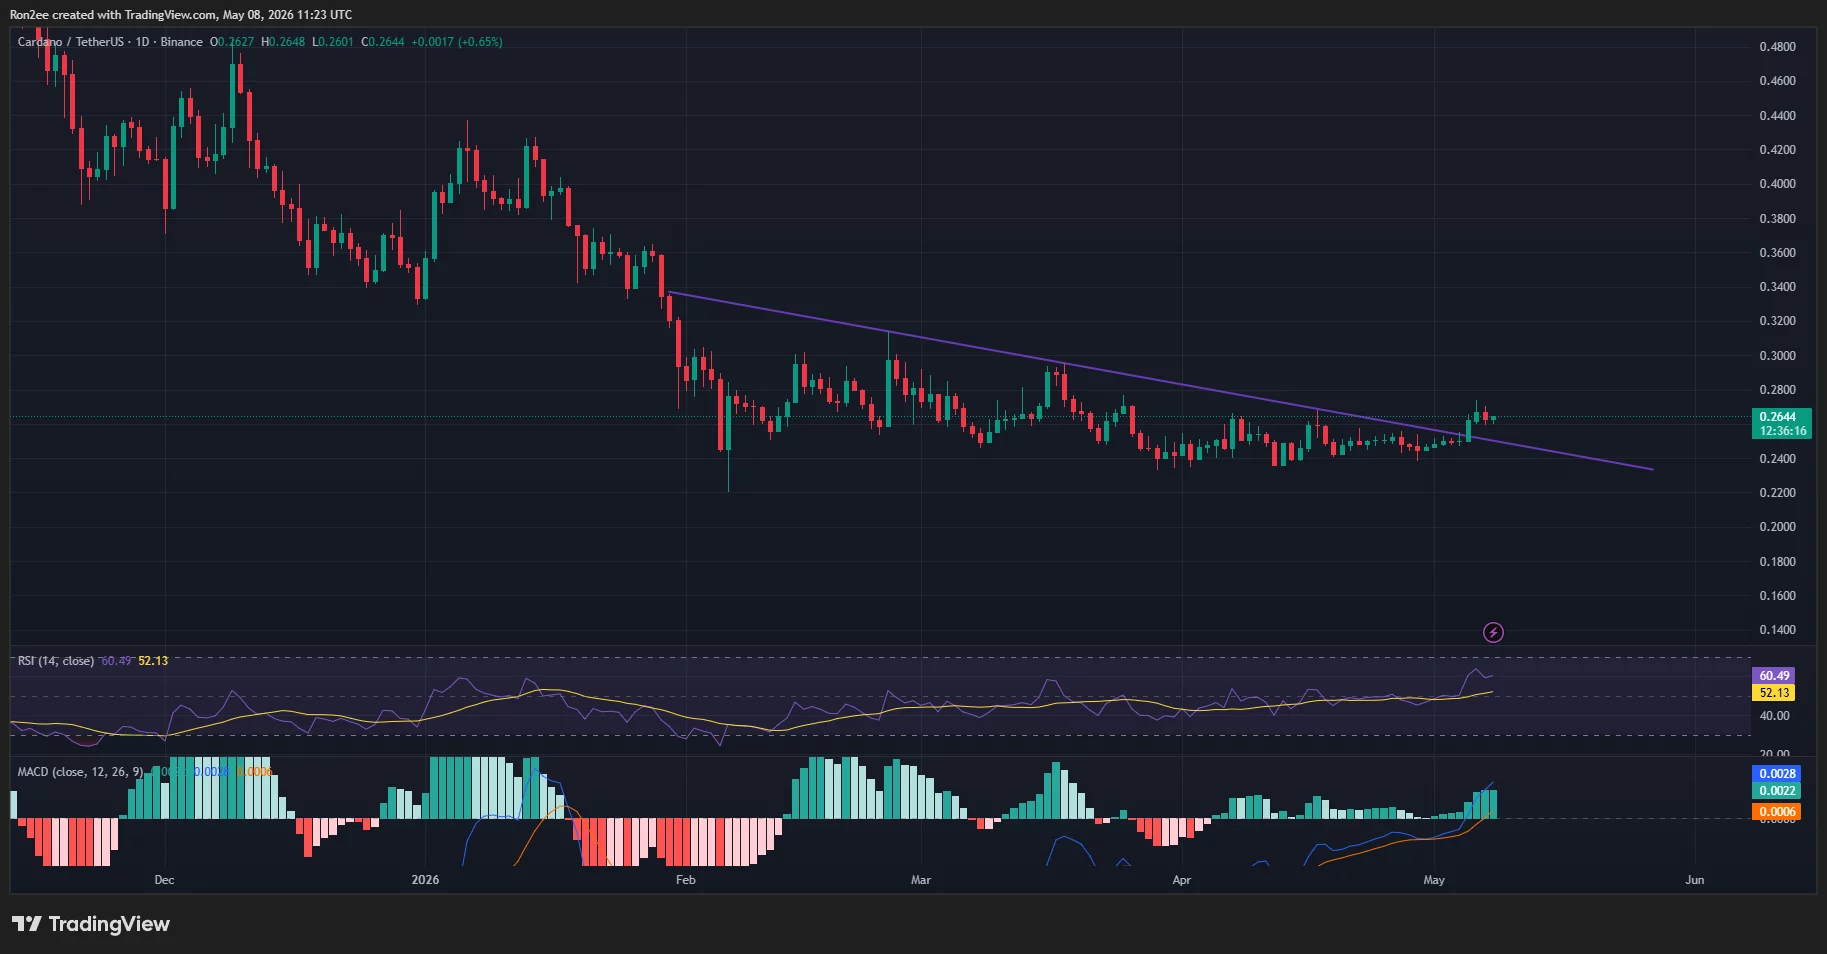
Momentum indicators are beginning to support the bullish structure. The RSI has climbed above 60 and continues trending upward while remaining above its signal line, reflecting strengthening buying momentum without yet entering overbought territory.
Meanwhile, the MACD has completed a bullish crossover and moved higher above the signal line. The histogram has also turned increasingly positive, suggesting bullish momentum is continuing to build.
Despite the breakout, ADA still faces several important resistance levels ahead. The $0.27 region remains the first key barrier, followed by heavier liquidation clusters near $0.28 and the major psychological resistance at $0.30.
If bulls manage to push price above the $0.30 zone, it could open the door for a stronger rally toward levels not seen since the first quarter of 2026.
On the downside, failure to hold above the broken trendline could invalidate the breakout setup and pull ADA back toward the $0.25–$0.24 support region, where buyers previously stepped in aggressively.
Disclosure: This article does not represent investment advice. The content and materials featured on this page are for educational purposes only.
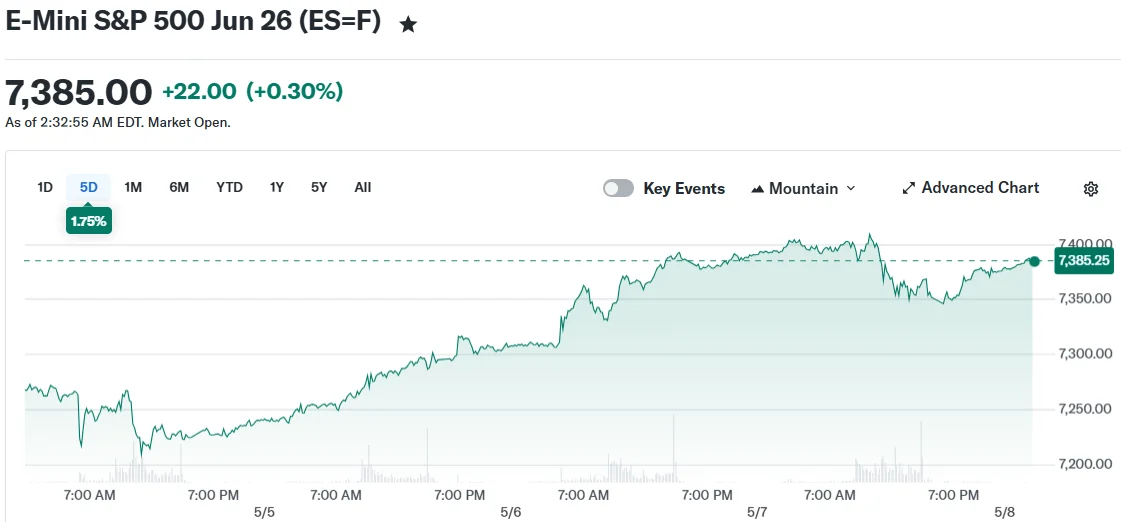
Key Takeaways
- Futures for the S&P 500, Nasdaq, and Dow all advanced Friday morning even as US-Iran military tensions flared in the Strait of Hormuz
- Iranian forces launched coordinated missile, drone, and small-boat assaults on American warships; US military retaliated with strikes on Iranian installations
- Trump downplayed the confrontation as minor and reaffirmed the ceasefire agreement, providing reassurance to investors
- Energy markets showed muted reaction with Brent crude gaining 1.1% and WTI adding 0.7%, indicating contained anxiety over supply disruptions
- Focus shifts to April’s employment situation report, with projections calling for 65,000 new positions and unemployment steady at 4.3%
Investors largely dismissed military hostilities between the United States and Iran on Friday, pushing stock futures into positive territory as attention turned toward crucial employment statistics.
Contracts tied to the S&P 500 advanced 0.5%, with Nasdaq 100 futures gaining 0.7%. Dow futures increased 0.3%, representing approximately 137 points. The three benchmark indices had retreated on Thursday, with the Dow momentarily breaching 50,000 before settling below that psychological threshold for the second consecutive session.

Iranian military forces executed coordinated attacks involving missiles, unmanned aerial vehicles, and small naval vessels targeting US warships positioned in the Strait of Hormuz on Thursday. US Central Command characterized these strikes as “unprovoked” while emphasizing American forces did not seek further escalation.
American forces answered by targeting Iranian military installations connected to the offensive operations. President Trump communicated via Truth Social that US destroyers sustained no damage and characterized the response as measured.
Trump further minimized Iran’s attacks as trivial and confirmed the bilateral ceasefire remains operational. This messaging appeared to ease market concerns.
Wall Street Maintains Composure Amid Geopolitical Flare-Up
Henry Allen, a macro strategist at Deutsche Bank, acknowledged the obvious escalation while observing that financial markets were not incorporating a catastrophic outcome.
Oil prices climbed but remained relatively stable. Brent crude increased 1.1% to reach $101.15 per barrel. West Texas Intermediate advanced 0.7% to $95.50 per barrel.
The measured response in energy markets indicates investors do not anticipate significant interruption to global oil flows.
The greenback strengthened 0.1% versus a basket of major currencies. The benchmark 10-year Treasury yield declined one basis point to 4.38%.
Employment Data Commands Attention
Friday’s release of April’s nonfarm payrolls data represents the primary catalyst for market participants. Consensus estimates compiled by Bloomberg anticipate 65,000 positions were created during the month.
The jobless rate is projected to remain unchanged at 4.3%. Such an outcome would signal a resilient employment landscape despite persistent geopolitical headwinds.
Quarterly financial results are scheduled for release Friday from Toyota Motor, Sony, and Brookfield Asset Management.
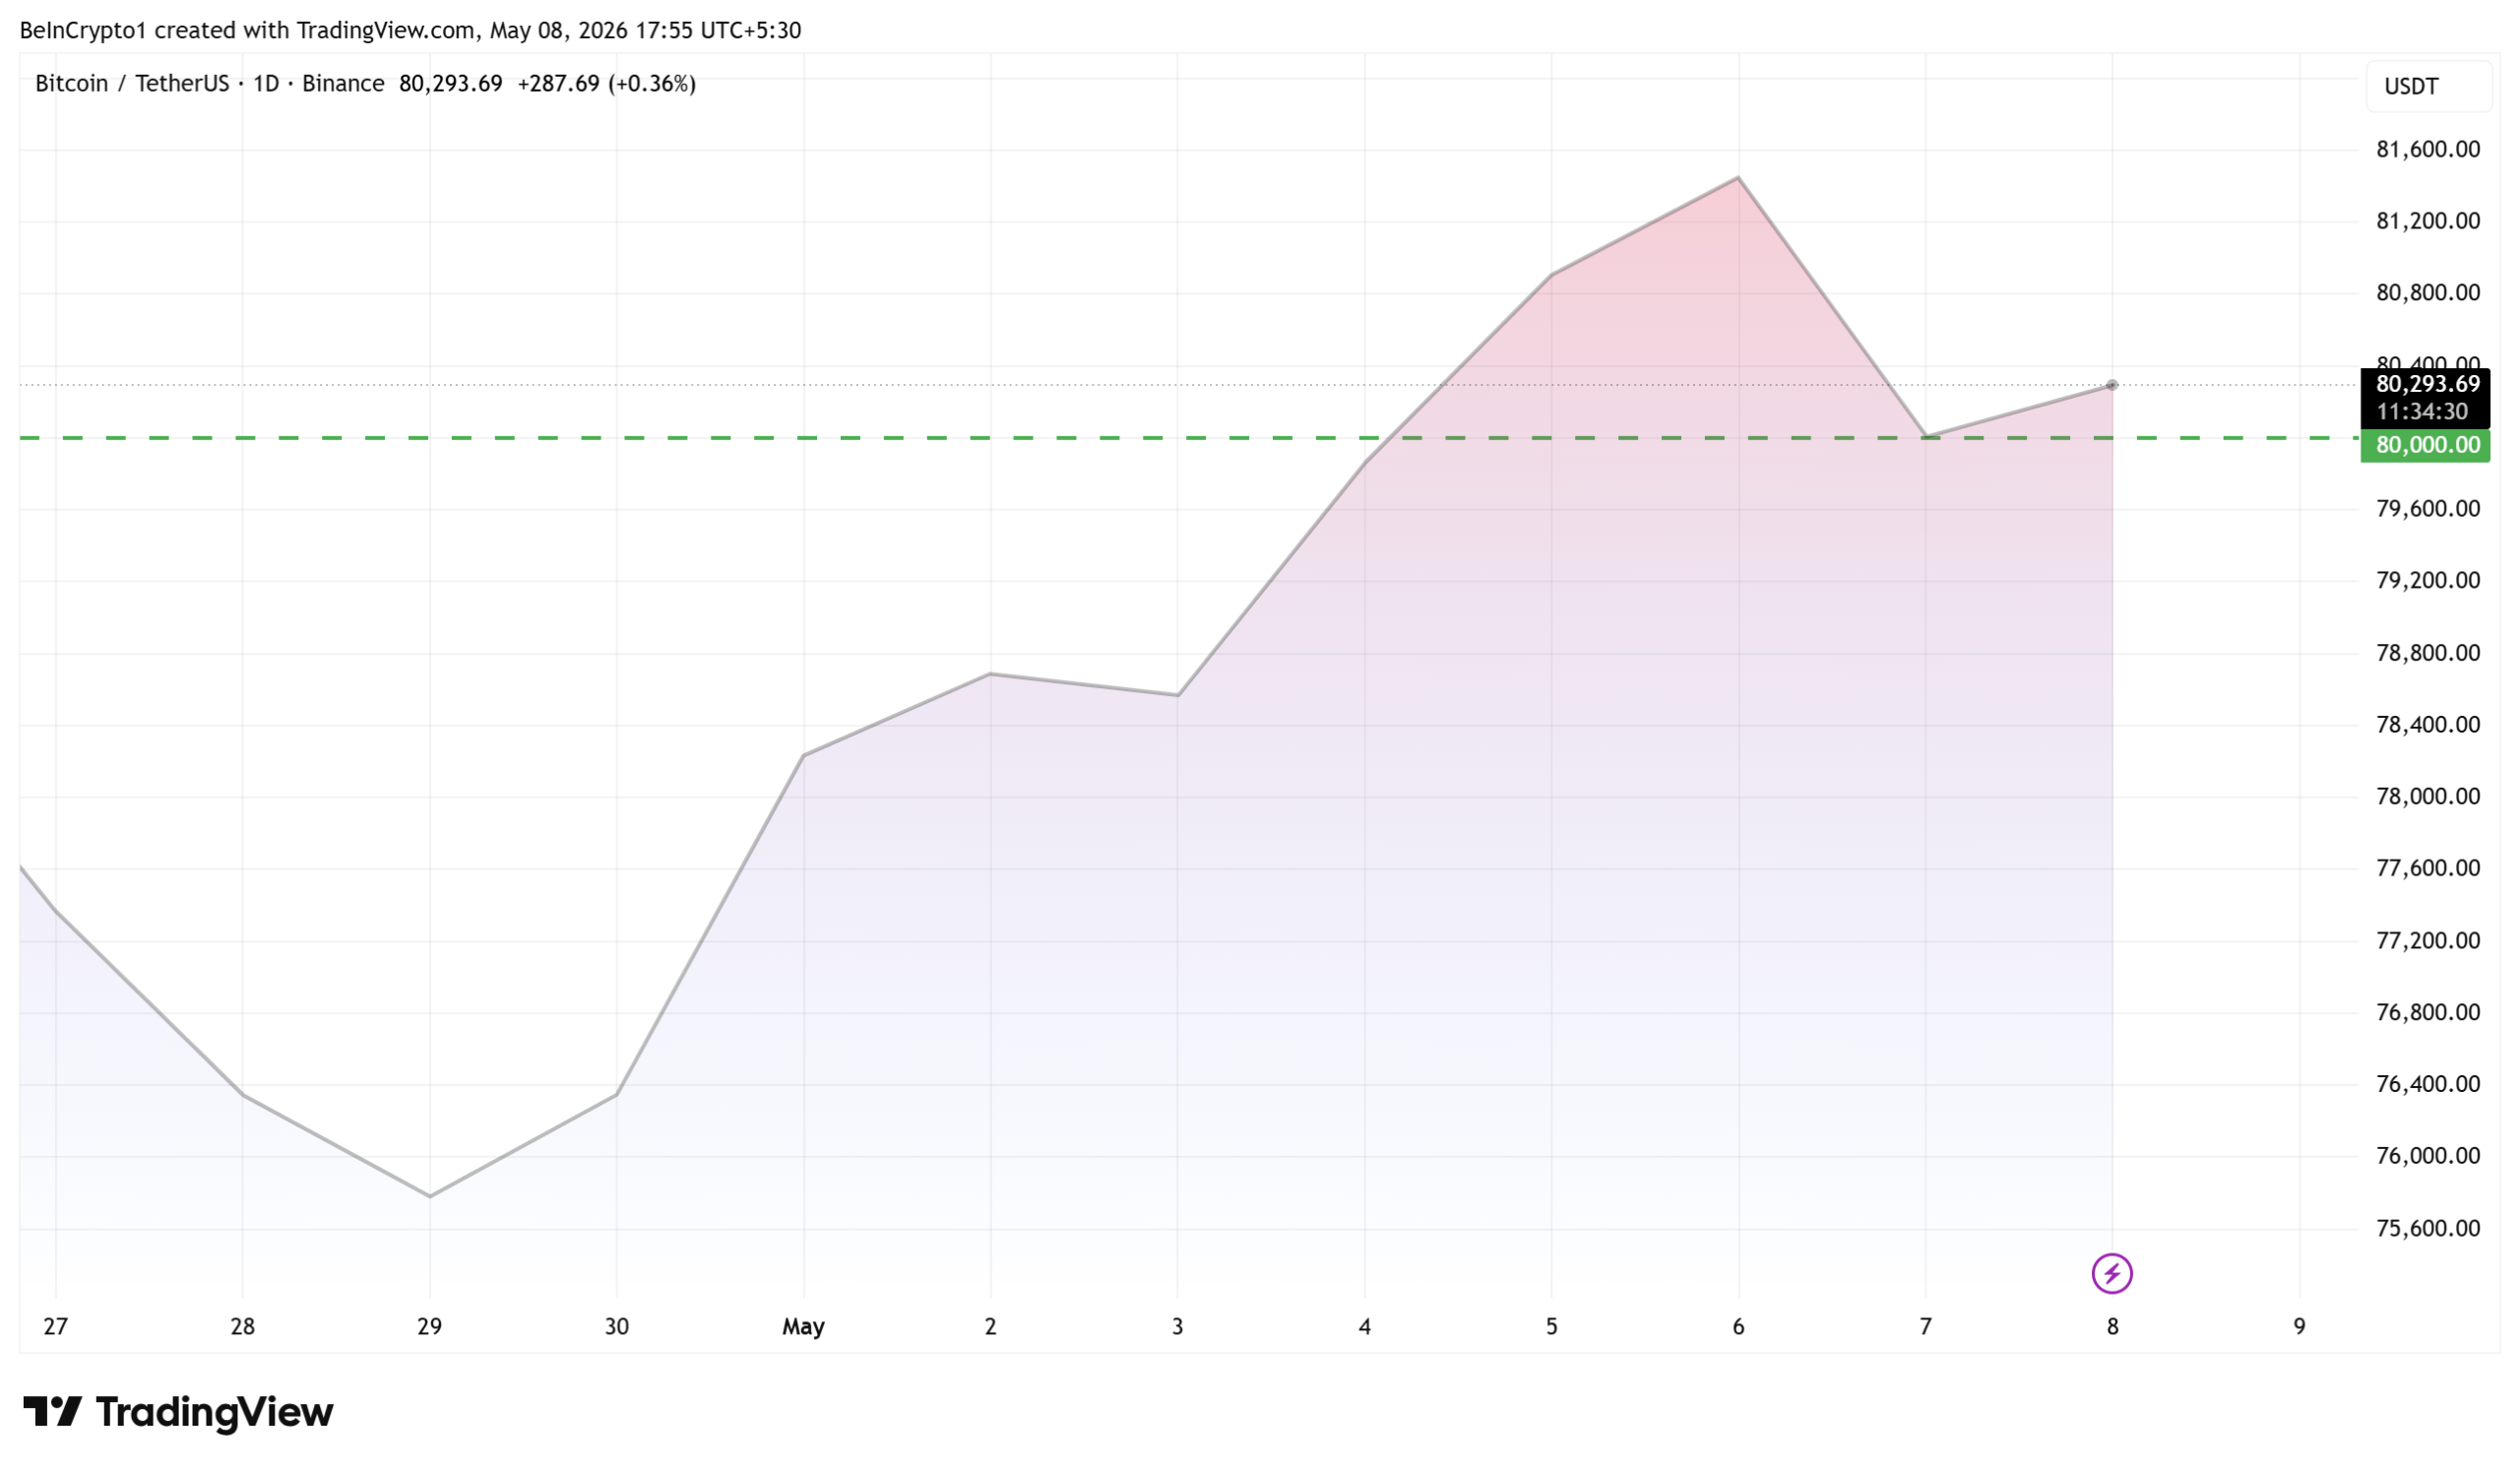
Bitcoin retreated beneath the $80,000 threshold following reports of the US-Iran military engagement, based on earlier trading session data.
Government bond yields drifted lower during early morning trading on expectations for de-escalation in the Middle Eastern theater.
The Dow, S&P 500, and Nasdaq remain positioned for weekly gains if premarket momentum persists through the closing bell.
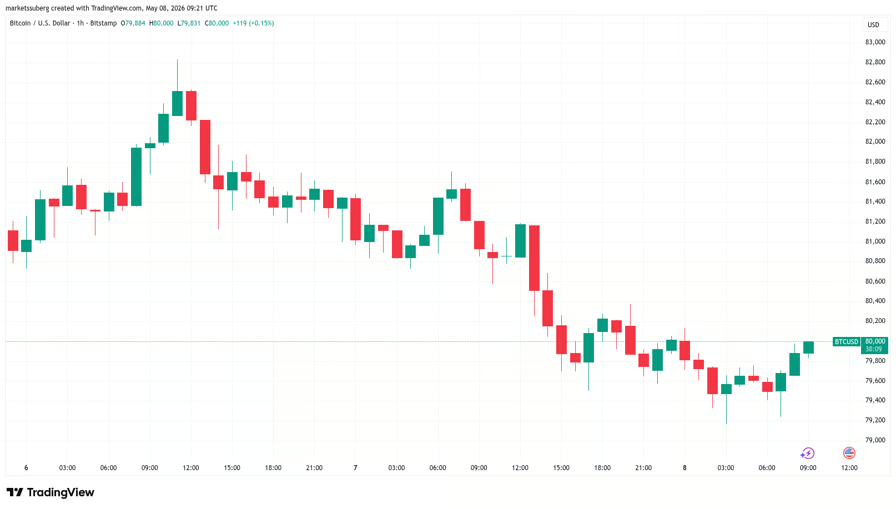
Bitcoin (BTC) revisited $80,000 on Friday after US-Iran war nerves sparked 3% daily losses.
Key points:
- Bitcoin bullish momentum slowly returns after a shakeout amid familiar geopolitical tensions.
- Traders flag support levels in the mid- to high-$70,000 zone as important for bulls to defend.
- Unprecedented Bollinger Bands data calls for more volatile conditions going forward.
Bitcoin retests $80,000 after sell-off
Data from TradingView showed BTC price downside pressure easing toward the Wall Street open.

BTC/USD one-hour chart. Source: Cointelegraph/TradingView
Thursday had seen risk assets lose out amid rumors of the US restarting its “Project Freedom” campaign against Iran, while military strikes from both sides placed a fragile ceasefire in jeopardy. The S&P 500 came off new all-time highs.

S&P 500 one-hour chart. Source: Cointelegraph/TradingView
Commenting, crypto trader Michaël van de Poppe said that the retracement was no “surprise” given recent brisk gains.
“Assets trend in waves. Bitcoin has seen multiple days of momentum upwards, so it’s not strange to expect it to consolidate just now,” he wrote in an X post at the time.
“As long as the trend remains intact, I think we’ll see more upside during coming weeks.”

BTC/USDT one-day chart. Source: Michaël van de Poppe/X
Van de Poppe subsequently described Bitcoin as “doing just fine,” but said $76,000 needed to hold as support.
“The first rally out of a bear market lands at that resistance, and it would give some more momentum for Altcoins,” he added.
Trader Jelle also remained optimistic on the outlook while arguing that the day’s lows near $79,000 needed to hold.
“Even in the bearish case, I believe the turquoise zone will hold the price and trigger a reversal to the upside,” he told X followers about charts showing $74,500 as a potential downside target.

BTC/USDT charts. Source: Jelle/X
Bitcoin volatility metric demands larger moves
On daily time frames, BTC/USD thus failed to sustain a break beyond the upper band of the Bollinger Bands volatility metric.
Related: Bitcoin can crash to $50K if ‘most critical’ bear market test fails: Analysis

BTC/USD one-day chart with Bollinger Bands data. Source: Cointelegraph/TradingView
As Cointelegraph reported, positive signals from the Bands even inspired their creator, John Bollinger, to take a position via his proprietary investment funds.
In an X response, trader SuperBro observed the narrowest-ever conditions for the Bands on monthly time frames — a key prerequisite for heightened volatility next.

BTC/USD one-month chart with Bollinger Bands data. Source: Cointelegraph/TradingView
Cleveland releases limited edition set of 588 Tour Action wedges

Apple could bring hologram-like visuals to the iPhone

OHH MYYY GODDD XRP WORLD TAKE OVER ANNOUNCED?!?!
Manchester United reach agreement with Casemiro over contract clause amid transfer speculation

US brings back mandatory military draft registration

Steven Gerrard disagrees with Gary Neville over ‘shock’ Chelsea and Arsenal claim | Football


-

 NewsBeat5 days ago
Channel 5 – All Creatures Great and Small series 7 new post
-

 Crypto World1 day ago
Upbit adds B3 Korean won pair as Base token gains Korea access
-
 Crypto World4 hours ago
HarrisX Poll Found 52% of Registered Voters Support the CLARITY Act
-
 NewsBeat1 day ago
NCP car park operator enters administration putting 340 UK sites at risk of closure
-
 Tech7 days ago
Trump’s 25% EU auto tariff breaches Turnberry Agreement that also covers semiconductors and digital trade
-
 Sports7 days ago
Paul Scholes issues Marcus Rashford reality check as agreement emerges over Man United star
-

 Tech4 days ago
Image AI models now drive app growth, beating chatbot upgrades
-

 Entertainment7 days ago
Met Gala 2026 Rumored Guest List Is Turning Heads
-
Entertainment7 days ago
New on Prime Video in May 2026 — Full List of Movies and Shows
-

 Entertainment7 days ago
Kylie Jenner Hit With Second Lawsuit From Ex-Housekeeper
-

 Sports7 days ago
Cavaliers vs. Raptors Game 6 live score, updates, highlights from 2026 NBA playoffs first-round series
-

 Entertainment5 days ago
Melissa Joan Hart and More Stars Attend 2026 Kentucky Derby
-
 Sports7 days ago
David Benavidez responds to team Canelo saying the fight will never happen
-
Entertainment6 days ago
New Netflix Movies in May 2026 — My Top 3 Picks to Stream
-
 Sports7 days ago
IPL 2026: ‘Love you darling’- Hardik Pandya’s reaction to MS Dhoni steals the show |Watch | Cricket News
-

 Entertainment7 days ago
Young and the Restless Next Week: Cane Arrested & Matt’s Deadly New Scheme!
-

 Tech7 days ago
Mother’s Day 2026 Gift Guide: Audio to Upgrade Mom’s Lifestyle
-
Crypto World6 days ago
Pi Network Mandates Protocol 23 Upgrade for All Mainnet Nodes Before May 15 Deadline
-

 Business5 days ago
Luka Doncic Injury Update: Doncic’s Hamstring Recovery Slows Lakers’ Hopes Against Thunder: Can He Run Yet?
-

 Business7 days ago
Can Victor Wembanyama Bring the NBA Ring to Spurs in 2026? Historic Playoff Run Fuels Title Dreams
You must be logged in to post a comment Login