
Crypto World
Ethereum (ETH) Price Analysis: Whale Buying Intensifies as Network Staking Demand Explodes
Key Highlights
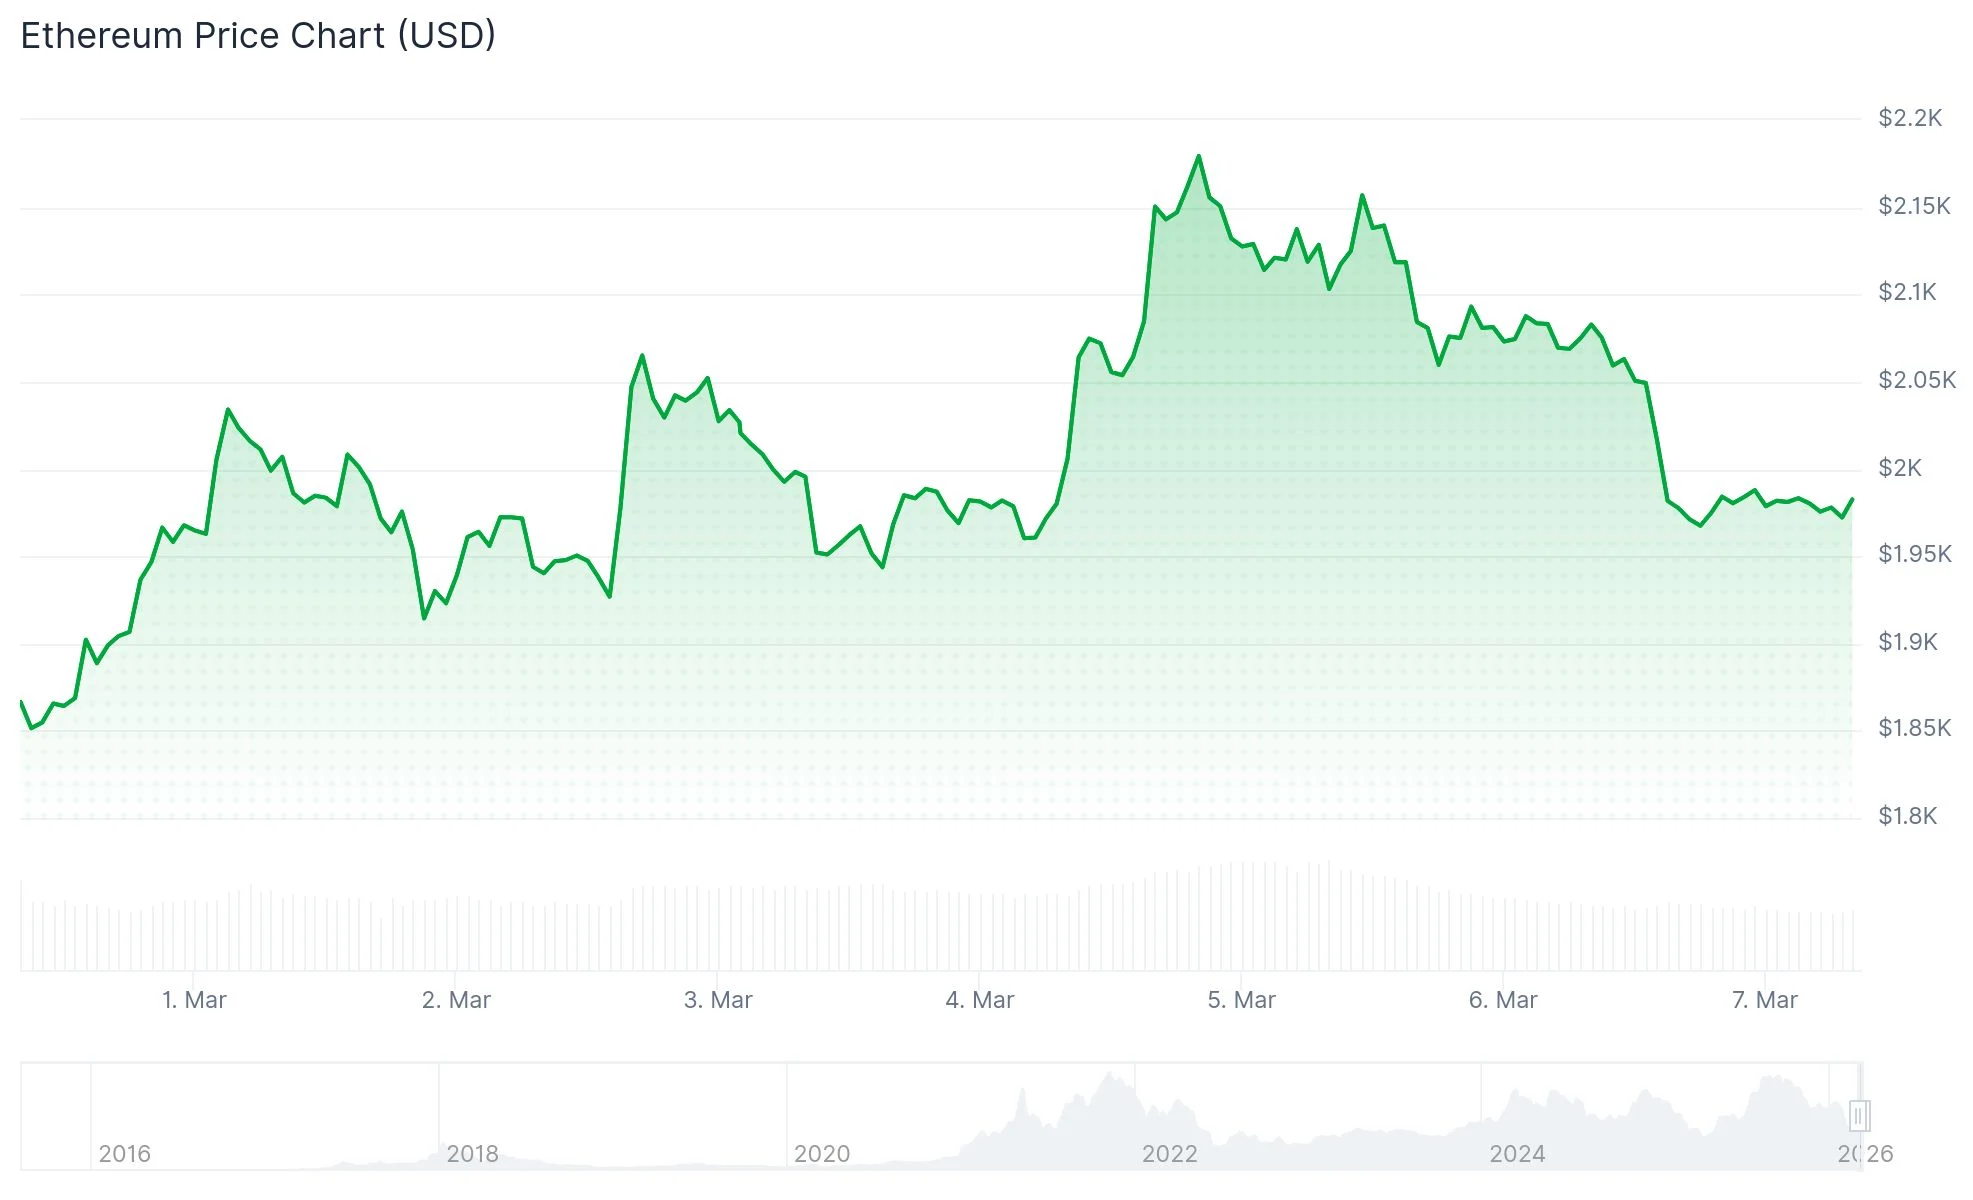
- ETH recovered from $1,830 lows to approach $2,200 before consolidating around the $2,000 zone
- Whale wallets and veteran holders continue accumulating at the current $2,000 support threshold
- Spot Ethereum ETFs in the United States experienced $90 million in net outflows over the past week
- The validator entry queue has exploded to 3.4 million ETH, a dramatic increase from 904,000 in early January
- Ethereum co-founder Vitalik Buterin unveiled the Minimmit proposal to streamline finality from two rounds to one
Ethereum’s recent price action has been marked by significant volatility. After dropping to approximately $1,830 in late February, the asset staged an impressive recovery, climbing to nearly $2,200. Following this rally, ETH has retraced and is currently consolidating around the psychologically important $2,000 threshold.

The $2,000 price point has emerged as a critical battleground. Blockchain analytics reveal that major wallet addresses have been accumulating during recent price weakness. Instead of distributing holdings, long-term market participants are increasing their positions. Futures market data indicates that derivatives traders maintain predominantly bullish positioning.
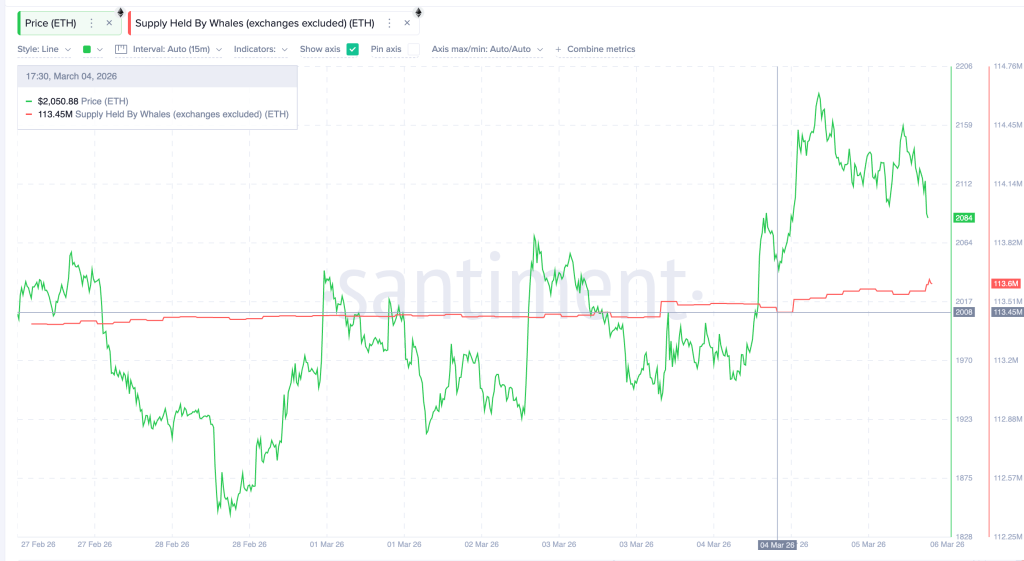
Analysis of cost-basis metrics reveals substantial ETH volume last changed hands near the $2,000 mark. This concentration suggests numerous investors have breakeven positions at current levels, creating a natural incentive to defend this price floor.
From a technical perspective, Ethereum is developing a converging wedge pattern. The asset attempted to breach $2,200 resistance but was rejected, establishing a lower peak. Meanwhile, an ascending support trendline continues to provide upside momentum. This compression pattern indicates an imminent breakout.
Should ETH successfully clear $2,200, technical analysts identify $2,400 and $2,750 as subsequent resistance targets. Conversely, a breakdown below $2,000 would likely expose support areas near $1,850 and $1,750.
Institutional ETF Withdrawals Create Headwinds
Spot Ethereum exchange-traded funds in the United States recorded $90 million in net withdrawals over the recent trading week. This outflow pattern suggests certain institutional participants are reducing their exposure. The capital exit has contributed to diminished near-term buying momentum.
The overall market sentiment remains measured. Macroeconomic uncertainties continue to influence investor behavior, with some large-scale market participants apparently trimming positions in anticipation of potential economic shifts.
Despite these challenges, Ethereum’s price has maintained its position above crucial long-term support levels. Bearish forces have been unable to trigger a more substantial downturn.
Technical indicators present a mixed picture. The Relative Strength Index currently sits at 49, indicating neutral momentum. The MACD remains in negative territory at -55.8. However, both the Commodity Channel Index and Stochastic Oscillator readings suggest building upward pressure.
Staking Demand Reaches Unprecedented Levels
Demand for Ethereum staking has accelerated dramatically. The validator activation queue has ballooned to 3.4 million ETH, representing a substantial increase from approximately 904,000 ETH recorded in early January. Current estimates place the waiting period at roughly 60 days.
Corporate entities and cryptocurrency exchanges are increasingly choosing to stake their ETH holdings rather than liquidate them. Market observers note that institutional players are prioritizing yield generation over keeping assets dormant.
In parallel developments, Vitalik Buterin introduced a significant proposal to enhance Ethereum’s consensus mechanism. The Minimmit proposal aims to replace the existing two-round Casper FFG finality protocol with a more efficient single-round alternative.
This architectural change involves important compromises. While fault tolerance would decrease from 33% to 17%, Buterin contends that censorship resistance would improve, and the threshold required to finalize invalid chain history would increase from 67% to 83% of staked ETH.
This modification represents one component of Ethereum’s comprehensive development strategy to reduce slot times from the current 12 seconds to potentially 2 seconds, while achieving single-digit second finality.
Ethereum is presently trading around $2,000, representing a significant decline from its previous cycle peak near $4,900.


The US government’s crypto and AI czar, David Sacks, is stepping down from his special government employee (SGE) role to join Meta’s Mark Zuckerberg and Nvidia’s Jensen Huang on Donald Trump’s new tech council.
Sacks announced his departure in an Interview with Bloomberg that also covered the President’s Council of Advisors on Science and Technology (PCAST).
Sacks told Bloomberg, “In the first year of the Trump administration, I had that role as an SGE. I had 130 days.”
“We’ve now used up that time,” Sacks said, adding that his role as co-chair of PCAST means he’ll now “make recommendations on not just AI, but an expansive range of technology topics.”
Read more: David Sacks promised ‘market structure bill in 100 days’ a year ago
The council has been created to guide tech policies within government, and counts major tech executives such as Marc Andreessen and Sergey Brin among its ranks.
Tesla CEO Elon Musk was also a SGE under Trump’s administration, and also stepped down from the role after 130 days. He won’t be part of the tech council, however.
Sacks’ time as crypto czar was bittersweet
Under Sacks’ stewardship, the US administration loosened its grip on crypto regulations, the president launched a memecoin, and the government promised to implement a Strategic Bitcoin Reserve (SBR).
During this time, it gained a reputation for intense profiteering and crypto corruption. Indeed, Trump’s son Eric boasted very publicly about his family making profits of $1 billion from its various crypto enterprises.
Sacks promised in February last year that the market structures bill, aka the CLARITY Act, and stablecoin legislation, also known as the GENIUS Act, would have been passed through the Senate and House within 100 days.
While the GENIUS Act was passed, albeit well beyond the self-imposed deadline, the CLARITY Act is still struggling to join it.
Sacks was revealed by the New York Times to have held over 400 investments in various crypto and AI firms while still maintaining his SGE role in Trump’s administration, raising concerns about a potential conflict of interest.
The administration also signed into existence the SBR but it was watered down significantly when officials revealed that the US wouldn’t be buying any BTC to contribute to the it and would instead rely on the coins it had already seized and forfeited.
An audit of crypto assets intended for both the SBR and Digital Asset Stockpile was supposed to be complete by April 5, 2025. However, no such review has been published almost 356 days after the deadline.
Read more: David Sacks sends silly legal threat to the New York Times
Crypto traders happy about David Sacks crypto czar departure
Upon discovering Sacks’ departure yesterday, X users have remarked on the less-than-stellar effect he had on the crypto market.
Venture capitalist Adam Cochran mocked Bitcoiners who voted for Trump, asking “How’d that bitcoin reserve work out for you? Remember those day one promises?”
“Remember how Trump and Sacks promised you the world, and you told us we had TDS when we told you that you were getting played?” he added.
Others pointed to today’s BTC price of $66,600, and how it’s down 34% from the day Sacks was inaugurated as crypto czar.
Read more: US Strategic Bitcoin Reserve audit now 172 days overdue
Traders have also complained that under Sacks’ role, nothing was actually achieved, adding that he’s “the single most useless person of Trump administration [sic] (right there with Trump).”
Eleanor Terrett reports that it’s unclear whether or not Sacks’ crypto czar role will be replaced while major crypto legislation, such as the CLARITY Act, continues to work its way through the Senate.
If the Trump administration does decide to hire a replacement, at least one willing candidate has already thrown their hat into the ring on X. Despite currently serving a 25-year prison sentence, FTX fraudster Sam Bankman-Fried posted simply “dibs.”
Got a tip? Send us an email securely via Protos Leaks. For more informed news and investigations, follow us on X, Bluesky, and Google News, or subscribe to our YouTube channel.

The European Central Bank published a working paper on March 26, finding that governance in four major DeFi protocols was heavily concentrated.
The staff paper looks at Aave, MakerDAO, Ampleforth and Uniswap, and finds that while governance tokens are held across tens of thousands of addresses, the top 100 holders control more than 80% of the supply in each protocol.
Based on holdings snapshots from November 2022 and May 2023, the authors found that a large share of governance tokens could be linked either to the protocols themselves or to centralized and decentralized exchanges, with Binance the largest identified centralized exchange holder across the four protocols.
The authors said the findings challenge the idea that decentralized autonomous organizations (DAOs) are inherently decentralized, raising questions about accountability and complicating efforts to identify possible regulatory anchor points under the European Union’s Markets in Crypto-Assets Regulation (MiCA) framework. MiCA currently excludes “fully decentralised” services from its scope.
Top token holders dominate governance
The authors also look at who actually votes on key proposals, concluding that top voters are mostly delegates who wield delegated voting power from smaller token holders.
The top 20 voters in Ampleforth control 96% of delegated voting power, while the top 10 voters in MakerDAO hold 66% of delegated votes, and the top 18 in Uniswap hold 52%. Around one-third of top voters cannot be publicly identified, and among those that can, the largest groups are individuals and Web3 companies, followed by university blockchain societies and venture firms.
Related: DAOs may need to ditch decentralization to court institutions

Cointelegraph reached out to Aave, Uniswap, MakerDAO, and Ampleforth, but had not received a response by publication.
Kavi Jain, senior research associate at Bitwise, told Cointelegraph that many large DeFi protocols were not as decentralized in practice as they might appear, especially in the earlier stages, where a small group still has “meaningful influence over decisions.”
He pointed to the recent Aave governance debate that highlighted how, even with a DAO structure, voting power can “still be concentrated among a few participants.”
MiCA faces DeFi accountability problem
The paper catalogues what governance actually decides, finding that the largest share of proposals relates to “risk parameters” that shape the protocols’ risk profiles. That raises further questions about accountability, especially given that it is “not possible” to tell from public data whether protocol-linked holdings belong to founders, developers or treasuries, or whether exchange wallets are voting their own positions or those of customers.
Related: How a 2.85% price error triggered $27M in liquidations on Aave
There are some caveats with the methodology, and the paper itself warns that it does not capture the “full scope of the DeFi ecosystem,” due to insufficient data.
The paper also stresses that it reflects the authors’ views rather than official ECB policy, however, it warns that the difficulty of reliably identifying who controls major protocols makes it harder to lean on popular entry points such as governance token holders, developers or centralized exchanges, and says that the relevant anchor may differ protocol by protocol and require information that is not publicly available.
Its findings echo earlier warnings from the Financial Stability Board and others, cited in the paper, that DeFi’s promise of disintermediation often masks new forms of concentration and governance risk that resemble, and sometimes amplify, those seen in traditional finance.
Magazine: Ethereum’s Fusaka fork explained for dummies — What the hell is PeerDAS?
Intercontinental Exchange (ICE), the parent of the New York Stock Exchange (NYSE), said Friday it completed a new $600 million direct cash investment in Polymarket, deepening its bet on prediction markets as a new area of growth for exchange operators.
The company also said it expects to purchase up to $40 million of Polymarket securities from existing holders, adding to its previously announced investment commitment made in October 2025.
In that earlier deal, ICE said it would invest up to $2 billion in Polymarket, marking one of the largest institutional moves into the prediction market sector. The latest transaction advances that arrangement, though terms for the new investment, including valuation, were not disclosed.
The deal signals ICE’s intention to expand its exposure to prediction markets, even as the sector faces evolving US regulatory scrutiny.
Polygon Labs says Polymarket scaling highlights infrastructure role
Aishwary Gupta, global head of business at Polygon Labs, said ICE’s latest investment reflects institutional attention toward onchain market platforms.
Gupta told Cointelegraph that Polymarket’s growth on Polygon shows how blockchain infrastructure is being used to support high-frequency, real-time market activity.
Related: Lawmakers push another bill to curb prediction market insider trading
“Intercontinental Exchange’s investment in Polymarket highlights the growing institutional interest in onchain market platforms,” Gupta said.
He said Polymarket’s growth on Polygon shows how blockchain infrastructure can support high levels of real-time market activity at scale.
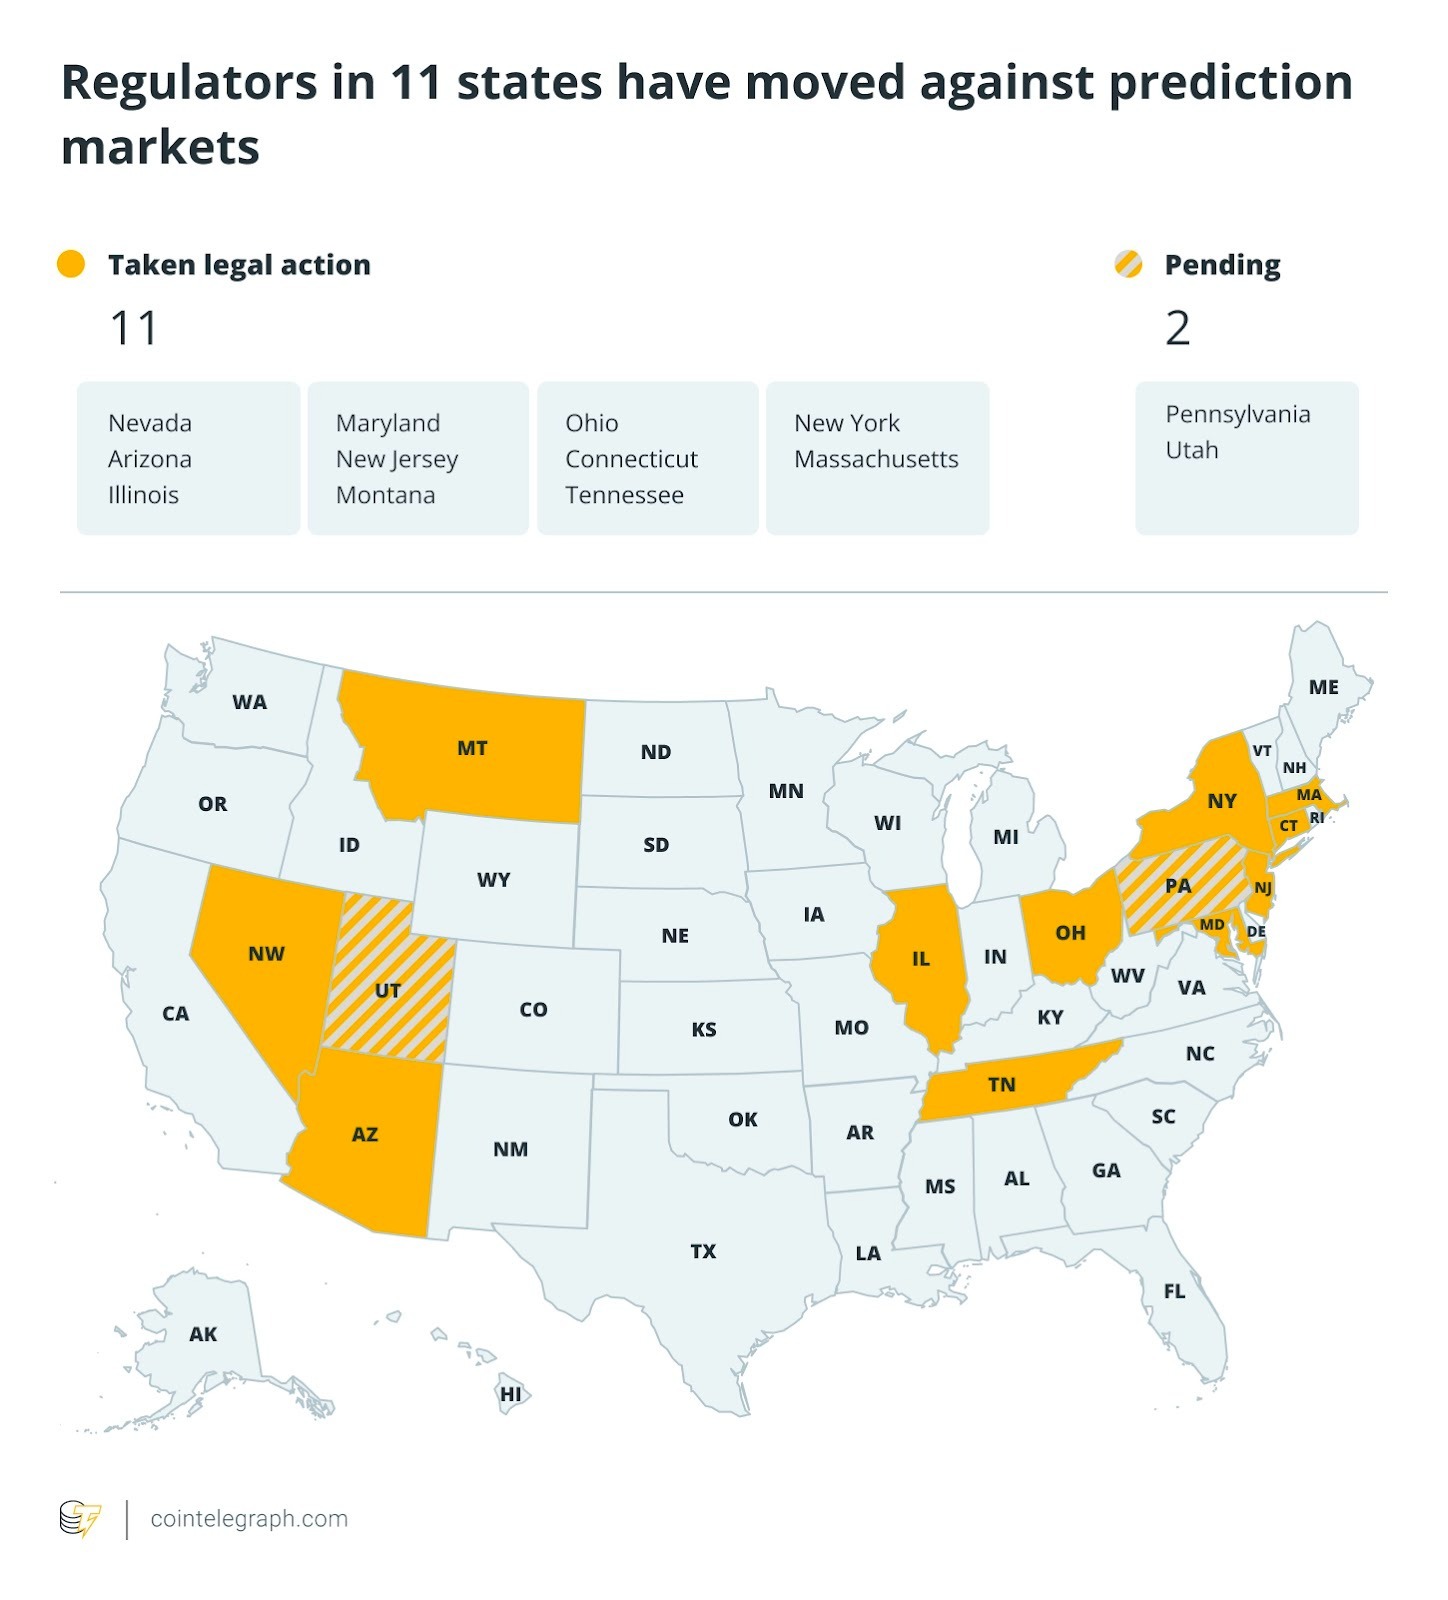
Regulators in 11 states made moves against prediction markets
The news comes as prediction markets face increasing regulatory pressure across the US.
At least 11 states are pursuing legal action against prediction market platforms like Polymarket and Kalshi.

Nevada has issued a temporary ban on Polymarket competitor Kalshi, while Arizona filed criminal charges alleging the platform operated an illegal gambling business. Several other states have sent cease-and-desist orders or are considering new legislation.
Polymarket recently updated its rules to more clearly prohibit trading on confidential information as lawmakers and critics raise concerns that prediction markets can be vulnerable to insider-style activity, especially around politics, sports and geopolitics.
Magazine: Banks want to run Vietnam’s crypto exchanges, Boyaa’s $70M BTC plan: Asia Express
Crypto stocks are getting hit hard Friday as weakness in U.S. equities rippled through high-risk assets, driving bitcoin below $66,000.
Crypto exchange Coinbase (COIN) and digital asset conglomerate Galaxy (GLXY) dropped nearly 7%, while exchange Gemini (GEMI) slid almost 9%, marking one of the steepest losses in the group. Crypto-friendly broker Robinhood (HOOD) also fell nearly 6% as increasing its stock buyback pace offered little help in arresting the downtrend.
Bitcoin-linked balance sheet plays also moved lower. Strategy (MSTR) and Twenty One Capital (XXI) plunged about 6%. Ethereum-focused treasury names such as Bitmine Immersion (BMNR) and Sharplink Gaming (SBET) were down roughly 5%.
Miners — many of which trade as leveraged bets on both bitcoin and AI infrastructure — extended their declines. Riot Platforms (RIOT), CleanSpark (CLSK), IREN (IREN), HIVE Digital (HIVE) and Hut 8 (HUT) all posted 5%-8% losses.
Even MARA (MARA) and Bitdeer (BTDR), which outperformed Thursday, have given back all their gains and were down 6% and 8%, respectively, joining the sector-wide plunge.
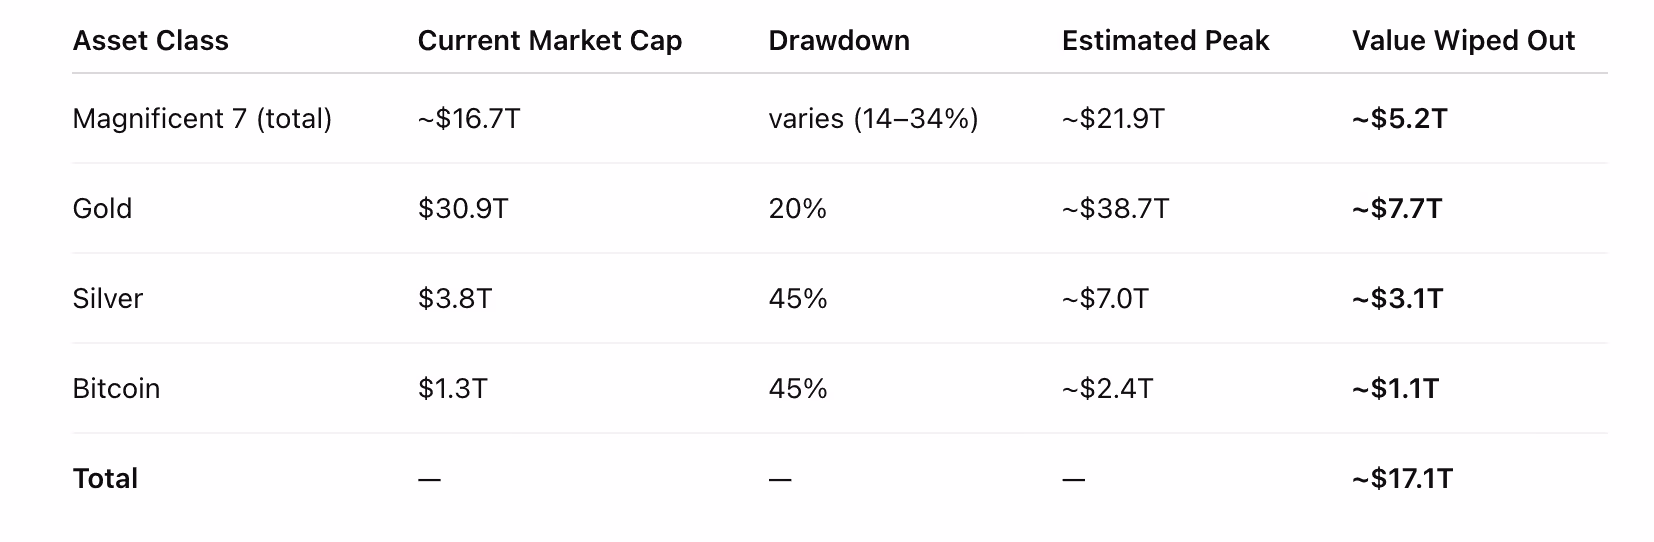
$17 trillion wipe-out
The Federal Reserve faces an increasingly complicated backdrop, weighing renewed inflation pressure from rising oil prices against signs of a deteriorating labor market.
Richmond Fed President Tom Barkin warned that higher gas costs could dent consumer spending while describing hiring conditions as “fragile.” Meanwhile, Philadelphia Fed President Anna Paulson said the war in Iran created “new risks to both inflation and growth.”
The 10-year Treasury bond yield, which hit nearly 4.5% earlier Friday, erased today’s rise following the central bankers’ remarks. The two-year yield, which is more sensitive to Fed policy, fell all the way back to 3.91% after earlier rising to 4.03%.
Still, investors have turned from predominantly expecting rate cuts this year to consider the central bank hiking rates in face of rising inflation.
The selloff over the past months has been broad across equities, with roughly $17 trillion in market cap wiped out from peak levels across the Magnificent Seven — the seven largest tech stocks, including Nvidia (NVDA), Google (GOOG) and Microsoft (MSFT) — gold, silver, and bitcoin .
Bitcoin reached its all-time high in early October at $126,000, while gold, silver and U.S. equities peaked in late January before reversing sharply. Since then, bitcoin is down around 45%, silver has fallen 45%, gold roughly 20%, and the Magnificent Seven have all entered double digit drawdowns from their peaks.

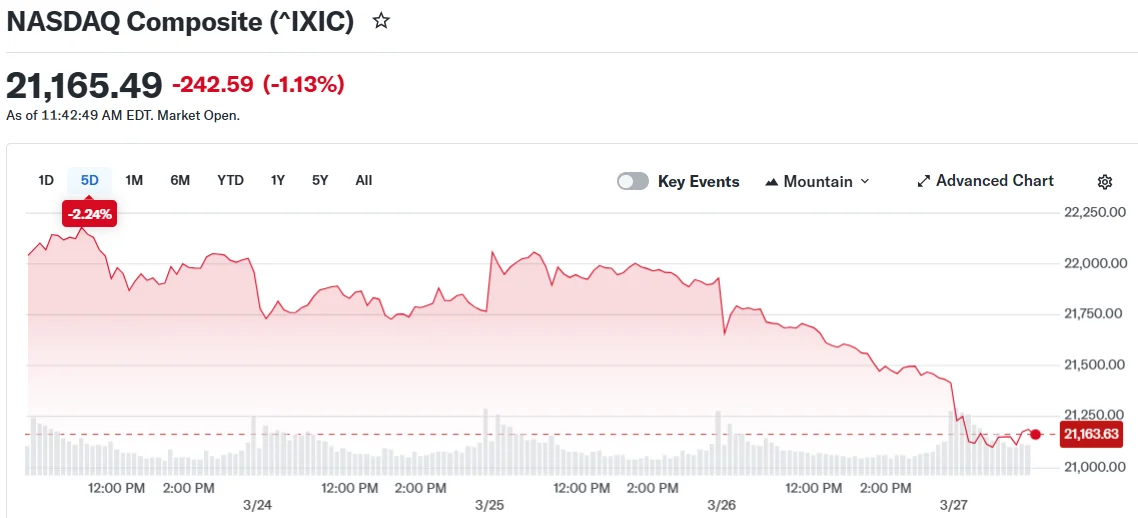
The tech-heavy Nasdaq 100 index has now entered correction territory, trading more than 10% off its January all time high. The broad-based S&P 500 is inching closer to a correction, too, currently down 8.5%.
While bonds have also been hit hard, global fixed-income markets remain under broad pressure, with the iShares 20+ Year Treasury Bond ETF (TLT) down around 0.3% on Friday and 5% over the past month since the conflict began.
Over the same period, the S&P 500 has fallen roughly 6%, highlighting the underperformance of the traditional 60/40 portfolio as global yields continue to rise, weighing on sovereign debt markets.
Monday relief, Friday risk-off
This week has followed a familiar playbook seen since the Middle East conflict started in late February, with strong gains on Monday, partly driven by relief that “Black Monday” scenario did not occur, averaging around 3%, followed by steady profit taking into weakness as the week progresses, particularly as optimism fades around the Strait of Hormuz fully reopening.
By Thursday and Friday, performance typically deteriorates further as investors reduce risk ahead of the weekend amid ongoing geopolitical uncertainty.


Opinion by: Ilya Tarutov, founder of Tramplin
Crypto hasn’t struggled because the technology was flawed. Instead, it faltered as a result of the incentive structures the industry created, which have quietly turned it into something that works against the very people it was supposed to serve.
Since 2017, every crypto market cycle has followed the same pattern. Each cycle started with excitement, followed by retail inflows, a velocity trap and catastrophic drawdowns, and ended in an erosion of trust that takes months, if not years, to rebuild. Each cycle begins with optimism, peaks at overconfidence and concludes with panic and despair.
Most of the time, crypto users are quick to blame market conditions, macro headwinds and regulation. Yes, they’re important factors. What actually determines outcomes, cycle after cycle, is how the incentives are designed.
Crypto loses everyday users because the system quietly pushes them to take the biggest risks. This begins with psychology: Traders often adopt the mindset that “the higher the return desired, the greater the risk required.”
A small token balance earning just a fraction of a percent through staking doesn’t feel like real progress. Yes, the staking market surpassed $245 billion, but platforms generally offer 2%-10% APY, which, for balances of a couple thousand dollars or less, might yield less than $100 in annual profits.
Meanwhile, take derivatives platforms. They provide their users sophisticated and high-leverage trading opportunities and processed a record $85.7 trillion in trading volume in 2025.
“Just stake” isn’t enough anymore
Native staking is straightforward and relatively safe; rewards come directly from the network itself. Staking alone doesn’t fix the deeper problem. The platforms built around it still promote speculation, high leverage, trading driven by FOMO and risky looping strategies.
What retail investors need is a way to participate without constant exposure to risk or serving as exit liquidity for faster, better-informed market players.
Related: Hybrid governance program gives tokenholders a voice on this platform
What’s the solution? Creating a savings product with capital preservation as a core design goal.
The “savings layer” concept
A crypto savings layer needs to be built around a clear set of rules. These principles are non-negotiable, as they have a great, positive influence on user behavior. Examples of this include capital preservation, full transparency and rewards for discipline over speed or speculation. The savings layer should also work just as well for a 10-USDt (USDT) balance as for a 100,000-USDt one.
The “real” world already offers products designed around trust and capital preservation, rather than speculation.
Consider the United Kingdom’s Premium Bonds. They don’t promise high fixed yields. What they do is preserve your capital while giving you a chance at prizes.
According to NS&I, 71,722,056 prizes were paid out in 2025, totaling 4.95 billion pounds ($6.6 billion), with over 470,000 new accounts opened and eligible Premium Bonds holdings growing to 134.6 billion pounds.
Yes, it is not a blockchain product. It’s a well-designed savings program. The lesson is still simple: There’s a reason to participate, you understand how it works and your money stays safe.
In the United States, prize-linked savings has gained traction for similar reasons. This kind of incentive layer makes it easier for people to build consistent saving habits.
The mechanics of a “saving layer concept” in crypto must be simple enough to explain in one or two sentences.
If a person can’t explain in plain terms to their friends where their rewards come from, that means the design isn’t transparent enough. Whether rewards are generated from transparent sources or from a clearly defined chance-based model, the system must be honest about what it can offer people, and what it cannot.
The most crucial aspect is that incentives must work even with small balances. The system must reward consistency over speed, and discipline over speculation, so that staying involved matters more than getting in early.
Just as important is what the system should not do. Destructive risk shouldn’t be the default option, as the goal is to minimize losses, keep users in profit and encourage long-term participation.
That is what a savings layer actually means: a system designed to help everyday users stay in the game, not one that quietly pushes them out.
Rewriting the system
If the next cycle doesn’t introduce ways to protect everyday users, they will keep experiencing crypto as a story that always ends the same way: big hype, big promises and painful collapses.
What needs to change is not the technology but what the technology is optimized for. Products must be built to reduce losses, not to maximize turnover. These changes must take place now, unless industry players want to repeat the same mistakes over and over again.
Crypto’s future comes down to a single choice: protect everyday users or keep optimizing for short-term gains. Only one of those leads somewhere worth going.
Opinion by: Ilya Tarutov, founder of Tramplin.
This opinion article presents the author’s expert view, and it may not reflect the views of Cointelegraph.com. This content has undergone editorial review to ensure clarity and relevance. Cointelegraph remains committed to transparent reporting and upholding the highest standards of journalism. Readers are encouraged to conduct their own research before taking any actions related to the company.
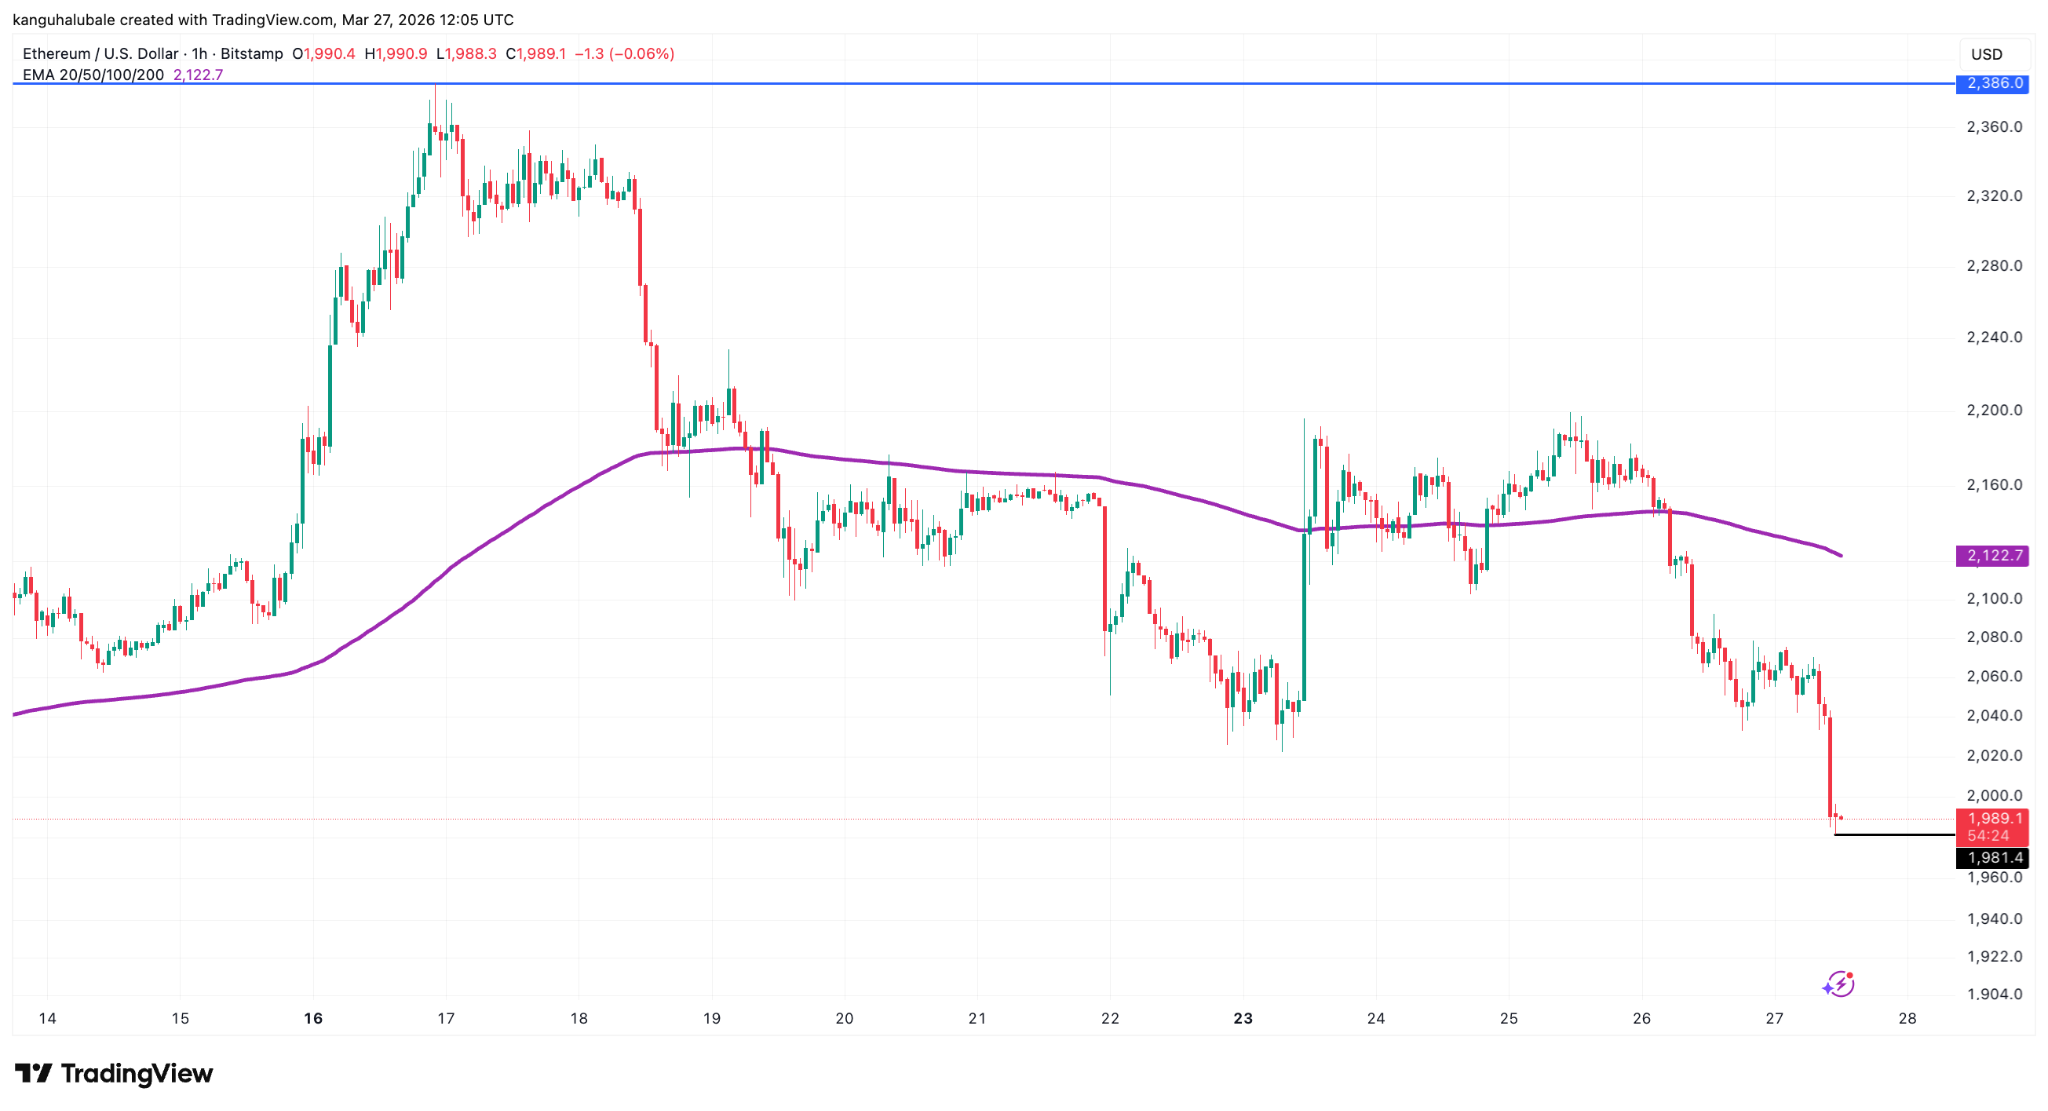
Ether’s (ETH) drop below the $2,000 on Friday put it at risk of a deeper correction in the coming weeks or months.
Key takeaways:
-
Ether’s price shows structural weakness as it fails to hold above the $2,000 psychological support.
-
Analysts say ETH price may drop further toward the $1,750-$1,850 support zone.
-
Ether’s demand stays negative, increasing its downward potential.
Ether traders anticipate a deeper correction
Data from TradingView showed ETH/USD trading at $1,975, down 5% over the last 24 hours. This drop was accompanied by more than $111 million in long ETH liquidations.
Related: Bitmine launches institutional Ethereum staking platform
The pair had failed to crack through resistance at $2,200 earlier in the week, as spot Ether exchange-traded fund (ETF) outflows, falling DEX volumes, and declining ETH futures premium derailed Ether’s recovery.

“$ETH keeps pressing into the same resistance, but the story sits beneath price action,” trader Onur said in an X post on Friday, adding:
“Even with strong long-term narratives, short-term demand still looks thin.”
Fellow analyst CryptoWZRD said a ETH could see a “further decline” toward the $1,800 support zone after the altcoin closed below $2,200 on Thursday.
“$ETH has dropped below the $2,100 level,” analyst and trader Ted Pillows said in a Friday X post, adding:
“This is a sign of weakness and shows what’s coming next for ETH.”
An accompanying chart suggested that the price could first drop toward the $1,800 support level, before rebounding.

As Cointelegraph reported, a close below the 50-day simple moving average at $2,000 may pull the ETH/USD pair to $1,900 and subsequently to the $1,850-$1,750 level.
Ether’s apparent demand hits 16-month low
Ether’s Apparent Demand has flipped negative after dropping to its lowest level since October 2024, as traders adopted a risk-off stance due to geopolitical uncertainty and macro headwinds.
Capriole Investment’s Ethereum Apparent Demand metric shows that the demand for ETH has been negative since March 3, bottoming around -58,000 ETH on March 16, marking 16-month lows. The metric has since improved to -23,475 ETH at the time of writing.

Meanwhile, spot ETH ETFs have recorded net outflows for seven consecutive days, totaling $391.8 million.

Global Ether exchange-traded products (ETPs) also recorded $27.2 million of outflows last week, reinforcing reduced appetite for ETH among institutional investors.
This article does not contain investment advice or recommendations. Every investment and trading move involves risk, and readers should conduct their own research when making a decision. While we strive to provide accurate and timely information, Cointelegraph does not guarantee the accuracy, completeness, or reliability of any information in this article. This article may contain forward-looking statements that are subject to risks and uncertainties. Cointelegraph will not be liable for any loss or damage arising from your reliance on this information.

Key Takeaways
- The Nasdaq Composite tumbled 2.4% Thursday, confirming a correction after sliding more than 10% from its October 29 record peak
- Geopolitical instability from the U.S.-Israeli military action against Iran and concerns about escalating oil costs fuel the downturn
- American gas prices surged to $3.98 per gallon, marking a $1.00 increase within 30 days
- Meta Platforms plummeted 8% following dual court rulings holding the company accountable for damage to teenage users
- Major tech players Nvidia, Alphabet, and Tesla each declined between 3.4% and 4.2% during Thursday’s session
The Nasdaq Composite has officially entered correction territory following Thursday’s trading session. The tech-focused index shed 2.4%, placing it approximately 11% beneath the all-time closing high recorded on October 29, 2025. This represents the index’s first confirmed correction in twelve months.
Thursday’s decline represents the index’s steepest fall since April 2025, when President Trump’s “Liberation Day” tariff declaration triggered a worldwide market retreat.
The Nasdaq has now surrendered nearly 8% of its value in 2026 and trades at levels last witnessed in early September 2025.
The primary catalyst behind the market retreat centers on persistent uncertainty surrounding the U.S. and Israeli military engagement with Iran. Market participants remain unclear about the conflict’s duration and its potential ramifications for worldwide economic stability.
A recent Seeking Alpha community survey revealed that most respondents anticipate the operation lasting up to three months. White House officials have projected a four-to-six week timeframe. This disconnect between projections continues to fuel market anxiety.
Energy costs are climbing rapidly. American motorists now face an average gasoline price of $3.98 per gallon, representing a $1.00 jump from just thirty days earlier. Seasonal consumption patterns are anticipated to drive prices even higher as spring approaches.
Market analysts suggest the energy price spike could either accelerate inflation or dampen consumer spending sufficiently to decelerate economic growth. The ultimate outcome hinges largely on the conflict’s duration.
Technology Sector Bears the Brunt
Technology equities have experienced substantial pressure. Nvidia declined 4.2%, Alphabet fell 3.4%, and Tesla surrendered 3.6%. The Roundhill Magnificent Seven ETF dropped 3.3% and has now retreated 17% from the Nasdaq’s October zenith.
Market participants are increasingly scrutinizing whether the enormous artificial intelligence expenditures by corporations like Microsoft, Alphabet, and Amazon are generating returns quickly enough. The primary concern centers on whether substantial infrastructure investments have yet produced significant revenue expansion.
“There definitely has been an erosion in market enthusiasm since hostilities broke out,” said Steve Sosnick, market strategist at Interactive Brokers.
Meta Compounds Market Weakness
Meta Platforms emerged as one of Thursday’s heaviest drags on the index, plunging 8%. Two separate court decisions determined Meta bears responsibility for harm inflicted on young users, sparking concerns the social media giant may need to fundamentally restructure its advertising framework.
The widespread losses throughout Big Tech are magnified because these corporations now constitute a substantial portion of both the Nasdaq and the S&P 500. Any retreat in these stocks delivers an outsized impact on the broader indices.
Jim Carroll, senior wealth adviser at Ballast Rock Private Wealth, characterized the market’s volatile swings as sufficient to “make people seasick.”
The Nasdaq previously tumbled nearly 23% from its 2024 peak before rallying through October 2025. Investors are now monitoring whether this current correction will trace a comparable recovery trajectory, or deteriorate further.


- Stargate Finance (STG) surged 40% on strong volume and breakout momentum.
- Holding $0.24–$0.25 will keep the bullish momentum intact.
- However, overbought conditions suggest possible short-term consolidation.
The price of STG has surged by more than 40% in just 24 hours to hit an intraday high of $0.2796.
This kind of sharp move rarely happens without a strong underlying force, and in this case, the signals point to a mix of heavy buying pressure and renewed interest in its ecosystem.
The rally stands out even more because it is happening while the broader crypto market is falling.
A breakout backed by market demand
The most important factor behind today’s Stargate Finance price surge is the explosion in trading activity.
According to CoinMarketCap, volume has jumped by over 869%, rising several times above its recent average, which shows that this is not a random spike.
Large inflows of capital tend to leave a clear footprint, and this move carries all the signs of serious buyers stepping in.
Price action has also confirmed this strength by slicing through previous resistance levels with little hesitation.
That kind of clean breakout usually signals conviction rather than speculation.
It also suggests that traders who were waiting on the sidelines have now started chasing momentum.
Fundamental analysis
Beyond the charts, sentiment around the project has turned noticeably positive.
Much of that optimism is tied to its connection with LayerZero, which continues to gain traction in the cross-chain space.
Prime Vaults now facilitates cross-asset and cross-chain liquidity, powered by @StargateFinance, built on @LayerZero_Core
Deposit directly from your preferred native chain and let us handle the cross-chain work while capturing the native token upside.
No additional fees. pic.twitter.com/RDzuSzCetq
— Prime Vaults (@PrimeVaultsHQ) March 25, 2026
Stargate’s position as a liquidity bridge gives it a strong use case, especially as more protocols look to move assets across different networks.
Recent integrations, including activity linked to Riverdot, have added to the sense that the ecosystem is expanding.
When fundamentals and narrative align like this, price often reacts quickly.
This is especially true in a cautious market where capital tends to rotate into projects with clear utility and active development.
Key levels that traders should watch
After such a strong move, attention now shifts to whether STG can hold its gains.
The $0.24 to $0.25 zone has become a critical support area following the breakout, especially with the RSI showing that the altcoin has entered the overbought region.
Often, short periods of consolidation are common after aggressive moves like this.
But if the price manages to stay above this range, it would signal that buyers are still in control.
On the upside, the next major level sits near $0.30, which could act as the next target if momentum continues.
However, if the price slips below support, analysts note that a pullback toward the $0.22 region would become more likely.

Anchorage Digital has added TRX custody and Tron crypto network staking to its platform, making it the first federally chartered crypto bank in the United States to bring the Tron network inside the regulatory perimeter.
Tron hosts $84 billion in USDT, more than Ethereum, yet has operated almost entirely outside U.S. institutional frameworks until now.
That gap closes here. A federally chartered custodian supporting Tron is not the same as a state-licensed exchange listing TRX. It is a different category of legitimacy, with different compliance obligations, different counterparty implications, and a different signal to the rest of the institutional market.
- Milestone: Anchorage Digital is the first federally chartered U.S. crypto bank to support Tron custody, bringing TRX and future TRC-20 assets—including $84 billion in USDT—into a compliant institutional framework.
- Regulatory Context: Tron and founder Justin Sun faced longstanding U.S. regulatory friction, including a 2023 Coinbase delisting of TRX; the SEC dismissed securities claims against Sun and the Tron Foundation earlier this month, clearing a key obstacle.
- Phased Rollout: Initial support covers TRX custody on Anchorage’s main platform and Porto institutional wallet; TRC-20 token support and native TRX staking infrastructure follow in subsequent phases.
Discover: The best crypto presales gaining institutional momentum right now
What Anchorage Bank Is Actually Building
The initial launch supports TRX custody on Anchorage’s core regulated platform and its Porto self-custody institutional wallet. TRC-20 token support and native TRX staking roll out in phases, a staged structure that allows regulatory validation at each step rather than a single broad deployment.
Anchorage Digital is your new access point to the @trondao ecosystem.$TRX custody is now live with support for TRC-20 assets and native TRX staking on the way. pic.twitter.com/f4xlKwmcir
— Anchorage Digital
 (@Anchorage) March 26, 2026
TRC-20 support is the operationally significant layer. It means institutions will be able to hold and manage Tron-based stablecoins—including the $84 billion USDT supply sitting on Tron—directly within a federally regulated custody account. That is the use case that matters to institutional treasury desks.
Anchorage co-founder Nathan McCauley framed the move as infrastructure-driven: “As TRON expands its presence in the U.S., institutions need trusted infrastructure to securely custody assets and participate in the network. By supporting TRON on Anchorage Digital’s regulated platform, we’re helping bring one of crypto’s largest ecosystems into an institutional framework.”
The federal charter distinction matters here. Anchorage holds a national trust bank charter from the Office of the Comptroller of the Currency—the same regulatory body that oversees JPMorgan and Citibank. State-chartered custodians operate under a patchwork of state regimes. A federally chartered institution conducting AML/BSA due diligence on Tron and clearing it for custody sets a compliance benchmark that state-level operators and foreign custodians cannot replicate by definition.
Tron’s network scale justifies the scrutiny. The chain has recorded over 371 million total user accounts and more than 13 billion total transactions. It is not a niche protocol. It is core stablecoin infrastructure that U.S. institutions have been structurally locked out of engaging with compliantly—until now.
Discover: The best crypto to diversify your portfolio with
Tron Crypto Regulatory Clearance as a Market Structure Event
The background context is critical. Coinbase delisted TRX in 2023 under regulatory pressure. The SEC pursued securities violations against Sun and the Tron Foundation, claims dismissed only earlier this month, with Rainberry, the corporate parent of Sun’s BitTorrent network, paying a $10 million fine over undisclosed BTT token promotions.
That legal overhang suppressed U.S. institutional engagement with Tron for years. Its removal, combined with Anchorage’s federal-level due diligence clearance, reopens the market.
Anchorage’s federal imprimatur gives other U.S.-regulated entities—prime brokers, custodians, asset managers, a compliance reference point.
When America’s only federally chartered crypto bank conducts AML/BSA diligence on a network and approves it for custody, that functions as a de facto institutional clearinghouse signal.
Expect other regulated venues to accelerate their own Tron evaluations.
Discover: The best crypto presales gaining institutional momentum right now
The post Anchorage Becomes First Federally Chartered US Bank to Custody Tron Crypto appeared first on Cryptonews.


US spot Bitcoin exchange-traded funds posted their largest daily outflows in weeks on Thursday, as Bitcoin fell below $70,000 and market risk stayed elevated.
Summary
- US spot Bitcoin ETFs recorded $171 million in outflows, the largest daily withdrawal since March 3.
- BlackRock, Fidelity, ARK, and Grayscale led withdrawals as Bitcoin dropped below the key $70,000 level.
- Despite Thursday outflows, US spot Bitcoin ETFs still attracted $1.36 billion in March net inflows.
The sell-off came after a strong month for US-listed Bitcoin ETFs, which had already attracted fresh capital in March.
US spot Bitcoin ETFs recorded $171 million in net outflows on Thursday. That marked the largest daily withdrawal since March 3, when the group lost $348 million.
BlackRock’s IBIT led the redemptions with $41 million in outflows. Fidelity’s FBTC followed with $32 million, while ARK 21Shares’ ARKB lost $30.5 million. Grayscale’s GBTC also posted $24 million in withdrawals, based on data from Farside Investors.
The weak session interrupted a broader recovery in ETF demand this month. Sosovalue data showed that spot Bitcoin ETFs had already brought in $1.36 billion in March and were moving toward their first month of net inflows since October 2025.
That trend showed that institutional interest had not disappeared, even as Thursday’s trading pointed to caution. ETF flows often act as a clear sign of how large investors are positioning around Bitcoin.
Bitcoin fell below the $70,000 level on Thursday and traded near $67,780 at the time of writing. CoinGecko data showed the asset had dropped almost 5% over the past seven days.
The move added pressure to ETF sentiment, as falling prices often lead to short-term withdrawals from listed crypto products. Even so, Bloomberg ETF analyst Eric Balchunas said the market was “one good day away” from reversing year-to-date ETF outflows.
Balchunas also said the funds had shown “incredible fortitude” during Bitcoin’s 46% decline from its October 2025 all-time high of $126,198. His comments pointed to continued resilience among ETF holders despite the recent price weakness.
Middle East tension keeps investors cautious
Market attention also stayed fixed on geopolitical risk. Reuters reported earlier this week that the US Department of War was sending thousands of soldiers to the Middle East.
On Thursday, President Donald Trump said the ceasefire on Iranian energy infrastructure would be extended by 10 days to April 6. He said the move followed ongoing negotiations, but traders still feared a sudden shift over the weekend.

The Greatest Sci-Fi Franchise of All Time Just Found a New Streaming Home

Palestinian baby tortured by Israel is ignored by West
Lady Gaga’s Mayhem Ball reveals the gothic tradition behind modern celebrity


-
 Crypto World7 days ago
NIO (NIO) Stock Plunges 6.5% as Shelf Registration Sparks Dilution Worries
-
 NewsBeat2 days ago
Manchester United reach agreement with Casemiro over contract clause amid transfer speculation
-

 Fashion7 days ago
Weekend Open Thread: Adidas – Corporette.com
-

 Politics7 days ago
Jenni Murray, Long-Serving Woman’s Hour Presenter, Dies Aged 75
-

 Crypto World6 days ago
Best Crypto to Buy Now: Strategy Just Spent $1.57 Billion on Bitcoin During Fear While Early Investors Quietly Enter Pepeto for 150x Potential
-

 Crypto World6 days ago
Bitcoin Price News: Bhutan Sells $72 Million in BTC Under Fiscal Pressure, but the Smart Money Entering Pepeto Sees What the Market Does Not
-

 News Videos2 days ago
Parliament publishes latest register of MPs’ financial interests
-

 Sports4 days ago
Remo Stars and Kano Pillars Strengthen Survival Hopes in NPFL
-

 Sports4 days ago
Gary Kirsten Accuses Pakistan Cricket Board Of ‘Interference’, Mohsin Naqvi Responds
-

 Business5 days ago
No Winner in March 21 Drawing as Prize Rolls to $133 Million for Next
-

 Tech5 days ago
Give Your Phone a Huge (and Free) Upgrade by Switching to Another Keyboard
-

 Sports7 days ago
2026 Kentucky Derby horses, odds, futures, preview, date: Expert who nailed 12 Derby-Oaks Doubles enters picks
-

 Tech5 days ago
AI enters the chat: New Seattle dating app relies on tech to facilitate meaningful human connections
-

 News Videos4 days ago
Ch 9 Financial Management Part 1 | Detailed One Shot | Class 12 Business Studies Boards 2026
-
Business7 days ago
Columbia Sportswear enters $500 million credit agreement with JPMorgan Chase
-

 Tech6 days ago
Today’s NYT Connections Hints, Answers for March 22 #1015
-

 Business20 hours ago
Instagram, YouTube Found Responsible for Teen’s Mental Health Struggle in Historic Ruling
-
 Crypto World7 days ago
Small-cap Russell 2000 enters correction territory
-

 Business5 days ago
Will Duke Basketball Win It All? Duke Basketball Enters Second Round as Third Favorite to Claim NCAA Title
-

 Sports4 days ago
2026 Kentucky Derby horses, odds, futures, preview, date: Expert who hit 12 Derby-Oaks Doubles enters picks
You must be logged in to post a comment Login