
Crypto World
Ethereum Faces 200-Day EMA Rejection Amid $7B Liquidation Cascade

TLDR:
- ETH failed three times at the 200-day EMA, confirming weakening momentum and sustained selling pressure.
- Over $1.3B in long liquidations shows derivatives activity dominated price action, not spot demand.
- The $2.7K level flipped from support to resistance, redefining near-term market structure.
- Focus now shifts to $2.3K and $1.8K as the next zones of potential buyer interest.
ETH 200-day EMA rejection shows repeated failures near resistance aligned with a wave of forced liquidations. Price action now reflects leverage-driven volatility instead of organic trend recovery.
Distribution Behavior Emerges at Key Technical Resistance
ETH price moved higher, yet the advance lacked sustained demand. Instead, it appeared driven by short covering into a known supply zone.
Momentum weakened with every approach to the moving average. Candle bodies narrowed, and upper wicks became more frequent. At the same time, volume failed to expand.
Furthermore, the repeated rejection pattern reinforced technical exhaustion. Three attempts at the same resistance level produced lower follow-through each time. This suggested that sellers maintained control despite temporary upside pressure.
On social media, several analysts shared charts showing price stalling exactly at the 200-day EMA. Therefore, upside strength functioned mainly as liquidity for larger participants.
Soon after, ETH slipped back below $2.7K. That level had served as short-term support during the rebound phase. Once breached, it transitioned into resistance, and market bias tilted downward.
This pivot divided two narratives. Above $2.7K, traders could argue for base formation. Below it, the structure favored continued probing lower. As a result, each rally into that zone now attracts selling interest.
Moreover, price behavior showed hesitation rather than conviction. Buyers failed to defend higher levels with sustained closes. Sellers, in contrast, reacted quickly at technical boundaries.
Thus, the pattern reflected strategic positioning rather than emotional panic. Distribution unfolded gradually, supported by visible rejection zones and fading momentum. The chart no longer communicated recovery. Instead, it communicated controlled exits into strength.
Liquidation Cascades Replace Organic Market Flow
ETH 200-day EMA rejection coincided with violent intraday swings driven by derivatives activity. Price repeatedly moved from $80 to $100 within minutes. Such behavior is not typical of spot-led markets.
Approximately $1.3 billion in long liquidations occurred during the session. These events represented forced closures of leveraged positions, not discretionary selling. Therefore, the tape reflected margin mechanics rather than investor sentiment.
As the price crossed clustered liquidation levels, automated orders accelerated the decline. Each wave triggered the next. Consequently, volatility expanded in both directions.
Total liquidations surpassed $7 billion across the broader market. This scale revealed how one-sided positioning had become before the breakdown. When exposure concentrates, even small price shifts can ignite chain reactions.
Meanwhile, ETH failed to stabilize above reclaimed levels. The $2.7K zone remained overhead resistance. This reinforced the idea that rebounds were corrective, not impulsive.
Attention has now shifted to the $2.3K region. That area previously hosted strong demand. If the price reaches it, buyers may attempt to stabilize conditions. However, failure there would expose the $1.8K support band.
Traders continue to frame current rallies as liquidity events. Strength is treated cautiously, while resistance zones receive priority.


Crypto World
Crypto like COIN, HOOD have bottomed heading into earnings and trades at a ‘big’ discount, Bernstein says


Crypto-linked equities are nearing a bottom heading into first-quarter earnings, according to Wall Street broker Bernstein, which said the sector’s roughly 60% drawdown from 2025 highs has created “big businesses at big discounts.”
“The combination of geopolitics and temporary crypto weak sentiment is offering big discounts on crypto stocks,” analysts led by Gautam Chhugani said in the Monday report.
The broker expects near-term weakness to persist through Q1 results but views current levels as an entry point into companies with exposure to large and growing markets, including stablecoins, tokenization, prediction markets and derivatives.
Since peaking in October 2025, crypto markets have undergone a sharp and sustained correction, with bitcoin falling roughly 40%–50% from record highs near $126,000 and the broader digital asset market value declining by about $2 trillion.
The selloff, driven by a mix of macro pressures, regulatory uncertainty and unwinding leverage, has erased much of the prior bull run’s gains and weighed heavily on crypto-linked equities, pushing sentiment into a more cautious phase heading into 2026.
Against that backdrop, the analysts revised their price targets while maintaining an upbeat longer-term outlook. The broker maintained outperform ratings on Coinbase (COIN), Robinhood (HOOD) and Figure (FIGR).
It lowered its Coinbase price target to $330 from $440, Robinhood’s target to $130 from $160, and Figure’s target to $67 from $72. Coinbase was trading around $165.50 at publication time, Robinhood at $67.10, and Figure at $31.14.
The analysts said a combination of macro uncertainty and weak crypto sentiment has weighed on valuations, but expects a turn as earnings clarify fundamentals and sentiment stabilizes into the rest of the year.
The call comes as the broker said last week that bitcoin has likely found its bottom and is primed for further gains, and reiterated its $150,000 year-end price target.
Read more: Wall Street broker Bernstein calls bitcoin bottom, keeps $150,000 year-end target


Roughly $46.9M in ZORA, KMNO, OP and SUI unlocks are hitting thin markets this week, with SUI’s $37.2M tranche posing the biggest short‑term risk.
Summary
- Around $46.9M worth of Zora, Kamino, Optimism and Sui tokens are unlocking into already fragile market conditions.
- Sui’s $37.2M unlock is the largest, while Zora, Kamino and Optimism releases range from 1.55% to 3.70% of supply.
- The batch underscores how token unlock schedules can drive short‑term volatility across DeFi and L1 ecosystems.
A fresh wave of token unlocks hitting Zora, Kamino, Optimism and Sui this week is adding tens of millions of dollars in potential sell pressure to a market that has already seen liquidity thin out across majors and mid‑caps. According to figures compiled by PANews and MEXC, roughly 167 million ZORA tokens, or 3.70% of circulating supply, are set to unlock, with the tranche valued at about $2.5 million at current prices.
Kamino’s KMNO will see about 229 million tokens, representing 3.37% of supply, come onto the market in a roughly $4 million event, while Optimism’s OP will release around 31.34 million tokens on March 31, equal to 1.55% of supply and valued at about $3.2 million. Sui’s SUI, an L1 smart‑contract platform token, faces the largest single unlock: 42.94 million tokens worth an estimated $37.2 million on April 1.
These four assets span a mix of infrastructure and DeFi exposure. SUI is a base‑layer (L1) network token competing with chains such as ethereum and solana for developer and user activity. OP powers the Optimism Layer‑2 scaling stack for ethereum, putting it in direct comparison with arbitrum and other rollup tokens. ZORA is tied to a protocol focused on creator and NFT‑adjacent tooling, while KMNO is a DeFi‑centric governance asset linked to Kamino’s liquidity and lending products. In each case, the unlocks represent between 1.55% and 3.70% of total token supply, a range that historically can be meaningful for order books if spot volume is muted, even when headline dollar figures—$2.5 million for ZORA or $4 million for KMNO—appear modest.
Unlock events typically release previously locked tokens held by teams, early backers or ecosystem treasuries, shifting the supply‑demand balance in ways that can amplify volatility over short windows. When liquidity is thin or sentiment is fragile, even single‑digit percentage unlocks of supply can translate into steeper intraday swings if large holders decide to sell into bids rather than rotate into staking, liquidity provision or long‑term custody. Conversely, when demand is healthy, unlocks can be absorbed with limited price impact as new participants take the other side of distribution.
In the broader market, similar dynamics have played out repeatedly across DeFi and L1 tokens. Past unlocks for projects in the optimism and arbitrum ecosystem, as well as earlier Sui releases, have often lined up with spikes in derivatives funding, whale transfers to exchanges and short‑term price drawdowns before stabilizing as supply is re‑absorbed. Against that backdrop, this week’s roughly $46.9 million in combined unlock value for ZORA, KMNO, OP and SUI acts as a stress test for current liquidity conditions and risk appetite across NFT infrastructure, DeFi governance and L1 smart‑contract platforms.
Within this landscape, traders will be watching on‑chain flows and exchange inflows closely—particularly around SUI’s $37.2 million event—looking for signs of whether large holders treat the unlock as a cash‑out opportunity or a chance to reposition within their respective ecosystems.

Google Antigravity is a new development environment designed specifically for the era of software built alongside autonomous AI agents. Unlike traditional IDEs, which integrate artificial intelligence as an auxiliary assistant, Antigravity introduces a fundamentally different paradigm: agent‑first development.
In this model, developers no longer interact solely with files and syntax. Instead, they collaborate with intelligent agents capable of planning, generating, refactoring, testing and maintaining entire software systems.
For frontend engineers, backend developers, full‑stack specialists, software architects and technical teams working with AI‑assisted workflows, understanding Google Antigravity is not optional. It represents an early signal of how modern engineering productivity is about to change.
This article explains what Google Antigravity is, how it works conceptually, how it differs from current AI‑enhanced IDEs, and why it could reshape software development over the coming years.
What is Google Antigravity
Google Antigravity is an agent‑native integrated development environment built for collaboration with autonomous coding agents rather than traditional editor‑centric workflows.
Where environments such as VS Code or JetBrains products embed AI as contextual support layers, Antigravity positions agents as active participants across the entire development lifecycle.
This includes:
- technical task planning
- structured code generation
- automated refactoring
- assisted debugging
- orchestration of complex workflows
- continuous project maintenance
The result is a shift in abstraction level. Developers move from writing every component manually to supervising systems that co‑develop software alongside them.
What agent‑first development actually means
Agent‑first development describes a model in which AI agents operate as collaborators rather than passive assistants.
In a traditional IDE workflow:
the developer writes → the AI suggests
In an agent‑first workflow:
the developer defines intent → the agent executes strategy
This transition allows engineers to operate at a higher architectural level.
Instead of issuing narrow implementation commands such as:
“create a REST endpoint with validation”
Developers can express broader objectives like:
“implement a complete authentication system compatible with the existing architecture”
The agent interprets repository structure, dependencies, conventions and constraints before generating coherent solutions.
This fundamentally changes how programmers interact with codebases.
Conceptual architecture behind Google Antigravity
Although Google has not yet published full technical documentation for Antigravity, its behaviour aligns with emerging agent‑native development environment architectures.
These systems typically operate across several coordinated layers.
Intent interpretation layer
At this stage, the agent analyses:
- natural‑language instructions
- repository structure
- active dependencies
- project history
- architectural conventions
This enables context‑aware execution rather than isolated code generation.
Planning layer
Before producing code, the agent structures an execution strategy.
Typical responsibilities include:
- decomposing complex tasks
- identifying dependency conflicts
- proposing structural improvements
- estimating architectural impact
This reduces the risk of incremental inconsistencies common in manual workflows.
Execution layer
The agent then generates concrete artefacts such as:
- new source files
- refactored modules
- automated test suites
- migrations
- technical documentation
All changes remain synchronised with the active repository context.
Validation layer
Finally, the system evaluates:
- code coherence
- module compatibility
- architectural alignment
- runtime stability assumptions
This moves development closer to a semi‑autonomous engineering model.
How Antigravity differs from traditional IDEs
Google Antigravity is not simply another editor enhanced with AI capabilities.
It represents a structural change in how developers interact with software systems.
Key differences include the following.
From autocomplete to autonomous execution
Conventional IDEs suggest lines of code.
Antigravity executes complete implementation strategies.
From files to intent
Traditional editors operate at file level.
Antigravity operates at goal level.
From reactive assistance to active collaboration
Most AI tools respond only when prompted.
Agent‑native environments participate continuously in solution design.
From incremental productivity gains to exponential workflow acceleration
Automating entire development segments transforms how quickly complex systems can evolve.
This becomes especially relevant in large‑scale or fast‑moving projects.
Practical use cases for developers
Google Antigravity is designed to integrate naturally into modern engineering workflows where iteration speed is critical.
Several scenarios illustrate its immediate value.
Rapid prototyping
Developers can generate functional architectures in minutes rather than hours.
This accelerates:
- idea validation
- technical experimentation
- early product iteration
Legacy codebase refactoring
Agents can analyse internal dependencies and propose structural improvements across large repositories.
This is particularly useful in long‑lived enterprise projects.
Automated test generation
Testing remains one of the most persistent bottlenecks in professional development.
Agent‑native environments help maintain:
- continuous coverage
- regression protection
- incremental validation cycles
Living technical documentation
Agents can maintain documentation aligned with evolving codebases.
This significantly improves onboarding efficiency across engineering teams.
Comparison with other AI‑powered IDE environments
Google Antigravity enters an ecosystem that already includes tools such as Cursor, Copilot Workspace and emerging agent‑centric development platforms.
However, its positioning introduces important distinctions.
Compared with VS Code plus Copilot
Copilot enhances editing.
Antigravity transforms execution workflows.
Compared with Cursor
Cursor improves contextual editing interactions.
Antigravity restructures the development model itself.
Compared with experimental autonomous coding systems
Many current agent tools operate as external orchestration layers.
Antigravity integrates agents directly into the core environment.
This allows deeper architectural alignment and stronger repository awareness.
How Antigravity may reshape developer workflows
The most important impact of Antigravity is methodological rather than purely technical.
Developers shift from implementation‑centric roles towards supervision‑centric engineering.
In practice, engineers increasingly act as:
- system designers
- agent supervisors
- architectural strategists
This evolution enables smaller teams to deliver larger systems with fewer coordination bottlenecks.
It also encourages higher‑level thinking about structure, scalability and maintainability.
Strategic advantages for development teams
Adopting agent‑first environments can produce measurable improvements across engineering organisations.
Key advantages include:
Reduced development time
Automating repetitive implementation tasks frees cognitive capacity for higher‑value problem solving.
Improved architectural consistency
Agents help maintain structural patterns across repositories.
Easier technical scalability
Complex structural changes can be planned and executed more reliably.
Faster experimentation cycles
Teams can validate architectural decisions without significant upfront implementation investment.
These benefits are especially valuable in startup environments and innovation‑driven product teams.
Current limitations of agent‑native development environments
As with any emerging technology category, Antigravity introduces new challenges alongside its advantages.
Important considerations include:
Dependence on repository structure quality
Agents perform best when working within clearly organised projects.
Continued need for human oversight
Autonomy does not replace engineering judgement.
Expert review remains essential.
Organisational adaptation requirements
Transitioning to agent‑first workflows requires a shift in team mental models.
This adjustment can take time in traditionally structured engineering organisations.
Why Google Antigravity matters for the future of software development
Google rarely introduces developer tooling without a broader strategic trajectory.
Antigravity signals a shift from intelligent text editors towards collaborative engineering environments built around autonomous agents.
This transition implies:
- shorter development cycles
- reduced technical friction
- increased experimentation capacity
- new professional engineering skill profiles
Developers who understand this shift early gain a meaningful competitive advantage.
This is particularly true in environments where continuous innovation defines technical success.
Conclusion
Google Antigravity represents one of the first serious attempts to design an IDE from the ground up for agent‑assisted software engineering.
Rather than adding artificial intelligence to existing workflows, it redefines the relationship between developers and code.
Working within agent‑first environments enables teams to operate at higher abstraction levels, accelerate iteration cycles and reduce repetitive implementation effort.
As software engineering moves towards collaborative human‑agent systems, Antigravity is not simply another tool.
It is an early indicator of how professional development environments are likely to evolve over the coming years.

On Tuesday, March 19, the SEC issued joint guidance with the CFTC to “finally” provide clarity about how the securities laws apply to digital assets. On many issues, including staking and meme coins, the SEC’s new guidance is a welcome development and a marked improvement from the Gensler days. It also rightly acknowledges that the agency’s “regulation by enforcement” campaign under Chair Gensler had muddied compliance obligations and stifled the industry. But in important ways, the guidance stops short of the full course correction the crypto industry needs.
The biggest shortcoming is the SEC’s articulation of the Howey test for “investment contract” securities. All agree that most digital assets are not, on their own, investment contracts. Even the Gensler SEC (eventually) admitted as much, and the SEC’s new guidance reiterates that position. The key question, though, is when a digital asset is sold as part of an investment contract such that the sale becomes subject to the securities laws.
The statute provides the answer. As a matter of text, history and common sense, an “investment contract” means a contract – an express or implied agreement between the issuer and investor under which the issuer will deliver ongoing profits in return for the purchaser’s investment. Most digital assets are not investment contracts because they are not contracts. A digital asset can be the subject of an investment contract (like any other asset), but it can still be sold separately from the investment contract without implicating the securities laws. In the suits brought by Gensler, crypto companies vigorously defended that proper interpretation of the law.
Yet the SEC’s new guidance is silent about whether an investment contract requires contractual obligations. Instead, it says an investment contract travels with a digital asset (at least temporarily) when the “facts and circumstances” show the digital-asset developer “induc[ed] an investment of money in a common enterprise with representations or promises to undertake essential managerial efforts,” leading purchasers to “reasonably expect to derive profits.” That does not clearly confirm a clean break from the SEC’s former view that Howey eschews “contract law” and demands “a flexible application of the economic reality surrounding the offer, sale and entire scheme at issue, which may include a variety of promises, undertakings and corresponding expectations.”
The Gensler SEC’s know-it-when-I-see-it approach to Howey was deeply problematic. It allowed the agency to piece together an “investment contract” from various public statements by digital-asset developers — tweets, white papers, and other marketing materials — even absent concrete promises by the issuers. And it failed to distinguish securities from collectibles like Beanie Babies and trading cards, the value of which depends heavily on their maker’s marketing and attempts to create scarcity. The SEC missed an important opportunity to clearly reject that approach and restore a key statutory dividing line between assets and securities — a contract.
The SEC can still fix this problem, but to do so, it will need to further clarify how the agency intends to apply Howey going forward — and to finally make a clean break with Gensler’s overbroad interpretation of the securities laws. For example, the Gensler SEC repeatedly cited various “widely distributed promotional statements” as a basis for pushing a digital asset into the realm of investment contracts. The SEC’s new guidance puts some guardrails on that approach by requiring a developer’s representations or promises to be “explicit and unambiguous,” to “contain sufficient details,” and to occur before the purchase of the digital asset. But even that improved approach leaves too much room for interpretation. It could be expansively applied by private plaintiffs, the courts or a future SEC. Rather than continue down the path Gensler trod, the SEC should make clear that mere public statements affecting value are insufficient and that promises and representations must be made in the context of the specific sale at issue — not strung together from whitepapers or social-media posts that many purchasers likely never considered.
The SEC also should clarify its approach to secondary-market trading. Helpfully, the agency now recognizes that digital assets are not investment contracts “in perpetuity” just because they once were “subject to” investment contracts. But the agency also says that digital assets remain “subject to” investment contracts traded on secondary markets (like exchanges) so long as purchasers “reasonably expect” issuers’ “representations and promises to remain connected” to the asset. The SEC says little about how to assess those reasonable expectations, providing only two “non-exclusive” examples of when an investment contract “separates” from a digital asset. And it says nothing about whether a secondary-market purchaser must have a contractual relationship with the token issuer. That leaves it unclear whether the SEC has really moved on from the Gensler-era view that investment contracts “travel with” or are “embodied” by crypto tokens.
Instead of those mixed messages, the SEC should impose meaningful restraints on the application of the securities laws to secondary-market transactions by adopting Judge Analisa Torres’s approach in Ripple. Judge Torres recognized that it is unreasonable to infer an investment contract in the context of “blind bid-ask” transactions — that is, transactions where the counterparties do not know each other’s identities (as is common in secondary-market trading). Because buyers have no idea whether their money goes to a token’s issuer or to some unknown third party, they can’t reasonably expect that the seller will use the buyers’ money to generate and deliver profits. The SEC should endorse Judge Torres’s analysis expressly.
These are not academic quibbles. The current SEC might not read or enforce its new guidance in a manner that threatens the viability of the crypto industry in the United States. But by failing to clearly reject the excesses of the Gensler era, the SEC’s new guidance leaves the industry exposed to a future SEC that could leverage ambiguities in the SEC’s current guidance to resume regulation by enforcement. Private plaintiffs could try to do the same in lawsuits against key industry players (such as the leading exchanges). And in the meantime, the SEC’s interpretations could distort the securities-law baseline during negotiations over market-structure litigation.
The SEC invited comments on its guidance, and the industry should oblige. The SEC should get credit where credit is due. But the industry should not hesitate to highlight the lingering flaws and ambiguities in the agency’s approach and advocate for clear, meaningful, and permanent restraints to ensure regulatory clarity and stability. Simply giving the legal architecture of the last enforcement campaign a facelift is not enough.
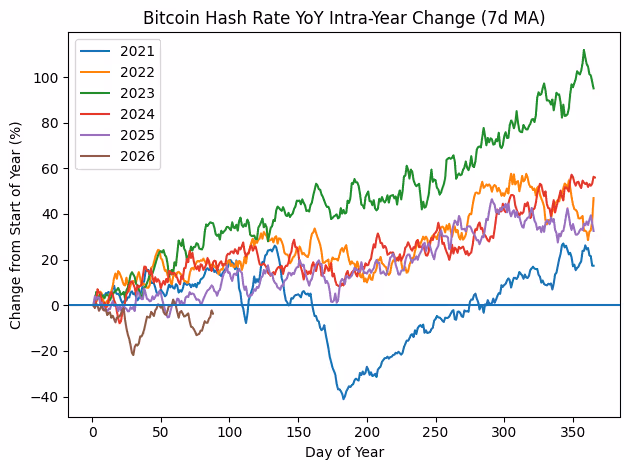
For the first time in six years, the bitcoin hashrate, the total computational power securing the network, fell during the first quarter. It is currently down around 4% year to date, hovering around 1 zettahash per second (ZH/s).
Over the past five years, the rate has surged from roughly 100 exahashes per second (EH/s), a 10-fold increase, according to Glassnode data. Each year, the metric rose during the first quarter and ended with strong full-year growth in excess of 10%. In 2022, the figure almost doubled.

The AI Pivot
The shift in 2026 reflects changing economics across the bitcoin mining sector. With production costs near $90,000 per bitcoin and the spot price closer to $67,000, margins are negative. In response, many publicly listed miners are switching to artificial intelligence and high-performance computing infrastructure, where returns are higher and more predictable.
This transition is being funded through debt issuance and bitcoin sales, reducing reinvestment into bitcoin mining. As a result, hashrate growth is becoming more sensitive to the cryptocurrency’s price, with weaker prices likely to trigger further declines as smaller operators exit.
While a falling hashrate may raise concerns about network security, decentralization may matter more than absolute size. Publicly listed U.S. miners have accounted for over 40% of the global hash rate, and a reduction in their influence could lead to a more geographically distributed network. In that sense, the current shift may ultimately support decentralization.
Despite the slowdown, CoinShares still forecasts hashrate growth to around 1.8 ZH/s by the end of 2026, conditional on bitcoin recovering toward $100,000.
Read More: End of bitcoin ‘HODL’: public miners going all-in on AI, signaling more BTC selling


DeFi risk curator Steakhouse Financial has been hacked and its website and app are now being used to host a phishing scam.
Steakhouse disclosed the breach Monday morning and warned that any new users interacting with the website or app are likely interacting with a malicious version implemented by the hackers.
The attack appears to have affected just the front-end of operations, as Steakhouse assured users, “No deposits are at risk. No contracts are affected. All Steakhouse depositors are safe.”
Read more: Fake Uniswap phishing ad on Google steals trader’s life savings
“We are working to restore the frontend as soon as possible,” the firm said.
Steakhouse co-founder, Sébastien Derivaux, warned crypto users to avoid the website until further notice.
Various crypto firms offered alternative services and safety assurances for customers with funds at Steakhouse.
Others found humor in the incident, with one user asking, “Does phishing on Steakhouse make this a surf and turf attack?”
At the time of writing, neither Steakhouse Financial or its CEO have shared any further updates on the incident.
Steakhouse Financial housing a crypto drainer
Crypto security firm Blockaid claims that the Steakhouse attackers are utilizing code from one of the “largest active wallet drainer operations onchain” known as Angelferno, or Angel Drainer.
Read more: Fears of $27M Venus Protocol hack turn out to be phishing attack on power user
Earlier this month, AI crypto firm GAIB fell victim to a social engineering scheme that gave hackers access to its domain, where they implemented a copycat website kitted with Angelferno.
Drainers work by stealing a user’s crypto after they sign a malicious transaction that gives hackers full access to withdraw their funds.
Blockaid was able to help GAIB detect the malware, and the malicious site was gone in roughly seven hours, with no apparent user losses.
Got a tip? Send us an email securely via Protos Leaks. For more informed news and investigations, follow us on X, Bluesky, and Google News, or subscribe to our YouTube channel.
This month, Bitcoin’s hashrate fell 6% after the US and Israel attacked Iran, highlighting Iran’s significant crypto mining activity.
Bitcoin price, meanwhile, remains lackluster. Higher 4% yields on US Treasury bonds have added pressure, and investors are seeking less risky prospects amid geopolitical tension.
Less appetite for crypto trading has proven problematic for Robinhood. The trading platform’s stock is down 16% on the month, and leadership has announced a stock buyback program.
Prediction markets marked a record number of transactions, representing a more than 2,800% increase since this time last year.
Here’s March by the numbers:
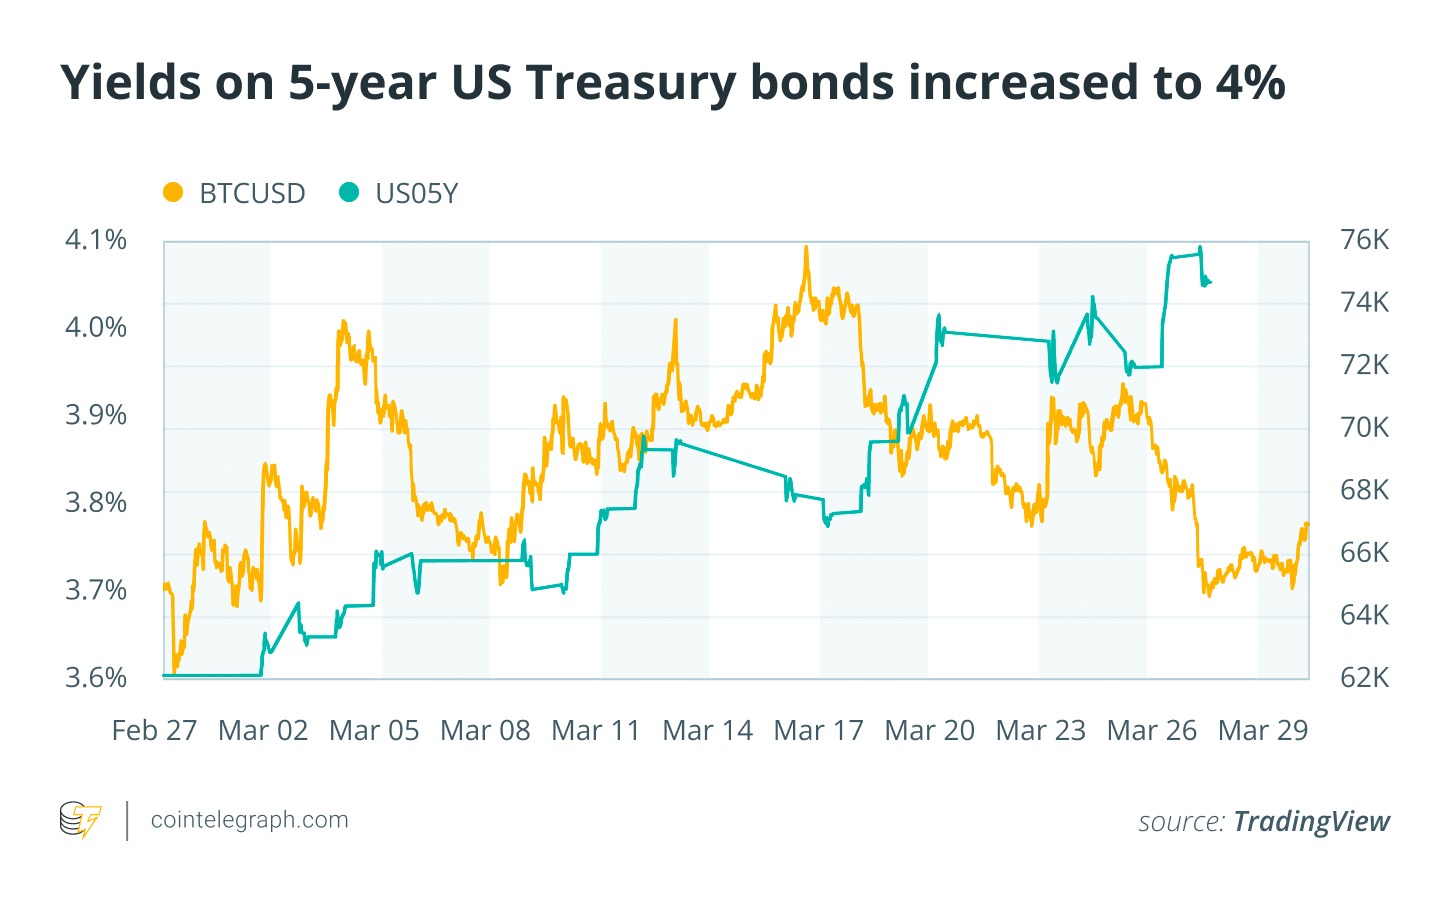
Bitcoin lacks momentum as 4% US Treasury bond yields put pressure on price
Yields on five-year US Treasury bonds are up 4% in March, putting pressure on Bitcoin price. While showing some gains in mid March, the asset ended the month much where it started, around $67,000.

As per an analysis from Cointelegraph, fears of a drawn-out conflict between the US and Israel against Iran have led investors to cut out risk. A sell-off in bonds, along with a nine-month high of 4% in yields, suggests that traders are building cash positions.
Bitcoin hashrate falls nearly 6% after US and Israel attack Iran
On Feb. 28, the United States and Israel launched a joint special military operation in Iran called “Operation Epic Fury.” One month later, the Bitcoin (BTC) hashrate is down almost 6%.

Bloomberg crypto and digital assets strategist Dushyant Shahrawat said in a recent interview that Iran is one of the world’s largest Bitcoin miners, accounting for some 6-8% of global hashrate, and 70% of mining activities are conducted by the military.
Disruptions to the country’s energy infrastructure and diversion of military priorities to defense have thus hit Iran’s ability to mine Bitcoin.
Prediction market transaction top 192 million
Transactions on prediction markets like Polymarket and Kalshi topped 192 million in March. That represents a 24% increase from last month and a 2,880% increase compared to the same time last year, according to Dune analytics.

Related: Lawmakers push another bill to curb prediction market insider trading
Prediction markets are growing in popularity, but in the United States, they face state regulators who say they facilitate a form of gambling. At least 11 states have taken legal action against them.
On March 20, Carson City District Court Judge Jason Woodbury upheld a regulator’s move to temporarily ban prediction market Kalshi in Nevada.

Arizona has brought criminal charges against Kalshi for allegedly “running an illegal gambling operation and taking bets on Arizona elections, both of which violate Arizona law.”
Other states like Utah and Pennsylvania are currently considering legislation that would bring prediction markets under state gambling or gaming laws. Kalshi says that it answers only to federal regulation under the Commodity Futures Exchange Commission (CFTC).
Euro-denominated stablecoins account for 85% of non-dollar volume
Stablecoins backed by the euro have emerged as a favorite alternative to assets backed by US dollars. Some 85% of non-dollar stablecoin volumes occur in euros, according to a March report from Dune.

While euro-denominated coins initially only represented some 50-70% of the non-dollar market, they began expanding significantly in 2024. Now they represent 85% of total transferred volume. Euro stablecoins are also dominant in regard to participation, with user share rising to over 78%.
Dune attributes this increase to more confidence in stablecoins among institutions, thanks in large part to the Markets in Crypto-Assets regulatory package (MiCA).
Robinhood stock down 16% on month
Robinhood stock has decreased over 16% in March, from nearly $80 to $66 as of publishing time.

The stock and crypto trading company’s share price has been struggling in recent months. Over the last six months, it dropped over 50%. Uncertainty over the regulation of new verticals like prediction markets and social trading, along with a collapse in crypto trading revenues are creating structural obstacles for the company.
Revenue from crypto transactions reportedly dropped 38% year-over-year as of Q4 2025. Crypto app volumes dropped 58%.
To address the problem, Robinhood has approved a $1.5 billion share buyback program in March, which will execute over the next three years.
Strategy’s Bitcoin holdings are 11% in the red
Amid a lackluster price action on the month, Strategy’s Bitcoin portfolio is at an 11% loss. The average cost of Bitcoin in its portfolio is $75,669. Bitcoin is trading around $67,800 at publishing time.

Still, the company has continued its regular Bitcoin purchases. It made two this month: one for 17,994 Bitcoin on March 9 and another for 22,337 Bitcoin on March 16, amounting to roughly $2.7 billion at publishing time.
The software company has financed most of its Bitcoin purchases through high-yield stock offerings, like Stretch (STRC). This allows the company to buy Bitcoin without diluting its MSTR common shares.
The company’s chair, Bitcoin bull Michael Saylor, said recently that 80% of STRC buyers are retail investors. “Retail investors prefer low-volatility, high-yield digital credit,” he said.
Magazine: XRP yet to ‘price in’ 3 bullish catalysts, Bitcoin to $80K? Trade Secrets

Brent crude punched through $116 a barrel on March 30, 2026 – a 60% monthly surge driven by escalating US-Iran tensions after Tehran accused Washington of preparing an invasion, compounding Houthi strike disruptions, and Bitcoin is now sitting in the crosshairs of the resulting institutional risk-off rotation.
The oil price spike is not hitting crypto directly; it’s hitting it through three compounding channels: inflation re-acceleration, delayed Fed rate cuts, and a geopolitical risk premium that is draining leveraged long exposure across every risk asset class.
Bitcoin dropped to weekly lows between $63,000 and $65,700, over $500 million in derivatives liquidations hit the tape, and 84% of that came from long positions.
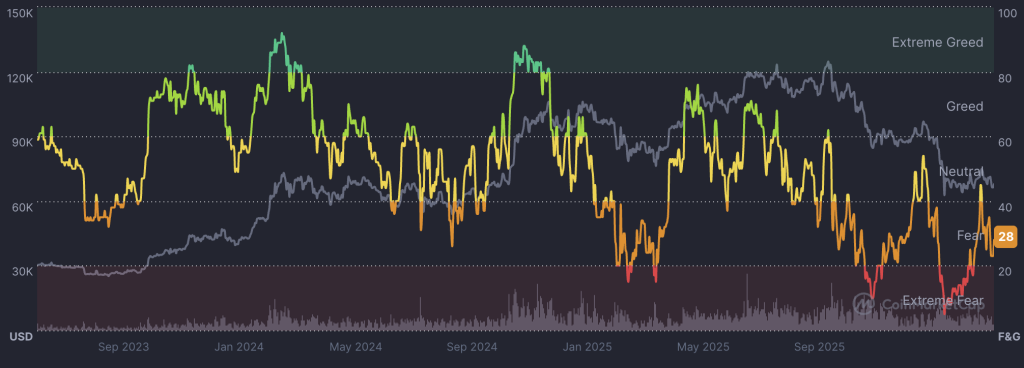
The Fear & Greed Index collapsed to 28 – Extreme Fear – while a record $14 billion options expiry amplified the volatility.
Discover: The best crypto to diversify your portfolio with
Bitcoin Faces Structural Deleveraging as Oil-Driven Inflation Rewrites the Fed Playbook
$63,000 is the line Bitcoin cannot afford to lose.
That level has capped the downside through the prior 2 macro shock episodes. The 200-day moving average sits just below at $62,400.
A close beneath it would be the first since the October 2025 rally began and would likely trigger a second wave of systematic deleveraging from quant funds running momentum strategies. Resistance above is layered at $67,500 and $71,000, both former support zones that flipped during the February selloff.

The oil correlation matters more than usual right now. Binance Research puts the Bitcoin-WTI correlation near zero across most market regimes.
The 30-day rolling correlation currently sits at just 0.15. But that changes during extreme disruption events. The Strait of Hormuz is flowing at roughly 4 million barrels per day against a normal 20 million. That is not a tail risk. That is an active structural supply shock, exactly the kind that produces temporary correlation spikes.
If US-Iran tensions de-escalate and Hormuz flows normalize, Brent retreats below $100 and the Fed signals patience at its April 1 to 2 meeting. Bitcoin reclaims $67,500, BlackRock’s IBIT builds on its $225.2 million inflow during the dip, and institutional rotation flips back into accumulation mode.
If tensions persist without full escalation, Brent holds $110 to $116 and the Fed stays hawkish through Q2. Bitcoin grinds between $63,000 and $68,000 with elevated volatility, ETF flows stay choppy, and mining costs for operators like Marathon Digital rise 15 to 25%.
“The United States of America is in serious discussions with A NEW, AND MORE REASONABLE, REGIME to end our Military Operations in Iran.” – President Donald J. Trump
pic.twitter.com/0MWL2hSNmK
— The White House (@WhiteHouse) March 30, 2026
A full Hormuz blockade is the scenario nobody wants to price. Oil above $130, 10-year Treasury yields breaking above 5%, and the Fed forced to choose between fighting inflation and supporting growth.
That combination could send Bitcoin to $55,000 to $57,000 in a full risk-off liquidation wave, mirroring February 2022 when WTI hit $115 and BTC fell from $45,000 to $39,000 in days.
The inflation channel is what most traders are underweighting. Sustained oil above $100 does not just pressure sentiment. It mechanically delays rate cuts.
Bitcoin’s slide below $67,000 alongside rising Treasury yields already showed how directly that linkage bites. BTC’s 0.9 correlation to the IGV tech index means it trades like a rate-sensitive growth asset in the short run, not an inflation hedge.
Watch the Fed’s April 1 to 2 meeting. Any language signaling a longer hold is the catalyst for the next leg down. Congressional votes on Iran sanctions expected mid-April carry equal weight. Further Hormuz disruption sends another shock through energy markets and straight into institutional risk appetite.
Discover: The best pre-launch token sales
The post Oil at $116: Why This Macro Shock Could Trigger a Bitcoin Risk-Off Deleveraging appeared first on Cryptonews.


BitMine Immersion Technologies (BMNR) made its largest weekly purchase of either (ETH) this year, adding 71,179 ETH and extending a month-long ramp-up in buying even as crypto prices remain under pressure.
The purchase, worth roughly $143 million at current prices, lifted the company’s total holdings to over 4.73 million ETH, about 3.92% of the token’s supply, according to a Monday update. BitMine has now increased its buying pace for four straight weeks, stepping up from a prior average of 45,000 to 50,000 ETH.
The move stands out as most other large digital asset treasuries (DAT) halted crypto accumulation or even sold tokens during the crypto market downturn. Strategy (MSTR), the largest corporate bitcoin owner, was the only other major buyer in the recent months, and even the Michael Sayler-led company refrained, breaking a 13-week buying streak.
Bitmine Chairman Thomas “Tom” Lee said the firm continues to see the current market as the final phase of a downturn as rising oil prices and geopolitical tensions keep risk assets under pressure.
The company’s total crypto and cash holdings stood at $10.7 billion. In addition to its ETH treasury, BitMine held 197 bitcoin, and $961 million in cash and equity stakes, including $102 million in Eightco Holdings.
Digital asset investment products posted their first weekly outflows in over a month, as a mix of geopolitical tensions and shifting monetary policy expectations rattled investor confidence.
According to the latest data, crypto funds saw $414 million in net outflows, marking a sharp reversal after five consecutive weeks of inflows.
Crypto Funds Lost $414 Million Last Week
The pullback coincided with rising tensions tied to the Iran conflict and a notable shift in expectations around the Federal Reserve, as markets pivot from anticipating rate cuts to pricing in potential hikes.
The US accounted for the bulk of the outflows, with $445 million exiting digital asset funds, highlighting a decisive risk-off stance among American investors.
In contrast, European markets showed signs of opportunistic buying. Investors in Germany and Canada added $21.2 million and $15.9 million, respectively, suggesting confidence in long-term valuations despite short-term volatility.
Among individual assets, Ethereum was hit hardest, recording $222 million in outflows. The move pushed its year-to-date flows into negative territory, reflecting sustained pressure that analysts link in part to regulatory uncertainty surrounding the Clarity Act.
Bitcoin also faced headwinds, shedding $194 million during the week. However, it continues to show resilience, maintaining a strong $964 million in net inflows for the year so far.
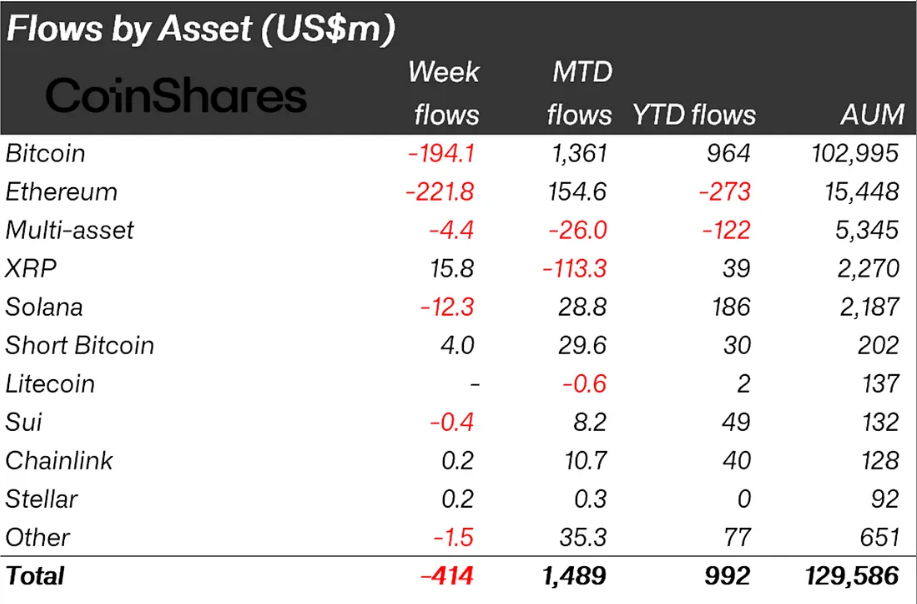
This suggests that while short-term sentiment has weakened, institutional conviction in Bitcoin remains intact.
In contrast, XRP stood out as a rare gainer, attracting $15.8 million in inflows. Its performance positions it as a relatively safe haven within the digital asset space during periods of broader market stress.
The latest fund flow data shows how quickly sentiment in crypto markets can shift when macroeconomic and geopolitical risks converge, leaving investors to reassess their exposure in an increasingly uncertain environment.
The post Geopolitics and the Fed Flush $414 Million From Crypto Funds in a Week appeared first on BeInCrypto.
Behind Gary Woodland’s unique Cobra driver build

This year’s Xbox Games Showcase is set for June 7

How Vookum ACTUALLY Makes His Money


-
 NewsBeat5 days ago
Manchester United reach agreement with Casemiro over contract clause amid transfer speculation
-

 News Videos5 days ago
Parliament publishes latest register of MPs’ financial interests
-

 NewsBeat3 days ago
The Story hosts event on Durham’s historic registers
-

 Business4 days ago
Instagram, YouTube Found Responsible for Teen’s Mental Health Struggle in Historic Ruling
-
 NewsBeat5 days ago
Tesco is selling new Cadbury Dairy Milk bar and people can’t wait to try it
-

 Tech7 days ago
Samsung will soon let you control smart home devices from your car’s dashboard
-
 Entertainment2 days ago
Lana Del Rey Celebrates Her Husband’s 51st Birthday In New Post
-

 Fashion6 days ago
Does It Matter What You Wear When You’re Laid Off and Looking?
-

 Business6 days ago
More women enter wealth management, but few in advisory roles: study
-

 Politics7 days ago
How Media Platforms Balance Performance and Accessibility in Image Delivery
-
 NewsBeat6 days ago
NASA Artemis II Astronauts enter 14-Day quarantine as moon rocket reaches launchpad
-

 NewsBeat6 days ago
Entrepreneurs Forum survey reveals optimism in North East
-
 Tech4 days ago
Intercom’s new post-trained Fin Apex 1.0 beats GPT-5.4 and Claude Sonnet 4.6 at customer service resolutions
-

 Business6 days ago
Late-paying firms face multimillion-pound fines under new crackdown
-

 Sports5 days ago
Fantasy Baseball Week 1 Preview: Top sleeper hitters for both five- and 12-day period led by Munetaka Murakami
-

 Tech5 days ago
US FCC Prohibits Approval Of New Foreign-Made Consumer Routers
-
 Crypto World6 days ago
BTC gives up $70,000 level as markets mull higher interest rates
-

 Tech6 days ago
Embedding compliance in AI adoption
-

 Fashion6 days ago
Coffee Break: Korean Skincare Set
-

 Fashion6 days ago
Althea Mink: Patrice Taylor’s Atlanta Couture Brand Built on Legacy, Resilience, and Architectural Glamour
You must be logged in to post a comment Login