

Crypto World
Ethereum just touched $1,500. Is $1,000 next?


Ethereum has fallen to $1,500. In the depths of the June 2026 crypto selloff, ETH briefly touched the $1,500 level, a price last seen in the depths of previous bear markets and roughly 70% below its August 2025 all-time high of $4,953.
Summary
- Ethereum touched $1,500 after falling roughly 70% from its August 2025 all-time high.
- ETH has fallen harder than Bitcoin because of higher beta, weaker ETF demand, and leveraged liquidations.
- A continued Bitcoin decline toward $50,000–$55,000 could pull Ethereum closer to the $1,000 level.
- Bitcoin’s direction, the ETH/BTC ratio, ETF flows, and Fed policy will determine whether $1,500 holds.
The drop has been faster and deeper than Bitcoin’s, and it has pushed at least one analyst to flag the previously unthinkable: a possible decline toward $1,000.
For an asset that traded near $5,000 less than a year ago, the idea of a three in front of nothing is a brutal reset, and it has Ethereum holders asking the only question that matters right now. Is $1,500 the bottom, or a waypoint on the road to $1,000?
The honest answer requires separating the levels that matter, the forces driving the decline, and the specific conditions that would determine which way it breaks. This piece walks through how Ethereum got to $1,500, why it is falling harder than Bitcoin, what would have to happen for $1,000 to come into play, and what would have to happen to prevent it.
How Ethereum got to $1,500
The fall to $1,500 was not a single event but the culmination of a long decline that accelerated into capitulation.
Ethereum peaked at $4,953 in August 2025. From there it entered a grinding downtrend through late 2025 and into 2026, making lower highs and lower lows even as the broader crypto narrative stayed constructive. The June 2026 selloff turned that grind into a collapse.
As Bitcoin broke below $70,000 and then $62,000, Ethereum fell harder, sliding under $1,900, then $1,800, before touching $1,500 at the worst of the washout. That represents roughly a 70% decline from the peak, the kind of drawdown that defines a deep bear market, not a correction.
The immediate triggers were the same forces hammering all of crypto, amplified for Ethereum. A strong U.S. jobs report crushed hopes for near-term Federal Reserve rate cuts, sending risk assets lower across the board. Fresh U.S.-Iran tensions drove a broad risk-off move. U.S. spot Bitcoin ETFs bled through a record outflow streak, and Ethereum ETFs bled alongside them.
More than $1 billion in leveraged crypto positions was liquidated in cascades, with Ethereum longs among the hardest hit. Every one of these pressures pushed Ethereum down, and because ETH amplifies market moves, it fell further than Bitcoin at each step.
The $1,500 touch was the emotional low point, the level where the question shifted from “how far has it fallen” to “how much further can it go.” Reaching a price not seen since previous bear-market bottoms forced a psychological reckoning.
For holders who bought anywhere near the highs, $1,500 represents catastrophic losses, and the appearance of $1,000 price targets in analyst commentary signals that the market is now seriously entertaining scenarios that would have seemed absurd a year ago. To understand whether those scenarios are realistic, it is necessary to understand why Ethereum specifically has been the bigger loser.
Why Ethereum is falling harder than Bitcoin
Ethereum’s steeper decline is not random. It reflects both a mechanical reality and a structural one, and both point to why $1,000 is even being discussed.
The mechanical reason is beta. Ethereum has consistently exhibited higher beta than Bitcoin, meaning it amplifies whatever Bitcoin does in both directions. When Bitcoin rallies, ETH usually rallies more; when Bitcoin falls, ETH usually falls more.
This is because Ethereum sits one rung down the crypto risk ladder, with shallower liquidity and a smaller institutional base than Bitcoin’s “digital gold” position commands. In a risk-off cascade, capital flees the riskier asset first and fastest, so ETH dropped harder at every stage of the selloff. The 70% drawdown versus Bitcoin’s roughly 50% is beta in action.
The structural reason is the ETH/BTC ratio, which has been in a multi-year decline. This ratio measures Ethereum’s value against Bitcoin directly, stripping out the moves that affect all of crypto, and it has been grinding lower since 2021.
The driver is the institutional demand asymmetry. The January 2024 launch of spot Bitcoin ETFs gave Bitcoin a powerful, steady institutional bid that Ethereum’s later ETFs never matched at the same scale. Bitcoin gained a structural class of buyer; Ethereum did not.
When the broad market retreats, Ethereum has less institutional demand underneath it to cushion the fall. That is why it keeps losing ground to Bitcoin in relative terms and why its absolute price has fallen so much further from its peak.
Add the leverage dynamics and the picture sharpens. Ethereum has carried crowded long positioning and faced persistent whale selling through the downturn, and the liquidation cascades of the June selloff hit those crowded ETH longs hard, mechanically accelerating the decline.
Ethereum therefore fell harder for three compounding reasons: it amplifies market moves by nature, it lacks the institutional demand floor that supports Bitcoin, and its leveraged positioning was violently unwound.
Those same factors are why bears can credibly point further down. If the forces that drove ETH to $1,500 persist, the path to $1,000 is not mechanically blocked the way it would be for an asset with a firmer demand floor.
The case for $1,000
The $1,000 scenario is no longer a fringe call, and it rests on a coherent, if grim, logic worth laying out honestly.
The technical case starts with the absence of support. Having broken decisively below the levels that held in previous cycles, Ethereum is in a zone with little historical price structure to lean on.
When an asset falls through its established support levels, the next meaningful floor can be far below because there are few prior buyers anchored at intermediate prices to step in. The $1,500 level itself, once it fails to hold as support, becomes resistance, and the chart opens toward the psychologically significant $1,000 round number with limited technical obstruction in between.
The fundamental case rests on the same structural weakness that drove the decline. If the institutional demand asymmetry persists, with Bitcoin holding its ETF bid while Ethereum’s flows stay weak, and if the broader macro environment stays hostile with no Fed rate cuts and continued risk-off pressure, then nothing changes the dynamic that has driven ETH down.
The ETH/BTC ratio could keep grinding lower. In a scenario where Bitcoin itself falls toward the $55,000 or even $50,000 levels that some analysts flag, Ethereum’s higher beta would drag it proportionally further down, with $1,000 becoming a natural consequence of a deeper Bitcoin decline rather than an independent event.
The behavioral case is capitulation dynamics. Deep bear markets tend to overshoot to the downside, falling further than fundamentals justify as fear, forced selling, and exhaustion compound.
If the current selloff has more capitulation left to run, ETH could spike toward $1,000 in a final washout even if it does not stay there. The appearance of $1,000 targets in analyst commentary reflects this: it is not necessarily a prediction that Ethereum settles at $1,000, but a recognition that in a continued bear scenario, the combination of no support, persistent structural weakness, and capitulation overshoot could tag that level.
The bears are not being absurd. They are extrapolating the forces that are visibly in control.
The case against $1,000
The bull rebuttal is equally real, and it rests on the argument that the forces driving ETH down are cyclical rather than permanent, and that $1,500 is closer to a bottom than a waypoint.
The valuation case is that $1,500 already prices in enormous pessimism. A 70% drawdown from the peak is, historically, the kind of decline that has marked bear-market bottoms rather than midpoints.
Ethereum at $1,500 trades at a level that long-term holders and value-oriented buyers may see as deeply discounted relative to the network’s actual usage, developer activity, and position as the dominant smart-contract platform. The deeper the price falls below any reasonable estimate of fundamental value, the stronger the incentive for accumulation, which builds a floor.
The fundamental case is that Ethereum’s underlying position has not broken. It remains the leading smart-contract platform, the settlement layer for the largest share of decentralized finance and tokenized assets, and the base layer for a growing ecosystem of Layer-2 networks.
Its development continues, with scaling and efficiency upgrades on the roadmap, and the emergence of Ethereum treasury companies accumulating ETH introduces a new structural demand source that did not exist in previous cycles.
The treasury-company thesis, however, is under pressure from the decline. BitMine was reportedly sitting on roughly $9.58 billion in unrealized ETH losses, while SharpLink’s ETH position was down about $1.59 billion as the market fell. The losses do not automatically mean those firms must sell, but they show that the new demand source also carries balance-sheet risk when ETH declines.
If those treasury vehicles continue accumulating and the institutional demand gap with Bitcoin narrows, the structural weakness that drove the decline could begin to reverse, putting a floor under the price well above $1,000.
The macro case is that the entire selloff is hostage to forces that can turn. The decline has been driven heavily by the hawkish Fed outlook, the Iran risk-off move, and the AI-driven capital rotation away from crypto. None of those is permanent.
A Fed pivot toward rate cuts, an easing of Middle East tensions, or a cooling of the AI trade would relieve the pressure that drove ETH to $1,500. Because Ethereum amplifies moves in both directions, a market recovery would lift ETH faster than Bitcoin.
In the bull scenario, $1,500 marks the capitulation low of a cyclical bear market, and the same high beta that made the fall so brutal makes the eventual recovery sharp. The bulls are betting that the forces in control today are temporary and that betting on $1,000 means betting they persist indefinitely, which they rarely do.
What actually determines which way it breaks
Rather than guess, the useful approach is to identify the specific signals that distinguish the $1,000 path from the $1,500-was-the-bottom path, because they are different and observable.
The first is Bitcoin’s direction because ETH is currently trading as a high-beta bet on Bitcoin more than as an independent asset. As long as Bitcoin keeps falling, Ethereum’s beta means it will keep falling harder, and a Bitcoin decline toward $55,000 or $50,000 would likely drag ETH toward $1,000 mechanically.
If Bitcoin stabilizes and holds support, the single biggest downward force on Ethereum eases. Watch Bitcoin first; it tells you more about ETH’s near-term path than anything Ethereum-specific.
The second is the ETH/BTC ratio. This is the cleanest measure of whether Ethereum’s structural weakness is continuing or reversing.
If the ratio keeps grinding lower, Ethereum is still losing the relative-strength battle and the bear case has the upper hand. If it stabilizes and turns up, it signals that the institutional demand gap may be narrowing, which would support the bottom thesis.
The ratio is the dividing line between “ETH is just falling with the market” and “ETH is structurally broken.”
The third is the macro turn, specifically the Fed and the flow data. Because the selloff is heavily macro-driven, the signals that would flip the picture are a shift in rate-cut expectations and a reversal in ETF flows from outflows back to sustained inflows.
A Fed pivot or a series of softer inflation prints would relieve the pressure on all risk assets, and Ethereum ETF inflows turning positive would signal the institutional demand base is finally building.
Until those indicators turn, the forces that drove ETH to $1,500 remain in control, and the $1,000 scenario stays live.
The honest synthesis is that $1,500 is a genuine inflection point where both scenarios are credible. The broader context tilts the odds toward caution in the near term while leaving the bull case intact over a longer horizon.
In the near term, with Bitcoin still weak, the macro environment hostile, and the ETH/BTC ratio depressed, the forces that would carry Ethereum toward $1,000 are the ones currently in control. A further leg down cannot be dismissed, and the $1,000 targets deserve to be taken seriously rather than waved away.
Over a longer horizon, a 70% drawdown in the leading smart-contract platform, with intact fundamentals and a new treasury-demand source emerging, is the kind of setup that has historically rewarded patient accumulation once the macro turns.
The practical reading for a holder is that $1,500 is not a number to anchor to either as a guaranteed floor or a doomed level. It is the point where Ethereum’s fate splits, and which path it takes will be determined by Bitcoin’s direction, the ETH/BTC ratio, and the macro turn, not by where the price sits today.
Watch those three, not the round numbers.
This article is for informational purposes and does not constitute financial or investment advice. Cryptocurrency markets are highly volatile and price predictions are inherently speculative. The figures and analysis described reflect data available as of June 2026. Always do your own research and consult with qualified financial professionals before making investment decisions.


The Senate treats the crypto bill as a finish line. It is a starting gun. Some provisions fire the moment the president signs, others wait years for two short-staffed agencies to write the actual rules, and the gap between those two speeds is where the market’s expectations will be made and broken.
Summary
- If the CLARITY Act becomes law, its effects split into two radically different speeds: provisions that operate by force of statute the day it takes effect, and provisions that exist only after the SEC and CFTC complete rulemakings that will take years.
- Day one by operation of law: the ETP grandfather clause classifying XRP, SOL, and DOGE as non-securities, the Section 604 shield for non-custodial developers, and federal preemption of conflicting state regimes.
- Waiting on rules: the self-certification process, digital commodity exchange and broker registration, the ancillary-asset disclosure regime, kiosk standards, and virtually everything the industry describes when it says the word clarity.
- The empirical base rate is discouraging: the GENIUS Act’s agencies missed their own statutory rulemaking deadline this month, one year after passage, and CLARITY hands a larger workload to a CFTC operating with a single confirmed commissioner.
- The bridge regime already exists and nobody voted on it: the SEC-CFTC joint interpretation naming 16 digital commodities is interim policy, revocable at will, which is both the preview of the law’s effects and the argument for why statute still matters.
Every conversation about the CLARITY Act ends at the same place: sixty votes, and then, implicitly, clarity. The bill passes, the classification wars end, the exchanges list, the institutions allocate, the industry exhales. It is the assumption underneath every price target conditioned on passage, every prediction-market contract, every analyst note describing the vote as the catalyst. And it mistakes a starting gun for a finish line. A market-structure law of this size does not operate; it instructs, and the instructions go to two federal agencies that must convert three hundred pages of statute into the registration forms, procedural rules, disclosure templates, and examination manuals that actually constitute a regulatory regime. Some of the bill’s provisions need none of that and fire the moment the president’s signature dries. Others, including nearly everything the industry actually means by the word clarity, exist on paper only until rulemakings finish, and the only empirical evidence available on how fast that happens arrived this month, when every agency responsible for the GENIUS Act’s rules missed the statute’s own one-year deadline. This piece maps the Monday morning after passage: what changes instantly, what waits, how long the wait plausibly runs, and why the gap between the two speeds is where the next two years of crypto-market surprises will come from.
What fires by operation of law
Statutes contain two kinds of provisions: those that instruct agencies to build something, and those that simply declare the law. The second kind needs no rulemaking, no forms, no staff, and CLARITY’s most consequential provisions belong to it.
The ETP grandfather clause is the purest case. The merged draft deems a token non-ancillary, and not a security, if it was the principal asset of an exchange-traded product listed on a national securities exchange on January 1, 2026. That is a self-executing classification: the moment the law takes effect, XRP, Solana, Dogecoin, and the rest of the late-2025 ETF class are non-securities by statute, with no SEC determination to await, no certification to file, no rule to write. Every listing decision, custody arrangement, and institutional compliance memo that currently hedges on those assets’ status can stop hedging that morning. It is the largest single legal event in the bill, and it happens at signature speed.
Section 604 behaves the same way. The shield for non-custodial software developers operates as a definitional exclusion from the Bank Secrecy Act’s money-transmitter category; it does not ask FinCEN to build anything, it declares what the law no longer reaches. The prosecution theory behind the privacy-software cases closes as a matter of statute on day one, which is why law enforcement fought the provision line by line instead of planning to contest it in rulemaking, and why its final text matters more than its implementation.
Preemption arrives the same morning. Where the act assigns exclusive federal jurisdiction over digital commodities, conflicting state regimes stop applying to covered activity, which converts a dozen simmering federalism disputes, the same architecture being litigated in the prediction-market war, into settled questions for the assets and intermediaries inside the framework. State regulators will contest the edges, and the edges will take years, but the default flips instantly.
Notice what these instant provisions share: they end things. They end classification ambiguity for the grandfathered class, end a prosecution theory, end state-law exposure for covered conduct. What they do not do is build anything, and everything the industry wants built sits on the slow track.
What waits for the rulemaking stack
The bill’s affirmative machinery, the parts that create a functioning regulated market, not merely decriminalize the existing one, is a list of instructions to agencies, and each instruction is a rulemaking with a docket, a comment period, a final rule, and a compliance date.
The self-certification process heads the list. The statute creates the certify-and-rebut structure and the 60-day window; it delegates the substance, what a certification must contain, what evidence rebuts one, how common control is measured against the 20% line, whether a challenged certification keeps operating. Until those procedural rules exist, no network can actually certify maturity, which means the bill’s celebrated exit door from securities treatment opens only when the SEC and CFTC finish building its hinges. That is the machinery that waits on rules. The registration regimes are next: digital commodity exchanges, brokers, dealers, and custodians are new federal categories that exist only as defined terms until the CFTC writes their registration forms, capital requirements, custody standards, and examination programs. The House framework’s answer to the gap, provisional registration that lets incumbents operate while final rules gestate, mitigates the freeze without ending it, since provisional status still requires the agency to stand up an intake process, and the terms of provisional operation are themselves a rulemaking. The ancillary-asset disclosure regime, the kiosk standards, the bank-custody provisions, the illicit-finance examination standards: each is an instruction, not a fact, and the statute’s own deadlines for them cluster between 180 days and two years, deadlines whose enforceability the next section prices.
This is the honest answer to what changes for markets on Monday morning: less than the vote’s price action will imply. Exchanges cannot register with a regime that has no forms. Issuers cannot certify through a process with no procedures. The tokens freed by the grandfather clause can trade with settled status, which is genuinely enormous, but the new products, venues, and capital-raising the bill enables arrive on the agencies’ calendar, not the Senate’s, and the agencies’ calendar is the subject of the only experiment ever run on it.
The GENIUS base rate
The GENIUS Act is the control group for every optimistic implementation forecast, because it is the same political system implementing a smaller crypto statute with more consensus behind it, and its first year produced a precise, discouraging number: zero final rules by the statutory deadline.
The stablecoin law passed in July 2025 with a one-year mandate for its implementing regulations. The deadline arrived this month; Treasury, the Federal Reserve, the OCC, and the FDIC collectively missed it, with proposed rules still circulating and the industry operating under interim guidance, no-action postures, and educated guesses. That is the base rate for every rulemaking forecast. The reasons are not scandalous, they are structural: interagency coordination, comment volumes in the tens of thousands, novel definitional questions, staffing, and the simple fact that statutory deadlines on agencies carry no enforcement mechanism beyond judicial prodding that itself takes years. Every one of those structural facts applies to CLARITY with the coefficients enlarged. The rule count is bigger, the interagency surface is bigger, two commissions rather than one lead the work, and the definitional questions, maturity, control, decentralization, are harder than anything in the stablecoin docket.
Then add the capacity problem this publication has documented all year. The CFTC, designated inheritor of the digital commodity market, is operating with one confirmed commissioner, a vacancy configuration the Senate’s own negotiators flagged as a precondition dispute, and the bill would hand that agency the largest jurisdictional expansion in its history. That is the capacity problem in full. The SEC is mid-transformation under its own crypto agenda, running Regulation Crypto as interim policy. And both commissions now sit, post-removal-jurisprudence, at presidential pleasure, meaning the personnel writing the rules, and therefore the rules, can turn over with an election in the middle of the implementation window. A reasonable central estimate, calibrated to GENIUS, to Dodd-Frank’s multi-year dockets, and to the agencies’ visible bandwidth: core registration and certification rules proposed within a year of passage, finalized in eighteen months to three years, with litigation over the first contested certifications and registrations extending the true settling-in past the current administration. Clarity, as an operating condition rather than a statute, is a 2028 story.
The bridge nobody voted on
The strangest feature of the implementation landscape is that a version of CLARITY’s regime is already running, administered by the agencies, on nobody’s vote.
The SEC and CFTC’s joint interpretation, issued this spring, names 16 digital assets as digital commodities and places staking, mining, and airdrops outside securities law: functionally, a preview of the statute’s classifications, delivered as interim agency policy. SEC leadership was explicit about its provisional character, framing the guidance as a bridge while only Congress can rewrite the law. The bridge is real, markets are pricing it, and it is also the argument for the statute in one object lesson: everything the interpretation grants, a different commission can revoke with a vote, and the commissioners who would do the revoking now serve entirely at the pleasure of whoever wins the next election. The industry currently enjoys most of CLARITY’s classification benefits as a matter of administrative grace. The bill’s actual product is converting grace into law, which is why the grandfather clause’s instant, irrevocable statutory classification is worth more than any interpretation, and why the slow track’s delays, however long, purchase something the bridge cannot: rules that survive the administration that wrote them.
That is the honest frame for Monday morning. Passage ends the era in which crypto’s American legal status was a revocable opinion, instantly, for the grandfathered class and the shielded developers. It begins, rather than ends, the construction of the regulated market, on agency timelines the GENIUS experiment has already measured. The market pricing passage as a binary is pricing the first fact. The businesses planning launches for the first quarter after signature are about to encounter the second.
The market’s implementation trades
The two-speed structure is not just an administrative forecast; it is a map of mispricings, because a market that prices passage as one event will misprice assets whose benefits arrive at different speeds, and the gaps are identifiable in advance.
The grandfathered class holds the cleanest claim. XRP, SOL, DOGE and the other ETP-anchored tokens receive their entire statutory benefit at signature, which means their passage-scenario repricing should be front-loaded and durable, unlike assets whose CLARITY story depends on the certification machinery. A market treating all altcoins as uniform CLARITY beneficiaries is treating a day-one statutory classification and a 2028 administrative possibility as the same asset, and they are not: the first is a settled legal fact the moment the pen moves, the second is a call option on two agencies’ rulemaking calendars, staffed by commissioners who serve at will. The spread between those two claims is real and currently unpriced.
The intermediaries invert the picture. Exchanges, brokers, and custodians are the bill’s largest long-run beneficiaries, a federal license replacing the state maze is the industry’s oldest wish, and its shortest-run non-beneficiaries, because their new regime exists only after the registration rulemakings finish, and their interim reality is provisional status on terms the CFTC has not written. The listed venues’ equities will trade the vote as an immediate catalyst; their filings, when they come, will describe a multi-year compliance build with meaningful cost before meaningful benefit, which is the gap earnings calls are made of. The same lag applies to the capital-markets provisions: the ancillary-asset offering exemption that would reopen compliant token fundraising is a rulemaking-dependent regime, meaning the first legal American token launch under the framework is realistically a 2027-2028 event, not a passage-week one. That is the category the agencies must operationalize.
And one asset class holds an implementation trade almost nobody discusses: the professionals. Rule-writing at this scale is a full-employment act for securities and commodities lawyers, compliance builders, and the consultancies that translate final rules into operating manuals, and the comment dockets, the first drafts of which will be written by the industry’s own counsel within weeks of any signature, are where the statute’s remaining ambiguities get allocated. The 300 pages Congress votes on are the constitution; the thousands of pages the agencies and their commenters produce afterward are the law as lived, and the firms positioned to shape that second corpus captured much of the value of every prior financial-regulation cycle. Dodd-Frank’s implementation decade built careers and practices; CLARITY’s will too, and the quiet bull market that begins the morning after passage is in billable hours.
What to watch after any signing
The provisional registration terms. The single biggest determinant of the transition’s speed: how quickly the CFTC opens provisional intake and how permissive its interim operating conditions are. Generous provisional terms make the two-year rule wait survivable; restrictive ones freeze the market the bill meant to open.
The first rulemaking calendar. Both agencies publish regulatory agendas; the first post-passage editions will reveal sequencing, whether certification procedures or exchange registration goes first, and the proposed-rule dates that mark the real countdown. Compare every date against the statute’s deadlines and against GENIUS’s slippage.
The commissioner math. Confirmation of CFTC commissioners is implementation policy by other means. A five-seat commission writes rules with durability; a one-seat commission writes rules a single resignation can orphan. The Senate fight over pairing nominations with the bill is, on this reading, the most underrated substantive dispute in the negotiation.
The first challenged certification. Whenever the machinery finally runs, the first SEC objection to a maturity certification becomes the test case that defines the regime, the way the first GBTC-era denials defined the ETF decade. The docket to watch will not exist for two years. It will then matter more than the vote everyone is watching this week.
Frequently asked questions
What actually changes the day CLARITY becomes law?
The self-executing provisions: tokens that anchored listed ETPs on January 1, 2026, including XRP, SOL, and DOGE, become non-securities by statute; non-custodial software developers exit the money-transmitter category under Section 604; and federal jurisdiction preempts conflicting state regimes for covered assets and activities. These operate by force of law without any agency action.
What does not change immediately?
Everything requiring construction: the self-certification process for blockchain maturity, registration of digital commodity exchanges, brokers, dealers, and custodians, the ancillary-asset disclosure regime, kiosk standards, and examination programs. Each exists only as statutory instruction until the SEC and CFTC complete rulemakings with proposals, comment periods, and final rules, a process realistically measured in years.
How long will the rulemakings take?
The best empirical guide is the GENIUS Act: its agencies missed the statute’s own one-year rulemaking deadline this month, with rules still in proposal stage. CLARITY’s workload is larger, split across two agencies, and includes harder definitional questions. A calibrated estimate puts core rules proposed within a year of passage and finalized in eighteen months to three years, with contested certifications and registrations litigated beyond that.
What is provisional registration and why does it matter?
A mechanism carried from the House framework letting existing firms operate under interim status while final rules are written. Its terms, how fast the intake opens, what conditions attach, decide whether the market functions during the rule-writing gap or freezes waiting for it. The generosity of provisional terms is arguably the most consequential implementation decision the CFTC will make.
Can the agencies handle the workload?
That is a live dispute inside the Senate negotiation itself. The CFTC, designated to oversee digital commodities, currently operates with a single confirmed commissioner, and demands to pair the bill with commissioner confirmations reflect implementation concerns, not procedural gamesmanship. The SEC is simultaneously running its own interim crypto framework. Both commissions’ members now serve at presidential pleasure, making rule durability partly an electoral question.
Is a version of this regime already operating?
Yes, without legislation. The SEC-CFTC joint interpretation names 16 assets as digital commodities and places staking, mining, and airdrops outside securities law, as explicitly interim policy. Markets already price much of CLARITY’s classification effect through this bridge. The statute’s added value is permanence: administrative interpretations are revocable by future commissions, while the grandfather clause’s statutory classification is not.
What does this mean for the assets the bill would classify?
The grandfathered tokens gain the bill’s full benefit instantly, settled non-security status, which supports listings, custody, and institutional allocation without waiting for rules. Newer tokens gain a defined path, but one that runs through the certification machinery, meaning their practical reclassification waits for procedures that do not yet exist. The distinction between the two classes is the implementation era’s most tradable fact.
How should investors read passage, if it comes?
As two events at different speeds: an immediate legal settlement for the grandfathered class and developers, and the start of a multi-year construction project for everything else. Expectations calibrated to the vote as a single catalyst will overshoot what changes in month one and undershoot what compounds by year three. The rulemaking calendar, provisional terms, and commissioner confirmations are the real post-passage tape. This is educational analysis, not investment or legal advice.
Disclaimer: This article is for information and educational purposes only and does not constitute financial, investment, or legal advice. It describes pending legislation and projected implementation processes that are uncertain and subject to change, and no legislative or regulatory outcome is guaranteed. Always do your own research. Information is accurate as of July 24, 2026.

Bitfinex has secured a Digital Asset Service Provider licence in El Salvador, completing a local regulatory structure covering spot trading, crypto derivatives and tokenized securities.
Summary
- Bitfinex now holds Salvadoran approvals spanning spot trading, derivatives and regulated tokenized securities services locally.
- CNAD registered two core Bitfinex entities in April, adding them to existing licensed operations there.
- El Salvador remains central to Bitfinex’s Latin American strategy for trading and tokenized capital markets.
The exchange announced the approval on May 12, after the National Commission of Digital Assets registered two Bitfinex-linked operating entities on April 23.
The new approval brings the core Bitfinex trading platform alongside Bitfinex Securities El Salvador and Bitfinex Derivatives El Salvador. Bitfinex said the structure gives the group a regulated presence across its main businesses in the country, although product access will still depend on customer eligibility, location and the platform’s terms.
Core Bitfinex platform joins regulated local entities
El Salvador’s CNAD public registry lists BFXNA El Salvador under registration PSAD-0082 and BFXWW El Salvador under PSAD-0083. Both registrations cover activities that include exchanging digital assets, operating trading platforms, transferring assets, custody, receiving client orders and executing trades in digital asset derivatives.
The registry entries were active before the company’s May public announcement, confirming the approval through CNAD’s database. Bitfinex described the licence as a deeper regulatory base for serving customers across Latin America.
“Holding licences across our spot, derivatives and securities businesses reflects our long-standing commitment to the country and to operating under proper and innovative supervision.” said Bitfinex’s chief technology officer Paolo Ardoino
The licence does not mean every Bitfinex product is available to every customer. The company’s notice states that U.S. persons and other prohibited users cannot open or operate accounts on its main platform. Local rules, onboarding checks and service restrictions also continue to apply.
Securities and derivatives approvals came earlier
Bitfinex Securities became the first platform approved under El Salvador’s Digital Assets Issuance Law. CNAD’s registry lists the securities entity under PSAD-0001, with a registration date of Oct. 24, 2023. The platform supports the issuance and trading of tokenized financial products, including debt, equity and fund-linked instruments.
As previously reported, Bitfinex Securities later launched a regulated tokenized U.S. Treasury product in El Salvador. The offering represented exposure to short-term Treasury bills and traded through the platform’s secondary market. Bitfinex also tested tokenized debt linked to a planned hotel project near the country’s international airport.
Bitfinex Derivatives followed with its own Digital Asset Service Provider approval in January 2025. The licensed entity became the regional base for the group’s derivatives activity. Crypto.news reported at the time that users continuing with the service had to accept revised terms tied to the Salvadoran operation.
El Salvador builds a wider digital asset market
El Salvador adopted its Digital Assets Issuance Law in 2023, creating a framework for token issuance, service providers and regulated trading venues. CNAD oversees the sector and maintains a public registry of approved operators, including exchanges, custodians, issuers and companies offering investment products based on digital assets.
Bitfinex said CNAD had licensed more than 70 digital asset service providers by the time of its May announcement. The registry also includes Binance, Bitget and other international firms. Those approvals cover separate entities and permitted activities, rather than one uniform licence for every crypto service.
The country has also expanded its rules beyond exchanges. El Salvador approved an investment banking framework allowing specialized institutions to offer Bitcoin and other digital asset services. The country has also explored tokenized small-business equity and cross-border regulatory projects.
Bitfinex links licence strategy to tokenized markets
Bitfinex has positioned El Salvador as a base for both trading and tokenized capital markets. Its securities business has worked on products linked to U.S. Treasuries, corporate financing and real-world assets. The group has also partnered with Tether-related infrastructure to study wider distribution and secondary-market liquidity for tokenized investments.
The latest licence gives the core exchange a local authorization alongside those existing businesses. It also allows Bitfinex to present one jurisdiction as covering three distinct lines: spot markets through the main platform, derivatives through its dedicated entity and securities through Bitfinex Securities.
However, the announcement did not provide local customer numbers, trading-volume targets or a timetable for new products. It also did not state whether operations will move from other jurisdictions to El Salvador. The immediate change concerns the regulated status of the core platform and its ability to offer approved services through registered local entities.
Bitfinex’s expansion comes as other crypto companies build operations in El Salvador. Tether announced plans in 2025 to establish its headquarters in the country after securing local approval, while Bitget obtained both Bitcoin and digital asset service licences.
The licence completes Bitfinex’s stated regulatory footprint in El Salvador, but continued operation will depend on CNAD supervision, customer checks and the rules attached to each entity. Future product launches will require separate disclosures and may carry additional eligibility limits.


Thailand’s Securities and Exchange Commission has filed a criminal complaint against crypto exchange Bitkub Online and two of its former directors, alleging they submitted false regulatory reports after a 2021 cyberattack that resulted in the loss of digital assets worth about 1.7 billion baht ($50 million).
Summary
- Thailand’s SEC has filed a criminal complaint against Bitkub and two former directors over alleged false reporting linked to its 2021 cyberattack.
- Bitkub said it delayed disclosing the hack to prevent a bank run and later replaced all stolen digital assets without customer losses.
- The case comes as Thailand continues expanding crypto regulations while increasing enforcement across the digital asset sector.
According to an announcement published by Thailand’s Securities and Exchange Commission (SEC) on Thursday, the complaint targets Bitkub Online, former directors Sakolkorn Sakavee and Thaweesap Rawan over information submitted in the exchange’s daily net liquid capital reports following the May 2021 hack.
The regulator alleged that the reports filed between May 10 and Oct. 30, 2021, did not accurately show the reduction in the exchange’s digital asset holdings after attackers stole 16 different cryptocurrencies. The SEC said the omission created the impression that customer assets remained intact and that the exchange had not suffered losses from the incident.
Authorities said the stolen assets were replaced by Oct. 31, 2021, but argued that the impact of the theft should have been reflected in the reports submitted during the period. The complaint accuses Bitkub and the two former directors of violating multiple provisions of Thailand’s digital asset regulations through the alleged false disclosures.
The SEC said the matter will now move through the country’s criminal investigation process before any decision on prosecution or court proceedings is made.
Bitkub disputes regulator’s allegations
Responding in a post on X, Bitkub said the case concerns decisions about when to disclose the wallet compromise rather than allegations of fraud or customer losses.
The exchange said it intentionally delayed announcing the incident because it wanted to prevent a potential bank run while it worked to recover from the theft. According to the company, its co-founders later purchased an equivalent amount of digital assets to replace the stolen funds, leaving customers and the company without financial losses.
Bitkub also said it has strengthened its governance framework, compliance procedures and security controls since the incident.
Founded in 2018, Bitkub has grown into Thailand’s largest cryptocurrency exchange. CoinGecko ranked the platform first among Thai exchanges by trust score, while its daily trading volume stood at about $712 million at the time of publication.
The complaint also comes as Bitkub continues to explore a public listing. The company confirmed in December 2025 that it was considering an initial public offering, including the possibility of listing in Hong Kong.
Cointelegraph said it contacted Bitkub for additional comment on the SEC complaint and the company’s IPO plans but had not received a response by the time the report was published.
Enforcement comes as Thailand expands crypto regulation
The enforcement action arrives as Thai authorities continue tightening oversight across different parts of the digital asset market.
Earlier this month, local outlet Thansettakij reported that the Bank of Thailand (BOT) and the SEC had begun examining high-value stablecoin transactions after identifying transfers that may have bypassed normal financial reporting requirements. According to the report, BOT Governor Vitai Ratanakorn said authorities were using data analytics tools to review large transactions, particularly involving Tether’s USDT, while assessing whether further regulatory action is required.
Beyond stablecoins, the report said regulators have also increased scrutiny of large cash deposits and withdrawals, gold trading and bank accounts linked to online gambling as part of anti-money laundering efforts.
At the same time, Thailand has continued moving ahead with policies designed to expand its regulated crypto market.
In February, the Thai government approved amendments recognizing cryptocurrencies as eligible underlying assets under the country’s Derivatives Trading Act, allowing regulated futures and options contracts to reference digital assets such as Bitcoin. Following the approval, the SEC was tasked with drafting detailed licensing rules and contract requirements for market participants.
The regulator later proposed easing licensing requirements for digital asset businesses by allowing firms to apply for derivatives licenses under a single corporate entity instead of establishing separate companies.
During the consultation process, SEC Secretary-General Pornanong Budsaratragoon said the proposal would support crypto as an investment asset class while giving investors access to additional regulated products under appropriate supervisory safeguards.
Crypto World
With the World Cup concluded, LONG DeFi cloud mining is now live; earn up to 50,000 USDT equivalent in BTC, XRP daily

Disclosure: This article does not represent investment advice. The content and materials featured on this page are for educational purposes only.
As XRP regains investor attention, cloud mining platforms like LONG DeFi are highlighting simplified access to digital asset participation and computing power.
Summary
- LongDeFi expands cloud mining services as renewed XRP interest drives demand for easier digital asset participation.
- LongDeFi highlights AI-powered cloud mining platform amid recovering crypto market and growing interest in BTC and XRP.
- LongDeFi promotes AI-driven cloud mining with newcomer rewards as XRP regains investor attention after World Cup.
As the World Cup concludes, the cryptocurrency market continues its recovery, with XRP once again becoming a focus of global investor attention.
With continued institutional investment and the ongoing development of the digital asset market, more and more investors are seeking more efficient and diversified asset allocation methods, hoping to capitalize on the long-term growth opportunities presented by mainstream digital assets such as BTC and XRP.

Under this trend, cloud mining computing power is gradually becoming a crucial infrastructure in the digital asset field. Compared to traditional models, it eliminates the need for equipment purchases and professional maintenance, allowing users to easily participate in the digital asset ecosystem and more conveniently plan for the future.
As a leading global cloud mining computing power platform, LongDeFi is committed to providing users with secure, stable, and efficient cloud mining services. The platform currently boasts:
- 150+ global cloud mining data centers
- Service coverage in 180+ countries and regions
- 5 million+ global registered users
- Enterprise-grade computing infrastructure and intelligent operation and maintenance system
LongDeFi utilizes a globally distributed computing network, green energy data centers, and a multi-layered security and risk control system to create a more stable, secure, and efficient cloud mining experience for users.
The new era of the digital economy has arrived, and AI, blockchain, and cloud mining are reshaping the global wealth landscape.
Join LongDeFi now! Register to receive a $17 newcomer reward, and earn up to 5% referral rewards by inviting friends. Join 5 million+ users worldwide to seize new opportunities in BTC and XRP digital assets!
How to get started with LongDeFi
The LongDeFi operation process is relatively simple:
Step 1: Register an Account
Step 2: Deposit Digital Assets
The platform supports mainstream digital assets such as BTC, ETH, USDT, XRP, SOL, DOGE, and LTC.
Step 3: Choose a Cloud Mining Plan
Choose a mining service that suits your needs. The minimum deposit is only $100. Once the system is configured, you can start mining.
Step 4: Automatically Receive Daily Rewards
The platform provides 24/7 intelligent mining services and automatically distributes daily rewards. Users can easily earn passive income without any manual operation.
For example:
Beginner: BTC [Smart Cloud Mining] $100 | Term: 2 days | Daily Earnings: $4 | Total Earnings: $100 + $8
Dogecoin [Digital Smart Cloud Mining System]: $500 | Term: 5 days | Daily Earnings: $6.25 | Total Earnings: $500 + $31.25
BTC [Supercomputing Cloud Mining System] $1000 | Term: 10 days | Daily Earnings: $13.1 | Total Earnings: $1000 + $131
Dogecoin [Hashrate Engine Cloud Mining System] $5000 | Term: 25 days | Daily Earnings: $72 | Total Earnings: $5000 + $1800
Bitcoin [Algorithm-Driven Cloud Mining System] $10000 | Term: 30 days | Daily Earnings: $158 | Total Earnings: $10000 + $4830
For contract details, visit the LONG DeFi website.
As the digital asset market continues to develop, more and more investors are focusing on long-term allocation and diversified participation methods. In addition to traditional cryptocurrency investment, cloud mining services have emerged, and platforms are constantly optimizing to provide users with more opportunities to participate in the digital asset ecosystem. Investing in digital assets has also become an option for some users to explore the digital asset ecosystem.
LongDeFi is committed to providing more convenient and secure cloud mining services and continuously optimizing the platform experience to provide users with better services.
Disclosure: This content is provided by a third party. Neither crypto.news nor the author of this article endorses any product mentioned on this page. Users should conduct their own research before taking any action related to the company.

The U.S. House of Representatives has passed a bill aimed at tightening trading rules for lawmakers by restricting their ability to buy publicly traded stocks. The legislation, dubbed the Stop Insider Trading Act, passed the chamber on a 232-198 vote on Wednesday and now moves to the Senate for consideration.
The sponsor, Republican Representative Bryan Steil of Wisconsin, argues the measure would reduce incentives to profit from nonpublic information. Speaking on the House floor after the vote, Steil said the bill would “ensure no lawmaker can profit off of insider information” and would introduce “strict penalties” for violations.
Key takeaways
- The House approved the Stop Insider Trading Act by a 232-198 vote, sending it to the Senate after Wednesday’s passage.
- Under the bill, members of Congress, along with their spouses and dependent children, would be prohibited from purchasing publicly traded stocks.
- Steil outlined penalties including fines equal to $2,000 or 10% of the transaction value, plus disgorgement of profits.
- Critics— including Senator Elizabeth Warren—argue the bill is insufficient because lawmakers could still keep and sell stocks they already own.
- The vote comes as Senate discussions continue over a separate crypto-focused bill, the Digital Asset Market Clarity Act, which addresses broader restrictions on public officials.
What the Stop Insider Trading Act would change
According to the bill’s sponsor, the Stop Insider Trading Act targets the core conflict that arises when public officials participate in markets while possessing information that is not available to the general public. In Steil’s remarks, he emphasized that the legislation is designed to block new stock purchases by lawmakers and their immediate family members.
Steil also described the enforcement approach for alleged violations. As he stated on the House floor, the bill includes a fine equal to $2,000 or 10% of the transaction, along with disgorgement of profits. He further indicated that violators could forfeit any gain realized if they fail to comply.
One operational feature highlighted by Steil is a notice requirement tied to pre-existing holdings. While the bill would prohibit stock purchases, Steil said members of Congress would have to give seven days’ notice before selling stocks they already own, a rule he presented as a deterrent against insider trading.
Where Democrats say the bill falls short
Even with the House’s approval, some Democrats argue the legislation does not fully solve the problem of conflicts of interest. The main critique is that the measure would not require lawmakers to divest current holdings, potentially leaving room for market-sensitive actions based on nonpublic developments.
Senator Elizabeth Warren said on Thursday that the bill contains “major loopholes.” In her view, because lawmakers could continue owning and selling stocks already held, it “won’t solve the problem,” and she said the approach is unlikely to gain traction in the Senate. Warren’s position, as summarized in her comments, is that members of Congress should not own, buy, or sell stocks at all.
How it compares with broader Senate ethics proposals
The Stop Insider Trading Act is narrower than other policy efforts currently discussed in Congress. Unlike the proposed text for the Digital Asset Market Clarity Act—a Senate consideration focusing on cryptocurrency market structure—Steil’s bill is limited to investment restrictions for members of Congress. It does not extend the same coverage to the president or vice president and their families.
In earlier coverage of the Digital Asset Market Clarity Act, the discussion has included restrictions on public officials’ token activity. As described in connection with that measure, it would bar U.S. public officials from issuing or sponsoring tokens until 2029.
For crypto investors and builders, the difference matters because it reflects how lawmakers are calibrating ethics and restrictions across sectors. While the insider trading bill targets traditional markets and elected officials’ stock activity, the parallel crypto legislation is framed around market structure and digital-asset involvement by officials. Observers will be watching whether ethics-style restrictions expand beyond stocks—or remain compartmentalized by policy area—as the Senate considers each track.
From Congress trading to prediction markets
The House vote on the Stop Insider Trading Act followed Steil’s sponsorship of related legislation aimed at trading behavior on prediction market platforms. As noted in earlier developments, Steil previously backed the Stop Lawmakers from Predicting Act, introduced in June to prevent certain public officials, their spouses, and children from “wagering on public policy issues and political outcomes.”
Prediction markets have drawn renewed attention after high-profile reports of individuals allegedly placing large bets tied to real-world political events. Cointelegraph previously covered an incident involving a soldier accused of placing more than $400,000 in bets on Kalshi and Polymarket outcomes related to Venezuela President Nicolás Maduro, who was removed by U.S. forces in January. Earlier reporting also described claims that Donald Trump’s teleprompter operator made more than $100,000 in bets on Kalshi event contracts connected to phrases used in the president’s speeches.
Steil’s prediction-market legislation proposed a penalty structure similar to the stock trading proposal: violators would pay a $2,000 fee or 10% of the value of prohibited bets placed on the platforms. The similarity suggests a consistent legislative framework in Steil’s approach—using fines and disgorgement mechanics to reduce incentives for wagering or trading based on privileged information.
What happens next in the Senate
With the Stop Insider Trading Act now in the Senate, the immediate question is whether lawmakers will narrow the enforcement focus or widen the restrictions to address the objections raised by critics. For readers following the intersection of governance and markets—whether traditional equities or crypto-related policy—attention should shift to whether the Senate modifies the House bill to limit not only new purchases, but also ownership and sales of existing holdings.

The European Union has placed Justin Sun-linked HTX among 18 crypto companies accused of helping Russian users evade financial sanctions.
Summary
- EU lists Justin Sun-linked HTX among crypto firms accused of helping Russians evade sanctions.
- HTX faces transaction restrictions, but the EU action does not include an asset freeze.
- Separate rules will restrict Belarusian ownership of MiCA-regulated crypto firms from Aug. 25.
According to Reuters, the EU published the list on Friday after adopting its latest restrictions on Thursday, adding another regulatory challenge for one of the world’s largest crypto exchanges.
HTX, formerly known as Huobi, did not immediately respond to Reuters’ request for comment on the EU action. The exchange was founded in China in 2013, while Sun acquired a controlling stake in 2022, although the company describes the Tron founder as an adviser.
EU authorities included the crypto companies in the bloc’s 21st sanctions package against Russia over the war in Ukraine. The measures cover banks, crypto networks, oil traders, energy revenue channels and vessels suspected of operating within Russia’s shadow fleet.
While Reuters reported that 18 companies offering crypto services appeared on the published list, the Council of the European Union separately said it had extended transaction restrictions to 14 crypto-related platforms. Those services operate from Georgia, Panama, the United Arab Emirates, the Marshall Islands, Kyrgyzstan and Belarus.
The difference relates to how the measures count companies and the platforms they operate. According to the Council, the 14 services were targeted because EU authorities linked them to financial channels used by Russia to bypass existing restrictions.
HTX faces transaction limits rather than an EU asset freeze
Unlike a full sanctions designation, the EU measure against HTX does not require the exchange’s assets to be frozen, Reuters reported. The restriction instead places HTX within the group of crypto businesses covered by the package’s transaction controls.
For the first time, the package also gives the EU a mechanism to prohibit dealings with crypto providers in third countries when authorities determine that those services are helping Russia evade sanctions. The Council described the tool as a deterrent for jurisdictions hosting such platforms.
HTX had already faced sanctions in the United Kingdom. On May 26, British authorities targeted Huobi Global S.A., the Panama-based company behind HTX, over alleged financial services involving A7 and Garantex, two entities previously sanctioned over their links to Russia.
The UK Foreign Office alleged that HTX provided services to A7, a payments network backed by Russian state-controlled Promsvyazbank, and Moscow-based crypto exchange Garantex. British restrictions included an asset freeze and barred UK companies from processing payments or maintaining financial relationships with the designated entities.
Responding to the UK action, an HTX spokesperson rejected suggestions that the exchange disregarded regulatory requirements.
“Regulatory compliance remains our absolute top priority at HTX. We proactively monitor and strictly adhere to regulatory frameworks in all jurisdictions where we operate globally, including the UK,” the spokesperson told Reuters.
The exchange has not issued a corresponding response to the EU restrictions. Its earlier statement addressed only the British allegations and did not comment on the findings behind the EU package.
Beyond crypto, the Council imposed asset freezes and funding restrictions on 94 banks and major financial institutions. Transaction bans were also extended to another 33 Russian credit and financial institutions, one Kyrgyz bank connected to Russia’s System for Transfer of Financial Messages and three other non-Russian banks accused of helping circumvent sanctions.
EU crypto controls now reach ownership and management
Adopted on July 23, the package contains 218 individual listings, including 48 people and 170 entities. The Council called it the bloc’s largest batch of new listings in four years, spanning financial services, energy companies, military suppliers and organizations accused of supporting sanctions evasion.
EU High Representative Kaja Kallas stated that the measures cover more than 100 banks and crypto operators, over 40 vessels tied to Russia’s shadow fleet and several refineries in Russia and Belarus. More than 50 listings involve Russia’s military-industrial sector, including businesses connected to long-range drone production, according to Kallas.
Separate restrictions adopted through Council Decision (CFSP) 2026/1847 will also affect Belarusian participation in the EU crypto industry. Beginning Aug. 25, Belarusian nationals and residents will be prohibited from owning, controlling or managing crypto-asset service providers regulated under the Markets in Crypto-Assets framework.
Previous restrictions focused on companies offering crypto wallets, accounts and custody services. The amended rules expand the ban to every service category defined under MiCA, including operating trading platforms, exchanging crypto assets, executing client orders, processing transfers, placing tokens, providing investment advice and managing portfolios.
The Belarus measure entered into force on July 24, one day after its adoption, although the crypto ownership and management provisions have a one-month implementation period. It follows the end of MiCA’s transition window on July 1, after which unauthorized crypto firms were required to stop operating or face enforcement measures.
Together, the two decisions place foreign crypto platforms and ownership roles inside regulated EU firms under separate sanctions controls. HTX now faces transaction restrictions connected to alleged Russian activity, while Belarusian nationals and residents will encounter direct limits on their participation in MiCA-authorized businesses.


Odos Protocol has announced plans to shut down its decentralized exchange aggregator, giving users until July 30 to withdraw assets from the platform.
Summary
- Odos Protocol will shut down its DEX aggregator and has asked users to withdraw assets by July 30.
- The project said the Odos DAO will announce its own plans separately, while the ODOS token will continue to exist onchain.
- The closure follows a sharp decline in protocol trading volume and comes as several crypto platforms have announced shutdowns this year.
According to a Thursday announcement posted on X, the project will discontinue operations and has asked users to remove funds before the deadline. The team did not disclose why it decided to wind down the service.
Users have until July 30 to complete withdrawals before the platform ceases operations. The announcement did not indicate whether any extension would be offered or whether services would remain available after the deadline.
At the same time, the team clarified that the Odos DAO operates independently from the company behind the protocol. It said the DAO will communicate its own plans separately, while adding that the ODOS token will continue to exist onchain despite the shutdown of the operating business.
No changes to the token’s functionality, supply, or governance were announced alongside the closure notice. The statement also did not mention any security incident, regulatory issue, funding challenge, or acquisition connected to the decision.
Trading activity had fallen sharply since late 2024
The shutdown follows a prolonged decline in activity on the protocol over the past two years.
Data from DefiLlama shows Odos recorded approximately $169 million in DEX aggregator trading volume during July 2026. That compares with a monthly peak of roughly $7.8 billion reached in December 2024, when decentralized trading activity across multiple networks was considerably higher.
DefiLlama data also estimates the protocol generates about $2.72 million in annualized revenue. While the figures illustrate how activity has changed over time, the Odos team did not attribute the shutdown to declining trading volume or revenue.
Instead, the project’s public announcement remained limited to operational details, user withdrawal instructions, and clarification regarding the separation between the operating company and the Odos DAO.
Existing users have therefore been encouraged to focus on withdrawing assets before the July 30 deadline. The announcement did not mention any modifications to the withdrawal process or identify assets that would be affected differently during the wind-down.
DAO and token remain separate from the operating company
Although the protocol’s operating business is shutting down, the announcement distinguished it from the decentralized governance structure.
According to the team, the Odos DAO will announce its own next steps independently. No timetable was provided for those announcements, and the DAO has not yet disclosed whether governance activities, treasury management, or future ecosystem initiatives will change after the operating company closes.
Similarly, the ODOS token was not included in the shutdown plans beyond confirmation that it will continue to exist onchain. The announcement did not describe any migration, token swap, redemption program, or governance proposal associated with the closure.
For token holders, that means the shutdown currently applies to the operating company rather than automatically affecting the token itself.
More crypto platforms have announced closures in 2026
Odos joins a growing list of crypto companies and decentralized finance projects that have announced plans to wind down operations this year, although the reasons behind those decisions have varied considerably.
Earlier on Thursday, derivatives exchange BitMEX said it would cease operations after 11 years in business. The exchange outlined a phased shutdown process, with customer services being retired according to a scheduled timeline.
Security incidents have also forced several projects to discontinue operations. For instance, in June, crypto payments platform Pyra announced it would shut down after concluding it could not establish a sustainable path forward following losses tied to the Drift exploit.
The company immediately stopped accepting new customers, canceled all payment cards, and introduced a transition plan that allows existing users to withdraw balances and export private keys through a dedicated web portal until Sept. 15, 2026. Pyra also said it intends to distribute any future Drift recovery tokens to eligible users if those tokens become available.
Meanwhile, in May, Carrot protocol said it would discontinue operations after liquidity providers withdrew significant capital following the Drift exploit. The protocol explained that the resulting collapse in total value locked left it unable to continue operating despite efforts to recover. Users were provided time to withdraw remaining assets before services were fully retired.
Odos has not linked its own decision to either category. The project’s announcement did not identify declining activity, market conditions, funding constraints, security breaches, or technical problems as reasons for discontinuing operations.
For now, the only date provided by the project is July 30, when users are expected to complete withdrawals before the operating platform shuts down. The team has said the DAO will provide separate updates regarding its future plans.
Tether (USDT) walked away from Europe rather than follow its stablecoin rules. Now a top Circle executive has an idea that could bring it back.
The idea is called equivalence. It lets the EU accept the home rules a company already follows, with no separate EU coin needed.
Why Most Stablecoins Skip Europe
MiCA is the EU’s rulebook for crypto. Its stablecoin rules reached their final deadline on July 1.
The rulebook has one big gap. It gives the EU no way to accept a foreign issuer’s home rules.
So any firm that wants EU users must first set up a licensed EU company. Patrick Hansen, Circle’s head of EU policy, calls that the hard way in.
By his estimate, about 99% of stablecoins are made outside the EU. That leaves the rules covering just a sliver of the market.

“Equivalence is emerging as a compelling alternative to the multi-issuance model, currently the only possible regulatory pathway for these global stablecoins under MiCA,” Hansen stated.
Follow us on X to get the latest news as it happens
How this Could Bring Tether Back
Tether is the largest stablecoin. Its live market value is about $184 billion. MiCA tells big issuers to hold at least 60% of their backing in banks. Tether keeps most of its money in US government debt. So it let USDT get dropped by EU exchanges rather than change.
Equivalence would flip that. The EU could accept Tether’s home rules instead. USDT could then return with no separate EU coin.
But whose home rules? Tether is now based in El Salvador. It has not cleared the new US stablecoin law. It even built a separate US coin instead of changing USDT. A quick return looks unlikely.
USD Coin (USDC) took the other path. It won a French license in 2024 and stayed. Circle is already inside MiCA, so the change would help its rivals more than itself.
An Old Tool for a New Problem
Equivalence is not new. The EU already accepts foreign rules in insurance, banking, and other areas.
It cleared the UK’s clearing houses this way in January 2025. It has just never done it for stablecoins.
That would mean changing MiCA. The best chance is the review the EU opened in May 2026.
The politics are hard. Most big stablecoins are tied to the US dollar, and the EU is wary. Its central bank is even testing a digital euro.
For now, the door stays shut. The review will show if the EU wants to open it.
The post Circle Pushes a MiCA Fix That Could Bring Tether Back to Europe appeared first on BeInCrypto.
S&P Global will release the July flash Purchasing Managers’ Indices (PMIs) for the United States (US) on Friday. These surveys of top private-sector executives are seen as an early indicator of the country’s economic health.
Market participants anticipate the S&P Global Services PMI to decline slightly to 51.0 from 51.2 in June, while the S&P Global Manufacturing PMI is expected to edge higher to 54.5 from 53.9, with both prints remaining in the expansion territory above 50. In addition to headline PMI figures, the surveys also include comments on employment and input inflation, which could influence the US Dollar’s (USD) valuation.
What Can We Expect from the Next S&P Global PMI Report?
While PMI surveys are forecast to reaffirm healthy business conditions in the private sector, details surrounding input costs could ramp up market volatility. Although the softer-than-expected June inflation data from the US eased bets for a Federal Reserve (Fed) interest rate hike in July, the recent increase in Oil prices caused investors to refrain from pricing in a prolonged policy hold.
With the US and Iran ramping up military aggression in the Middle East, the barrel of West Texas Intermediate (WTI) is up nearly 30% in July. In the meantime, the CME FedWatch Tool shows that markets are pricing in a nearly 80% probability of an at least 25 basis points (bps) Fed rate hike by September.

Previewing the PMI data, “we expect both the S&P manufacturing and services PMIs to improve in July. Manufacturing is likely to rebound to 54.5, in line with strong regional surveys in the month (Empire and Philly Fed),” TD Securities analysts said.
“Meanwhile, services is likely to continue improving to 51.5. NY Fed services improved in July, and we expect S&P to begin catching up to ISM,” they added.
When will the June Flash US S&P Global PMIs be Released and How Could They Affect EUR/USD?
The S&P Global Manufacturing, Services, and Composite PMIs reports will be released at 13:45 GMT on Friday. As previously noted, they are expected to show that US business activity continued to expand in July.
In case the publication suggests that business owners are facing increasing input costs in July and considering transferring those costs to customers by raising prices, markets could see that as a sign of inflationary pressures resurfacing again in July. In this scenario, the USD could continue to gather strength heading into the weekend and weigh on EUR/USD.
Conversely, an unexpected drop into the contraction territory below 50, in either the headline Manufacturing or the Services PMI, could hurt the USD with the immediate reaction and help EUR/USD hold its ground.
Middle East tensions risk being underplayed in early July PMI signals
Analysts at Rabobank caution that the initial July PMI signals may not fully capture the latest geopolitical and commodity-market developments.
They argue that “this preliminary reading may understate the impact of the escalation in the Middle East,” noting that “the July poll was probably conducted in the past two weeks, so the results may be skewed if many respondents replied early – and therefore could not fully factor in the current situation in the Middle East, or this week’s increase in oil prices.”
Eren Sengezer, European Session Lead Analyst, shares a brief technical outlook for EUR/USD:
“EUR/USD trades below the 20-day Simple Moving Average (SMA) following multiple failed attempts to clear that level earlier in the week. Additionally, the Relative Strength Index (RSI) indicator on the daily chart stays near 40, reaffirming the bearish stance.”

“On the downside, 1.1370-1.1350 (Bollinger Band lower arm, static level) aligns as the first support area ahead of 1.1270 (static level) and 1.1160 (static level). Looking north, the immediate resistance level could be spotted at 1.1420 (20-day SMA), followed by 1.1470 (Bollinger Band upper arm) and 1.1570 (100-day SMA).”
The post US S&P Global PMI expected to show steady business growth in July appeared first on BeInCrypto.


World Foundation has raised $52.5 million through a strategic WLD token sale as it accelerates the rollout of its World ID identity network, with all purchased tokens locked for one year.
Summary
- World Foundation raised $52.5 million through a strategic WLD token sale to expand its World ID identity network, with all purchased tokens locked for one year.
- The nonprofit said the funding will support enterprise adoption of World ID as more than 39 million users have joined the network and over 18 million have completed Orb verification.
- The fundraising comes as World continues to expand globally while facing ongoing regulatory scrutiny and fresh attention on WLD ownership concentration following Grayscale’s ETF filing.
World Foundation announced on Friday that it completed the first close of a strategic WLD token sale, raising $52.5 million from a group of crypto-focused investors to support the expansion of its proof-of-human infrastructure. The nonprofit said every WLD token sold in the transaction will remain locked for one year.
Pantera Capital led the first close of the fundraising, while Bain Capital Crypto, WLD treasury company Eightco Holdings (Nasdaq: ORBS), Selini Capital, Susquehanna Crypto and several other investors also participated. Although the foundation described the fundraising as the “first close,” it did not confirm whether additional rounds are planned. A spokesperson declined to comment when asked whether more token sales would follow.
Unlike an equity financing, the foundation said the WLD purchased in the transaction is intended solely for use within the World Network ecosystem. According to the organization, the tokens do not provide ownership in Tools for Humanity, the company responsible for developing the project’s software and hardware, nor do they grant rights to profits or investment returns.
Fresh capital from the fundraising will be directed toward expanding World ID for enterprises, consumers and AI agents across international markets, the foundation said. The announcement comes as the organization says it is entering a new phase focused on increasing real-world use of its identity network after spending the past three years building the protocol.
World shifts focus toward enterprise adoption
As artificial intelligence systems become more capable, World Foundation said demand is rising for technology that can distinguish real people from automated agents online.
World allows users to verify they are unique humans by completing a one-time Orb scan, which generates a World ID without revealing their identity. According to the foundation, users keep their World ID on their own devices, while the verification process relies on advanced cryptography and anonymized multi-party computation that has been open-sourced to protect privacy.
Pantera Capital General Partner Cosmo Jiang said the acceleration of AI development has increased the need for proof-of-human technology as more businesses look for ways to verify online identities. He added that the investment firm continues to support World’s long-term mission as enterprise adoption grows.
Alongside the fundraising announcement, the foundation pointed to the release of World ID 4.0, which it said is designed for enterprise-scale deployments. The latest version enables developers to build additional identity credentials using zero-knowledge proofs while integrating them into the broader World ID framework.
According to the organization, World ID has already been integrated with services including Zoom, DocuSign, Okta, Vercel and Tinder. The foundation also said more than 39 million people have joined World Network, while over 18 million users have completed Orb verification. Since launch, the network has processed more than 475 million World ID proofs, which are generated whenever users verify their identity while accessing supported applications or services.
The organization also said applications ranging from digital advertising and online dating to voting platforms, creative marketplaces and video communication services could face increasing challenges from AI-generated content, synthetic identities and deepfakes without proof-of-human infrastructure.
Funding extends earlier capital raises
The latest financing follows another major fundraising completed earlier this year.
In May, World Foundation raised $135 million through a strategic WLD sale led by Andreessen Horowitz and Bain Capital Crypto. At the time, the foundation said the proceeds would expand the World ID ecosystem, while investors purchased WLD tokens at market value. Following that announcement, WLD climbed roughly 10% in a day as trading volumes and derivatives activity increased sharply.
Including the latest fundraising, World Foundation and its related entities have now raised approximately $200 million through WLD token sales, according to the organization. Separately, Tools for Humanity has secured around $240 million in venture equity funding. Combined, the World ecosystem has raised roughly $492.5 million to date.
Expansion continues alongside regulatory and governance scrutiny
While the network has continued to grow, regulatory scrutiny has remained a recurring challenge for the project.
Authorities in Spain, Kenya, Brazil, Indonesia, South Korea, Hong Kong and the Philippines have investigated, restricted, suspended or fined parts of World’s biometric identity verification operations over concerns involving privacy, user consent and data protection. The foundation said it continues engaging with regulators as the network expands into additional markets.
At the same time, governance and token ownership have also drawn attention following recent regulatory filings.
A registration statement submitted by Grayscale for its proposed spot Worldcoin ETF disclosed that the 100 largest wallets controlled about 90% of WLD’s circulating supply at the time of filing. The asset manager presented the ownership concentration as a material risk for prospective investors while also stating that governance of the network continues to be substantially influenced by the World Foundation.
Grayscale’s filing also noted that World Chain currently relies on a centralized sequencer, while upgrade authority remains shared among entities associated with the World Foundation, Tools for Humanity and Optimism. The filing further said Orb devices continue to be manufactured and distributed primarily under the direction of Tools for Humanity.
The ETF proposal followed Nasdaq’s filing to list the proposed Grayscale Worldcoin ETF under the ticker GWLD. If approved by U.S. regulators, the trust would hold WLD directly and provide investors with exposure to the token through traditional brokerage accounts instead of requiring direct custody.
Errol Spence reveals why he didn’t face Terence Crawford again despite activating rematch clause

Lockheed Martin Unveils Morfius X-Rotor: Reusable High-Power Microwave Drone Neutralizes 50 UAVs per Flight

York council leader on Government plans for new home tax


-
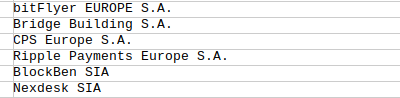
 Crypto World7 days ago
Ripple Payments Joins MiCA With 14 Firms, Does It Mean Anything For XRP?
-

 Politics7 days ago
The House | The City of London can help the new chancellor deliver growth in every postcode
-

 Fashion7 hours ago
Weekend Open Thread: Brooks Brothers
-

 Politics5 days ago
Democrats look to World Cup watch parties to register thousands of voters
-

 Crypto World4 days ago
Grayscale Files For Worldcoin ETF, WLD Registers Sharp Rise
-
 Tech4 days ago
Sail Virtually Aboard The “Itanic” With IA-64 Emulator
-

 NewsBeat5 days ago
Unregistered fitter used Gas Safe logo on business flyers
-
 Tech4 days ago
Turtle Beach Command Series KB7 review: a nifty screen-equipped gaming keyboard
-
 Business3 days ago
New Jersey voter registration controversy explained: How 6,600 noncitizens got on the rolls, and what happens next
-

 News Videos5 days ago
Big Money Is Entering XRP
-

 Crypto World7 days ago
Kaspersky exposes OkoBot’s 20-module crypto wallet attack
-
 Entertainment3 days ago
Johnny Depp’s R-Rated Gothic Cult Classic Gets New Release Ahead of Sydney Sweeney Remake
-

 NewsBeat7 days ago
Durham County Council to send out electoral registration emails
-

 Crypto World7 days ago
MiCA Licensing Faces Delays as ESMA Adds 14 CASPs to Register
-

 Crypto World2 days ago
Ethics, other provisions in crypto Clarity Act to be further discussed
-

 Crypto World7 days ago
Chip Stocks Enter Bear Market After Moonshot Ai Unveils Kimi K3 Model
-
 NewsBeat4 days ago
Shanghai science forum photos show China’s AI and robotics advances in rivalry with US
-

 Tech4 days ago
Watch Flock Safety CEO Garrett Langley discuss the future of surveillance at TechCrunch Disrupt 2026
-
 Crypto World5 days ago
Circle’s President Sold Over 360,000 Shares, The Filings Explain Why
-

 Tech5 days ago
Subway Sandwich Computers Get a Second Life as Gaming Machines
You must be logged in to post a comment Login