Crypto World
Ethereum Price Analysis: $220M Short Squeeze Drives ETH Rally Amid Rising Volatility

TLDR
- Ethereum touched $2,150 this week before encountering resistance across several technical indicators
- The $2,100 level represents a critical threshold, matching the realized price for wallets containing 100,000+ ETH
- The 30-day realized volatility for ETH approaches 0.97, marking the highest point since March 2025
- Liquidations of short positions exceeded $220M across 48 hours, while funding rates shifted into positive territory
- ETF outflow pressure shows signs of weakening, although definitive accumulation trends remain absent
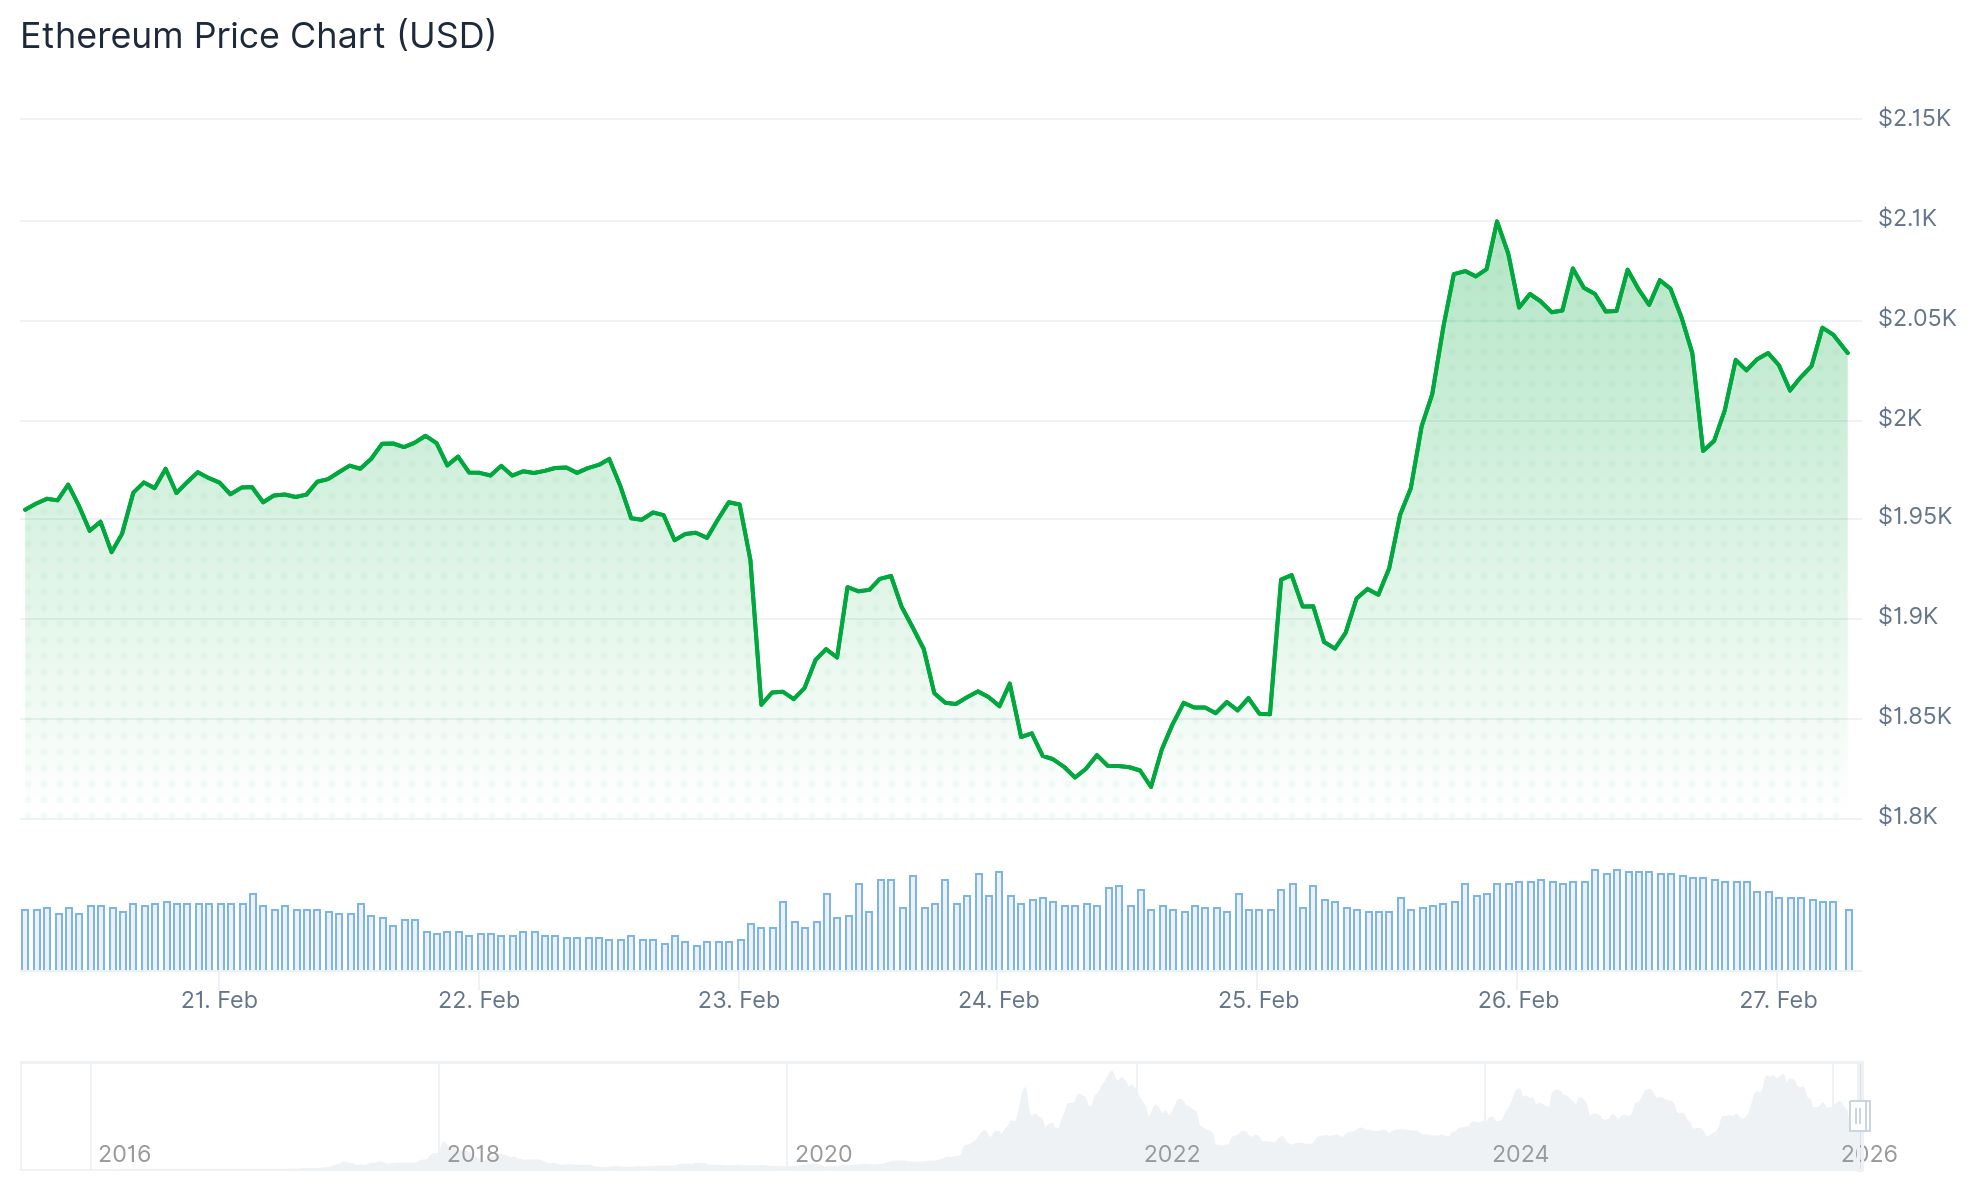
Ethereum surged to $2,150 during Thursday’s trading session before experiencing a retracement. The cryptocurrency continues navigating a narrow trading corridor, with $2,000 serving as crucial support and $2,100 emerging as the next significant barrier.

Closing above $2,100 on the daily timeframe carries particular significance as this price point corresponds to the realized price for addresses holding 100,000 ETH or greater. The realized price metric represents the average acquisition cost based on the last on-chain movement, providing insight into whether major stakeholders maintain profitable positions.
Historical data from 2020 onward reveals ETH has rarely traded beneath this whale cohort’s cost basis, with the most notable exception occurring throughout 2022’s bear cycle. Previous tests of this threshold have typically preceded price recoveries.
Futures and Funding Rates
The derivatives market witnessed short position liquidations exceeding $220 million during the previous 48-hour period, eliminating substantial leveraged positions. Binance funding rates, which plunged deeply negative in early May as bearish positions accumulated, have reversed course to reach positive 0.23%.
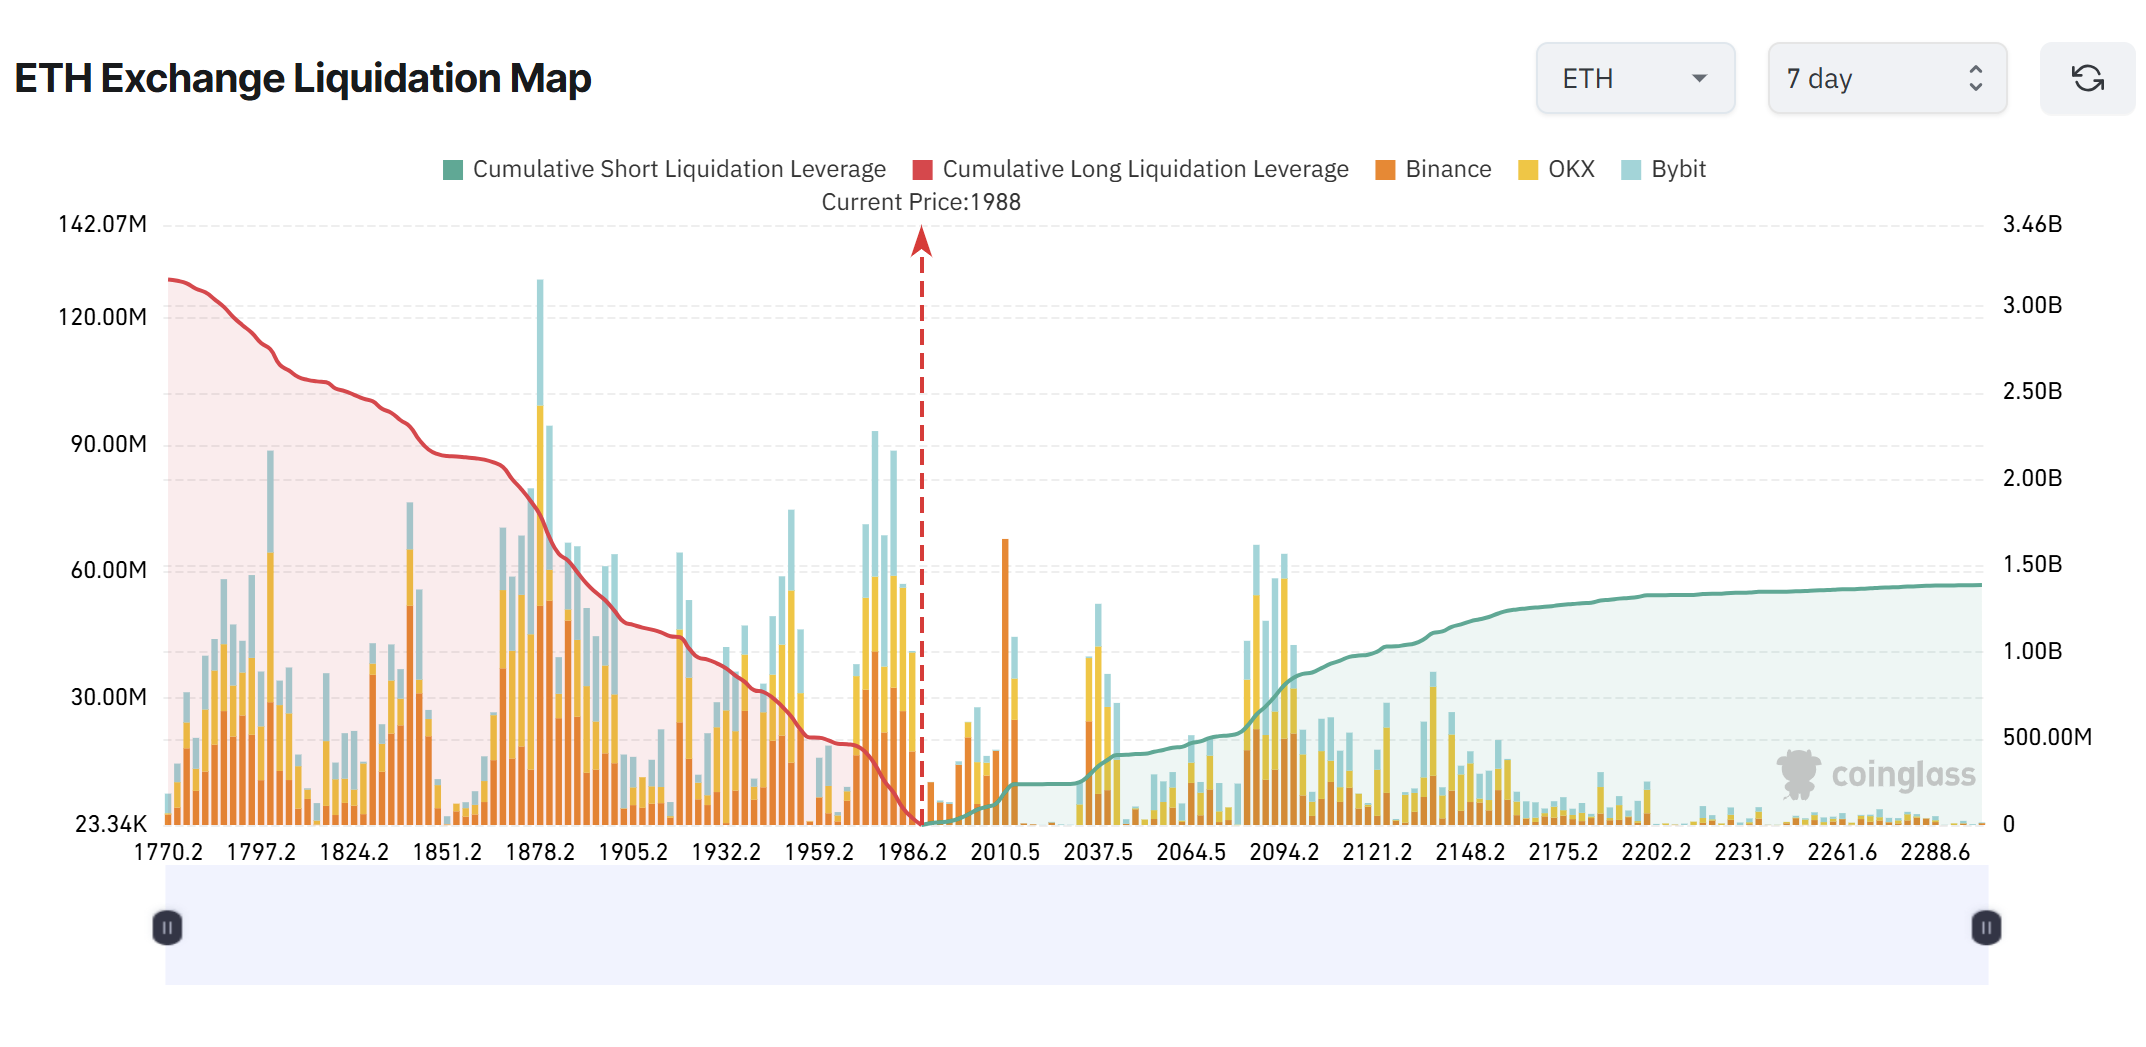

This reversal indicates that traders who opened shorts late in the cycle faced forced liquidations. Nevertheless, with funding rates now trading at elevated positive levels, the market structure favors long positions, creating potential vulnerability for a long squeeze toward $1,800 should upward momentum weaken.
Approximately $2.66 billion in long position liquidation exposure clusters around the $1,800 price zone, establishing a substantial liquidity pocket beneath current trading levels.
Volatility and ETF Flows
Ethereum’s 30-day realized volatility measured on Binance has climbed to approximately 0.97, representing the highest measurement recorded since March 2025. Heightened volatility during this phase may indicate market uncertainty and directional indecision rather than establishing a clear trend.
Price action continues trading beneath the 50-day, 100-day, and 200-day moving averages. Following the rejection near $4,800 in late 2025, each subsequent recovery attempt has established lower peaks, suggesting persistent distribution pressure.
Regarding ETF activity, selling pressure appears to be diminishing. Following substantial outflows throughout mid-2025, recent flow statistics indicate reduced movement in either direction. Institutional distribution seems to be decelerating, although convincing accumulation signals have yet to materialize.
Market analyst Leon Waidmann observed that retail participants with low conviction have predominantly exited their positions. Short interest continues declining, while highly leveraged long positions have been slow to establish meaningful presence.
Technical strategist IncomeSharks identified three overhead resistance zones, including multiple SuperTrend rejections and channel resistance positioned near $2,250. The analyst additionally highlighted April’s lows around $1,500 as a critical downside level should demand weaken once more.
At press time, ETH was changing hands at $2,034.

