

Crypto World
Ethereum Price Analysis: $220M Short Squeeze Drives ETH Rally Amid Rising Volatility

TLDR
- Ethereum touched $2,150 this week before encountering resistance across several technical indicators
- The $2,100 level represents a critical threshold, matching the realized price for wallets containing 100,000+ ETH
- The 30-day realized volatility for ETH approaches 0.97, marking the highest point since March 2025
- Liquidations of short positions exceeded $220M across 48 hours, while funding rates shifted into positive territory
- ETF outflow pressure shows signs of weakening, although definitive accumulation trends remain absent
Ethereum surged to $2,150 during Thursday’s trading session before experiencing a retracement. The cryptocurrency continues navigating a narrow trading corridor, with $2,000 serving as crucial support and $2,100 emerging as the next significant barrier.
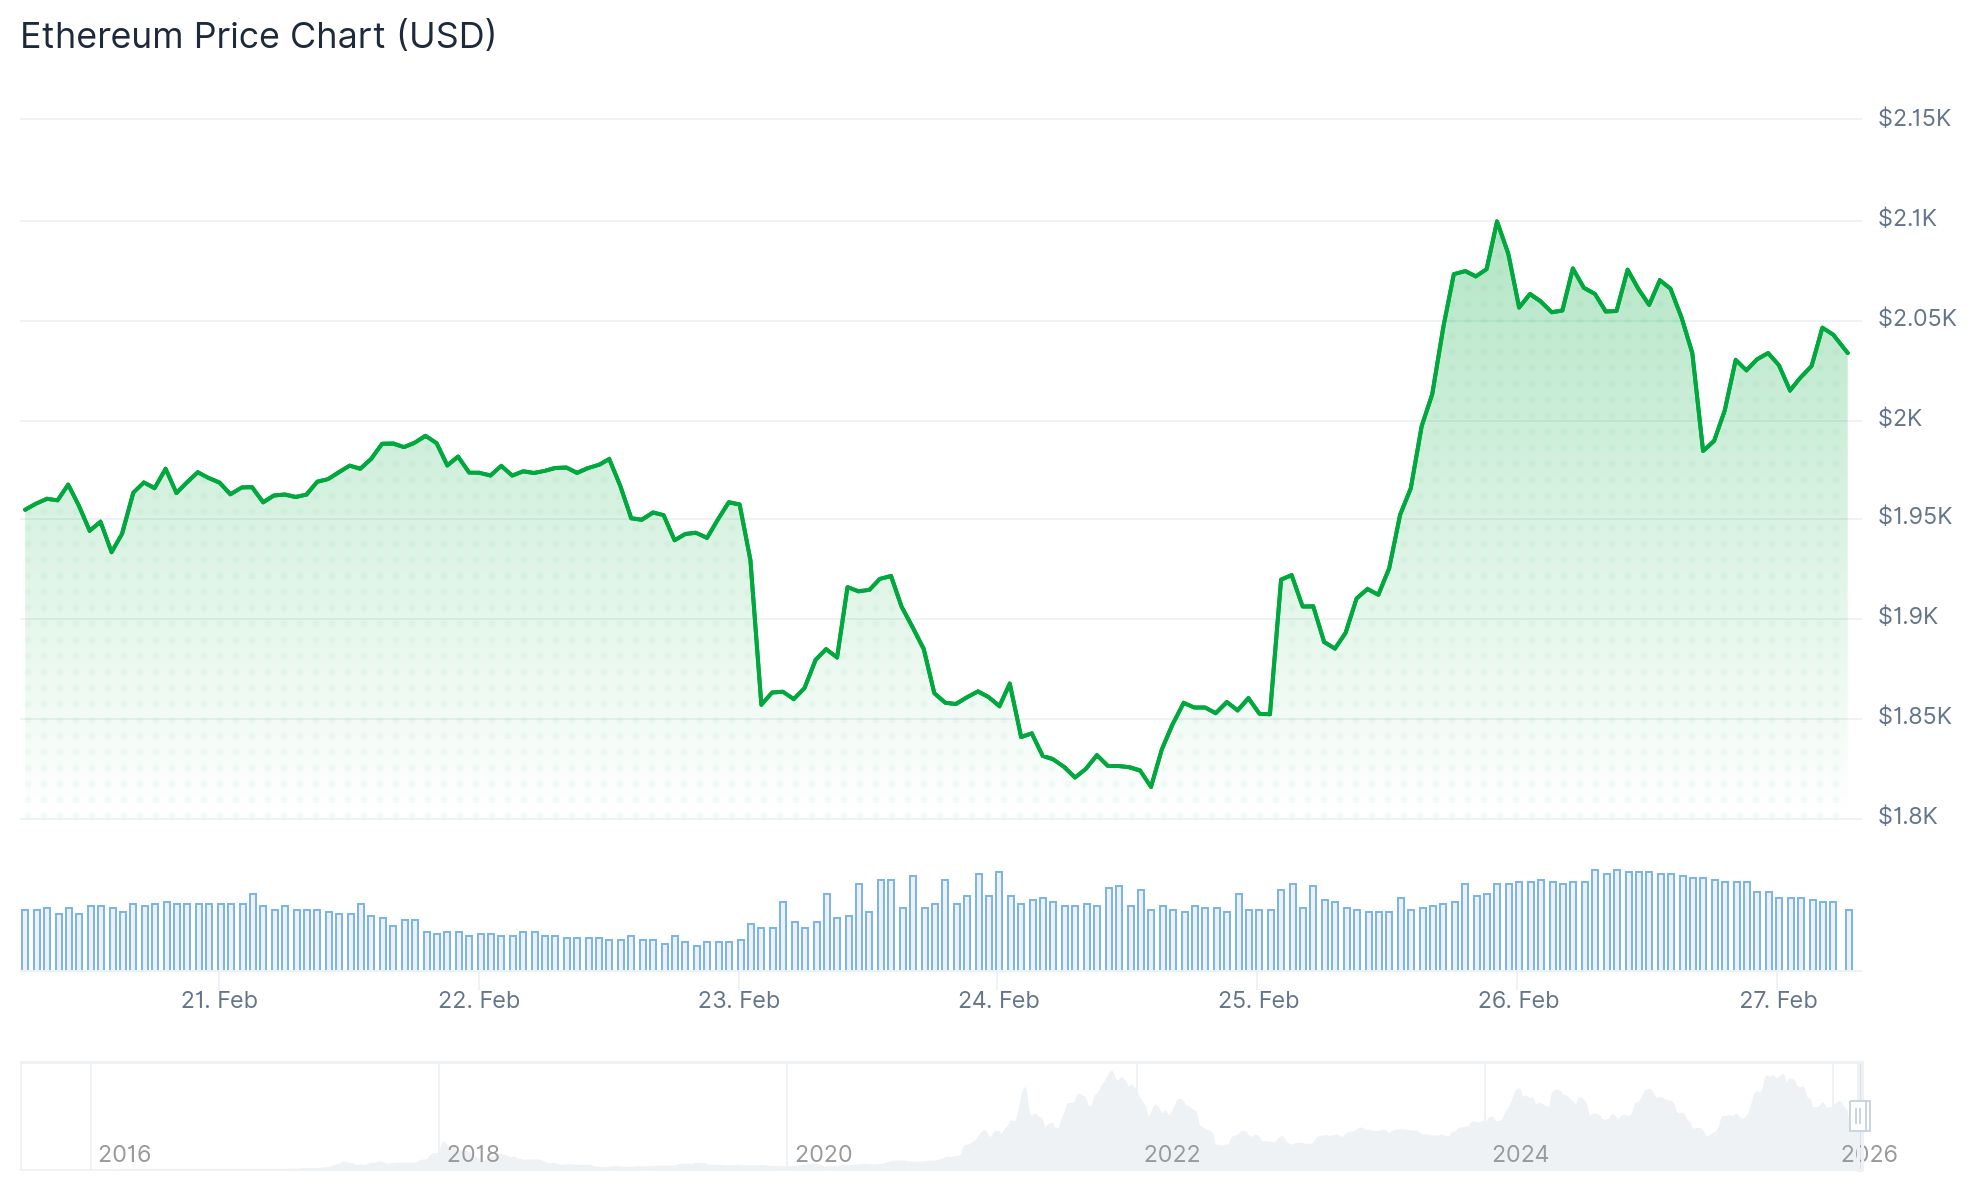
Closing above $2,100 on the daily timeframe carries particular significance as this price point corresponds to the realized price for addresses holding 100,000 ETH or greater. The realized price metric represents the average acquisition cost based on the last on-chain movement, providing insight into whether major stakeholders maintain profitable positions.
Historical data from 2020 onward reveals ETH has rarely traded beneath this whale cohort’s cost basis, with the most notable exception occurring throughout 2022’s bear cycle. Previous tests of this threshold have typically preceded price recoveries.
Futures and Funding Rates
The derivatives market witnessed short position liquidations exceeding $220 million during the previous 48-hour period, eliminating substantial leveraged positions. Binance funding rates, which plunged deeply negative in early May as bearish positions accumulated, have reversed course to reach positive 0.23%.
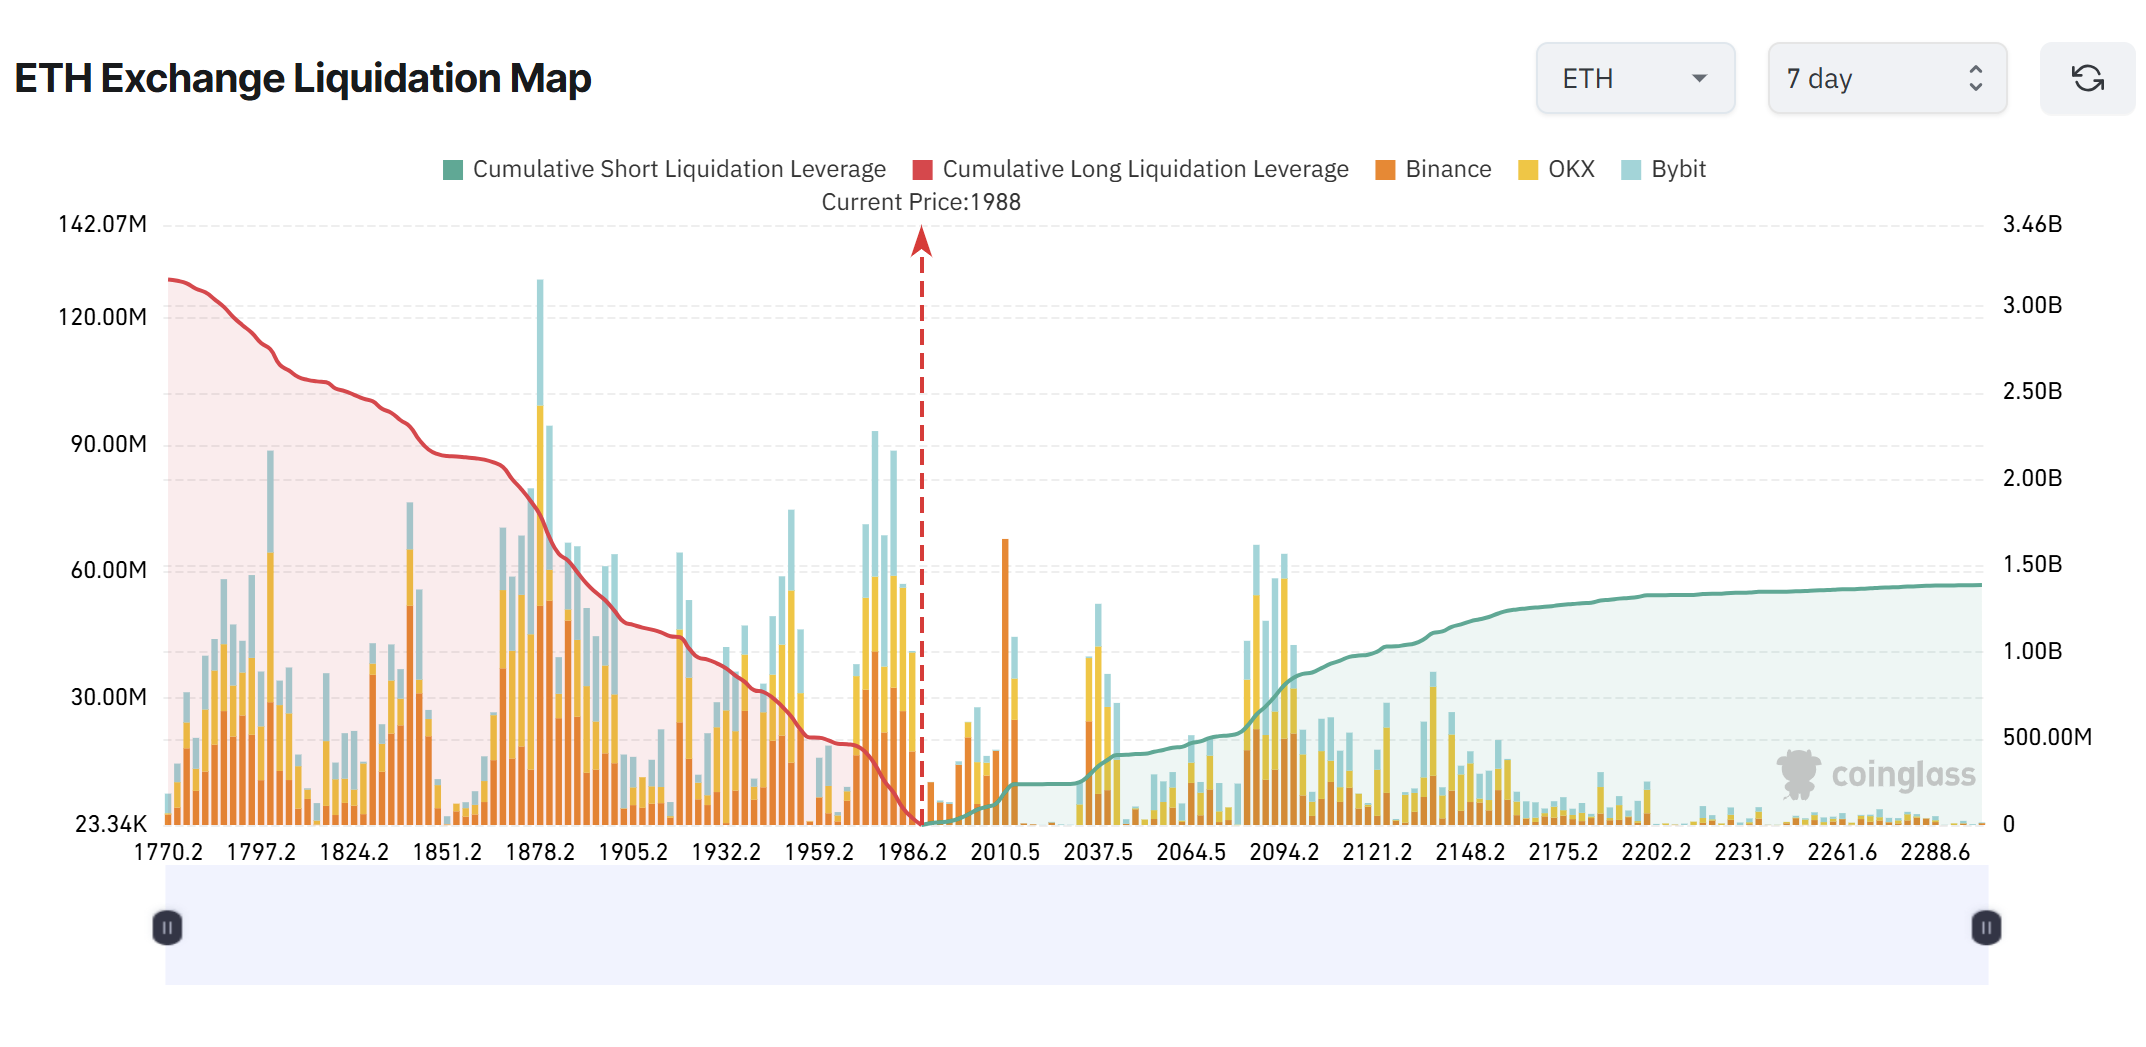
This reversal indicates that traders who opened shorts late in the cycle faced forced liquidations. Nevertheless, with funding rates now trading at elevated positive levels, the market structure favors long positions, creating potential vulnerability for a long squeeze toward $1,800 should upward momentum weaken.
Approximately $2.66 billion in long position liquidation exposure clusters around the $1,800 price zone, establishing a substantial liquidity pocket beneath current trading levels.
Volatility and ETF Flows
Ethereum’s 30-day realized volatility measured on Binance has climbed to approximately 0.97, representing the highest measurement recorded since March 2025. Heightened volatility during this phase may indicate market uncertainty and directional indecision rather than establishing a clear trend.
Price action continues trading beneath the 50-day, 100-day, and 200-day moving averages. Following the rejection near $4,800 in late 2025, each subsequent recovery attempt has established lower peaks, suggesting persistent distribution pressure.
Regarding ETF activity, selling pressure appears to be diminishing. Following substantial outflows throughout mid-2025, recent flow statistics indicate reduced movement in either direction. Institutional distribution seems to be decelerating, although convincing accumulation signals have yet to materialize.
Market analyst Leon Waidmann observed that retail participants with low conviction have predominantly exited their positions. Short interest continues declining, while highly leveraged long positions have been slow to establish meaningful presence.
Technical strategist IncomeSharks identified three overhead resistance zones, including multiple SuperTrend rejections and channel resistance positioned near $2,250. The analyst additionally highlighted April’s lows around $1,500 as a critical downside level should demand weaken once more.
At press time, ETH was changing hands at $2,034.


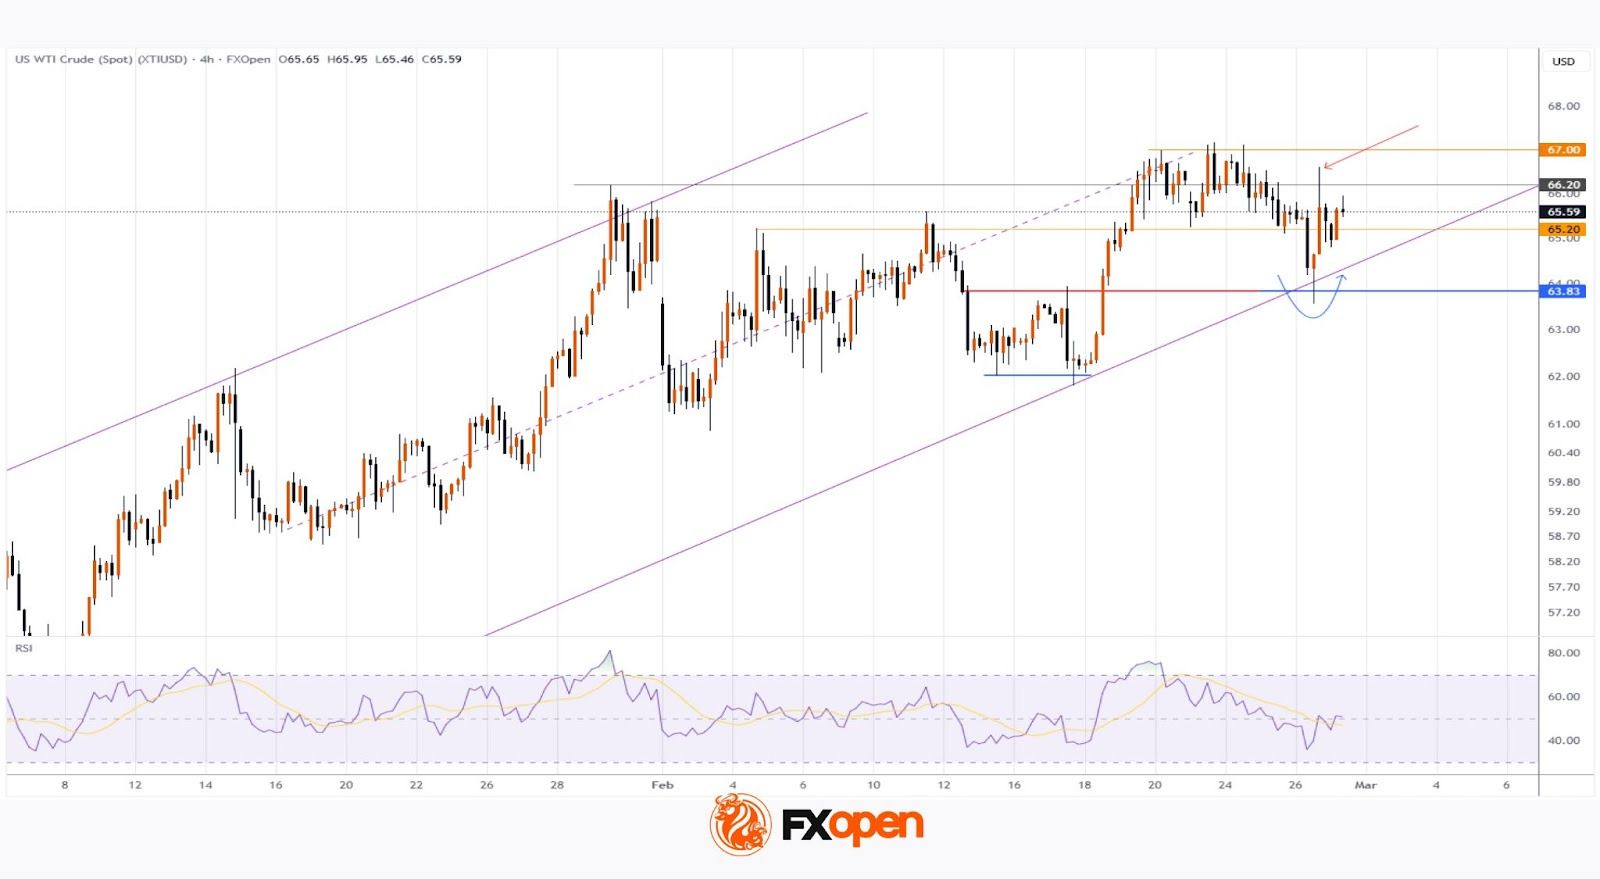
As the XTI/USD chart shows, the price of a barrel:
→ set fresh 2026 highs above $67 earlier this week;
→ but yesterday posted a sharp reversal lower (as indicated by the blue arrow).
The spike in volatility was driven by conflicting reports from Geneva, where talks between the United States and Iran were taking place:
→ some sources suggested negotiations had reached an impasse, as Washington insists on a complete halt to uranium enrichment;
→ meanwhile, according to Omani mediators, progress has been made and another round of talks is scheduled for next week.

Technical Analysis of the XTI/USD Chart
When analysing the oil price chart on the morning of 19 February, we suggested that:
→ the market could soon set a new high for the year (which materialised, with a series of highs formed between 19 and 23 February);
→ the 65.20 level would act as support (confirmed on 23 February).
Today’s chart indicates growing bearish pressure, reflected in the following:
→ WTI struggled to hold above its yearly highs, forming signs of potential bull traps;
→ yesterday’s candle (marked with a red arrow) shows a pronounced upper wick.
At the same time, bulls clearly defended the former resistance level at $63.73. The lower boundary of the ascending trajectory that has defined WTI price movements in 2026 also supports the bullish case.
It is worth noting that an OPEC+ meeting is scheduled for the weekend. According to media reports, analysts expect an increase in output from April, which could heighten concerns about oversupply — particularly after US crude inventories rose on Wednesday. As a result, Monday’s trading may open with elevated volatility.
Start trading commodity CFDs with tight spreads (additional fees may apply). Open your trading account now or learn more about trading commodity CFDs with FXOpen.
This article represents the opinion of the Companies operating under the FXOpen brand only. It is not to be construed as an offer, solicitation, or recommendation with respect to products and services provided by the Companies operating under the FXOpen brand, nor is it to be considered financial advice.
Tether (USDT) Price Prediction
Tether’s USDT peg persists amid competition from yield-bearing stablecoins and evolving regulations. Reserve accumulation and cross-chain volume growth reinforce its market position. Analysts monitor depeg potential through quarterly attestations, futures open interest, and macroeconomic developments. Price scenarios for 2026 to 2030 appear next, covering base, stress, and premium cases informed by reserve structures, transaction flows, and external variables.
2026-2030 Price Scenarios
Base case projects a $0.99-$1.01 range through 2030. Annual supply growth of 8–10% tracks reserve expansion, keeping coverage modestly above 100% to maintain peg stability. Tokenization demand and emerging market absorption prevent sustained premium formation.
Stress scenarios anticipate temporary declines to $0.96-$0.98 during 2026-2027. Coverage falling below 1.01x prompts $5-10 billion in redemptions, mirroring 2022 patterns. Burns and arbitrage restore equilibrium within 30-60 days.
Premium scenarios target $1.02-$1.05 by 2030 during scarcity phases. Yield-bearing alternatives claim less than 10% market share as real-world asset tokenization accelerates. Regulatory simplification drives institutional inflows.
| Year | Base Range | Stress Range | Premium Range | Base Probability |
|---|---|---|---|---|
| 2026 | $0.99-1.00 | $0.96-0.98 | $1.01-1.02 | 85% |
| 2027 | $0.99-1.00 | $0.95-0.97 | $1.01-1.03 | 82% |
| 2028 | $1.00-1.01 | $0.96-0.98 | $1.02-1.04 | 84% |
| 2029 | $1.00-1.01 | $0.97-0.99 | $1.02-1.04 | 87% |
| 2030 | $0.99-1.01 | $0.97-0.99 | $1.02-1.05 | 88% |
Reserves and Peg Stability
Latest attestations show reserves modestly exceeding liabilities, with coverage approaching parity historically triggering several billion dollars in redemptions. U.S. Treasuries and cash equivalents represent the dominant allocation, typically accounting for roughly 70–80% of total reserves, while the remainder includes secured loans, precious metals, and a limited Bitcoin position. Excess reserves fluctuate quarterly and function as a liquidity buffer rather than a fixed structural surplus.
Composition favors short-duration Treasuries, which yield compression from Fed policy affects minimally. Quarterly burns offset mints, limiting supply growth to 8% annualized. USDC trails at $75 billion circulation with similar transparency standards.
| Component | Allocation ($B) | Share |
|---|---|---|
| U.S. Treasuries | 112.4 | 80% |
| Reverse Repos | 21.0 | 15% |
| Cash Equivalents | 6.4 | 5% |
| Excess Coverage | 6.8 | 4% |
Redemption queues process within 48 hours under normal conditions. During May 2022 volatility, USDT briefly traded well below $1 on secondary markets, with intraday prints near $0.95 on some venues before arbitrage restored parity. Emerging market holdings concentrate 40% of issuance, amplifying velocity over domestic flows.
Chain Trends Driving Volume
Tron and Ethereum dominate USDT transfers. Tron leads in low-cost, high-velocity transfers, while Ethereum anchors DeFi liquidity. Solana handles a smaller share (~8%) through high throughput. Emerging markets account for ~40% of TRC20 activity, prioritizing transaction speed over smart contract depth.
Market participants use USDT TRC20 swap tools to capture fee arbitrage during Ethereum congestion, preserving liquidity across protocols without premium costs.
| Chain | Volume Share | Average Fee | Primary Application |
|---|---|---|---|
| TRC20 | 45% | $0.001 | High-velocity transfers |
| ERC20 | 50% | $0.50 | DeFi liquidity pools |
| Solana | 8% | $0.0005 | Rapid settlement trades |
Tron issuance exceeds 80 billion tokens, reflecting sustained adoption in dollar-scarce regions. ERC20 maintains pricing anchor despite fee disadvantage. Volume distribution signals preference for cost efficiency over ecosystem lock-in.
Platform Execution for Traders
USDT pairs account for 60% of exchange volume, with futures open interest steady at $26 billion across major platforms. Binance remains the primary venue for USDT liquidity, while Coinbase lists USDT but structurally prioritizes USDC in U.S. markets. Execution differences emerge in liquidity depth and order book resilience during volatility spikes.
Traders compare Coinbase vs Binance metrics when selecting USDT pair venues, weighing spread tightness against regulatory exposure for range-bound positioning.
| Platform | USDT Volume Share | Open Interest ($B) | Spread (bps) |
|---|---|---|---|
| Binance | 45% | 15 | 1.2 |
| Coinbase | 22% | 6 | 2.1 |
| Others | 33% | 5 | 1.8 |
Funding rates average 0.01% daily, signalling low leverage risk. Platform choice influences slippage on $1-2 billion daily rotations, particularly during attestation windows. Concentration on two venues exposes systemic liquidity risks if outflows coincide.
Technical Indicators Now
USDT trades in a narrow $0.998-$1.002 range under recent market conditions, indicating low volatility. Technical indicators, such as Bollinger Bands and RSI, suggest range-bound positioning, consistent with peg stability.
Futures open interest remains at $26 billion with funding rates near 0.01%. MACD lines converge without histogram divergence, pointing to consolidation ahead of quarterly reports. Volume profiles flatten week-over-week, consistent with range-bound positioning.
- Support levels sit near $0.997 (50-day EMA) and around $0.99 for historical stress periods.
- Resistance caps at $1.002 (upper band) and $1.005 (recent high).
Breakouts below $0.997 signal deeper tests of psychological support. Upper breaches require sustained mints exceeding $2 billion daily. Current setup favors mean reversion over directional bets.
Catalysts and Headwinds
Real-world asset tokenization eyes $400 billion by 2028, channeling demand to USDT pairs. Emerging markets generate 35-40% circulation growth via TRC20 in Latin America and Southeast Asia. U.S. regulatory easing curbs NYAG scrutiny, supporting $20 billion annual institutional inflows.
Yield-bearing stablecoins take 6-8 DeFi TVL points:
- USDe yields 4.8-5.5% APY on $12 billion.
- PYUSD hits $1.8 billion through merchants.
Fed rate paths squeeze Treasury yields on 80% reserves. Coverage margins tighten. The EU’s Markets in Crypto-Assets framework imposes stricter reserve transparency and liquidity standards for compliant issuers, increasing scrutiny on stablecoin structures operating within the bloc.
A visible decline in reserve coverage toward parity would likely accelerate institutional redemptions, with magnitude driven by liquidity conditions rather than a fixed numerical trigger. RWA gains offset this, locking in 62-65% dominance through 2027.
Trader Tactics and Storage
Position USDT within 20-30% portfolio limits to manage concentration risk. Review reserve attestations each quarter for coverage trajectory. Store amounts over $100,000 in multi-signature or hardware wallets, keeping recovery phrases offline.
Chain preferences vary by use case:
- TRC20 suits transfers below $50,000 where fees stay under $0.001.
- ERC20 fits DeFi positions despite $0.50 average costs.
- Solana handles sub-second needs for high-frequency execution.
Primary redemptions typically settle within 1–2 business days under normal conditions. Cross-chain swaps capture fee savings during Ethereum spikes. Avoid leverage entirely. Shift 10-15% to yield options only in stable conditions. Track funding rates exceeding 0.02% daily as outflow warnings. Coverage drops below 1.02x demand immediate position cuts.
USDT Peg Outlook
Reserve buffers slightly above parity support the $0.99–$1.01 range under normal market conditions, bolstered by TRC20 efficiencies and RWA flows. Technical ranges and volume shifts confirm resilience. Yield rivals plus MiCA test margins, but redemptions cap stress at $0.96-$0.98 with rapid recovery.
Platform tactics and storage limit slippage risks. USDT continues to hold a majority share of the global stablecoin market, with dominance dependent on liquidity depth, regulatory positioning, and cross-chain accessibility. Prioritize quarterly attestations, 20-30% caps, and chain rotations before Fed yield squeezes. Premiums over $1.02 require rival erosion below 10%, unlikely by 2030.
FAQ
Will USDT maintain its $1 peg through 2030?
Base scenarios project 85-88% probability within $0.99-$1.01. Stress cases limit breaches to $0.96-$0.98 with burn-driven recovery.
What drives TRC20’s volume dominance?
TRC20 leads in low-cost, high-velocity transfers (~45% of USDT activity), while ERC20 supports DeFi liquidity despite higher fees (~50%). Emerging markets prioritize transaction speed in dollar-scarce regions, contributing to TRC20’s practical advantage.
How do yield rivals impact USDT?
USDe and PYUSD erode 6-8 DeFi TVL points at 4.8-5.5% APY. Liquidity depth restricts share loss below 10%.
What triggers a 2026 stress depeg?
Coverage approaching parity can trigger several billion dollars in redemptions, historically absorbed by arbitrage and reserve buffers. Fed yield compression or MiCA collateral caps may accelerate outflows.
Should portfolios hold USDT long-term?
Cap exposure at 20-30% for peg reliability. Allocate 10-15% to yields during stable periods.
Can USDT trade above $1.02 sustainably?
Premium scenarios need rival erosion below 10% share. RWA scarcity supports this at 5-10% odds by 2030.
How reliable are these projections?
Ranges derive from attestation trends and historical patterns, with coverage consistently above parity. Black swans alter probabilities.
Why prefer TRC20 over ERC20?
TRC20 suits transfers under $50,000. ERC20 anchors DeFi despite fee disadvantage.
What storage secures larger USDT positions?
Multi-signature or hardware wallets for over $100,000. Keep phrases offline; enable direct Treasury redemption.
When do Fed rates affect reserves?
Treasury yield drops on 80% allocation narrow coverage. Monitor before rate cuts for rotation signals.
Disclaimer
This article offers informational analysis only. It does not constitute investment, financial, or trading advice. Cryptocurrency markets exhibit high volatility, and historical patterns do not predict future outcomes. Readers must conduct independent research and consult qualified professionals before making decisions. The publisher assumes no liability for any losses incurred.
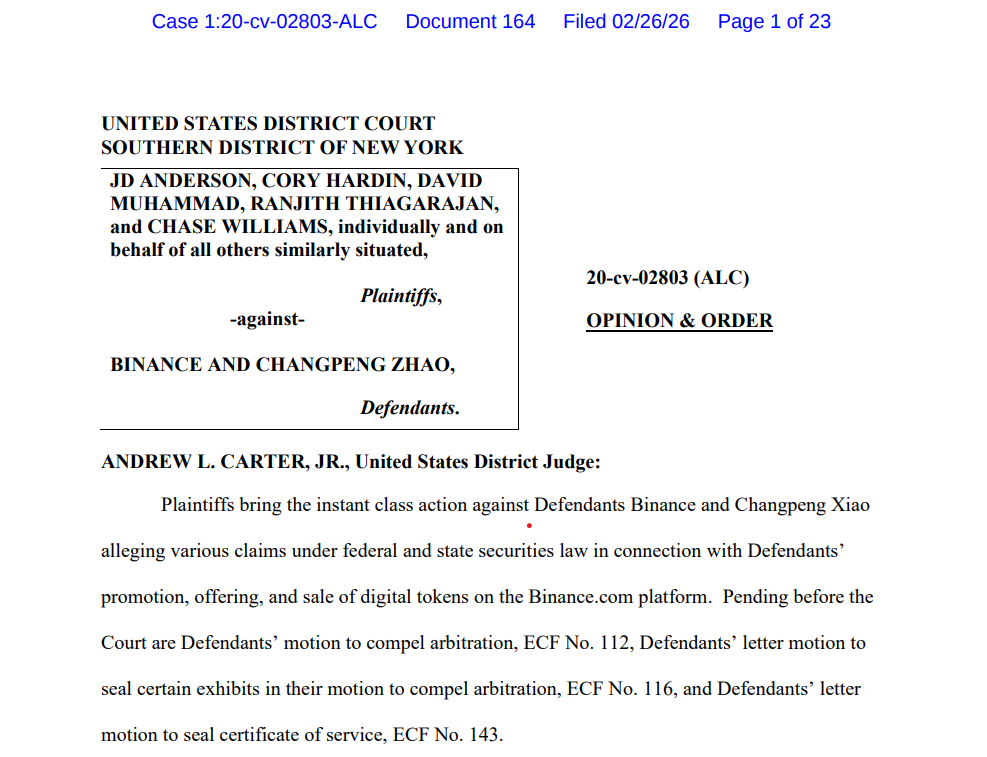
A United States federal judge ruled that Binance cannot force a group of US customers to arbitrate claims over losses on crypto tokens they bought on its global platform before Feb. 20, 2019, keeping a major class action in open court.
The decision on Thursday by District Judge Andrew Carter Jr. in the Southern District of New York held that those claims were not bound by Binance.com’s 2019 arbitration clause because users lacked sufficient notice when the company unilaterally shifted its terms of use away from the 2017 version, which contained no arbitration or class action waiver provisions.
According to the judge, Binance relied on a general change‑of‑terms clause and the posting of updated 2019 terms on its website, and there was no evidence that the exchange provided any individual notice or formally “announced” the new arbitration provision to users.
Carter found that Binance’s “new world” rhetoric about operating in a decentralized manner did not change the basic contract law analysis for internet‑based agreements.

He concluded that the 2019 arbitration clause could not be applied retroactively to claims that arose before its Feb. 20 effective date, because the contract never clearly said it would cover earlier conduct.
Related: US senator launches probe into Binance over Iran, Russia sanctions claims
Carter also held that a purported US class action waiver embedded in a section heading of the 2019 terms was unenforceable in federal court because the contract never actually sets out the terms of any such waiver and had to be interpreted narrowly against Binance as the drafter.
Binance says post‑2019 claims already dismissed
The case, Williams v. Binance, is a proposed class action brought by five US investors from California, Nevada and Texas who claim that Binance and founder Changpeng Zhao (CZ) illegally sold unregistered securities on Binance.com and failed to register as a broker‑dealer.
The case was previously dismissed in 2022 before the Second Circuit revived the investors’ claims in 2024, sending the dispute back to Carter’s court.
In a statement to Cointelegraph, a Binance spokesperson said that “in response to our motion on this issue plaintiffs voluntarily and correctly dismissed all claims that accrued on or after Feb. 20, 2019.” They added that Binance would “vigorously defend the limited claims that remain in this meritless case.”
The remaining claims will now proceed in a federal US court rather than private arbitration in Singapore, as judges, rather than arbitrators, assess whether crypto platforms can rely on unilaterally updated online terms to limit investor lawsuits.
Magazine: Big Questions: Is China hoarding gold so yuan becomes global reserve instead of USD?
Crypto World
BTC price falls with ETH, SOLwhile decred, AI-linked tokens advance: Crypto Markets Today


Decred (DCR), a token built for autonomy and decentralized governance, extended gains even as the broader market led by bitcoin struggled.
The token has risen 16% in the past 24 hours and now trades at $34.58, the highest since November, CoinDesk data show. It’s the best-performing top-100 token over the past four weeks, having gained more than 80% after a Feb. 8 change to its treasury rules.
Bitcoin, for its part, is facing renewed selling pressure, trading just around $67,000, a weak follow-through after bouncing to $70,000 on Wednesday. The cryptocurrency is down 2% on a 24-hour basis, with ether (ETH), XRP (XRP), solana (SOL), and the CoinDesk 20 Index (CD20) registering similar losses.
Market participants remain cautious and are continuing to seek put options, or downside protection, in bitcoin. Deribit said that ETF holders and corporate treasuries are buying put options at the $60,000 strike expiring in six to 12 months.
Analysts said institutional flows are improving but not yet decisive, and traders should avoid taking big risks.
“Long-term investors may consider staggered accumulation (SIP-style allocation) near support zones rather than deploying lump sums at resistance,” Vikram Subburaj, CEO of crypto exchange Giottus.com, said in an email to CoinDesk.
Derivatives positioning
- Cumulative crypto futures open interest (OI) has fallen back to recent multimonth lows of around $93.5 billion. The drop shows how quickly the optimism sparked by Wednesday’s bitcoin price bounce has fizzled out.
- Major tokens, including bitcoin and ether, have seen capital outflows from futures as notional OI declined more than their spot prices.
- The market-wide long-short ratio continues to show a dominance of shorts, or bearish bets.
- OI in tether gold (XAUT) dropped another 11% extending the decline from early this week. Gold-linked assets seem to have fallen out of favor lately.
- Most large-cap tokens, including BTC and ETH, are again seeing negative perpetual funding rates. That means bearish plays are dominating the market once more.
- Participation in CME bitcoin futures is falling, as shown by open interest hitting the lowest levels this year.
- On Deribit, one-month bitcoin puts still trade at a 7% premium to calls in a sign of lingering concerns of further spot price declines. The same is true for ether.
- Bitcoin put spreads, a bearish strategy, accounted for 75% of the total block flow over 24 hours. In ETH’s case, traders chased put spreads and straddles (volatility strategies).
Token Talk
The DFINITY Foundation proposed burning 20% of cloud engine revenue, introducing a deflationary element tied directly to network usage for Internet Computer (ICP).
The remaining 80% of revenue would be routed to node operators, replacing fixed emissions with performance-based incentives. The idea is to make ICP’s token supply more responsive to real demand.
ICP’s price moved up roughly 6% in the last 24-hour period, from around $2.41 to $2.56. It’s down from a high of $2.7 seen during the period. The price appears to be influenced not just by the foundation’s proposal, but also by Nvidia’s blowout earnings.
Those earnings boosted sentiment surrounding artificial intelligence-linked assets, with Nvidia CEO Jensen Huang saying AI is only getting better.
ICP, often marketed as a decentralized alternative to traditional cloud AI infrastructure, was among several AI-linked tokens, including render (RENDER) and bittensor (TAO), to benefit from renewed investor interest in the sector.
Crypto World
Be The Boss Surpasses $2M in Real Payouts as Playnance Ecosystem Generates $5.3M Ahead of G-Token Launch


Tel Aviv, Israel, 26th February 2026, Chainwire
[PRESS RELEASE – Tel Aviv, Israel, February 26th, 2026]
Playnance today announced that its “Be The Boss” program has surpassed $2 million in real cash payouts (fiat), while expanding to 2,809 active Bosses across its ecosystem. Overall, the platform has generated more than $5.3 million in total revenue to date. The momentum comes as the company prepares for the upcoming launch of its G-Token, the core utility token designed to power and unify activity across Playnance’s live, on-chain consumer platforms.
The Be The Boss program was designed as a structural layer within the Playnance ecosystem, allowing participants to take an active role in platform-level economics tied directly to real user activity. Unlike speculative participation models that rely on projected growth, the program is integrated into Playnance’s live infrastructure, which currently processes approximately 1.5 million on-chain transactions per day and serves more than 10,000 daily active users. All user activity across Playnance’s platforms is executed and recorded on-chain through a non-custodial system, while maintaining familiar Web2 onboarding flows that remove blockchain complexity for mainstream users.
As users engage with platforms such as PlayW3, Up vs Down, and other ecosystem products, transaction activity flows through a shared wallet and infrastructure layer. The Be The Boss structure is designed to align with this activity, creating a framework that reflects ecosystem performance rather than external incentives. The growth to 2,809 Bosses, more than doubling participation, signals increasing engagement ahead of the G-Token launch and demonstrates sustained interest in the underlying system.
The upcoming G-Token already serves as the core utility layer across the Playnance ecosystem, functioning as the connective asset between products, infrastructure, and user participation. Built directly into platform mechanics, the token is designed to power interactions, support settlement flows across applications, and unify multiple consumer platforms under a shared on-chain economic model. Rather than operating as a standalone digital asset, G-Token forms the foundation of the ecosystem’s architecture, linking user behavior, transaction activity, and platform-level incentives within a single framework.
The Be The Boss program operates within this token-driven structure, reinforcing Playnance’s approach of building live systems at scale before publicizing them. By grounding its token model in measurable activity, including 1.5 million daily on-chain transactions, Playnance positions G-Token as an extension of an already functioning ecosystem rather than a speculative launch.
“Our focus has always been on building real systems that operate at scale before talking about them,” said Pini Peter, CEO of Playnance. “The growth of the Be The Boss program and the upcoming launch of G-Token reflect years of infrastructure development, live user activity, and continuous refinement. We designed the token to serve a working ecosystem, not the other way around, and this milestone shows that the foundation is already in place.”
Playnance plans to continue expanding its ecosystem in alignment with observed user behavior and platform performance, further strengthening the integration between consumer applications, shared infrastructure, and the G-Token economy.
About Playnance
Founded in 2020, Playnance is a Web3 infrastructure company developing live, non-custodial, on-chain products designed to onboard mainstream Web2 users into blockchain environments. The company develops consumer-facing platforms built on shared wallet systems and high-volume on-chain execution, currently processing approximately 1.5 million transactions per day. Playnance focuses on reducing friction between user experience and blockchain infrastructure by abstracting complexity while maintaining full on-chain transparency and non-custodial architecture.
Binance Free $600 (CryptoPotato Exclusive): Use this link to register a new account and receive $600 exclusive welcome offer on Binance (full details).
LIMITED OFFER for CryptoPotato readers at Bybit: Use this link to register and open a $500 FREE position on any coin!
Bitcoin is contending with a rare confluence of resistance on the weekly chart, a setup that could determine whether the bear phase eases into March or drags on for longer. The price action comes as BTC hovers in a tight zone just below three major barriers: the 200-week exponential moving average (EMA) at about $68,330, the long-standing 2021 all-time high near $69,000, and the round-number psyche of $70,000. The most recent moves show a struggle to reclaim those levels after a mid-week peak that touched $70,040 but failed to hold. This backdrop has traders weighing the probability of a sustained rebound versus another leg lower, with the market watching for a decisive bullish signal.
Key takeaways
- Bitcoin is testing a triple-resistance cluster on the weekly chart, with the 200-week EMA at roughly $68,330, the 2021 peak around $69,000, and $70,000 acting as a psychological barrier.
- BTC has dropped about 14% in February, marking a fifth consecutive red month, highlighting persistent downside pressure even as buyers consider a potential shift in momentum.
- The price hovered near $67,720 after failing to reclaim the $70,000 level, underscoring the need for a weekly close above the 200-week EMA to sustain any upside.
- Analysts have flirted with the idea that March could turn bullish if a weekly close clears the EMA hurdle, suggesting a possible retest toward higher targets if momentum builds.
- Historical precedent factors into the discussion: a similar streak in late 2018 preceded a multi-month rally, raising expectations that a reversal could materialize in the spring once selling pressure loosens.
- Longer-term signals remain mixed, with traders eyeing the potential break above a major cost-basis level around $74,500 as a potential marker for a sustained bull phase.
Tickers mentioned: $BTC
Market context: The price action arrives as liquidity and risk appetite swing with broader market dynamics, including a stock-market rebound and earnings data that have previously boosted risk-on assets. Traders are balancing technical resistance with macro cues, keeping a close watch on trend-following signals and key levels on the chart.
Why it matters
From a technical standpoint, the trio of resistance points converges at a zone that has historically defined BTC’s near-term fate. A weekly close above the 200-week EMA at $68,330 would be a rare indication that sellers are losing steam and that bulls are regaining control. Such a move could rekindle momentum toward the next psychological and technical targets, potentially delivering a more substantive bounce than a cursory intraday spike.
The broader context matters because these levels are not arbitrary driftlines; they reflect long-standing anchors in Bitcoin’s price history. Confronting the old high at $69,000 provides a test of whether demand can overwhelm supply that has persisted through a prolonged drawdown. The $70,000 level, in turn, functions as more than a price barrier—it signals a market memory of previous turning points when risk appetite reacted to macro news and liquidity conditions. A sustained move through these gates could alter sentiment in a market that has endured a multi-month downtrend.
Beyond the immediate price optics, the discussion is inseparable from the mechanism of a potential bear-market exit. Some market observers point to a pivotal threshold around $74,500—the cost basis for the 18-24 month age band—as a possible inflection line for the bear narrative. A break above that zone has historically carried implications for the durability of any upward move, even if the current price action remains within a volatile corridor. In this sense, the path forward is not simply about punching higher; it is about confirming a durable change in the supply-demand dynamics that have characterized BTC for months.
The market’s current mood is further informed by a blend of on-chain and sentiment signals that emphasize demand resilience and the risk of renewed selling pressure if macro catalysts deteriorate. Market watchers have noted that previous episodes of similar consolidation tended to be followed by more pronounced moves once the EMA and key resistance levels gave way. This pattern, while not a guarantee, has shaped a cautious outlook for March as participants await the weekly cadence of candles to reveal whether bulls can sustain a breakout or whether fresh selling emerges to prolong the consolidation.
In parallel, commentary from prominent traders underscores the fragility of any rally, noting that a lack of a convincing weekly close could delay a meaningful rebound. For instance, a trader known as Captain Faibik argued that clearing the 200-week EMA on a weekly basis could pave the way for a resurgence toward higher targets, cautioning that March could shape up as a turning point if momentum is captured. His assessment reflects a common view that the longer horizon—beyond a single daily move—matters for how the market assigns value to risk assets in the near term.
As a reminder of the historical context, a Cointelegraph piece noted that the bear market could end if BTC reclaimsthe cost basis around the 18-24-month band, a threshold that has historically signaled a shift in trend. The question remains whether this time will mimic the late-2018 to early-2019 period when a months-long drawdown was followed by a dramatic multi-bagger rally. If selling pressure abates and demand returns, April could mark the onset of a more constructive phase for the asset, even as the journey toward that inflection point remains uncertain.
“I think March is going to be a bullish month.”
Data from CoinGlass reinforces the immediacy of the trend, showing a five-month streak of negative performance for Bitcoin with February posting about a 14% decline. The cadence of losses has raised concerns about macro-driven risk-off sentiment, yet it also sets the table for a potential reversal should macro news align with technical breakouts. The market’s memory of past cycles—where similar declines have given way to decisive rallies—keeps the discussion open for a spring resurgence, provided the price clears the critical thresholds and maintains momentum.
In this environment, traders are urged to monitor the confluence of signals rather than relying on a single data point. A sustained push through the key hurdle at $68,330 on a weekly close would be a more meaningful signal than a fleeting intraday peak. If momentum bets align with a broader market backdrop that supports risk-on assets, the path toward higher levels could materialize, offering traders a clearer roadmap for the weeks ahead.
What to watch next
- Watch for a weekly close above the 200-week EMA near $68,330 to confirm momentum and potentially open a path toward $70,000 and beyond.
- Monitor price action around $69,000 and $74,500 as potential inflection points that could alter the bear narrative and attract new buyers or trigger renewed selling.
- Observe the interplay between macro catalysts and risk appetite, including market reactions to earnings data and macro releases, which have previously influenced BTC’s correlation with broader assets.
- Track on-chain indicators and investor behavior for signs of exhaustion in selling pressure and the emergence of accumulation patterns that precede sustained rallies.
Sources & verification
- BTC price context and resistance levels as discussed in a Cointelegraph piece focusing on the confluence of barriers at $68k–$70k
- BTCUSD TradingView data illustrating price hovering around $67,720 after rejection from $70,000
- CoinTelegraph report on bear-market dynamics tied to reclaiming $74,500 as a key end-state
- CoinGlass data documenting February’s 14% decline and the five-month red streak
- Public posts by traders on X, including insights from CryptoFaibik and Alek Carter, discussing near-term momentum and historic precedents


- The one-click DeFi access could unlock idle XRP liquidity for Flare’s ecosystem.
- The FLR token price remains weak amid low liquidity and cautious market sentiment.
- The immediate support level for Flare (FLR) sits near $0.00963, with downside risk if this support breaks.
Flare (FLR) cryptocurrency price is pulling back after a recovery attempt that pushed it to a high of $0.009826 on February 28, following the news of Flare rolling out one-click DeFi access for XRP token holders through a partnership with Xaman.
This comes as FLR cryptocurrency trades near multi-month lows, raising an important question about whether fundamentals can eventually support a shift in price momentum.
The one-click DeFi lowers the barrier for XRP holders
For years, XRP holders have largely remained on the sidelines of decentralised finance due to technical complexity and limited native options.
Flare’s latest integration aims to change that by simplifying how the XRP cryptocurrency can be used in DeFi without forcing users to navigate bridges, complex smart contracts, or unfamiliar wallets.
The one-click approach allows users to interact with DeFi protocols while maintaining self-custody, which has been a persistent concern for more conservative market participants.
By abstracting away the complicated steps, Flare positions itself as a gateway for idle XRP liquidity to enter yield-generating activities.
This matters because XRP represents one of the largest pools of dormant capital in crypto, yet only a small fraction of it is currently productive.
If even a modest percentage of that capital moves on-chain, it could significantly boost activity across Flare’s DeFi stack.
The timing is also notable, as demand for yield products has been rising while speculative trading has slowed.
That shift suggests users are becoming more selective, favouring utility and predictable returns over short-term price bets.
Market conditions keep FLR under pressure
Despite the positive narrative, Flare’s native token, FLR, has struggled to reflect this progress in its price.
The broader crypto market has recently leaned risk-off, with total market capitalisation slipping and Bitcoin posting mild losses.
In this environment, FLR has underperformed slightly, declining more sharply than the market average over the past 24 hours.
Liquidity remains thin, as reflected by a sharp drop in daily trading volume, which makes the token more sensitive to modest sell pressure.
Low liquidity often exaggerates price moves, especially when there is no strong catalyst to attract fresh buyers.
While social sentiment around XRP-related developments has turned more optimistic, that enthusiasm has not yet translated into sustained buying activity.
Over the past month, FLR has remained down meaningfully, reinforcing the idea that traders are still cautious.
This disconnect between improving fundamentals and weak price action highlights a familiar crypto pattern where adoption narratives take time to show up on charts.
Flare price forecast
FLR is currently trading in a tight technical range that reflects uncertainty rather than panic.
Price action is sitting between key Fibonacci retracement levels that have capped momentum in both directions.
The first level traders are watching is the area around $0.00904, which has acted as short-term support.
A clean break below this zone could expose the previous swing low near $0.0085.
If that lower level fails to hold, downside pressure may accelerate due to thin liquidity.
This makes volume confirmation critical for any move lower or higher.
On the upside, FLR needs a decisive push above the $0.00968 region to shift near-term momentum.
Such a move would signal that buyers are finally stepping in with conviction.
From a technical standpoint, momentum indicators, including the Relative Strength Index (RSI), currently sit near neutral, suggesting the market is coiled rather than trending.

This leaves FLR vulnerable to broader market moves until a clear catalyst emerges.
The key question is whether growing DeFi participation from XRP holders can translate into measurable demand for FLR.
If on-chain activity and volume rise together, price could stabilise and attempt a recovery.
Until then, the outlook remains neutral to slightly bearish, with traders focused on support resilience rather than breakout targets.


- Bitcoin stalls near $67,000 after partial recovery from all-time highs.
- On-chain data shows half of BTC is held at a loss, hinting at market fatigue.
- Analyst warns deeper correction possible, with bottom around $45,000.
Bitcoin’s recent recovery attempt has stalled just below $70,000, with the cryptocurrency slipping back to around $67,250 at press time.
The drop comes as the broader crypto market struggles to maintain upward momentum following a few months of volatility.
After reaching an all-time high of $126,080 in October 2025, Bitcoin (BTC) has now retraced nearly half of its value.
All eyes are now on the cryptocurrency as it appears to consolidate around $67,000 after the steep drawdown.
Analyst Willy Woo warns of further downside
Renowned on-chain analyst Willy Woo has predicted a significant price correction following the recent bounce.
He estimates that the bear market bottom could be around $45,000, with more extreme scenarios potentially testing $30,000 or even lower.
Woo’s caution stems from declining liquidity across spot and derivatives markets, which historically reduces the strength of rallies.
He suggests that Bitcoin may briefly climb to the mid-$70,000 range before facing renewed downward pressure.
On-chain signals hint at market fatigue
On-chain metrics suggest that Bitcoin may be entering the later stages of a bear market cycle rather than the early phase.
Roughly half of all circulating BTC, nearly 9.2 million coins, are currently held at a loss, according to the latest weekly report by on-chain analytics firm Glassnode.
Historically, such levels indicate significant selling pressure and potential capitulation, yet the pace of accumulation by long-term holders hints at a market beginning to stabilise.
Some analysts view these patterns as signs that bitcoin’s price may be closer to a bottom than the start of a prolonged decline.
The balance between holders in profit and those in loss is an important measure of market sentiment, and it shows that while short-term volatility remains high, there is underlying support at current levels.
Bitcoin ETF inflows show cautious optimism
Institutional investors have recently stepped back into the market, with Bitcoin ETFs recording over $1 billion in net inflows over a few days.
This trend follows a period of withdrawals totalling nearly $3 billion, signalling that some investors see the current price as a buying opportunity.
Spot ETFs, in particular, are attracting attention from long-term investors looking for regulated exposure to Bitcoin.
The renewed interest demonstrates that, despite the pullback from all-time highs, there is confidence in the asset’s long-term prospects.
However, inflows are not a guarantee of sustained upward momentum.
Short-term technical indicators suggest that Bitcoin is trading near the top of a tight consolidation range between $67,000 and $68,000, and a breakout above this zone could spark a rally, although rejection may force the price back toward $63,000 or lower.
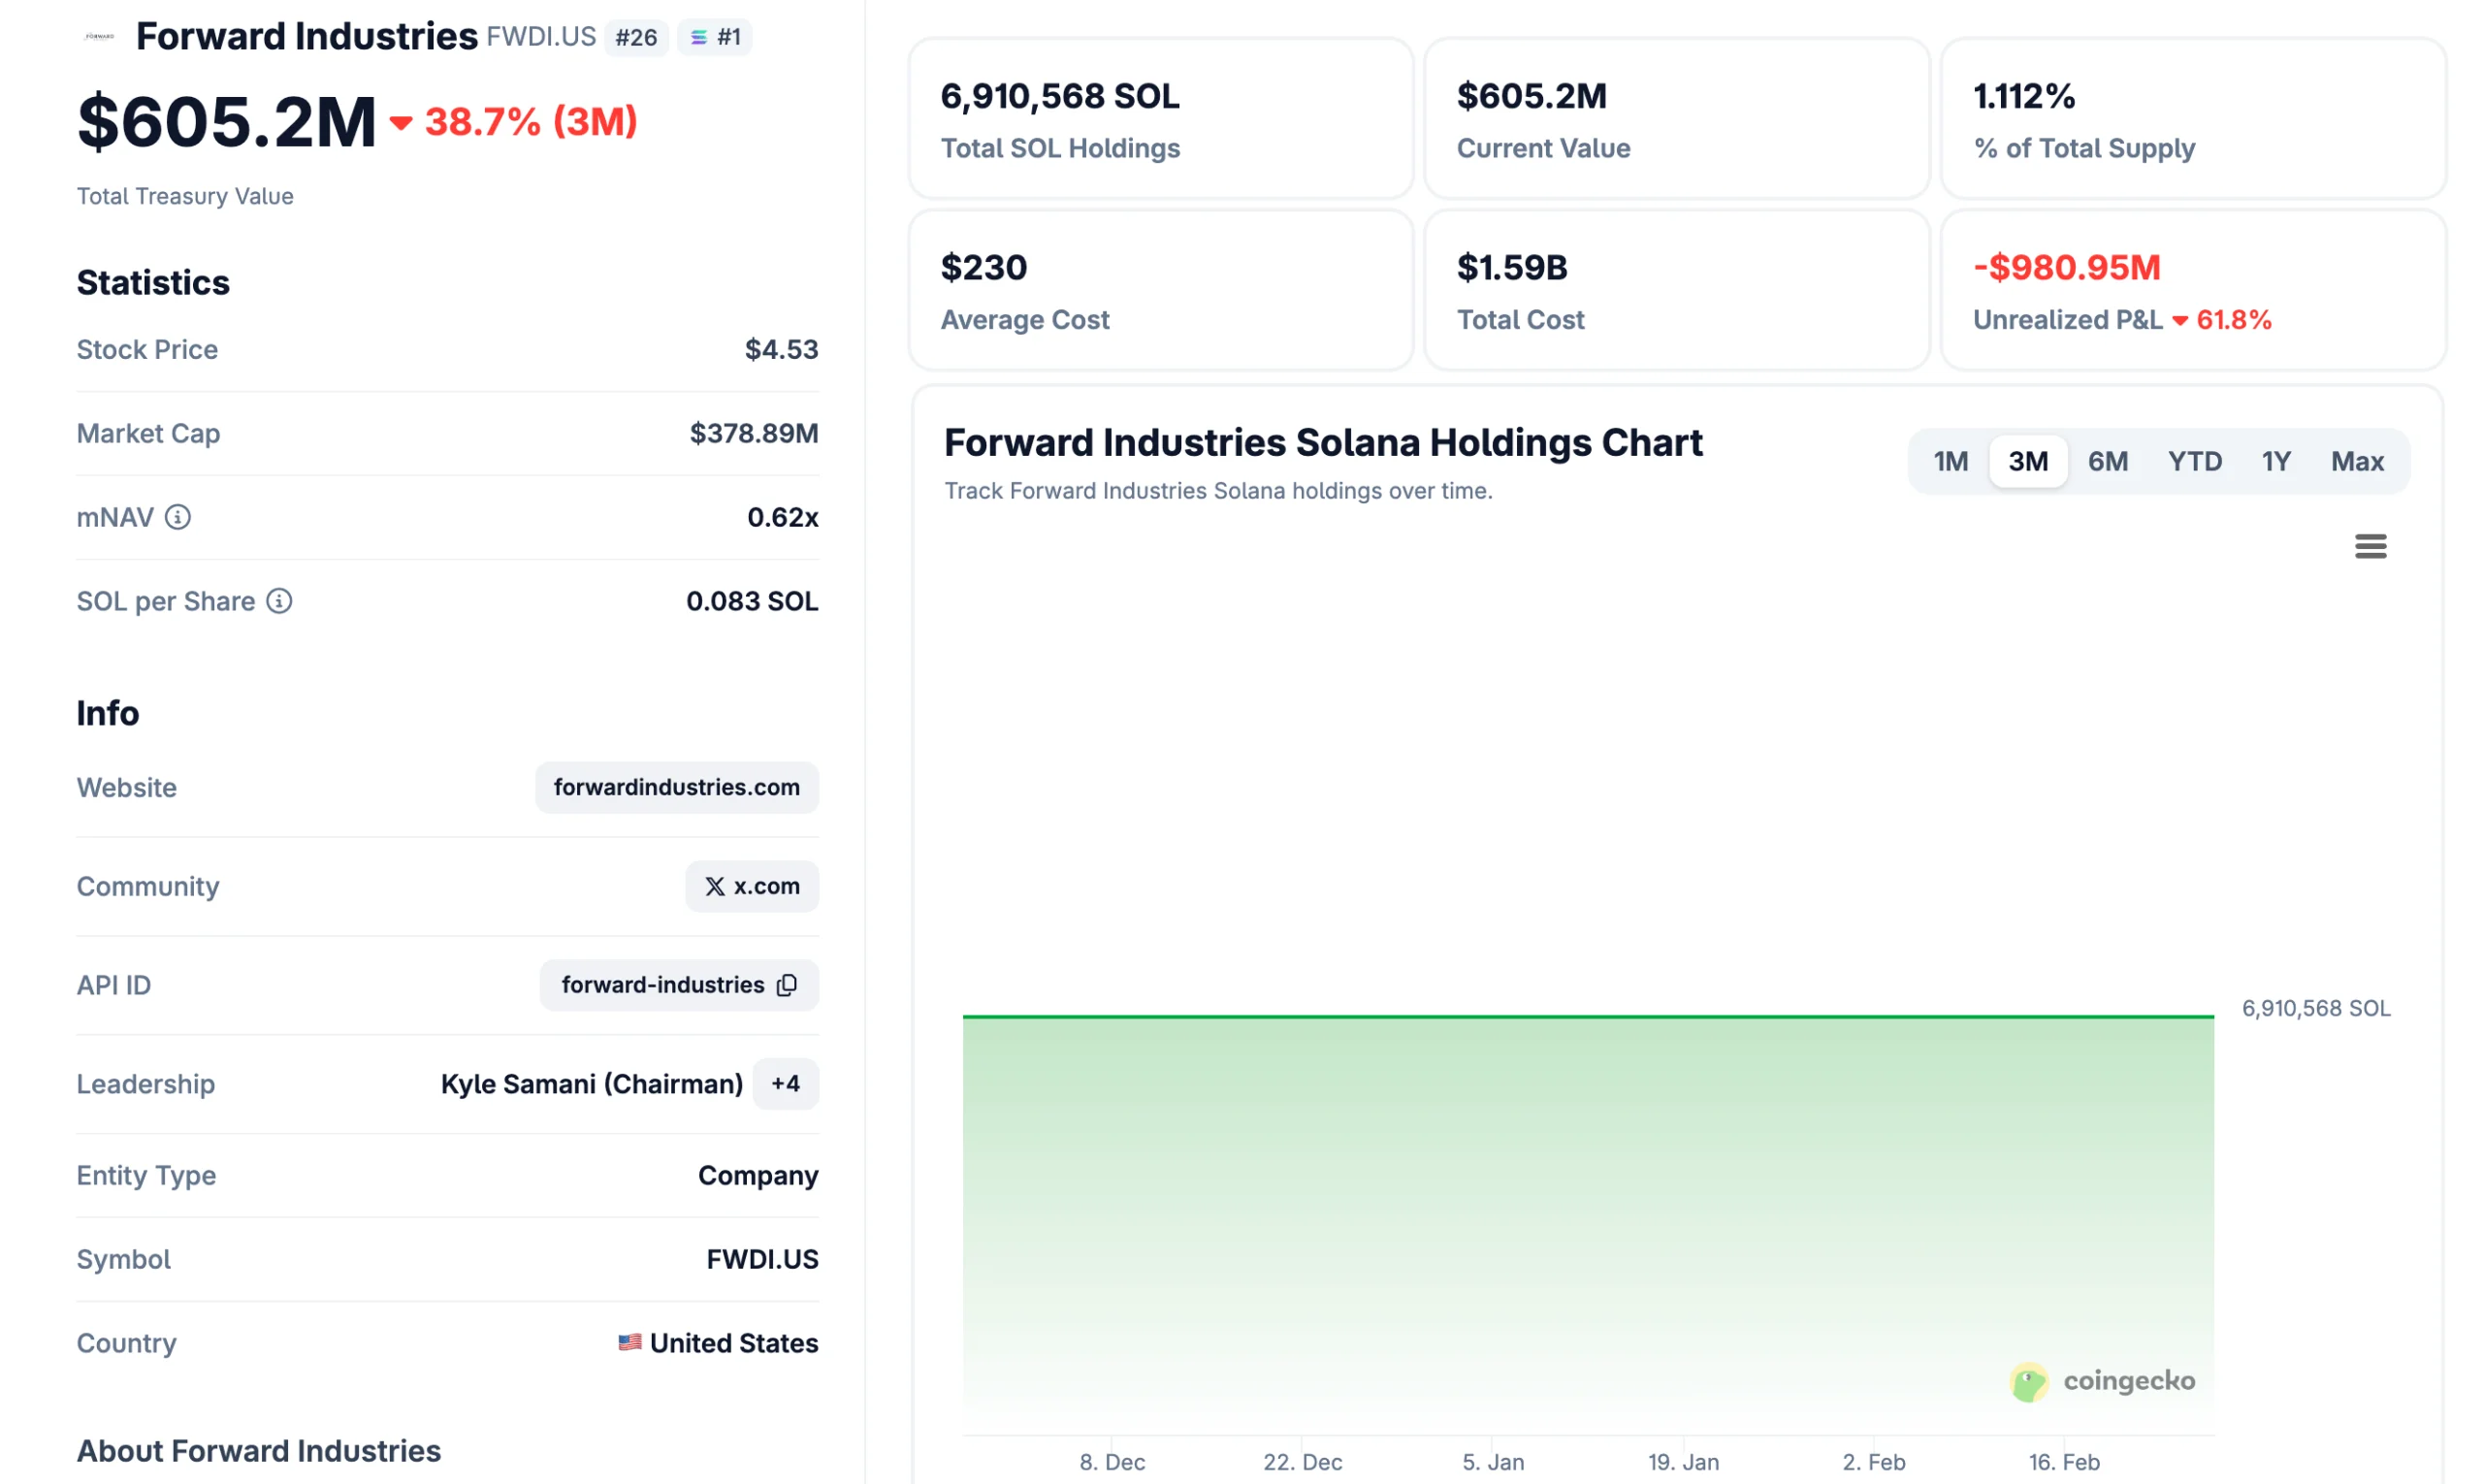
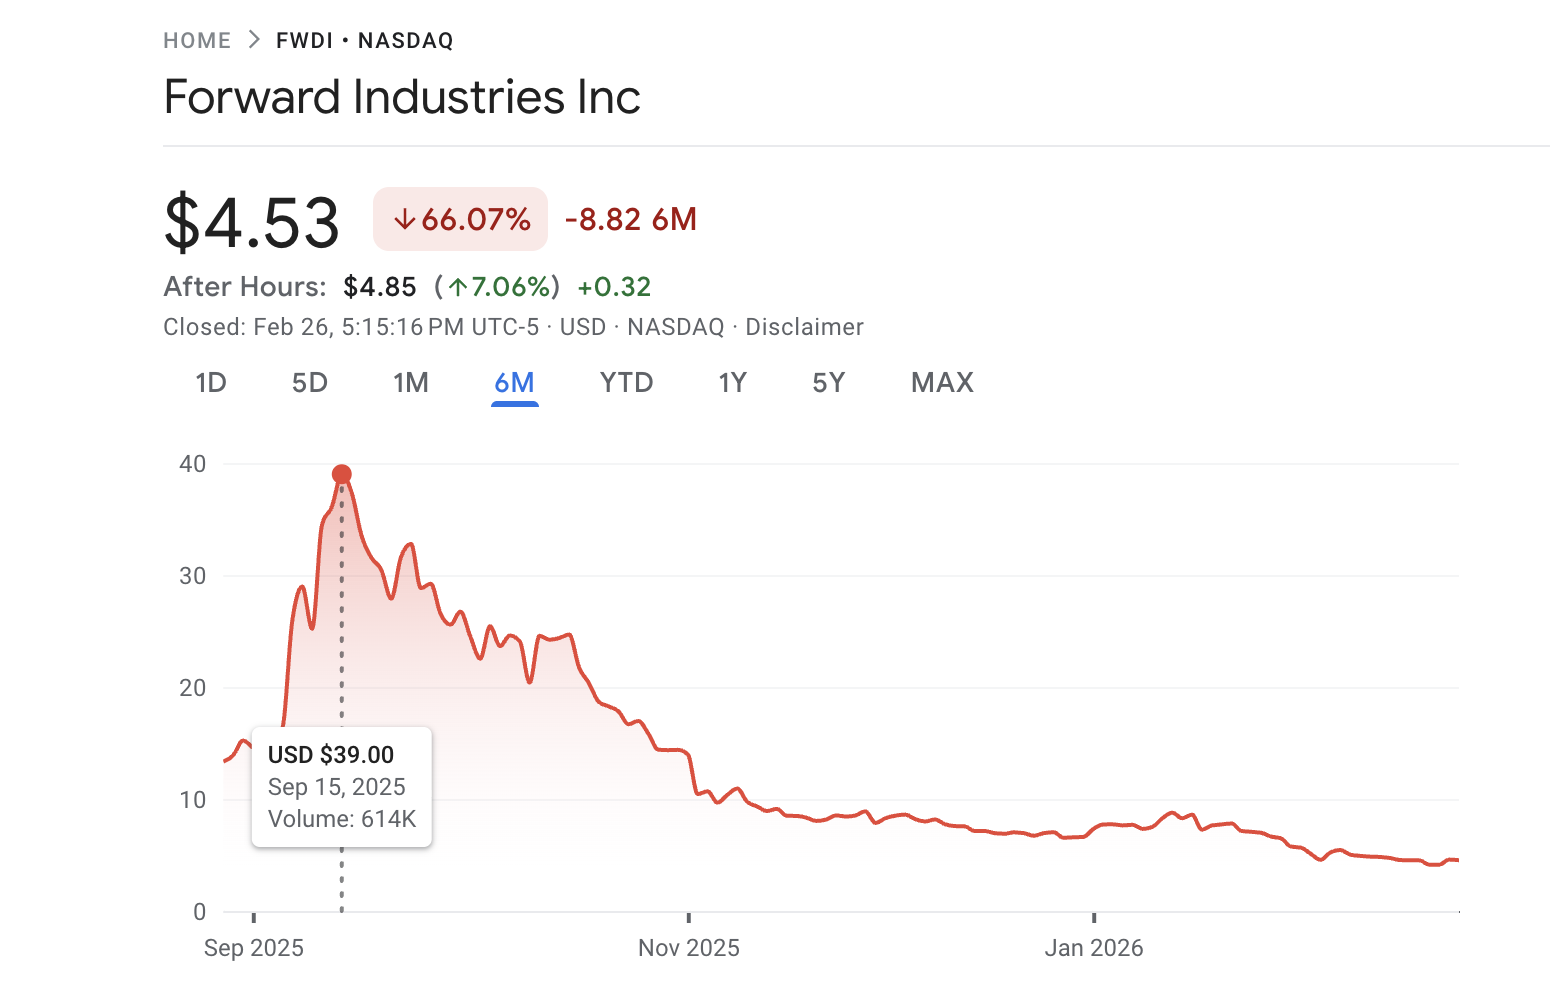
Forward Industries’ CIO says the company aims to become the “Berkshire Hathaway of the Solana ecosystem,” even as its treasury approaches $1 billion in unrealized losses.
The statement comes as SOL has declined nearly 30% year-to-date, a drop that is impacting balance sheets across major Solana-focused digital asset treasury (DAT) firms.
Solana’s Price Decline Deepens Institutional Pain
Forward Industries is the largest institutional holder of Solana. The company began accumulating SOL in September 2025 after raising approximately $1.65 billion through a private investment in public equity (PIPE), backed by Galaxy Digital, Jump Crypto, and Multicoin Capital.
According to the latest data from CoinGecko, it holds over 6.9 million SOL. The firm acquired its position at an average price of around $230 per token, implying a total cost basis of roughly $1.59 billion.
Follow us on X to get the latest news as it happens
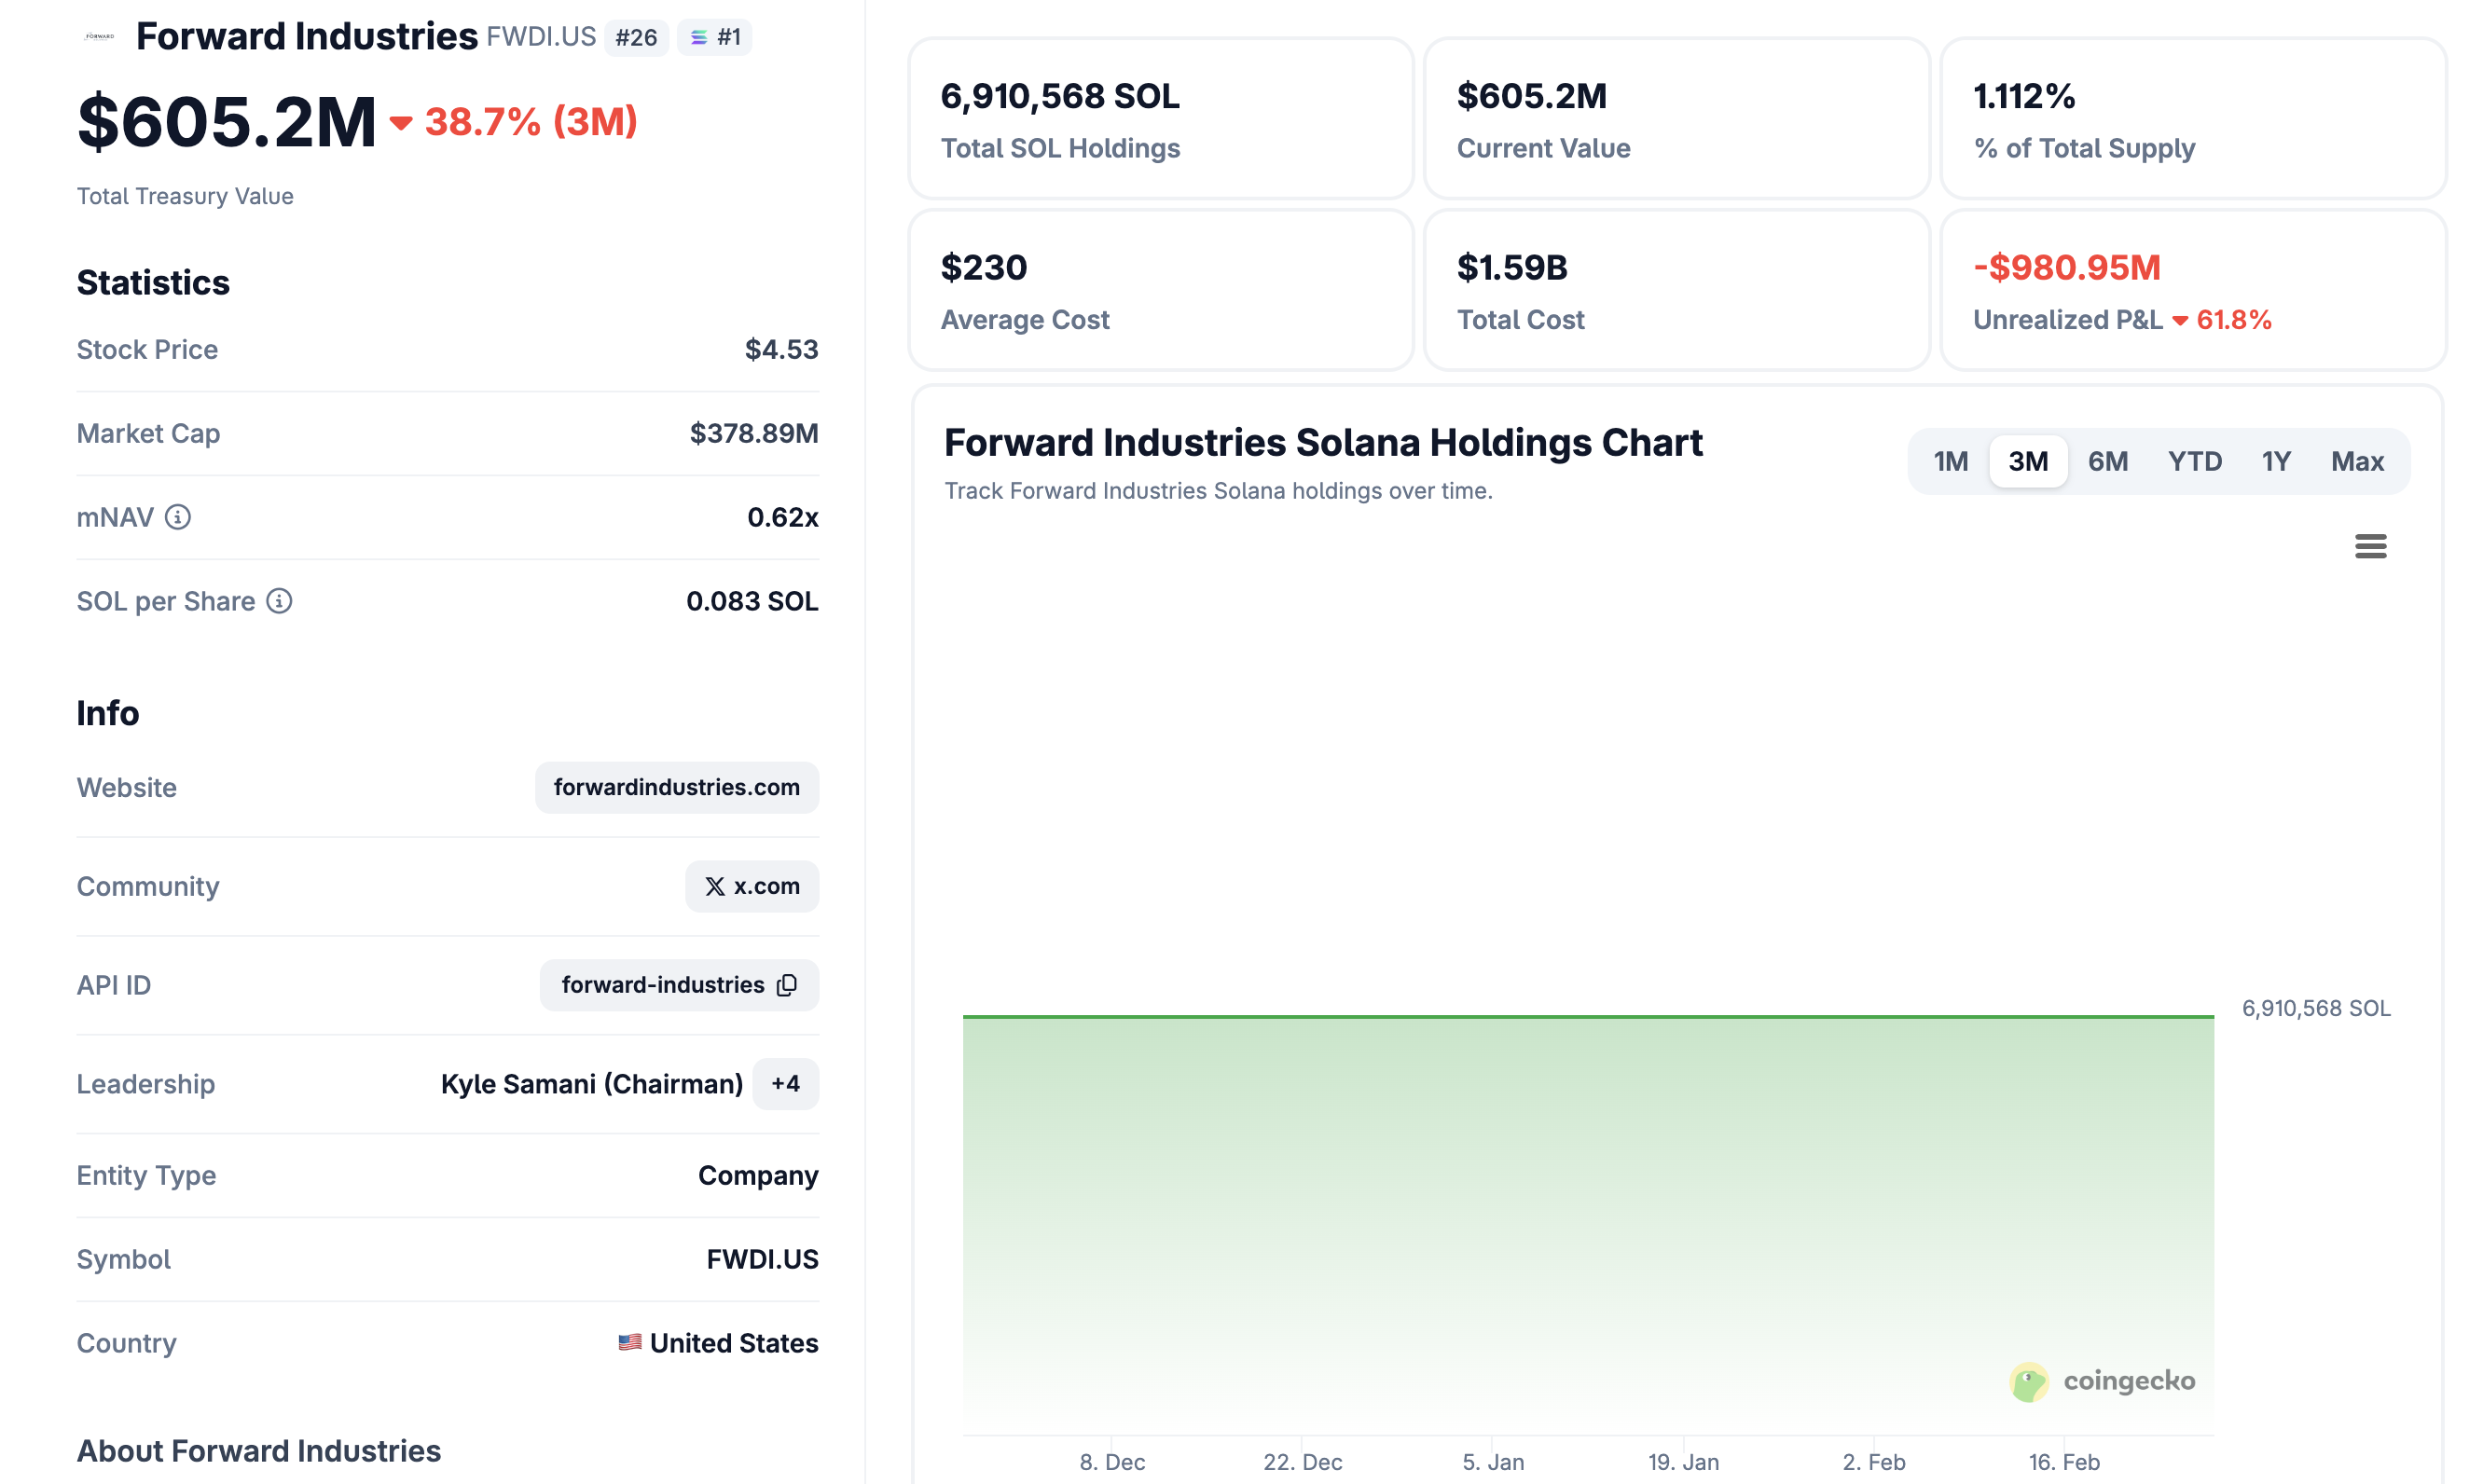
With the altcoin trading near $87, the company’s stake is now worth approximately $605.2 million. That represents an unrealized loss of nearly $1 billion, or roughly 62% from its average entry price.
Furthermore, FWDI shares have fallen from over $39 to roughly $5 since the company started buying SOL. According to Google Finance data, the stock price declined by 31.47% in 2026 alone.
Despite the drawdown, the firm’s conviction remains strong. Company leadership has outlined an ambitious long-term vision that transcends short-term volatility.
“Our longer-term aspiration is to be the Berkshire Hathaway of the Solana ecosystem. We believe Solana is best positioned as the blockchain for the future of internet capital markets,” Forward Industries’ CIO Ryan Navi said.
According to CoinGecko treasury data, Forward Industries is not alone. Firms like DeFi Development Corp, Upexi, and Sharps Technology are also sitting on significant unrealized losses as Solana’s price continues to slide.
The losses extend well beyond Solana-focused firms. Bitmine’s Ethereum (ETH) holdings have produced unrealized losses exceeding $7 billion. Meanwhile, Strategy’s Bitcoin (BTC) position carries paper losses of roughly $5 billion, according to Saylortracker data.
The broader DAT model, in which publicly listed companies hold crypto assets as their primary balance sheet instrument, is showing its vulnerabilities as a synchronized market decline compresses asset values while equity investors reprice risk.
Solana Launches “Solana Payments” Amid Ecosystem Momentum
Despite price struggles, ecosystem developments have continued. Yesterday, the team introduced Solana Payments, a new initiative to accelerate on-chain payment adoption.
According to the network, major players, including Visa, PayPal, Stripe, Western Union, and Fiserv, are running live products on the network, not just pilots. It also stated that the network has processed over 480 billion transactions and facilitates approximately $2 trillion in stablecoin transfers per quarter.
“Payments.org has everything you need to start building: Live payment simulator. Developer docs. Case studies from the biggest names in finance,” the post read.
Subscribe to our YouTube channel to watch leaders and journalists provide expert insights
Thus, while ecosystem development continues and institutional narratives remain ambitious, prolonged price weakness is testing balance sheets and investor confidence alike. Forward Industries’ bet on SOL’s long-term value may yet prove correct, but the timeline and the market’s patience for it remain open questions.
Ethereum just put a timestamp on its ambition, and the new roadmap could shape its price valuation. The Foundation’s new “Strawmap” (roadmap) targets a high-throughput settlement layer by 2029, cutting finality from around 16 minutes to seconds and aiming for 1 gigagas per second directly on Layer 1.
Instead of leaning almost entirely on Layer-2s for speed, Ethereum wants the base layer itself to become faster, tougher, and globally competitive with traditional financial rails.
Key Takeaways
- The Target: The roadmap aims for 10,000 TPS (1 gigagas/s) on Layer 1 and up to 10 million TPS on Layer 2 via data availability sampling.
- The Shift: Introduction of “Minimmit” single-slot finality intends to reduce transaction irreversible time from roughly 16 minutes to 6–16 seconds.
- The Timeline: Developers are planning seven hard forks on a six-month cycle through 2029 to implement these changes incrementally.
The Strawmap or Ethereum Roadmap: 10,000 TPS and Instant Finality
The big number is 10,000 TPS on Layer 1.
The Strawmap targets roughly 1 gigagas per second using zkEVMs and real-time proving. Today, transactions are included quickly but take around 16 minutes to reach finality. The new goal is 6 to 16 seconds, which is critical for serious financial use.
To get there, Ethereum plans up to seven hard forks through 2029. Slot times would gradually fall from 12 seconds to 8, and eventually toward near single-second blocks. That delays any push toward full “ossification” and prioritizes performance.

Vitalik has acknowledged that earlier assumptions about relying almost entirely on L2s need revision. If rollups are expected to process millions of TPS, the base layer must handle far more load itself.
For institutions, the message is clear. Ethereum wants to become a settlement infrastructure capable of supporting heavy, real-world financial flows without congestion.
Ethereum Roadmap: L1 Velocity vs. L2 Scale
For years, the message was simple: scale on Layer 2. The Strawmap adjusts that stance. Scale on L2, but make Layer 1 fast enough so it does not become the bottleneck. Ethereum is reacting to competitive pressure.
Vitalik has acknowledged that earlier assumptions about L2 reliance need updating. If rollups are expected to process millions of TPS, the base layer must comfortably handle around 10,000 TPS. Faster finality also matters for emerging AI-driven use cases, where agents require near-instant settlement to execute complex on-chain strategies.
The proposed shift toward techniques like erasure coding signals a deeper focus on data propagation and network efficiency. If successful, Ethereum strengthens its position as a high-speed settlement layer. If not, it risks ceding performance perception to faster, more centralized alternatives.
Ethereum Price Analysis: The Path to 2029 Valuation
The market reacted fast, with ETH whipping around the $2,060 area after the roadmap dropped. Long term, the plan gives investors a structural anchor. It signals Ethereum does not intend to fall behind faster monolithic chains.
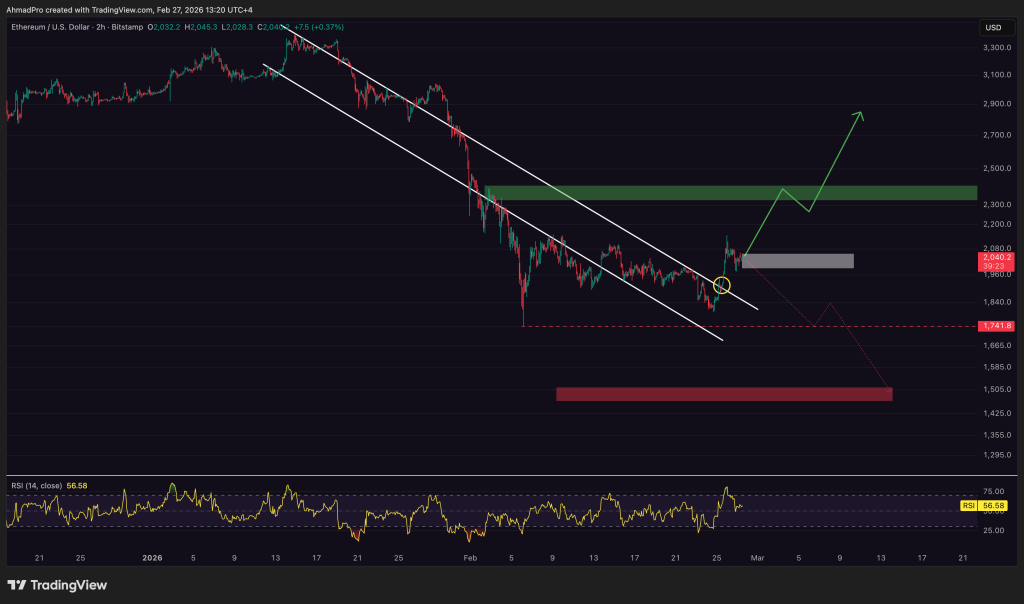
Technically, Ethereum price is compressing. $2,150 is the key resistance. A clean break there opens the path toward $2,400. On the downside, $2,000 is the short-term pivot, and $1,920 to $1,800 is the structural support zone if sentiment turns.
Execution risk matters. If slot-time reductions and early upgrades slip past late 2026, the market could reprice lower. The move toward erasure coding shows the Foundation is tackling core data bottlenecks. If it works, Ethereum strengthens its case as a high-speed settlement infrastructure. If not, it risks being overshadowed by faster alternatives.
For now, holding $2,000 keeps the bullish structure alive. Losing $1,920 would weaken the setup until a new catalyst appears.
Discover: Here are the crypto likely to explode!
The post Ethereum 2029 Roadmap: ETH to Become the High-Speed Internet of Value appeared first on Cryptonews.

Amanda Seyfried Sported A ‘Prosthetic Butthole’ In Testaments Of An Lee

Cheltenham Free Bets | Cheltenham Festival Betting Offers 2026

I’ve never considered buying a hi-res MP3 player, but this new A&K DAP has a feature so handy, I’m changing my mind


-

 Politics5 days ago
Baftas 2026: Awards Nominations, Presenters And Performers
-

 Fashion7 days ago
Weekend Open Thread: Boden – Corporette.com
-

 Sports4 days ago
Women’s college basketball rankings: Iowa reenters top 10, Auriemma makes history
-

 Politics4 days ago
Nick Reiner Enters Plea In Deaths Of Parents Rob And Michele
-

 Business3 days ago
True Citrus debuts functional drink mix collection
-

 Politics12 hours ago
ITV enters Gaza with IDF amid ongoing genocide
-

 Crypto World3 days ago
XRP price enters “dead zone” as Binance leverage hits lows
-

 Business5 days ago
Mattel’s American Girl brand turns 40, dolls enter a new era
-

 Business5 days ago
Law enforcement kills armed man seeking to enter Trump’s Mar-a-Lago resort, officials say
-

 Tech3 days ago
Unsurprisingly, Apple's board gets what it wants in 2026 shareholder meeting
-
 NewsBeat2 days ago
Manchester Central Mosque issues statement as it imposes new measures ‘with immediate effect’ after armed men enter
-

 NewsBeat1 day ago
Cuba says its forces have killed four on US-registered speedboat | World News
-
 NewsBeat4 days ago
‘Hourly’ method from gastroenterologist ‘helps reduce air travel bloating’
-

 Tech5 days ago
Anthropic-Backed Group Enters NY-12 AI PAC Fight
-

 NewsBeat5 days ago
Armed man killed after entering secure perimeter of Mar-a-Lago, Secret Service says
-

 Politics5 days ago
Maine has a long track record of electing moderates. Enter Graham Platner.
-
 NewsBeat3 days ago
Police latest as search for missing woman enters day nine
-

 Business1 day ago
Discord Pushes Implementation of Global Age Checks to Second Half of 2026
-
 Sports4 days ago
2026 NFL mock draft: WRs fly off the board in first round entering combine week
-

 Crypto World3 days ago
Entering new markets without increasing payment costs