Crypto World
Ethereum price hits key support as funding rate falls

Ethereum price continued its strong downward trend this week, reaching its lowest level since May last year.
Summary
- Ethereum price dropped to a crucial support level as the crypto market crash accelerated.
- Its liquidations jumped to the highest level in months.
- Ethereum’s weighted funding rate dropped to its October lows.
Ethereum (ETH) token dropped to a low of $1,768, down by 60% from its all-time high. This retreat coincided with the broader crypto market crash as retail and some institutional investors dumped the coin.
Data compiled by SoSoValue shows that American investors have sold Ethereum ETFs worth $149 million this year. January is the fourth consecutive month that these funds have shed assets.
Additional data show that Ethereum bulls were heavily liquidated as the crash continued. Ethereum positions worth nearly $2 billion were liquidated since January 31, the highest figure since Oct. 10 when positions worth over $3.8 billion were wiped out.
Most importantly, the weighted funding rate turned negative and fell to its lowest level since Oct. 10. A negative funding rate indicates that investors anticipate the coin will decline. It happens when shorts are paying long positions in the perpetual futures market.
On the positive side, Ethereum’s network is doing well, with Nansen data showing a surge in transactions, fees, and active addresses. Ethereum handled 70 million transactions in the last 30 days, while the number of active addresses rose by 42% to over 15 million.
It also holds a leading market share across sectors in the crypto industry, including stablecoins, decentralized finance, and real-world asset tokenization. These fundamentals may help fuel its long-term recovery.
Ethereum price technical analysis

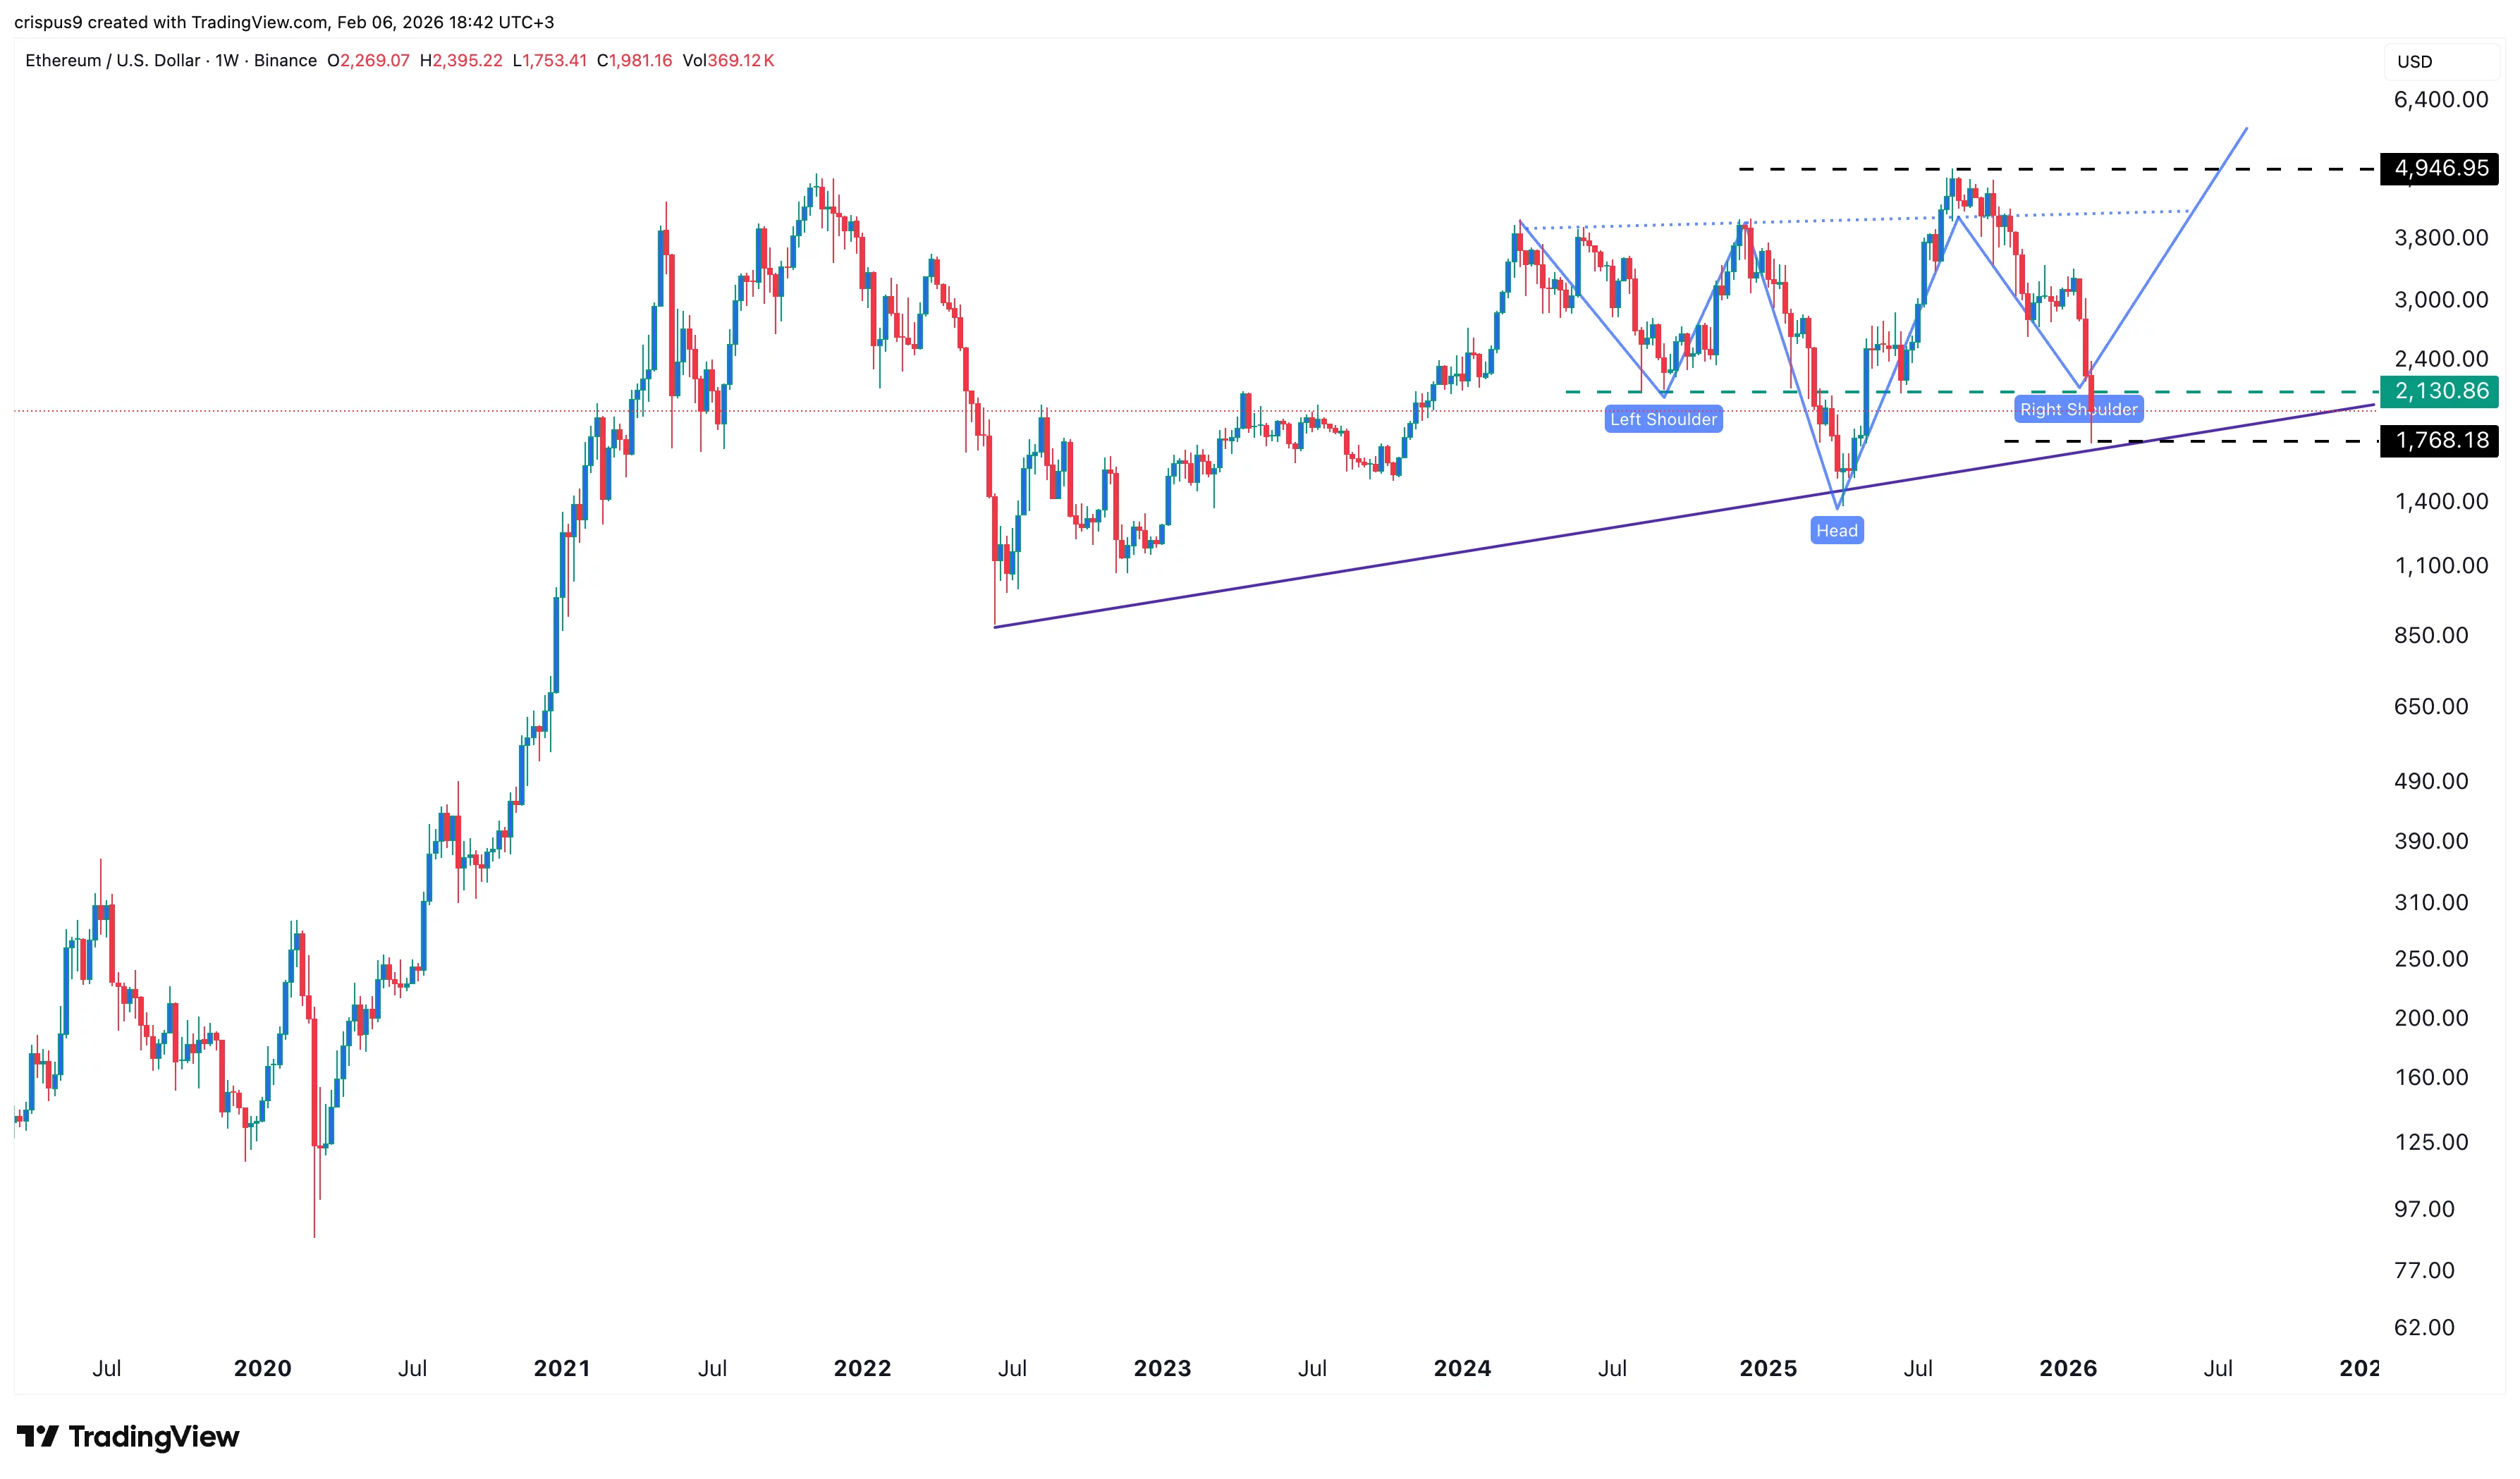
The weekly chart shows that ETH price has pulled back in the past few months. It has dropped from a record high of $4,950 to a low of $1,7686 today. Its lowest point was notable because it coincided with the ascending trendline connecting the lowest levels in June 2022 and April last year.
The price was also important because it was near the left shoulder of the inverted head-and-shoulders pattern. This pattern is one of the most common bullish reversal signs in technical analysis.
Therefore, a weekly close above $2,130 will point to a reversal, potentially to $3,000. On the other hand, a close below the support at $1,768 will invalidate the bullish outlook.
You must be logged in to post a comment Login