
Crypto World
Ethereum price near $2,150 as buy zone call returns

Ethereum (ETH) has returned to focus after new market data pointed to a possible bullish setup. Analysts are tracking valuation metrics, treasury buying, and exchange flows as ETH tries to build on its recent rebound.
Summary
- Ethereum price entered a buy zone after MVRV fell below 0.8, matching past cycle bottom signals.
- Bitmine bought $140 million in ETH this week, raising holdings toward its 5% supply target.
- Coinbase premium stayed negative, showing weaker U.S. demand even as Ethereum posted a sharp rebound.
The latest discussion centers on Ethereum’s Market Value to Realized Value ratio, or MVRV, which has moved below 0.8. At the same time, Bitmine has expanded its Ethereum holdings, while Coinbase premium data has shown weaker demand from U.S. buyers.
Crypto analyst Ali Martinez said Ethereum may have entered a “generational buy zone” after the MVRV ratio dropped below 0.8. He linked that reading to earlier market bottoms that later led to strong recoveries.
Martinez also said Ethereum’s recent rebound was not random. He pointed to past cycles when similar retests were followed by rallies ranging from 149% to 587% after bottoms formed in 2018, 2020, and 2022.
Ethereum posted a 7% rebound on Monday and briefly reached $2,186. At the time of reporting, ETH traded at about $2,152, holding part of that recovery after bouncing from lower levels.
The setup has drawn attention because Ethereum remains far below its prior cycle peak. That has kept valuation models and recovery signals at the center of current market coverage.
Arkham Research reported that Tom Lee’s Bitmine added $140.74 million worth of Ethereum over the past seven days. That pushed the company’s total Ethereum holdings to about $10.03 billion.
The report said Bitmine now controls around 3.86% of Ethereum’s circulating supply. Its stated target is to accumulate 5% of the supply, which would require further large purchases in the coming weeks.
Arkham also compared Bitmine’s pace with Strategy’s recent Bitcoin buying. While Strategy added about $76.6 million in Bitcoin this week, Bitmine’s Ethereum purchases were larger during the same period.
That treasury activity has added another layer to the Ethereum story. Market participants are now watching whether steady institutional buying can support price strength if broader demand improves.
Coinbase premium shows weak U.S. demand
CryptoQuant analyst Arab Chain said Ethereum’s Coinbase Premium Index fell to about -0.0149. That reading means Binance priced ETH above Coinbase, which points to softer demand from U.S. buyers.
The data suggests that global trading activity remains stronger than buying activity on Coinbase. It also shows that the recent rebound has not yet gained firm support from U.S. spot demand.
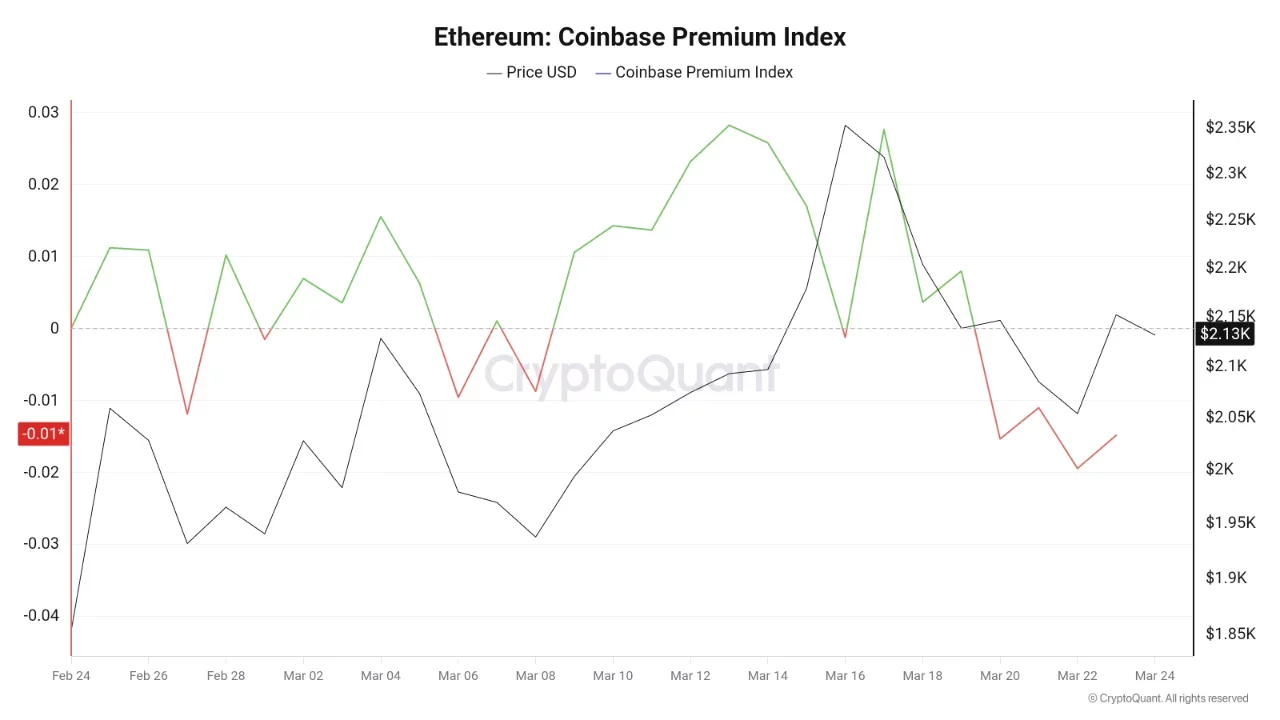
A negative premium often signals weaker appetite or selling pressure on Coinbase. If that gap remains in place, it may limit the strength of Ethereum’s recovery in the near term.
If the premium moves back toward zero or turns positive, it could signal stronger U.S. buying flows. That shift would give Ethereum another support factor as traders assess the next move.
Disclosure: This article does not represent investment advice. The content and materials featured on this page are for educational purposes only.

Bitcoin (BTC) has been among the best-performing assets amid the US–Iran war, but signs of upside exhaustion are emerging due to an “out-of-control” bond market.
Key takeaways:
-
US benchmark yields may rise by 200 basis points if the US–Iran war drags on further.
-
Past oil-linked conflicts boosted inflation and reduced risk appetite, hinting BTC price may decline below $50,000 in 2026.
Oil shock may send US yields soaring over 5%
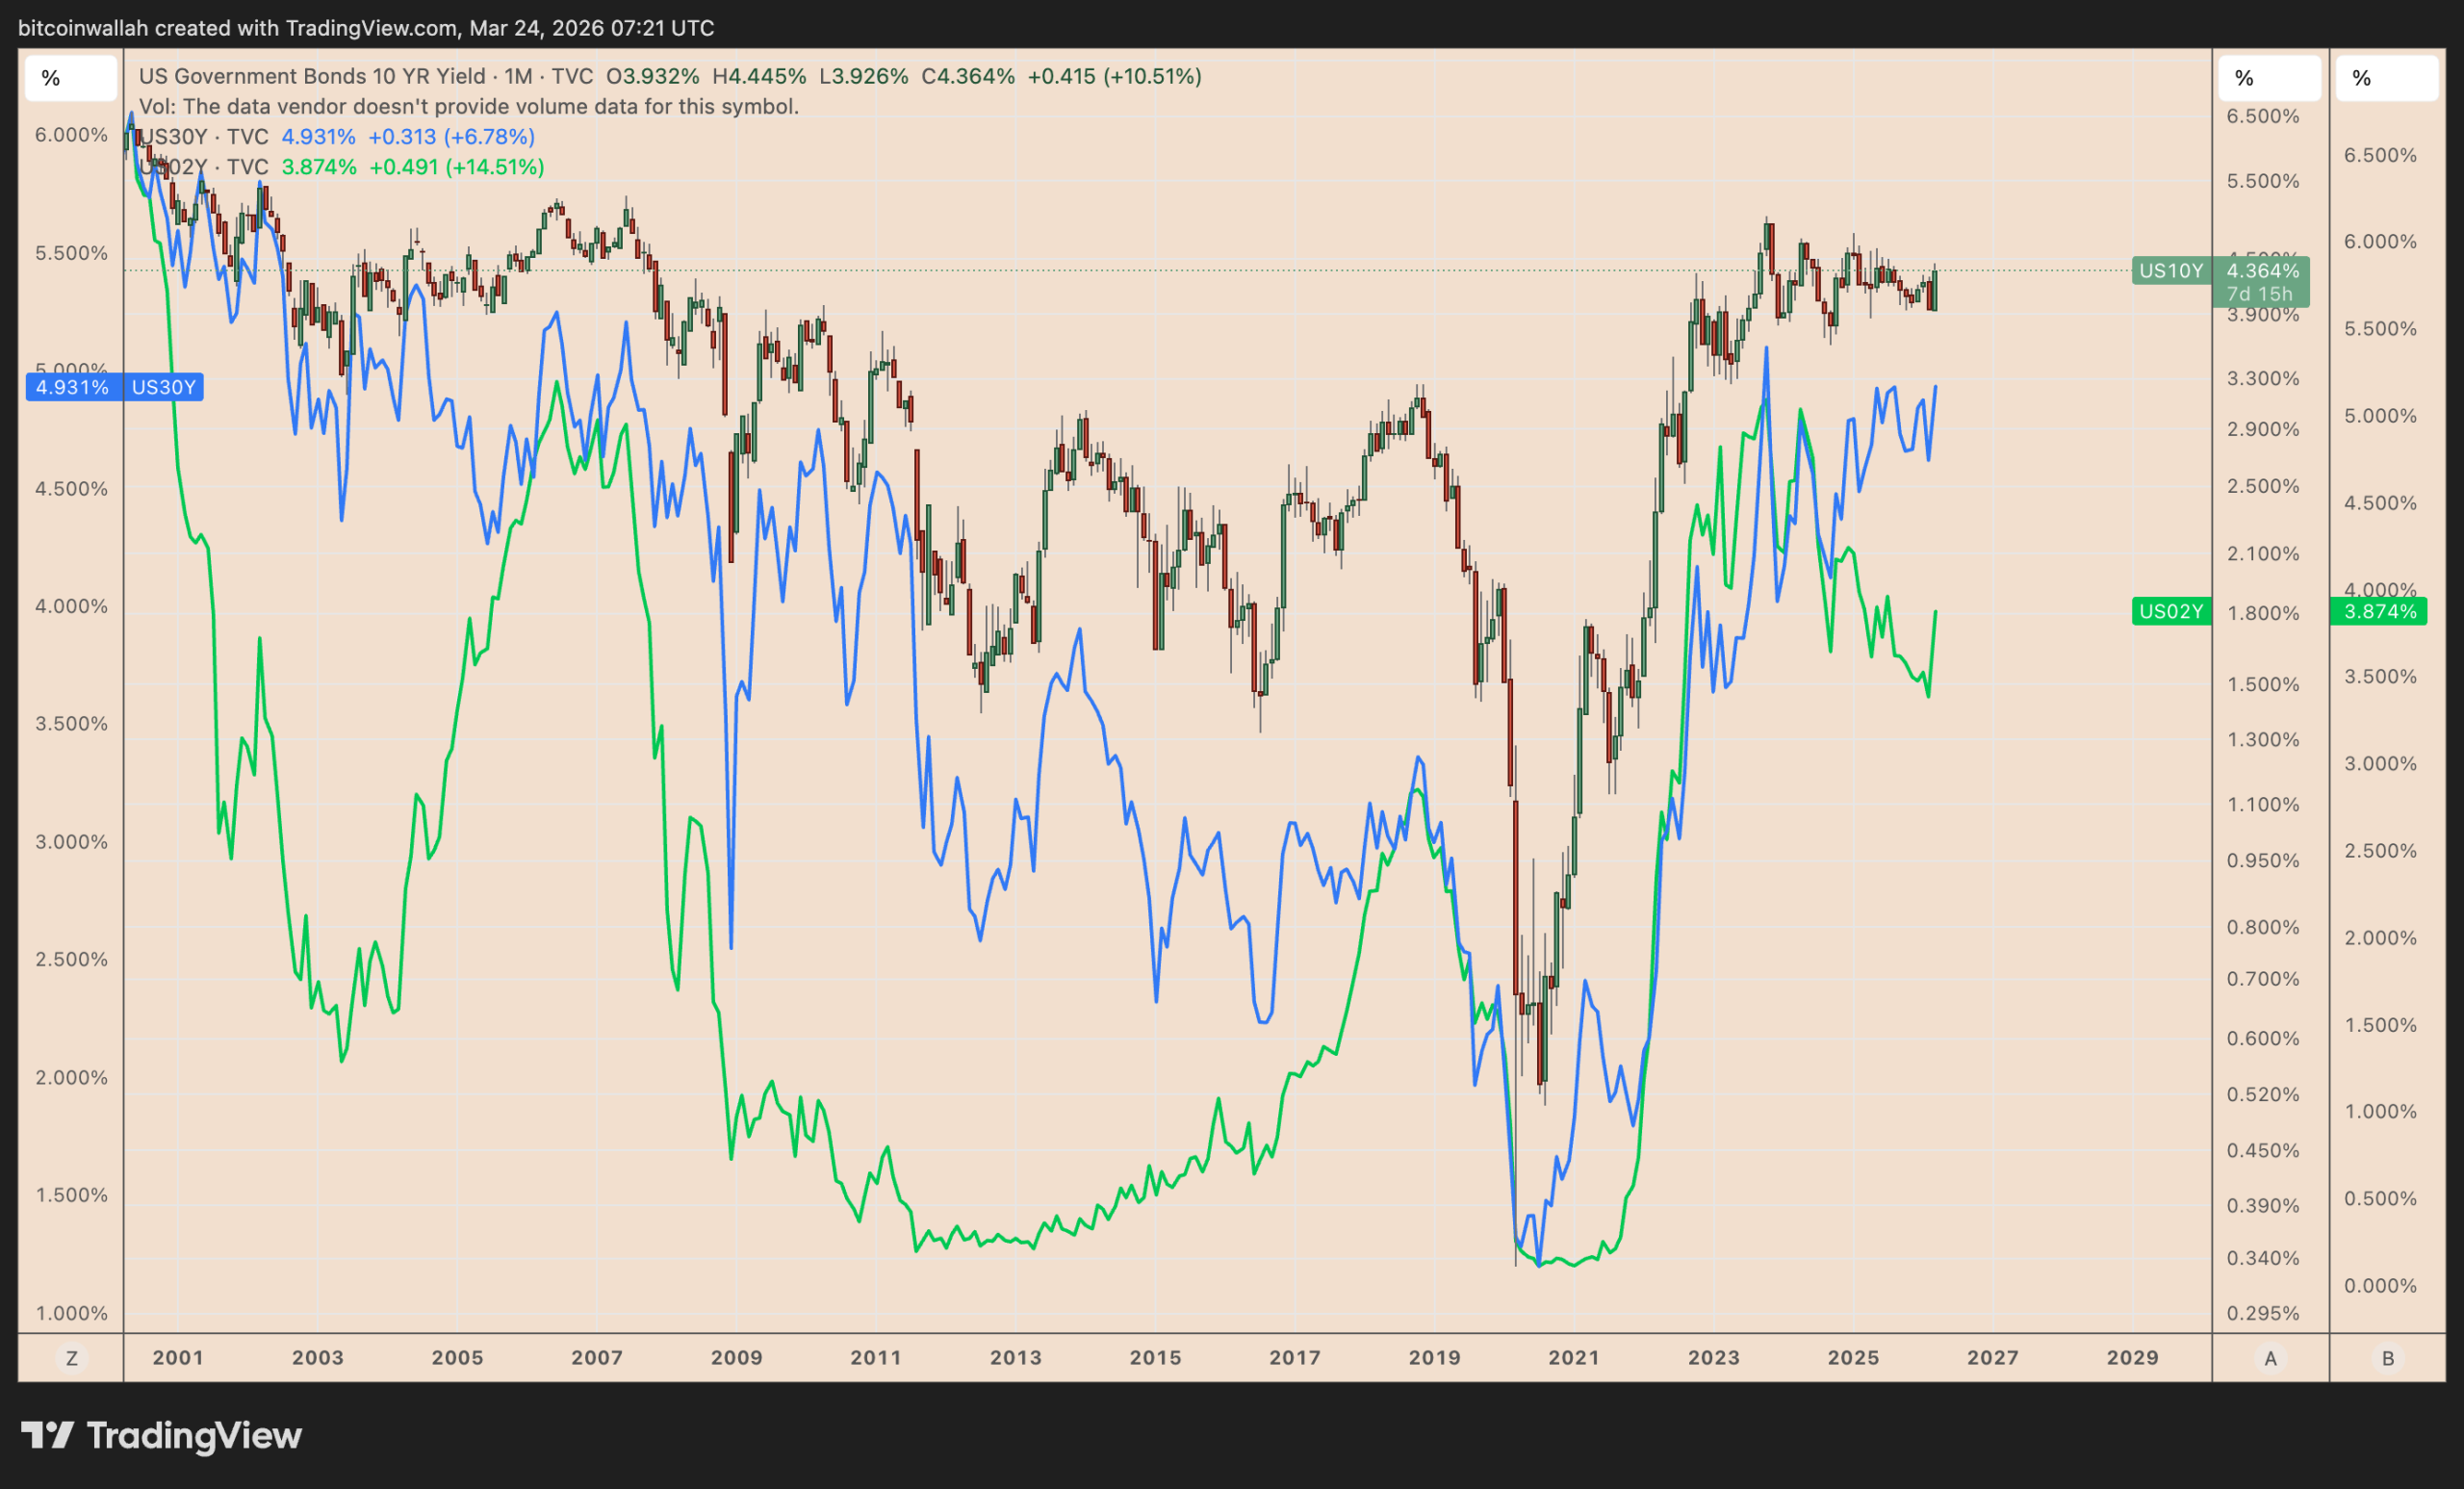
Since Feb. 28, when the US and Israel attacked Iran, the benchmark 10-year Treasury yield has climbed to about 4.42%, its highest in nine months.

The 30-year yield rose to roughly 4.97%, while the 2-year yield pushed up toward 3.95%–3.98%.
Treasury yields have climbed as the war-driven oil spike fuels fears of higher inflation, which, in turn, increases odds of zero rate cuts in 2026.
President Donald Trump’s five-day pause has eased immediate fears of strikes on Iran’s energy sites. But the war remains far from contained since Iran has denied any negotiations and cross-border attacks were ongoing as of Tuesday.

That is prompting fears of further rises in US bond yields among market watchers, with technical chartists further anticipating the 10-year yield to reach 6.4%, a 200 basis point jump, if it breaks out from its symmetrical triangle pattern.

Higher yields reduce the opportunity cost of holding risk assets like stocks and Bitcoin. A US 10-year yield jump above 5% may trigger sell-offs in the BTC market if it continues to behave like a risk asset.
Oil shocks in the past
In the past, short oil-linked conflicts triggered sharp but brief moves in yields and stocks, while prolonged supply shocks pushed yields higher and kept pressure on equities.
During the 1973 Yom Kippur War and Arab oil embargo, yields rose modestly at first before climbing as inflation took hold, while the S&P 500 fell about 41%–48% during “stagflation.”

The 1979 Iranian Revolution saw a stronger bond-market reaction, with the 10-year yield rising roughly 150–200 basis points over the following year, while stocks saw a milder drawdown.
In the 1990–91 Gulf War, the 10-year yield rose about 50–70 basis points and the S&P 500 fell roughly 16%–20% before rebounding once the conflict was contained.
The 2022 Russia–Ukraine war also coincided with higher yields and an initial 5%–10% drop in the S&P 500.
Related: What happens to Bitcoin if oil price hits $180 per barrel?
The current US and Israel–Iran war appears to fit the early stage of that pattern. If the conflict drags on and oil stays high, yields could rise further and risk assets could face another leg lower.
For Bitcoin, which remains tightly correlated to S&P 500, that would likely mean deeper downside pressure unless the war de-escalates quickly.
How low can the Bitcoin price go?
From a technical perspective, Bitcoin price may drop to $50,000 or lower in the coming months if it breaks out of its prevailing bear flag pattern.

These projections broadly align with prediction market bets, where traders currently set a 70% probability that Bitcoin falls below $55,000 in 2026 and a 46% chance of a drop below $45,000.
BitMEX co-founder Arthur Hayes said that an extended US–Iran war may force the Federal Reserve to loosen its monetary policy, which will be bullish for Bitcoin.
“The longer this conflict goes on, the higher the likelihood that the Fed has to print money to support the American war machine,” he said, adding:
“That’s when I’m going to buy Bitcoin when the central banks start printing money.”
This article does not contain investment advice or recommendations. Every investment and trading move involves risk, and readers should conduct their own research when making a decision. While we strive to provide accurate and timely information, Cointelegraph does not guarantee the accuracy, completeness, or reliability of any information in this article. This article may contain forward-looking statements that are subject to risks and uncertainties. Cointelegraph will not be liable for any loss or damage arising from your reliance on this information.

A coalition of Ethereum developers has unveiled a dedicated resource hub focused on shielding the blockchain from quantum computing threats and the vast value the network secures. The Post-Quantum Ethereum project, hosted at pq.ethereum.org and launched this week by members of the Ethereum Foundation, signals a concerted effort to introduce quantum‑resistant measures at the protocol level within the next decade, followed by execution-layer updates.
Despite a lack of an immediate quantum danger to cryptography-secured blockchains, the team argues that action must begin early. Migrating a decentralized, global protocol requires years of coordination, engineering, and formal verification, and the work should start long before any threat materializes.
Key takeaways
- Ethereum aims to implement post-quantum solutions at the protocol layer by 2029, with execution-layer changes to come afterward.
- The initiative prioritizes protecting standard wallets first, then high-value operational wallets tied to exchanges, bridges, and custody providers.
- SNARK-based (zero-knowledge) signatures are central to the plan, aiming to bolster security without breaking the network’s verification properties.
- Deploying post-quantum upgrades will require careful orchestration to avoid new bugs, attack surfaces, and performance regressions while upgrading hundreds of millions of accounts.
- Industry voices highlight a spectrum of views on quantum risk—ranging from vulnerability limited to exposed public keys to claims that all coins could be at risk.
Post-Quantum Ethereum: a roadmap for resilience
The Post-Quantum Ethereum initiative frames its mission around building a defense-in-depth against quantum threats. The team outlines a multi-layer strategy that spans the network’s consensus, execution, and data layers, with the explicit aim of protecting the largest pools of value in the ecosystem—primarily standard wallets and the custodial and exchange infrastructure that interacts with them.
A core element of the plan is the integration of post-quantum cryptographic techniques into Ethereum’s signature schemes. While several approaches exist, the team underscored that a complete transition is not simply a matter of selecting a quantum-resistant algorithm. The harder challenge lies in safely upgrading hundreds of millions of accounts, preventing migration-induced bugs, avoiding the introduction of new attack vectors, maintaining performance, and coordinating ecosystem-wide adoption.
To this end, the project emphasizes the potential role of SNARKs—zero-knowledge proofs that enable compact verification of complex statements without revealing underlying data. By embedding SNARK-based signatures into the security stack, the team hopes to mitigate risks associated with quantum-era cryptography while managing the computational overhead that such proofs can impose. The overarching goal is to preserve user experience and throughput as the protocol evolves.
Early work will concentrate on wallet security, given the concentration of value in everyday user funds. Beyond individual wallets, the plan also targets high-value operational wallets associated with exchanges, cross-chain bridges, and custody solutions—areas deemed critical to ecosystem continuity during a transition period.
As with any fundamental upgrade of a global blockchain, the Post-Quantum team acknowledges that the main hurdle is deployment. The team’s rhetoric centers on a cautious but deliberate approach: choosing a robust post-quantum algorithm is only part of the equation. Safely upgrading hundreds of millions of accounts, moving through formal verification, and ensuring seamless interoperability across diverse client implementations will require extensive coordination and testing.
Choosing a post-quantum algorithm is only part of the challenge. The harder parts include safely upgrading hundreds of millions of accounts, preventing the migration from introducing new bugs, avoiding new attack surfaces, maintaining performance, and coordinating ecosystem-wide adoption.
The effort sits within a broader conversation about how the crypto space should prepare as quantum capabilities advance. Industry observers have debated whether the risk is narrowly scoped to wallets with exposed public keys or whether a full-system risk exists across all digital assets. Some analysts argue that only a subset of wallets may be immediately vulnerable, while others warn that every asset could face exposure if standard cryptographic assumptions are invalidated by quantum breakthroughs.
Context: where quantum concerns stand today
Quantum risk has long been a topic of discussion as researchers explore practical quantum computers. In the crypto space, the debate often centers on wallet security and the longevity of cryptographic keys. Analysts have stressed that the moment quantum capabilities threaten the generalized security of digital signatures will depend on breakthroughs in hardware, algorithms, and the ability to coordinate network-wide upgrades without service interruption.
Within Ethereum’s ecosystem, the stakes are especially high because the network’s value is secured by a vast and active user base, a broad set of decentralized applications, and a sprawling array of custodial services. The Post-Quantum Ethereum project is positioned as a proactive blueprint to navigate the trade-offs between security and performance while preserving a seamless user experience during a transition.
What to watch next
As 2029 approaches, observers will be looking for concrete milestones on the Post-Quantum Ethereum path: concrete algorithm candidates, testnet experiments for post-quantum signatures, performance benchmarks, and progress on the governance and tooling needed to coordinate the upgrade across clients and ecosystems. The balance between robust security and network efficiency will likely shape how quickly and widely post-quantum solutions gain traction.
In the near term, the focus remains on building resilient foundations—community consensus, rigorous verification, and a staged rollout plan that minimizes disruption to users while laying the groundwork for a quantum-resistant Ethereum.
Readers should keep an eye on updates from the Ethereum Foundation and the Post-Quantum Ethereum team, including any published milestones, proposed standards, and testnet exercises that will illustrate how the network adapts to a potentially quantum-powered future.
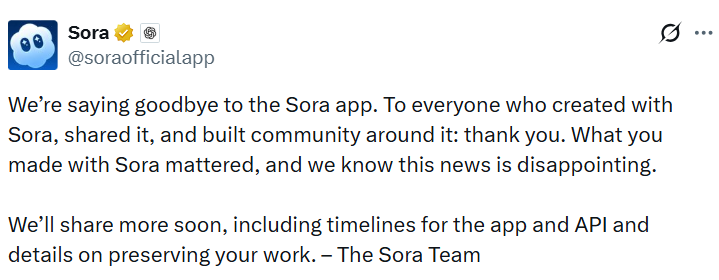
OpenAI has announced it is shutting down its video generation platform Sora after just six months, with CEO Sam Altman reportedly telling staff the company is winding down all of its video products.
“We’re saying goodbye to the Sora app,” Sora posted to X on Tuesday. “We know this news is disappointing. We’ll share more soon, including timelines for the app and API and details on preserving your work.”
Sora was released in September to a buzzy reception as the ChatGPT maker sought to make inroads on short-form video content popular across TikTok and Meta’s Instagram.
However, the app also faced backlash over concerns that it would further the proliferation of realistic deepfakes. OpenAI cracked down on some deepfakes generated by its platform after pressure from celebrities.

Products using video models on the chopping block
Altman told staff the company was winding down products that used video models, including the developer version of Sora and the app’s video functionality in its generative AI chatbot ChatGPT, The Wall Street Journal reported on Tuesday.
Altman also said the Sora team will shift its focus to longer-term bets such as robotics, amid a company-wide redirect to concentrate on productivity tools for enterprises and individual users.
Related: OpenAI wins defense contract hours after government ditches Anthropic
OpenAI launched Sora last year as a text-to-video generator, and it racked up 1 million downloads in just five days. Data analytics firm Sensor Tower estimates that last month, Sora was downloaded around 600,000 times.
Disney deal not moving forward
In December, the Walt Disney Co. signed a three-year licensing agreement to become Sora’s first major content partner, giving users access to more than 200 characters from franchises including Marvel, Pixar and Star Wars.
A Disney spokeswoman told The Wall Street Journal that the deal, which included a $1 billion equity investment in OpenAI, will not move forward.
Cointelegraph contacted OpenAI and Disney for comment.
The AI market has been the subject of significant hype. It’s projected to be worth more than $4.8 trillion by 2033, affect 40% of jobs and emerge as a dominant frontier technology.
Magazine: Google flags crypto malware, retiree loses $840K in ‘expert’ scam: Hodler’s Digest, Mar. 15 – 21
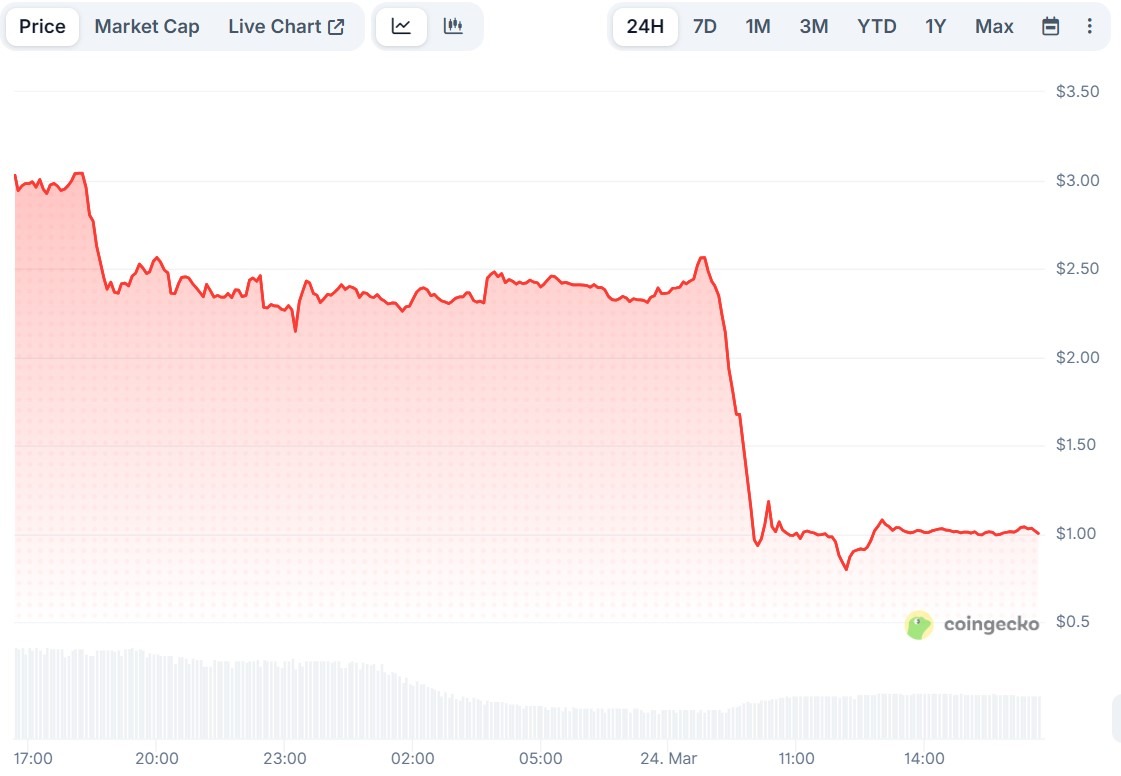
The Siren (SIREN) token plunged nearly 70% on Tuesday, reversing a rapid rally as onchain analysts warned that a small cluster of wallets may control a large share of the token’s supply.
According to CoinGecko data, the token dropped nearly 70% from a high of $2.56 early Tuesday to a low of $0.79 on the same day. At the time of writing, Siren hovered around $1.
The sell-off followed a steep run-up in SIREN, a BNB Chain token marketed as an AI analyst agent. Analysts at Bubblemaps and the pseudonymous researcher EmberCN said Monday that wallet data suggested the token’s holdings were highly concentrated.
While the relationship between the claims and the price move remains unclear, the volatility highlights risks tied to thin liquidity and concentrated holdings.

Siren’s 70% drop follows wallet concentration warnings
SIREN rallied to $2.81 on Monday, up 340% from its price of $0.63 on March 16. CoinGecko data showed that in the last month, the token rose by nearly 1,300% from $0.22.
On Monday, a pseudonymous onchain analyst, EmberCN, warned traders that the token’s surge was due to a party cornering nearly all spot supply to profit from contracts.
Related: ‘Hawk Tuah’ girl Haliey Welch says memecoin implosion ‘traumatized’ her
Citing an unverified custom entity created by Arkham Intelligence, EmberCN pointed out that a single entity may be in control of 644 million SIREN, worth about $1.8 billion at the time. This amount accounts for 88% of the entire circulating supply of 728 million tokens.
On Tuesday, blockchain analytics company Bubblemaps shared a visual representation of wallet clusters surrounding Siren. According to the company, one entity controls about 50% of the circulating supply of tokens worth about $1 billion.

According to Bubblemaps, Siren was “largely abandoned” after its launch back in February 2025. The company said that a cluster of over 200 wallets was funded via PancakeSwap and purchased the token in two batches before dispersing them into 47 wallets.
“This only ends one way,” Bubblemaps wrote, implying that if a single party controls the supply, a sharp sell-off may follow.
Magazine: Banks want to run Vietnam’s crypto exchanges, Boyaa’s $70M BTC plan: Asia Express
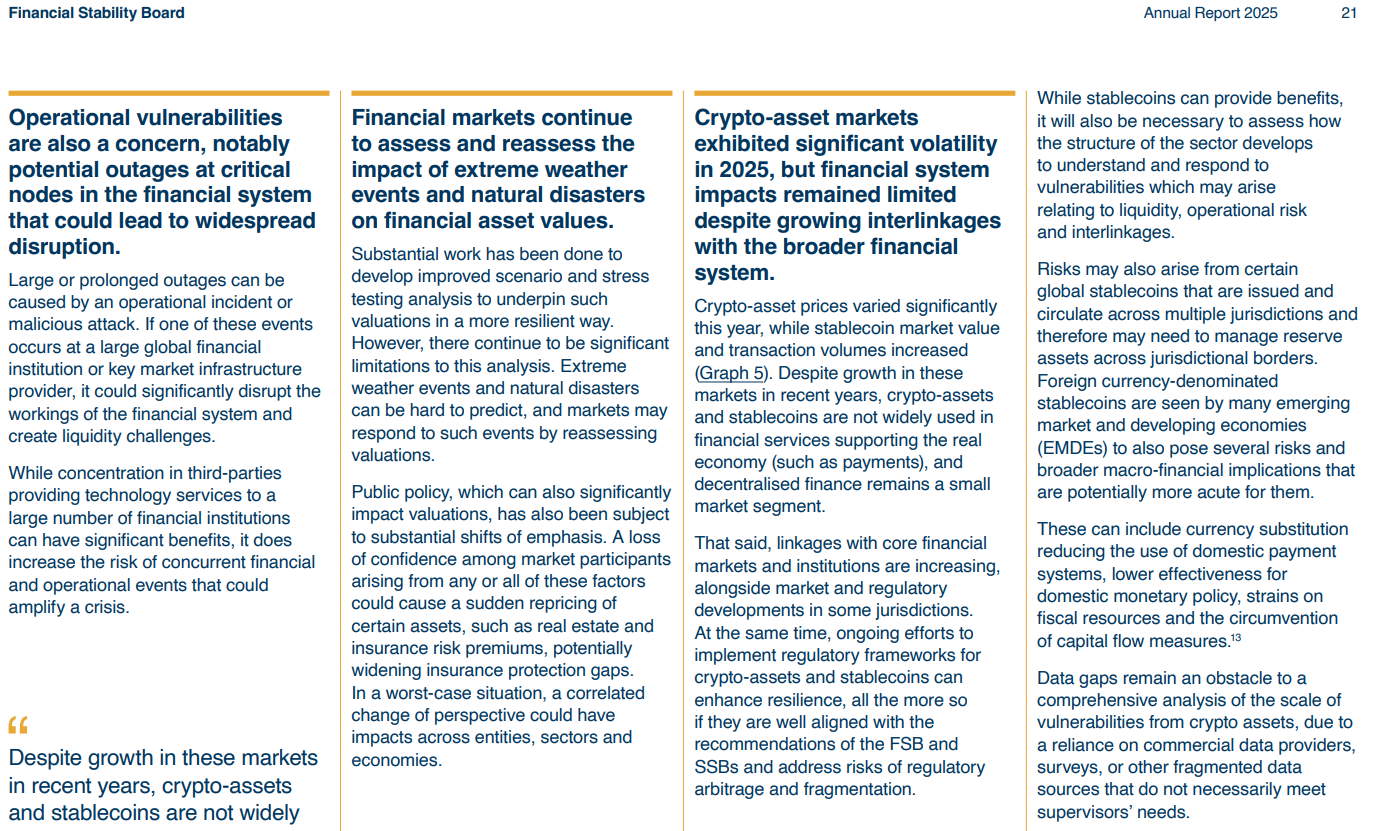
The Financial Stability Board (FSB), a global financial watchdog hosted by the Bank for International Settlements, warned on Tuesday that foreign currency-denominated stablecoins can pose financial stability and macroeconomic risks for emerging market and developing economies.
In its annual report for 2025, the FSB said that US dollar-denominated stablecoins circulating across multiple jurisdictions pose “potentially more acute” risks to the financial stability of emerging economies.
The report said those risks can include currency substitution, reduced use of domestic payment systems, lower effectiveness of domestic monetary policy, strains on fiscal resources and the circumvention of capital flow measures.
The FSB said it remains necessary for lawmakers to assess how the stablecoin sector develops in order to understand and respond to vulnerabilities related to liquidity, operational risk and interlinkages with the broader financial system.
The report builds on the FSB’s 2023 global regulatory framework for crypto-asset activities and global stablecoin arrangements, which the board reviewed in 2025 and said still shows significant gaps and inconsistencies in implementation.

The FSB was established in April 2009 as a successor to the Financial Stability Forum. It was created by G20 economies after the 2008 financial crisis to strengthen global financial systems.
Related: FSB warns crypto nearing ‘tipping point’ as ties to TradFi deepen
Stablecoins still have limited real use
Crypto assets and stablecoins still lack adoption in real economic use cases such as payments, the FSB said in the report.
“Despite growth in these markets in recent years, crypto-assets and stablecoins are not widely used in financial services supporting the real economy.”
The report said stablecoins can provide benefits, but added that authorities should continue monitoring vulnerabilities tied to interlinkages, liquidity and operational risks as linkages with core financial markets and institutions increase.

The FSB also outlined other key areas of focus in 2026, including digital innovation related to crypto assets and monitoring stablecoin vulnerabilities.
Other focal points included monitoring vulnerabilities tied to private credit, nonbank financial intermediation, cross-border payments, and the implementation of additional measures tied to crisis preparedness and regulatory modernization.
Related: FSB calls for stricter oversight against AI vulnerabilities
Magazine: Can privacy survive in US crypto policy after Roman Storm’s conviction?
AI and stablecoin segments have outperformed the broader crypto market in 2026, with data pointing to continued usage growth despite declining prices elsewhere.
Key takeaways:
-
AI sector posts smallest loss in Q1/2026, down just 14%.
-
Stablecoin market cap hits a record $320 billion, with monthly transaction volumes at a record $1.8 trillion.
AI and stablecoin sectors buck the trend
Bitcoin (BTC) trades 18.5% lower in 2026, the total crypto market capitalization has slipped to $2.42 trillion, while most altcoins are lagging, as fear and uncertainty surrounding the US and Israel-Iran war and the Fed’s hawkishness grip the market.
Meanwhile, AI and stablecoin businesses continue to defy the trend, recording significant growth and strong fundamentals that highlight a rotation toward infrastructure over speculation.
Related: Circle asks EU to ease crypto thresholds in proposed markets framework
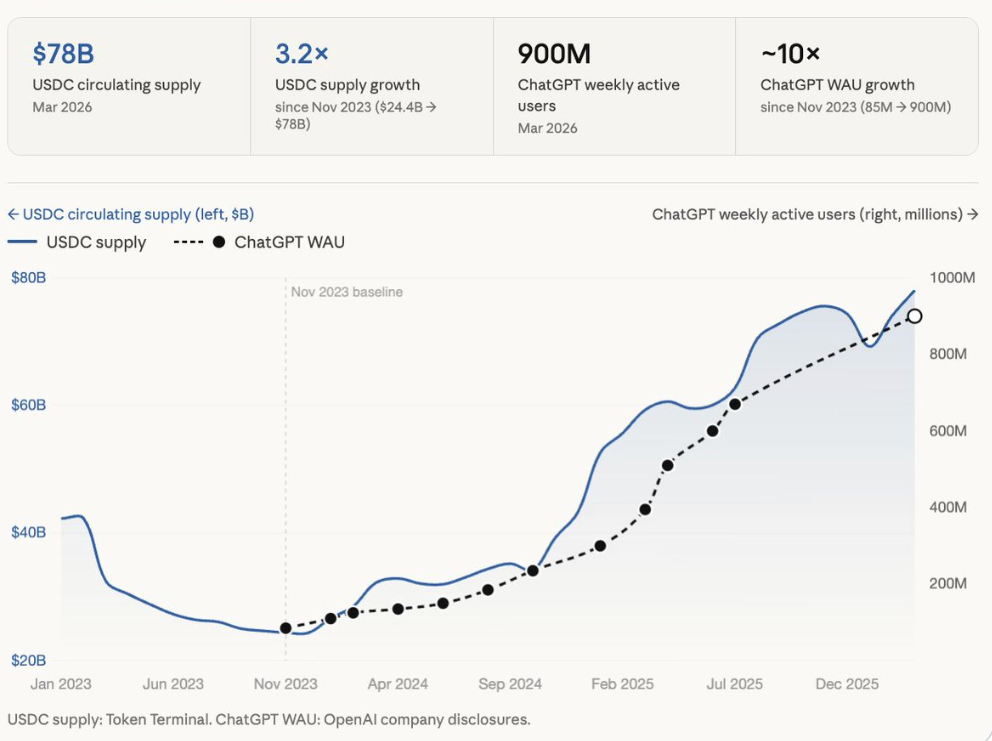
For example, Circle’s USDC (USDC) supply is at $78 billion, a 220% increase since November 2023, data from Token Terminal shows.
ChatGPT’s weekly active users have also grown to 900 million in March 2026 from 85 million in November 2023, a roughly 10x increase over the same period.

Grayscale’s Q1/2026 report reinforces this observation, revealing that the AI sector recorded the smallest loss at 14% during the first three months of the year, compared to Consumer and Culture at 31%, Smart Contract Platforms at 21%, and Currencies at 21%.
This indicates that “investor appetite shifted away from momentum-driven and more speculative segments,” the digital-asset investment manager said, adding:
“Despite subdued overall sentiment, capital appeared to rotate toward projects with stronger fundamentals and those aligned with key themes such as AI and tokenization.”

The market capitalization of AI tokens now stands at $17.4 billion, up 30% over the last 30 days. Bittensor (TAO) and NEAR Protocol (NEAR) lead the growth, with 75% and 30% price increases, respectively, over the same period

Similarly, stablecoins continue to grow, with the total market capitalization hitting a record $320 billion on March 23. Tether’s USDt (USDT) maintains dominance around $184 billion, representing 57% of the total stablecoin supply.
Monthly transaction volumes hit a record $1.8 trillion in February, rivaling traditional payment rails. USDC led supply growth with an 80% month-to-month increase to a $1.26 trillion all-time high last month.

Stablecoins are cryptocurrencies designed to maintain a stable value, typically pegged to fiat currencies like the US dollar, and can be hosted on multiple blockchains.
In a bear market, stablecoins serve as buying power and settlement rails, dominating trading pairs, supporting tokenized real-world assets, and enabling yield-bearing products.
Ethereum and other chains see high transfer volumes, while institutional products from banks and fintechs integrate them for yield and treasury management. This infrastructural role persists even as speculative assets bleed.
“Structural tailwinds” drive growth convergence
The two sectors thrive because they deliver measurable value even after speculation fades.
“AI labs and stablecoin issuers are among the businesses with the strongest structural tailwinds of the 2020s,” Token Terminal said.
They sit at the “intersection of three distinct forces: technology, finance, and geopolitics,” with each of these drivers independently driving demand for these sectors, the crypto data provider said, adding:
“AI drives productivity and defense capabilities, while stablecoins provide financial infrastructure for global dollar distribution.”
In an X post on Monday, Crypto trader Mando CT said AI and stablecoins are among the four dominant sectors in 2026.
Explaining the convergence, the trader said that AI needs instant and low-fees payment systems to operate, while stablecoins are the “internet money” needed to make this happen.
“These trends are connected,” Mando CT said, adding:
“2026 isn’t just another cycle. It’s the transition from: Speculation to Infrastructure.”
Cointelegraph reported that stablecoins could benefit from AI-driven payments by enabling easy, automatic, and rule-based transactions between entities, further driving long-term growth for both sectors.
This article does not contain investment advice or recommendations. Every investment and trading move involves risk, and readers should conduct their own research when making a decision. While we strive to provide accurate and timely information, Cointelegraph does not guarantee the accuracy, completeness, or reliability of any information in this article. This article may contain forward-looking statements that are subject to risks and uncertainties. Cointelegraph will not be liable for any loss or damage arising from your reliance on this information.


Opinion by: Mitchell Amador, founder and CEO of Immunefi
There’s an argument that regulation will split decentralized finance (DeFi) into two separate silos: one regulated and compliant and the other completely open and accessible by anyone, including anonymous participants.
This argument is outdated.
Regulatory pressure in 2026 will reshape DeFi into a network of interoperable, interlinked ecosystems with distinct risk, compliance and access profiles.
Some tiers will become more compliant and institution-friendly, while others will remain open, permissionless and driven by onchain leverage and market experimentation.
This evolution won’t drag DeFi toward TradFi. Rather, it will bring TradFi into DeFi’s orbit.
DeFi already operates in multiple lanes
DeFi has never functioned as a single monolith; it operates across several concurrent compliance tiers.
The first lane is permissionless DeFi, where anyone can deploy a contract, supply liquidity and use leverage. This is the engine of innovation, where price discovery and stress testing happen in public, as does failure. Permissionless pools have no Know Your Customer (KYC), allow pseudonymous users and exist because global markets can move faster than regulated institutions.
The next tier consists of protocols with built-in safeguards, like liquidation rules, governance frameworks and oracle protections, but no identity requirements. These serve people who want liquidity and yield with risk management.
Finally, there is the newer, heavily controlled lane, where KYC checks, geofencing and compliance filters are applied at the access-point level.
The same underlying smart contracts can still be reached, just through different gates.
Liquidity trumps isolation
Full isolation of compliant DeFi is unlikely. Capital seeks liquidity, and liquidity seeks composability. That means the regulated lanes will run through permissionless infrastructure.
Institutions entering digital assets will want access to the scale of liquidity that only onchain markets can provide — 24/7 global access, near-instant settlement and depth that traditional venues cannot match. The passage of the GENIUS Act, which bans yield-bearing stablecoins, has already pushed institutional capital toward DeFi protocols in search of returns.
If the liquidity accessed is compelling enough, institutions will tolerate complexity and innovation risks. Regulation won’t eliminate this incentive.
Security innovation starts in the arena
Institutional and compliant participants care deeply about security, yet the center of gravity for security innovation will sit inside permissionless DeFi.
That may sound counterintuitive, given that over $3.1 billion was lost to hacks and exploits during the first half of 2025 alone.
Related: For Wall Street’s most sophisticated trading firms, the next alpha is onchain
Adversarial conditions are precisely where robust defenses are forged. Bug bounty programs, real-time monitoring tools and AI-driven threat detection were all born in the permissionless environment and stress-tested against live exploits before any compliance framework adopted them.
This pattern will accelerate. New security models that range from automated vulnerability scanning to onchain firewalling will continue to emerge in open DeFi and will then be standardized and adopted by the institutional side once they prove effective.
Regulation will cement DeFi’s central role
Regulation will certainly not fracture DeFi. What we will see instead is how decentralized finance will cement its position at the center of global finance.
The future, to be sure, is not compliant DeFi versus permissionless DeFi, because DeFi has the ability to be interoperable. It’s a network where open markets generate liquidity and innovation, and regulated players selectively plug in. That’s why we will see regulatory pressures mold the ecosystem into interconnected tiers, with some gravitating toward greater compliance and others toward the open marketplace, all of them linked by the composability that makes onchain finance uniquely powerful.
That dynamic will inevitably draw TradFi closer to DeFi as institutions seek out the far greater liquidity, speed and efficiency of decentralized markets.
Opinion by: Mitchell Amador, founder and CEO of Immunefi.
This opinion article presents the author’s expert view, and it may not reflect the views of Cointelegraph.com. This content has undergone editorial review to ensure clarity and relevance. Cointelegraph remains committed to transparent reporting and upholding the highest standards of journalism. Readers are encouraged to conduct their own research before taking any actions related to the company.
Financial technology company Omnes and financial services provider Apex Group said on Tuesday that they plan to issue a tokenized secured debt note backed by Bitcoin hashrate on Base.
The two companies announced that they would tokenize the Omnes Mining Note (OMN), an institutional-grade structured note backed by the Bitcoin (BTC) hashrate. The companies said it will be issued and managed on the Base blockchain, Coinbase’s Ethereum layer-2 network.
Apex said the note is designed to give institutional investors “direct economic exposure to new Bitcoin production measured in hashrate” without the operational burden of managing mining hardware, energy procurement and facilities.
The launch adds a new type of crypto-linked security to the tokenization market by packaging mining output into a regulated investment product that can be transferred onchain between approved investors.
Omnes CEO Emmanuel Montero said the OMN is intended to convert Bitcoin mining output into a structured financial instrument backed by large-scale mining operations. “Bitcoin mining is the only mechanism that creates new Bitcoin through protocol issuance. This is economically distinct from yield strategies that rely on redistributing existing Bitcoin,” he said.
Bitcoin mining exposure packaged into a tokenized debt note
According to the announcement, the OMN is designed to give professional investors outside of the United States economic exposure linked to mining production, using hashrate as its underlying metric. The Bitcoin hashrate is the computational power that secures the network and produces new coins.
The product essentially lets investors benefit from Bitcoin mining activity without running mining operations themselves.
Related: Nasdaq, Talos target collateral bottleneck in institutional tokenization push
Issued as a secured debt note, the product applies a traditional financial structure with blockchain-based features, including onchain transfers between approved investors.
While the product expands access to mining exposure, details on how hashrate translates into investor returns, as well as the note’s liquidity and risk profile, were not fully disclosed.
Cointelegraph reached out to Omnes and Apex Group for more information, but had not received a response by publication.
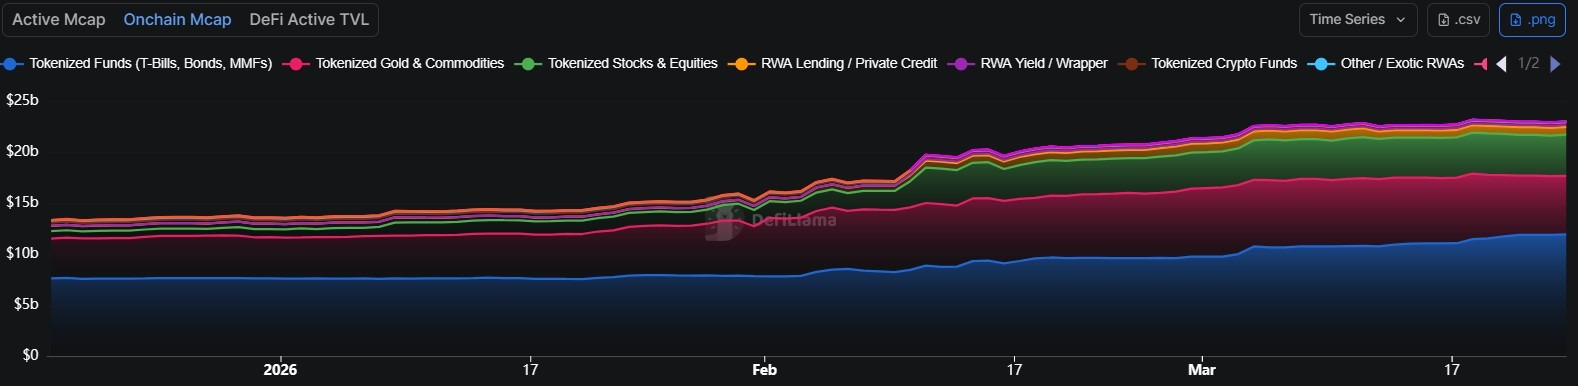
Tokenized assets climb to over $23 billion in March
The plans to tokenize Bitcoin mining exposure come amid a rise in tokenized real-world assets (RWAs) in 2026.
On March 11, DefiLlama data showed that the value of tokenized RWAs on public blockchains reached roughly $23.6 billion, up 66% year-to-date.

At the time of writing, the onchain market capitalization for tokenized RWAs stood at around at $23 billion, according to DefiLlama.
Magazine: Animoca teams up with Ava Labs, Shrapnel on Steam: Web3 Gamer


Circle has called on the European Commission to ease parts of its proposed Market Integration Package as the stablecoin issuer pushes for wider institutional use of digital euro and dollar tokens in the region.
Summary
- Circle asked the EU to lower thresholds blocking broader institutional use of e-money tokens.
- The company said current settlement rules could slow growth of euro-denominated stablecoins like EURC.
- Circle also wants crypto service providers included in the EU DLT Pilot Regime.
In a Monday announcement, the company said the package could help connect traditional finance and blockchain systems, but added that some rules still limit access for crypto service providers and slow the growth of euro-backed tokens.
Circle said it sent its feedback to the Commission on March 20. In its response, the company described the package as a “meaningful step toward a digitally enabled financial system” while asking for changes to improve market access and digital asset settlement in Europe.
One of Circle’s main requests focused on the market capitalization threshold tied to e-money tokens used in settlement. The company said limiting settlement use to “significant” e-money tokens could keep euro-denominated tokens out of the market and create what it called a “chicken-and-egg scenario” for growth.
Circle argued that the current threshold creates a structural barrier for institutions that want to use e-money tokens in secondary markets. It said the Commission should use more flexible thresholds based on factors such as market uptake and liquidity conditions rather than relying on a fixed capital benchmark.
The company has a direct interest in that issue because it offers EURC, a euro-backed stablecoin that complies with MiCA rules in Europe. Circle’s MiCA white paper says EURC is an e-money token and states that it does not meet the definition of a “significant e-money token” under current rules.
Circle also wants wider access under DLT rules
Circle also asked the Commission to widen access under the DLT Pilot Regime. It said the current structure limits cash accounts to credit institutions and central securities depositories, and argued that crypto-asset service providers should also be allowed to take part.
The company said these changes would give Europe-based crypto market participants more clarity, especially around which digital assets can be used as collateral and how blockchain-based settlement can work within regulated capital markets. The Commission launched the broader Market Integration Package in December 2025 as part of its plan to deepen EU capital markets integration and supervision.
Europe’s main crypto framework remains the Markets in Crypto-Assets Regulation, which took effect in late 2024. Circle said the new package gives the EU a chance to update parts of its financial system while keeping digital asset rules clear and proportionate for firms operating in the bloc.


Aave’s community has moved a step closer to launching V4 on Ethereum after a governance proposal won near-unanimous backing. The result points to broader support for the upgrade after several weeks of public tension inside the DAO and the exit plans of key contributors.
Summary
- Aave DAO strongly backed V4, moving the protocol closer to Ethereum mainnet deployment.
- The vote followed governance tension and exit plans from key Aave contributors recently.
- Aave V4 introduces modular hubs and spokes for shared liquidity and tailored risk.
A Snapshot vote on Monday showed more than 645,000 votes in favor of moving Aave V4 toward Ethereum mainnet deployment. Fewer than one vote opposed the plan, and there were no abstentions, according to reporting on the outcome.
The vote does not activate the system on its own. Aave founder Stani Kulechov said the proposal is expected to advance to an Aave Improvement Proposal, which would be the binding onchain vote needed to deploy and activate V4 on Ethereum.
Aave Labs presented V4 as a protocol built around a hub-and-spoke structure. Under that model, shared liquidity sits in “Hubs,” while “Spokes” define separate borrowing markets with their own limits and risk settings.
Aave Labs said this structure is meant to keep the benefits of shared liquidity while giving the protocol tighter control over risk across different markets. The design is also intended to support a wider range of use cases, including new collateral types and structured credit markets.
Governance tensions shaped the backdrop
The strong support for V4 follows a period of strain inside Aave governance. In a forum post published on February 20, BGD Labs said it would end its involvement with Aave after nearly four years, citing an “asymmetric organizational scenario” and what it called an “adversarial position” toward its work on V3.
That dispute widened in early March when the Aave Chan Initiative said it would not seek renewal of its engagement with the DAO. Marc Zeller wrote that ACI would wind down over four months after a clash over funding, governance standards, and voting dynamics.
In addition, the latest vote suggests the DAO is now more aligned on the path forward for V4. It also gives Aave Labs a clearer route to seek final approval for Ethereum mainnet activation through the next governance stage.

Grand National 2026 runners listed as 10 horses taken out of £1m race

Hong Kong Police Can Demand Passwords Under New National Security Rules

Trump is pushing for leadership change in Cuba and the next president could be a Castro


-
 Crypto World4 days ago
NIO (NIO) Stock Plunges 6.5% as Shelf Registration Sparks Dilution Worries
-

 Fashion4 days ago
Weekend Open Thread: Adidas – Corporette.com
-

 Politics4 days ago
Jenni Murray, Long-Serving Woman’s Hour Presenter, Dies Aged 75
-

 Crypto World3 days ago
Best Crypto to Buy Now: Strategy Just Spent $1.57 Billion on Bitcoin During Fear While Early Investors Quietly Enter Pepeto for 150x Potential
-

 News Videos6 days ago
RBA board divided on rate cut, unusually buoyant share market | Finance Report | ABC NEWS
-

 Crypto World3 days ago
Bitcoin Price News: Bhutan Sells $72 Million in BTC Under Fiscal Pressure, but the Smart Money Entering Pepeto Sees What the Market Does Not
-

 Politics7 days ago
The House | The new register to protect children from their abusers shows Parliament at its best
-

 Tech5 days ago
inKONBINI Lets You Spend Summer Days Behind the Register
-

 Crypto World6 days ago
Canada’s FINTRAC revokes registrations of 23 crypto MSBs in AML crackdown
-

 Sports2 days ago
Remo Stars and Kano Pillars Strengthen Survival Hopes in NPFL
-
 NewsBeat6 days ago
Residents in North Lanarkshire reminded to register to vote in Scottish Parliament Election
-

 News Videos7 days ago
PARLIAMENT OF MALAWI – PAC MEETING WITH REGISTRAR OF FINANCIAL ON AMARYLLIS HOTEL – INQUIRY LIVE
-

 Politics5 days ago
Gender equality discussions at UN face pushbacks and US resistance
-

 Business2 days ago
No Winner in March 21 Drawing as Prize Rolls to $133 Million for Next
-

 Business6 days ago
Who Was Alex Pretti? 5 Key Facts About the ICU Nurse Killed by Federal Agents in Minneapolis
-

 Sports2 days ago
Gary Kirsten Accuses Pakistan Cricket Board Of ‘Interference’, Mohsin Naqvi Responds
-

 Tech2 days ago
Give Your Phone a Huge (and Free) Upgrade by Switching to Another Keyboard
-

 Sports4 days ago
2026 Kentucky Derby horses, odds, futures, preview, date: Expert who nailed 12 Derby-Oaks Doubles enters picks
-
Sports6 days ago
Vikings Free Agency Enters Phase 2 with Key Questions
-

 Tech6 days ago
Inventec’s bizarre VeilBook laptop hides its touchpad under a sliding keyboard just to give cooling fans a little breathing room
You must be logged in to post a comment Login