

Crypto World
Ethereum Price Prediction: $250,000 per ETH as Global Finance Backbone
Ethereum price is about to breach $2,400 as an institutional prediction lands with unusual force this week. Etherealize, an institutional Ethereum advocacy group, published a revised long-term price target of $250,000 per ETH, arguing the network is positioned to absorb the combined $31.1 trillion market premium currently held by gold and Bitcoin.
100X move from current levels sounds crazy, but Fundstrat’s Tom Lee independently echoed the same $250,000 “supercycle” figure, citing accelerating institutional accumulation. The thesis: Ethereum’s proof-of-stake yield model and role as DeFi’s primary settlement layer give it structural advantages neither gold nor Bitcoin can replicate.
Short-term technicals, however, tell a complicated story, a gap between macro vision and current price action.
Discover: The best pre-launch token sales
Forget The $250K Ethereum Price Prediction: Can Ethereum Break $2,600
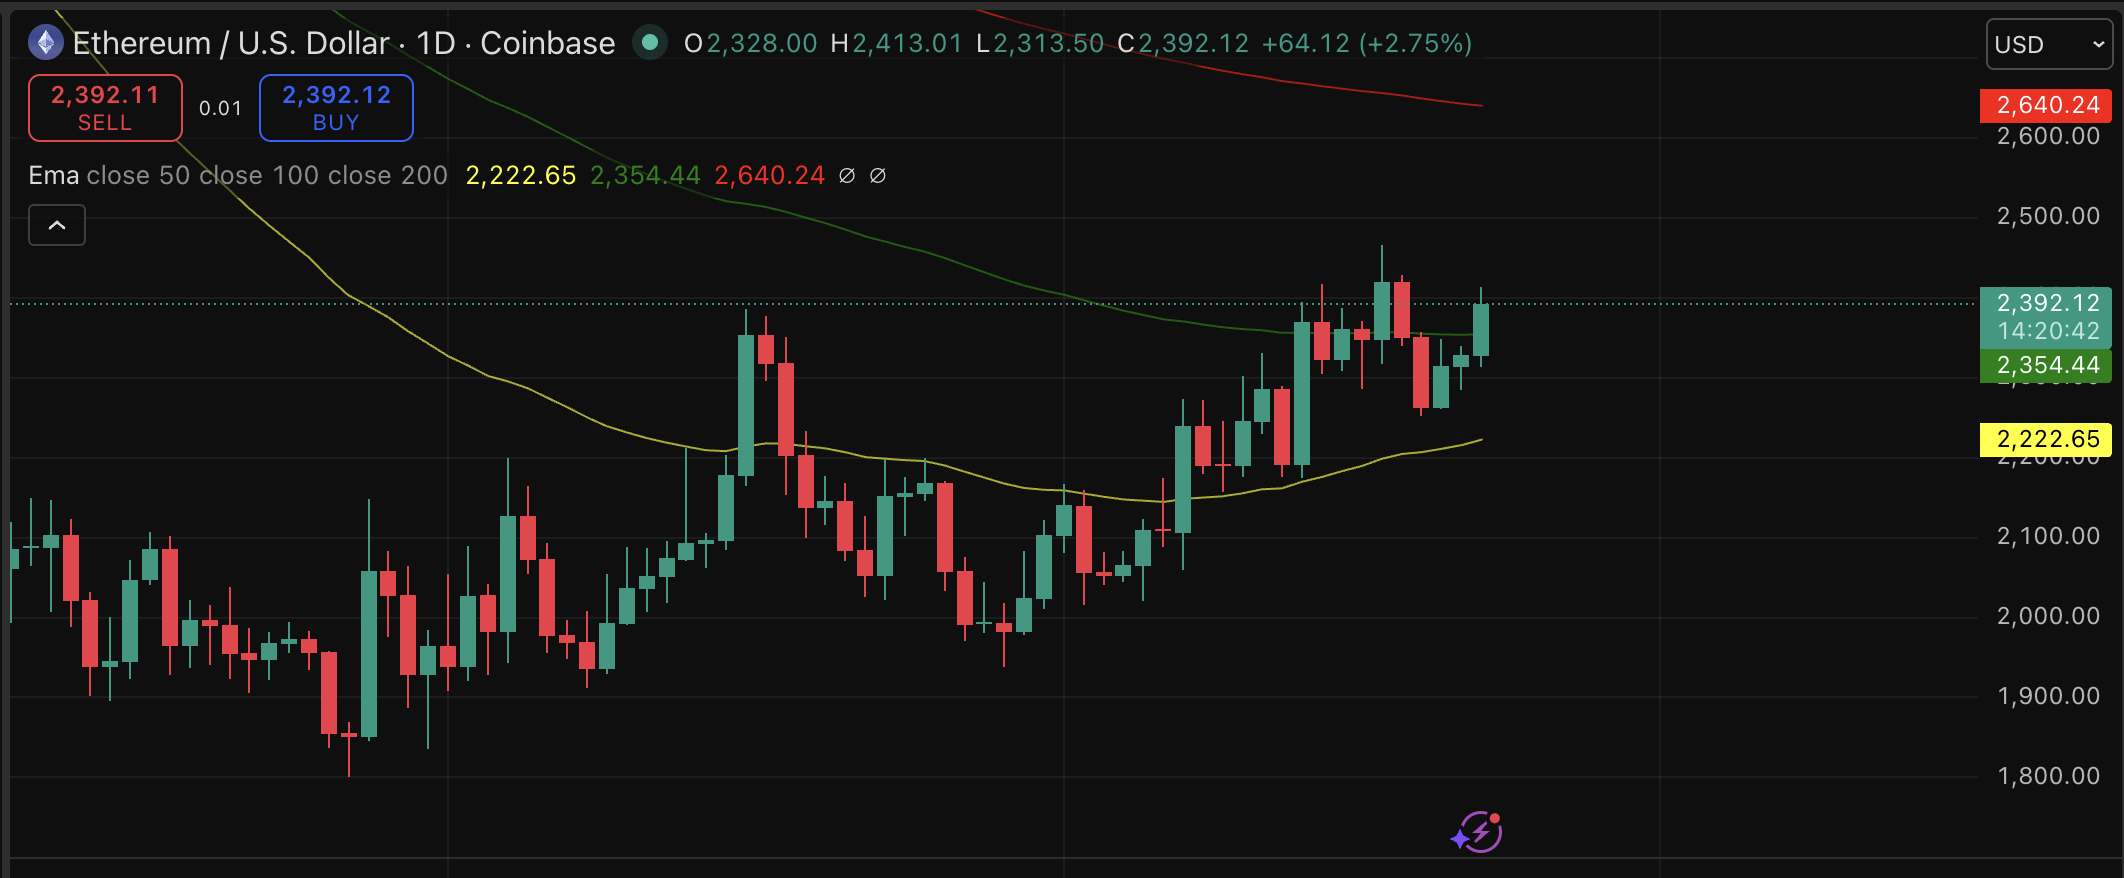
ETH sits just under $2,400, between two forces pulling in opposite directions. The funding rate has turned negative at -0.0033%, a signal that traders are leaning short.
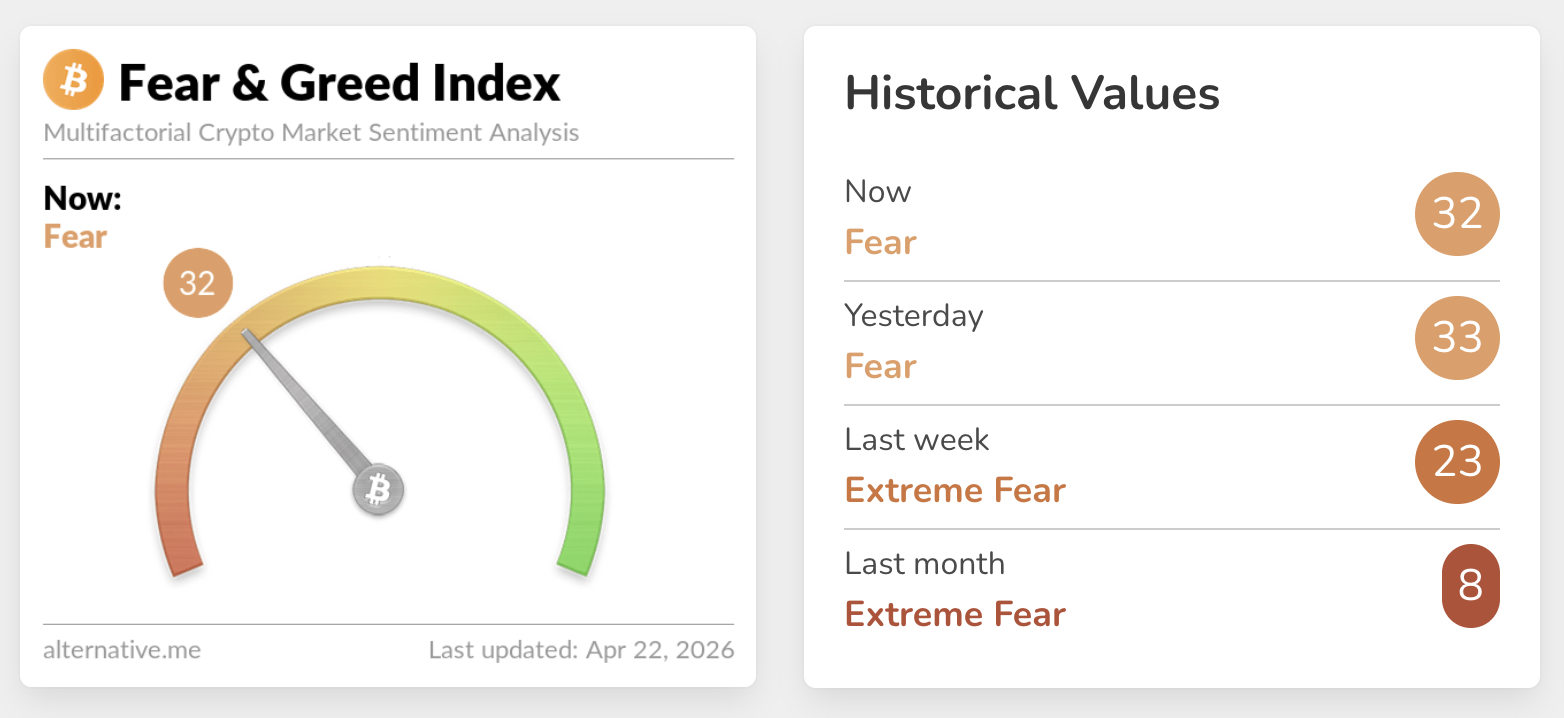
The Crypto Fear & Greed Index reads 32, firmly in fear territory, though getting better than the last 30 days. Bitcoin dominance has climbed back above 60%, compressing altcoin liquidity across the board and creating a supply-demand stagnation that makes clean breakouts difficult to sustain.

The immediate battleground is the $2,200 support level now. Hold it, and a breakout toward $2,500 becomesan easy target. Clear that resistance convincingly, and the next logical destination is $2,800 as a level that, if reclaimed and consolidated, would technically confirm a shift toward a macro-level uptrend.
However, if support at $2,200 breaks. The next meaningful floor appears at $2,000, with a structural correction potentially extending to $1,900 as a consolidation zone. Risk management is not optional here.
The Etherealize report offers no timeline on the $250,000 target, so it’s a price destination, not a trade. What it does provide is a structural argument: 121 million circulating ETH capturing even a fraction of gold’s store-of-value premium implies a repricing event that would dwarf any previous crypto cycle.
Institutional buyers are already moving with BitMine Immersion Technologies, which purchased 32,977 ETH ($104 million) last week alone, bringing its holdings to 4.14 million ETH, or 3.4% of total supply. Conviction capital.
Discover: The best crypto to diversify your portfolio with
LiquidChain with Big Upside Potential Bridging ETH, SOL, and BTC
Even if the $250,000 thesis is correct for ETH, getting there from $2,300 requires holding through multi-year drawdowns, regulatory headwinds, and multiple altcoin winters.
Ethereum’s institutional narrative is strengthening, but the asymmetric upside that defined early ETH buyers no longer exists, not without big capital. That’s where early-stage infrastructure plays enter the picture.
LiquidChain ($LIQUID) is a Layer 3 infrastructure project built around a specific and underserved problem: fragmented liquidity across Bitcoin, Ethereum, and Solana. Its Unified Liquidity Layer fuses BTC, ETH, and SOL ecosystems into a single execution environment.
The LiquidChain library is home to the entire foundation of the LiquidChain L3. — LiquidChain (@getliquidchain) April 22, 2026
Knowledge this powerful needs to be under lock and key 
 https://t.co/vqvBcdSQYC pic.twitter.com/YHwkivyZcC
With Liquid, developers only need to deploy once and access all three networks simultaneously. Single-Step Execution and Verifiable Settlement are the architectural pillars.
The presale has raised somewhere close to $700K, with $LIQUID currently priced at $0.01452. That’s a early-stage entry point on infrastructure that sits directly beneath the kind of cross-chain capital flows an Ethereum supercycle would generate.
Research LiquidChain thoroughly before the next priceincrease.
The post Ethereum Price Prediction: $250,000 per ETH as Global Finance Backbone appeared first on Cryptonews.


The Collateral AppChain will use the Chainlink Runtime Environment to automate eligibility, margining and settlement across global markets, with production launch slated for Q4 2026.
Alternative investment vehicles such as exchange-traded funds (ETFs), led by BlackRock’s IBIT, hold sway over bitcoin’s price. That is well known by now.
But another ETF from the betting world has been moving in lockstep with bitcoin’s cycles since 2020, with an interesting pattern that, to the naked eye, appears to show leading signals for BTC trend changes.
That ETF is the NYSE-listed Roundhill Sports Betting & iGaming ETF (BETZ). The fund debuted in June 2020 and has since attracted only $98 million in net inflows. As of Tuesday, it had roughly $50 million in assets under management, which is paltry compared to the billions of dollars in the IBIT fund.
The 90-day correlation coefficient between the two assets was 0.73 at press time, according to data from TradingView. Meanwhile, the 365-day coefficient stood at 0.91. That translates into an R² of approximately 0.83, implying that over 80% of the variation in the two assets’ movements is statistically linked. Talk about moving in lockstep!
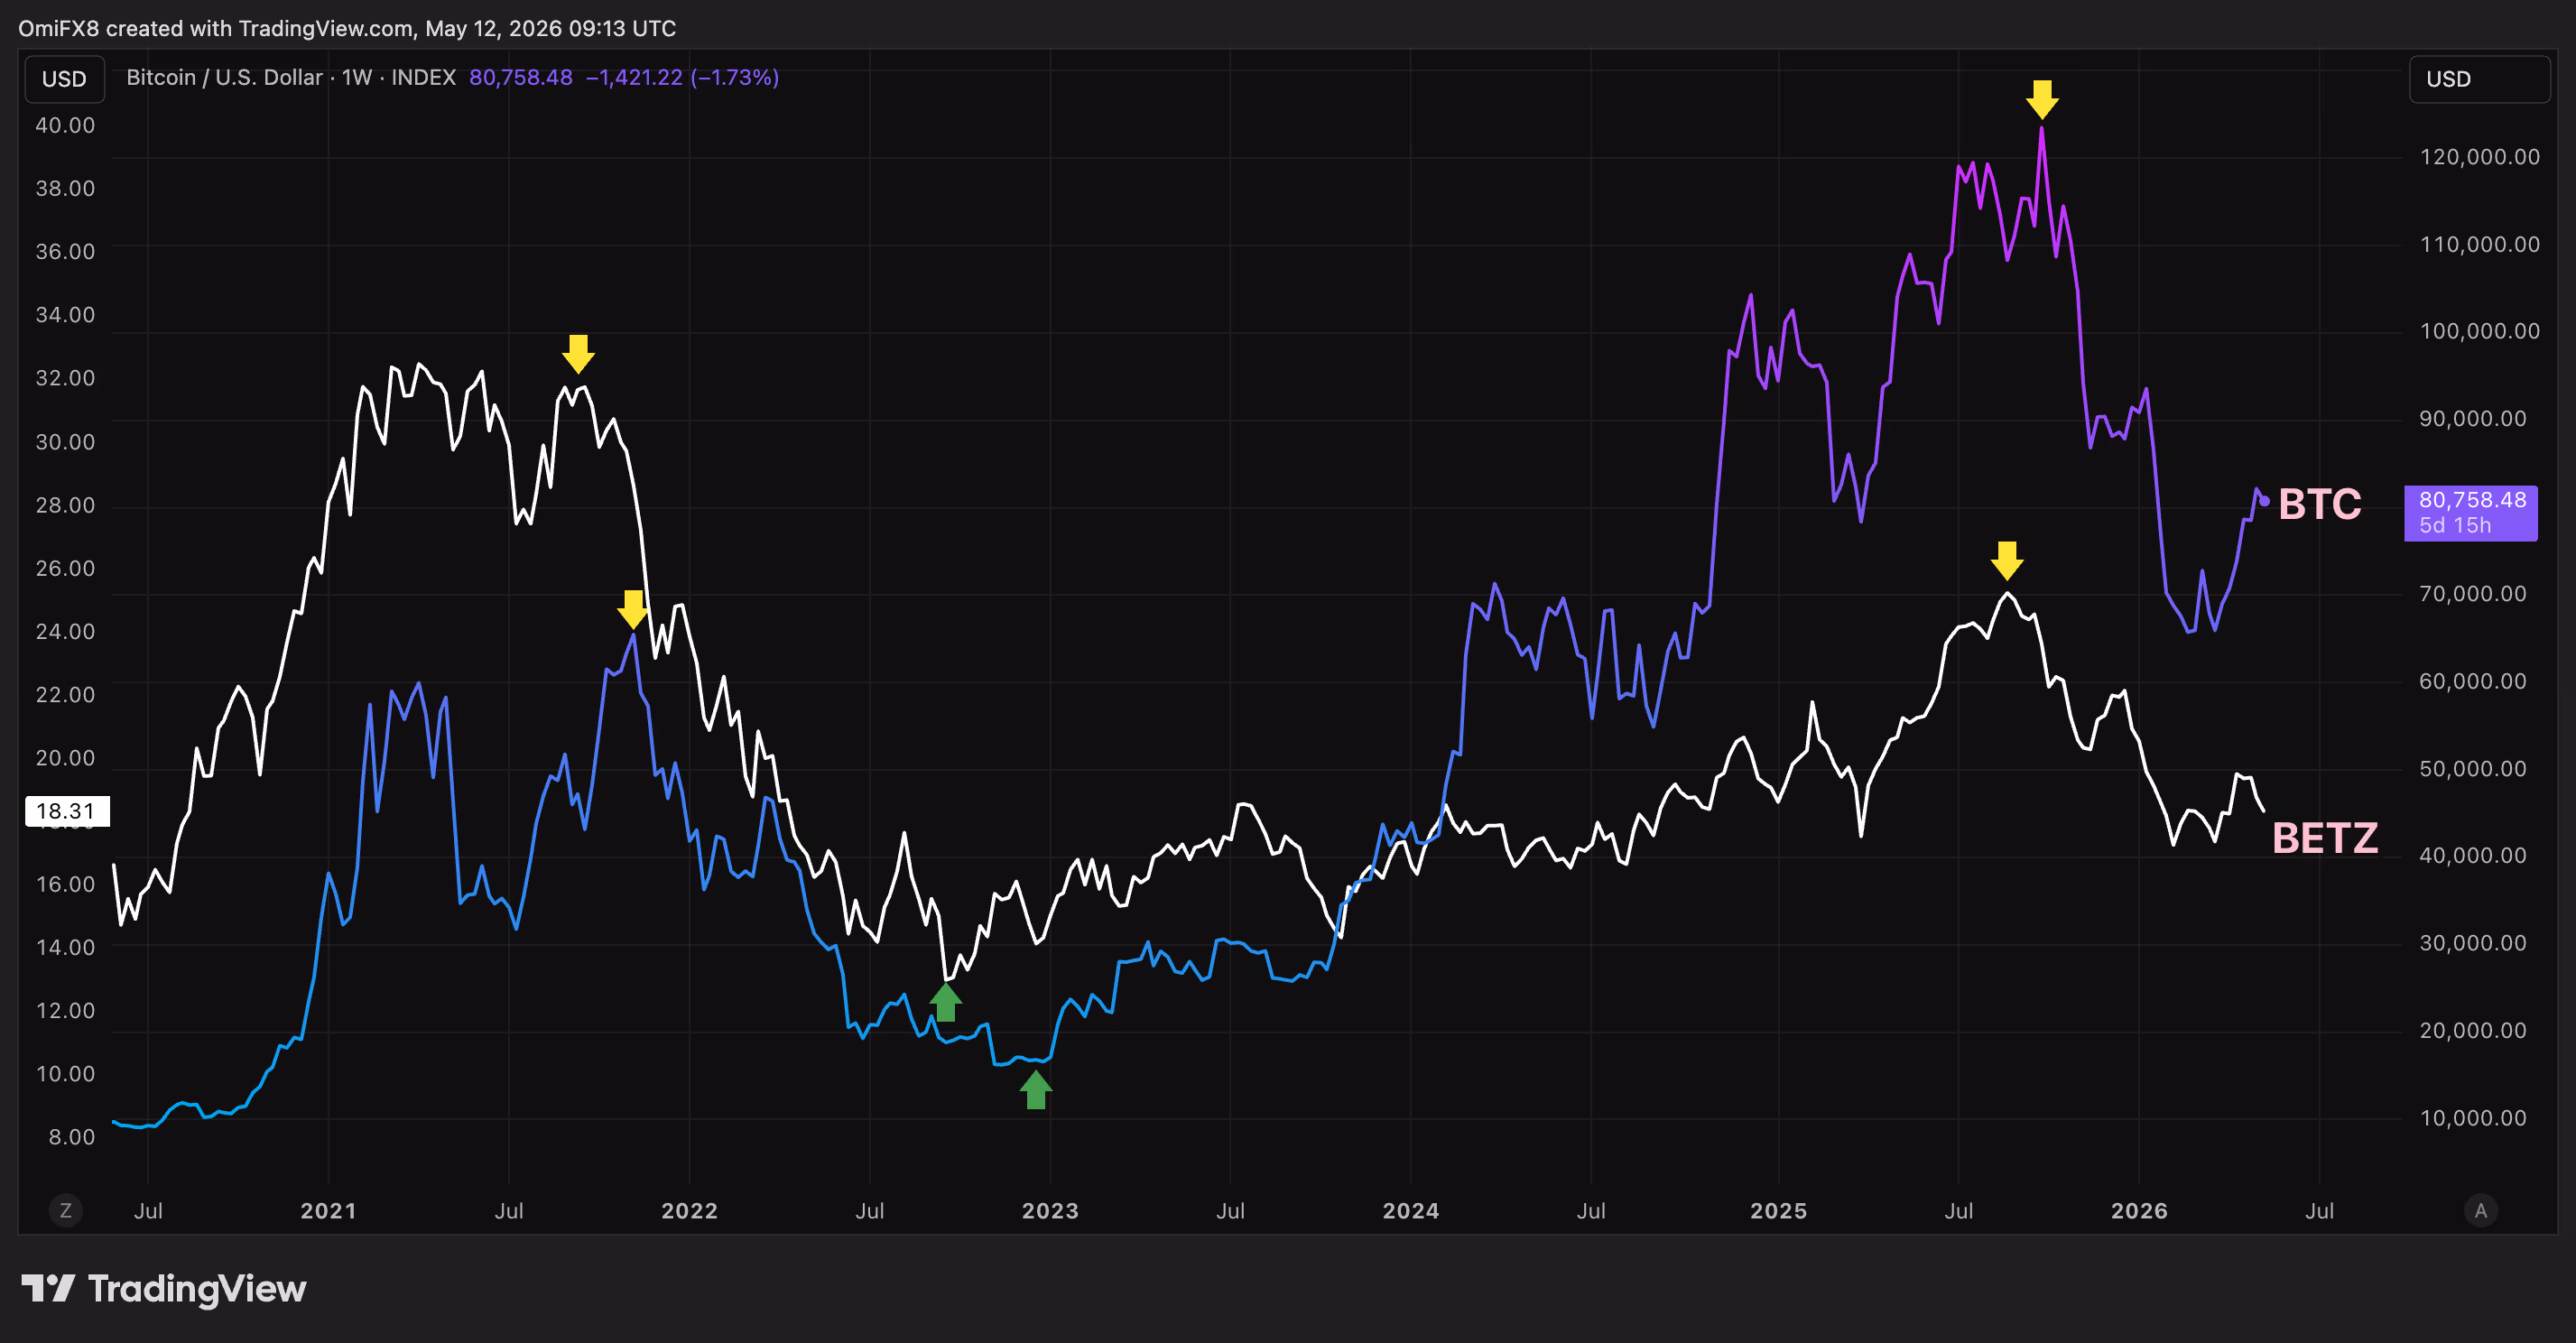
But here’s where it gets interesting. If you overlay the ETF price on BTC’s price chart, a clear pattern emerges, in that the fund tends to hit major peaks and bottoms a couple of weeks ahead of bitcoin market turnarounds.

The blue line represents bitcoin, and the white line, the BETZ ETF.
The betting ETF peaked in September 2021, and by the time BTC followed in November, it was already declining. The ETF’s eventual bottom in September 2022 also preceded bitcoin’s by three months.
A similar pattern played out last year, when the ETF peaked in August, two months before BTC.
While the correlation between the two asset is far from definitive causation, the consistency of these timing offsets across multiple cycles is difficult to ignore. It strengthens the broader argument made by several leading observers, including Ray Dalio, that bitcoin continues to behave more like a risk-sensitive macro asset than a traditional safe-haven instrument.
For traders, the take away is clear: The ETF is more like a complementary sentiment and liquidity proxy rather than a standalone predictor of BTC trends.
The fact that the BETZ ETF has, in recent days, decoupled from rising BTC prices may be an early signal worth monitoring, its just a noise in a relationship that has historically held but not guaranteed to persist.
Crypto World
WAIB Summit Monaco 2026 returns: the world’s most exclusive gathering for digital assets & AI

Monaco, May 12, 2026 — Following the resounding success of its 2025 edition, WAIB Summit Monaco proudly announces its return on June 9–10, 2026, at the prestigious One Monte-Carlo, located in the heart of Monaco’s iconic Casino Square.
Recognized as one of the world’s most exclusive summits for Web3, Artificial Intelligence, and Digital Assets, WAIB Summit Monaco 2026 will once again convene 2,000+ global attendees, including visionary founders, family offices, institutional investors, venture capitalists, regulators and policymakers, global brands, and thought leaders shaping the future of technology and innovation.
Building on the global momentum surrounding the Monaco Formula 1 Grand Prix, the summit uniquely blends cutting-edge innovation, luxury, and elite networking—transforming Monaco’s peak international spotlight into a gateway for the future of finance and the internet.
A proven global impact
The 2025 edition of WAIB Summit Monaco featured:
- 150+ speakers from leading global organizations, including Microsoft, Coinbase, OKX, B2C2, and AS Monaco, alongside many other world-class brands and institutions
- 50 top global KOLs with a combined audience of 6+ million followers
- 2,000+ international attendees
- Over 1.3 million social media impressions
This momentum firmly established WAIB Summit Monaco as a landmark event for influence, investment, and impact across the Web3 and AI ecosystem.

What to expect in 2026
WAIB Summit Monaco 2026 will deliver an expanded program of curated experiences and exclusive side events—bringing together top global exchanges, financial institutions, and public sector leaders including BNP Paribas, Natixis, CoinShares, Franklin Templeton, Kraken, KuCoin EU, the European Commission, the European Parliament, and representatives from the Governments of Liechtenstein and Monaco—alongside leading global family offices and institutional asset managers, designed to foster innovation, collaboration, and capital formation at the highest level:
Featured speakers
Policy & government
- Peter Kerstens — Adviser, European Commission (DG FISMA)
- Ondrej Kovarik — Former Member of the European Parliament
- Dr. Clara Guerra — Director, Government of Liechtenstein
Financial institutions & asset management
- Rafael Mastroberardino — Franklin Templeton
- Julien Clausse — Head of Asset Foundry, BNP Paribas
- Ramzi Amairi — Director, Tech Coverage – Fintech & Digital Assets, Natixis
- Elie Naba — Innovation Manager, ABN AMRO
- Julien Busnel — Institutional Sales, CoinShares AM
Investment & family office
- Lucius Czerlau, Marquess of Tihany — Principal, Czerlau Family Office
- Paul Infante Moñozca — Moñozca Family Office
Web3 & infrastructure
- Ada Vaughan — Head of DeFi, Stellar Development Foundation
- Kean Gilbert — Head of Institutional Relations, Lido
- Dayana Aleksandrova — Social & New Media Lead, WalletConnect
Global exchanges
- Georg Harer — Co-CEO, Bybit EU
- Sabina Liu — Managing Director, KuCoin EU
- Nenter Chow — CEO, BitMart
- Dorian Vincileoni — Head of Regional Growth, Kraken
- Ajinkya M Tulpule — Director and Chief Operating Officer, HashKey Europe
Family offices VIP dinner at yacht club de Monaco
WAIB Summit Monaco is where family offices meet institutional providers. Hosted in the iconic Yacht Club de Monaco, this highly curated private gathering brings together 20+ single and multi family offices, private wealth leaders, institutional providers, government representatives, and selected founders for trusted, high-level dialogue on the future of Web3 and digital assets. Designed for quality over quantity, the experience convenes 80 carefully selected participants in an intimate setting where capital allocators, institutions, and policymakers can engage in meaningful conversations, exchange insights openly, and build strategic relationships away from crowded expo halls and transactional networking.
WAIB Summit Monte Carlo awards
Honoring excellence and breakthrough innovation across Web3, AI, and Digital Assets—celebrating the pioneers shaping the future of the decentralized economy.
VC & startup pitching sessions
A high-impact platform where selected Web3 and AI startups present groundbreaking innovations to leading venture capitalists and strategic investors. Participating VC partners include Draper University, CV VC Labs, funders.vc, Gini Capital, and MonacoTech.
AI film festival
A celebration of AI-driven filmmaking, positioning artificial intelligence as a new creative engine for cinema and storytelling—exploring the evolving relationship between the creator and the created. The festival brings together filmmakers, artists, AI creators, and philosophers to collaborate and showcase new forms of creative expression.
AI film fest 24H hackathon
The AI Film Fest 24H Hackathon is a 24-hour AI filmmaking challenge open to all on-site attendees, exclusively powered by Alibaba Cloud. The Alibaba Cloud team will be on-site to deliver a tool demonstration and creative briefing before the challenge begins. Participants will then have 24 hours to create a 1–3 minute AI-generated short film. All submissions will be reviewed by the official jury, who will select Gold, Silver, and Bronze winners.
AI film awards jury members
- Anthony Bourached — Associate Professor of Machine Learning & Creative AI at UCL
- Vincent Lowy — Former Head, ENS Louis-Lumière
- Nicholas Shoolingin-Jordan — Director of Netflix’s Series
- Andrew McNamara — Generative AI Lead, Cinesite
Official Website: https://aifilmfest-monaco.com
The Moon party
An unforgettable closing celebration beneath the Monaco and Monte Carlo night sky, set on the beach along the Riviera coastline, bringing together founders, investors, and visionaries.
Tickets & access
Official tickets for WAIB Summit Monaco 2026 are now available.
Early-bird rates are available for a limited time.
Website: https://waibsummit.com
Tickets: https://app.moongate.id/e/waibsummitmonaco2026
About WAIB Summit
WAIB Summit (Web3 and AI Summit) is a global platform connecting thought leaders, investors, family offices, and innovators shaping the future of decentralized technology and artificial intelligence. Hosted in Monaco, following the Monaco Formula 1 Grand Prix weekend, WAIB Summit blends Monaco’s timeless elegance with the vision of the digital age.
Media contact:
Crypto World
Bitcoin rally stalls ahead of U.S. inflation report as XRP, SOL prices hit resistance: Crypto Daily
This is an excerpt from CoinDesk newsletter ‘Daybook.’ Sign up here, if you haven’t already.
Bitcoin’s rally stalled in the $80,000–$82,000 range, where it has largely traded since last Wednesday. While fund flows continue to point toward an eventual breakout, macro risks, particularly inflation, suggest caution.
The U.S. is scheduled to report its consumer price index (CPI) for April at 8:30 a.m. ET. According to FactSet, the median estimate is 3.7%, up from 3.3% in March. If that proves correct, it would mark the largest increase in the CPI since January 2024 and be well above the trailing 12-month average of 2.7%.
Analysts are worried that such a reading, especially against the backdrop of what President Donald Trump described as an “unbelievably weak” U.S.-Iran ceasefire and still-elevated oil prices, could trigger risk aversion, potentially weighing on asset prices.
“Markets are entering a highly sensitive period where geopolitics, inflation risks and central bank expectations are colliding,” said Lukman Otunuga, head of market research at global trading broker FXTM. “The combination of elevated oil prices, uncertainty around the Iran conflict, and critical U.S. economic data could drive heightened volatility across commodities, currencies and global equities in the days ahead.”
Still, the reaction could also depend on the core CPI print, which excludes the volatile food and energy component. The core reading is forecast to have increased to 2.7% year-on-year from 2.6% in March.
It’s also possible that higher inflation is already priced in, which may be why the rally stalled in the first place.
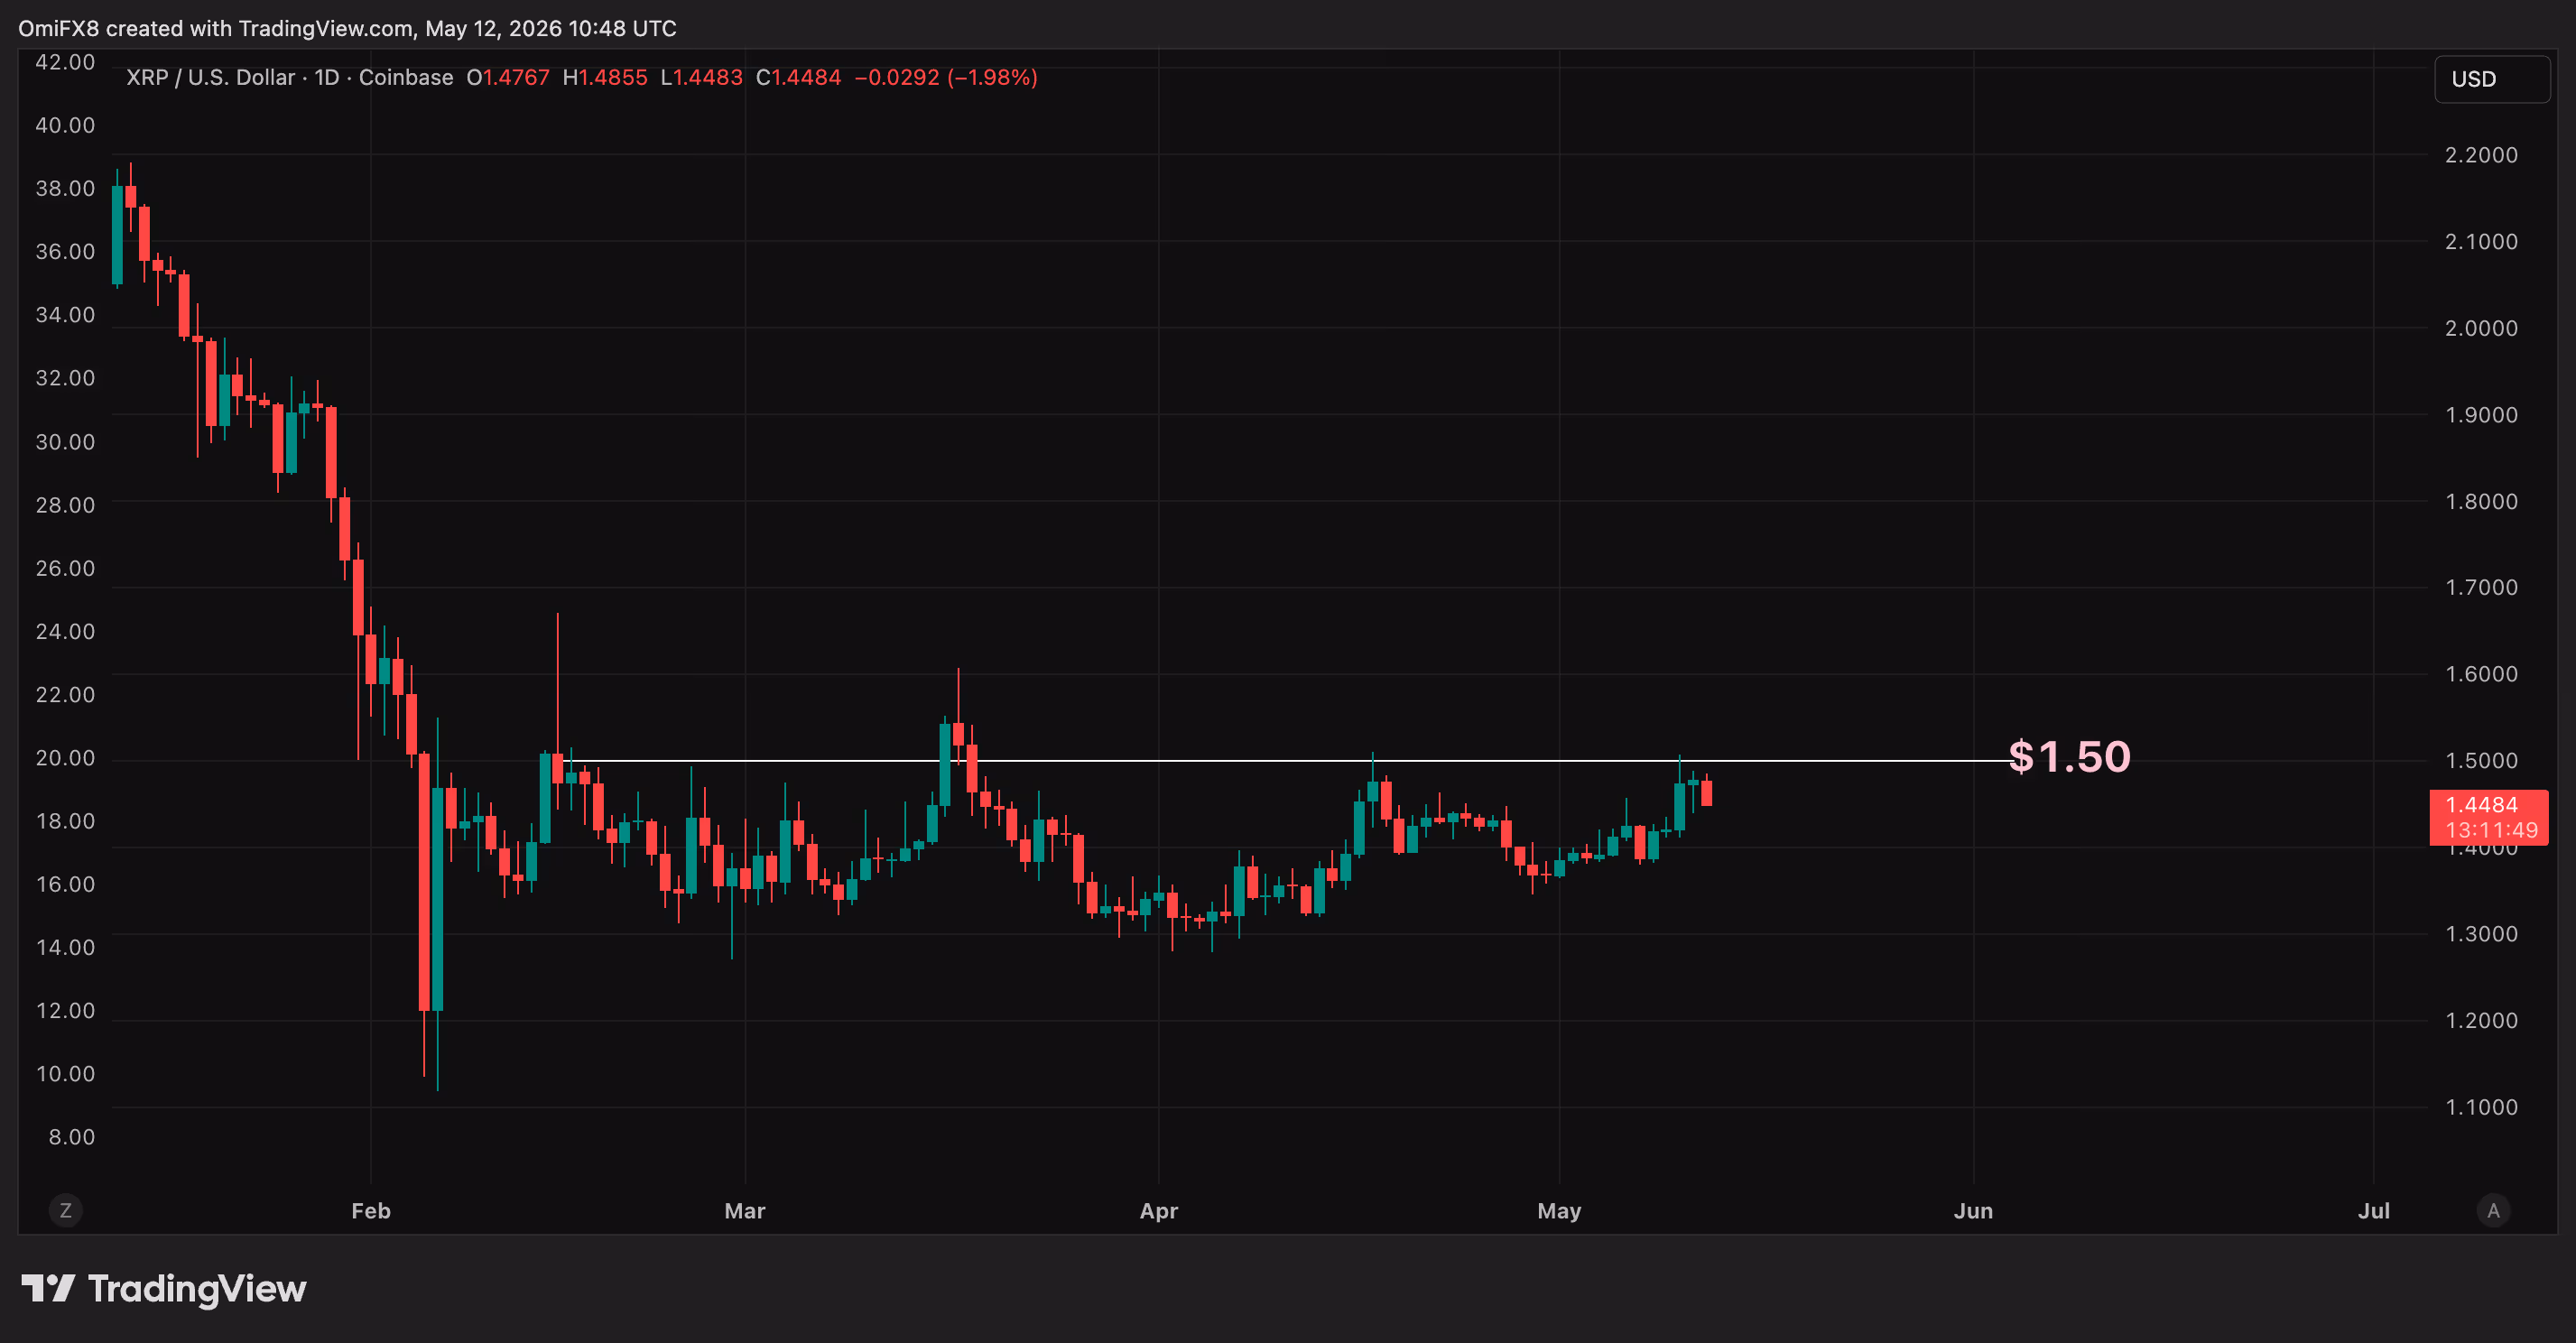
Beyond inflation, another key development is XRP and Solana’s (SOL) proximity to major supply zones. XRP briefly tested $1.50 today, a price where breakouts have repeatedly proved short-lived since February. The same applies to SOL, which has once again approached resistance near $97.
Institutional demand for these tokens is heating up. On Monday, the U.S.-listed spot XRP ETFs pulled in $25.8 million in investor funds, the most since Jan. 5. Bitcoin and solana ETFs also continued to attract money, while ether ETFs lost $16.9 million.
In traditional markets, WTI crude futures jumped over 3% and Nasdaq futures dropped over 0.7%, both pointing to risk aversion. Stay alert!
Read more: For analysis of today’s activity in altcoins and derivatives, see Crypto Markets Today . For a comprehensive list of events this week, see CoinDesk’s “Crypto Week Ahead.”
What’s trending
Today’s signal

The chart shows XRP’s daily price swings in candlestick format since January.
The cryptocurrency tested resistance at $1.50 early today and has since pulled back. Over the past three months, recovery rallies in the token have been cut short by persistent selling pressure above $1.50.
A decisive break above that level could trigger a much stronger rally as more traders start buying in, adding momentum to the move higher.

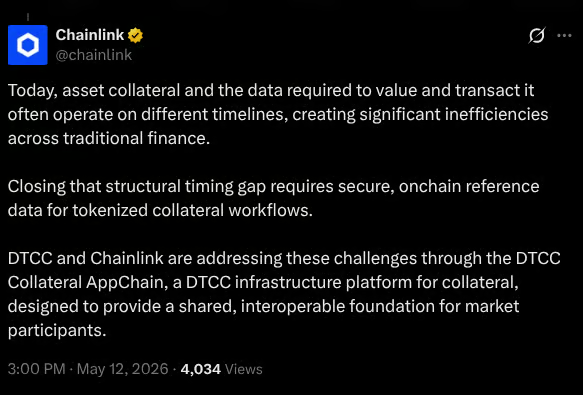
The Depository Trust & Clearing Corporation (DTCC) will integrate Chainlink infrastructure into its collateral management platform ahead of a planned fourth-quarter 2026 launch as it aims to support near real-time movement, valuation and settlement of tokenized collateral across financial markets and blockchains.
DTCC said its Collateral AppChain platform is designed to serve as shared infrastructure for institutions including custodians, triparty agents and collateral managers. The blockchain oracle provider’s technology will automate processes including margining, collateral optimization and settlement.
Nasdaq said that its research found 52% of firms expect to manage live tokenized collateral by the end of 2026. Yet, 70% of the investment banks, custodians, prime brokers and asset managers survey report settlement matching and delivery issues daily, reflecting the reliance on manual processes that continue to challenge efficiency.
The integration is intended to connect collateral agreements with pricing, valuation and asset movement data across markets, with the goal of enabling 24/7 collateral management workflows and improving capital efficiency, in the fourth quarter of 2026, according to DTCC’s announcement.
Chainlink is a decentralized oracle network that connects blockchains to real-world data, enabling smart contracts to function securely and accurately. DTCC currently custodies $114 trillion in liquid assets from stocks to exchange-traded funds.
Earlier this month, the company announced plans to pilot trading of tokenized securities in July ahead of a targeted October launch. The initiative involves more than 50 firms across traditional finance and digital assets, including BlackRock, Circle, Anchorage Digital and Fireblocks.

Source: Chainlink on X
Related: Veteran investor bets on Ethereum as AI agents drive tokenization demand
Biggest market infrastructure firms expand blockchain and tokenization efforts
DTCC’s rollout comes as some of the world’s biggest exchange and market infrastructure companies expand tokenized securities trading and settlement initiatives.
In March, Intercontinental Exchange, the parent company of the New York Stock Exchange, signed an agreement with tokenization platform Securitize to develop infrastructure for tokenized securities trading and onchain settlement. The initiative includes plans for blockchain-based shares and exchange-traded funds designed to support 24/7 trading and instant settlement.
Days earlier, the US Securities and Exchange Commission approved Nasdaq’s proposal to pilot trading of tokenized stocks and exchange-traded funds alongside traditional securities on the same exchange infrastructure. The program will initially cover select Russell 1000 stocks and major index-tracking ETFs.
Also in March, Nasdaq partnered with crypto exchange Kraken and tokenization company Backed to develop infrastructure for blockchain-based equities trading.
Data from RWA.xyz shows tokenized stocks have grown from roughly $511 million in distributed onchain value a year ago to more than $1.4 billion today, an increase of about 180%.
Magazine: Guide to the top and emerging global crypto hubs: Mid-2026


The Depository Trust & Clearing Corporation (DTCC) will use Chainlink infrastructure for its blockchain-based collateral management platform, extending earlier work between the firms into one of Wall Street’s core risk-management functions.
The firm said its Collateral AppChain will use Chainlink’s Runtime Environment (CRE) and data standard to support pricing, valuation, margining, collateral optimization and settlement. The AppChain is a Besu-based blockchain platform facilitating tokenization of assets and real-time, 24/7 collateral management.
DTCC’s platform is aimed at reducing the delays and fragmentation in today’s collateral systems, where assets are often trapped across institutions and time zones. By tokenizing collateral and automating workflows through smart contracts, the system is designed to enable near real-time collateral movement across both traditional financial markets and blockchain networks.
“By leveraging tokenization and distributed ledger technology (DLT) to modernize collateral mobility, our goal is to enable 24/7, near real-time collateral management across global markets and blockchains,” said Nadine Chakar, DTCC managing director and global head of digital assets.
Chainlink will provide the data and orchestration layer. Its technology will help connect asset prices, valuations and collateral movement, while supporting checks on eligibility, margining and settlement instructions. Chainlink is a decentralized oracle network that feeds blockchains with real-world data such as prices, weather, and APIs since blockchains cannot natively access external information on their own.
The platform runs within DTCC’s AppChain setup. DTCC unveiled the tokenized collateral platform last year, saying collateral mobility could become a key institutional use case for blockchain technology.
The Chainlink tie-up builds on Smart NAV, a 2024 pilot in which DTCC and Chainlink tested bringing mutual fund net asset value data onto blockchains.
JPMorgan, Franklin Templeton and BNY Mellon participated in the pilot, which focused on fund tokenization across multiple chains.
DTCC has also been expanding tokenization work beyond collateral. The company said earlier this month that more than 50 firms had joined a working group for The Depository Trust Company’s tokenization service, with limited production trades planned for July and a launch planned for October.
DTCC’s subsidiaries processed $4.7 quadrillion in securities transactions in 2025. Its depository subsidiary provided custody and asset servicing for securities issues valued at $114 trillion.
DTCC to bring Chainlink oracle technology into its Collateral AppChain marks a notable push toward real-time tokenized collateral across traditional markets and digital assets. The move targets a planned fourth-quarter 2026 rollout, with the goal of automating margining, collateral optimization and settlement by linking collateral agreements to live pricing, valuation and asset movement data across both conventional and crypto rails.
DTCC’s Collateral AppChain is pitched as shared infrastructure for custodians, triparty agents and collateral managers. By integrating Chainlink’s data feeds and decentralized oracle capabilities, the platform would support near-continuous collateral flows and enable 24/7 collateral management workflows, potentially tightening capital efficiency for institutions juggling tokenized securities and traditional assets.
Key takeaways
- DTCC plans a Q4 2026 launch for a tokenized-collateral workflow that utilizes Chainlink oracles to connect collateral terms with pricing and settlement data.
- Nasdaq research indicates 52% of firms expect to manage live tokenized collateral by end-2026, while 70% report daily settlement-matching and delivery issues, underscoring persistent inefficiencies in current processes.
- Industry momentum extends beyond DTCC: Intercontinental Exchange is pursuing tokenized securities infrastructure with Securitize, and Nasdaq is advancing tokenized equities on-chain through pilots with Kraken and Backed.
- Tokenized on-chain value for equities has surged, with RWA.xyz reporting on-chain tokenized stocks growing from about $511 million to $1.4 billion over the past year.
- DTCC’s initiative comes as regulators and market infrastructure players increasingly align on 24/7 settlement and cross-asset tokenization, setting the stage for broader adoption of tokenized collateral in mainstream markets.
DTCC’s Chainlink integration: what changes and why it matters
The Depository Trust & Clearing Corporation’s Collateral AppChain project aims to provide a unified, cross-market backbone for collateral management. By embedding Chainlink’s oracle network, DTCC intends to automate critical data flows that currently rely on manual reconciliation and disparate systems. The envisioned workflow would tie collateral agreements to live valuations, asset movement data and cross-market pricing, enabling near real-time margining, collateral optimization and settlement decisions across asset classes and chains.
DTCC’s announcement frames the integration as a strategic move to remove bottlenecks that slow down collateral life cycles in a world where tokenized assets—ranging from tokenized securities to other on-chain representations—operate across both traditional and distributed-ledger ecosystems. The goal is to support continuous collateral management and reduce the capital tied up in risk management frictions, a topic that has grown more urgent as institutions experiment with tokenized securities and on-chain settlement concepts.
The DTCC move sits within a wider wave of activity among market infrastructures pursuing tokenization and on-chain settlement. Earlier this year, Intercontinental Exchange—the parent company of the New York Stock Exchange—announced a collaboration with tokenization platform Securitize to build out infrastructure for tokenized securities trading and on-chain settlement. The plan envisions blockchain-based shares and exchange-traded funds capable of 24/7 trading and near-instant settlement for select assets. The DTCC–Chainlink collaboration highlights a convergence point for the legacy infrastructure and the burgeoning tokenization ecosystem. For investors and asset managers, a functioning, 24/7 collateral regime could shorten settlement cycles, improve liquidity planning and reduce the capital that must be reserved for collateral buffers. In practice, near real-time margining and automated collateral optimization could meaningfully lower funding costs and help institutions scale tokenized portfolios without default or settlement risk rising unchecked.
Several questions linger as the timeline for Q4 2026 approaches. First, the practical rollout will depend on the ability to harmonize legal frameworks, data standards and security practices across a broad coalition of custodians, banks, asset managers and technology providers. While Chainlink’s oracle feeds promise trusted data, the operational risk of cross-chain settlement, latency considerations and potential interoperability gaps will require careful risk management and auditing. Overall, the convergence of DTCC’s collateral platform with Chainlink’s data integrity, alongside a broader surge of tokenization initiatives from ICE, Nasdaq and other market incumbents, points to a more integrated and dynamic post-trade landscape. For market participants, the era of tokenized collateral that can move, be valued and settle continuously across multiple rails may finally be within reach, subject to the usual governance, risk and regulatory guardrails that accompany any major shift in market infrastructure.
What to watch next: the precise milestones and governance models for the Collateral AppChain rollout, the outcomes of ongoing tokenized securities pilots, and how regulators respond as 24/7 settlement concepts gain traction across asset classes.
Broader momentum in tokenized collateral and securities infrastructure
Implications for investors, users and builders
What remains uncertain and what to watch next
Crypto World
CleanSpark stock slides 9% as quarterly earnings miss estimates on bitcoin holdings loss
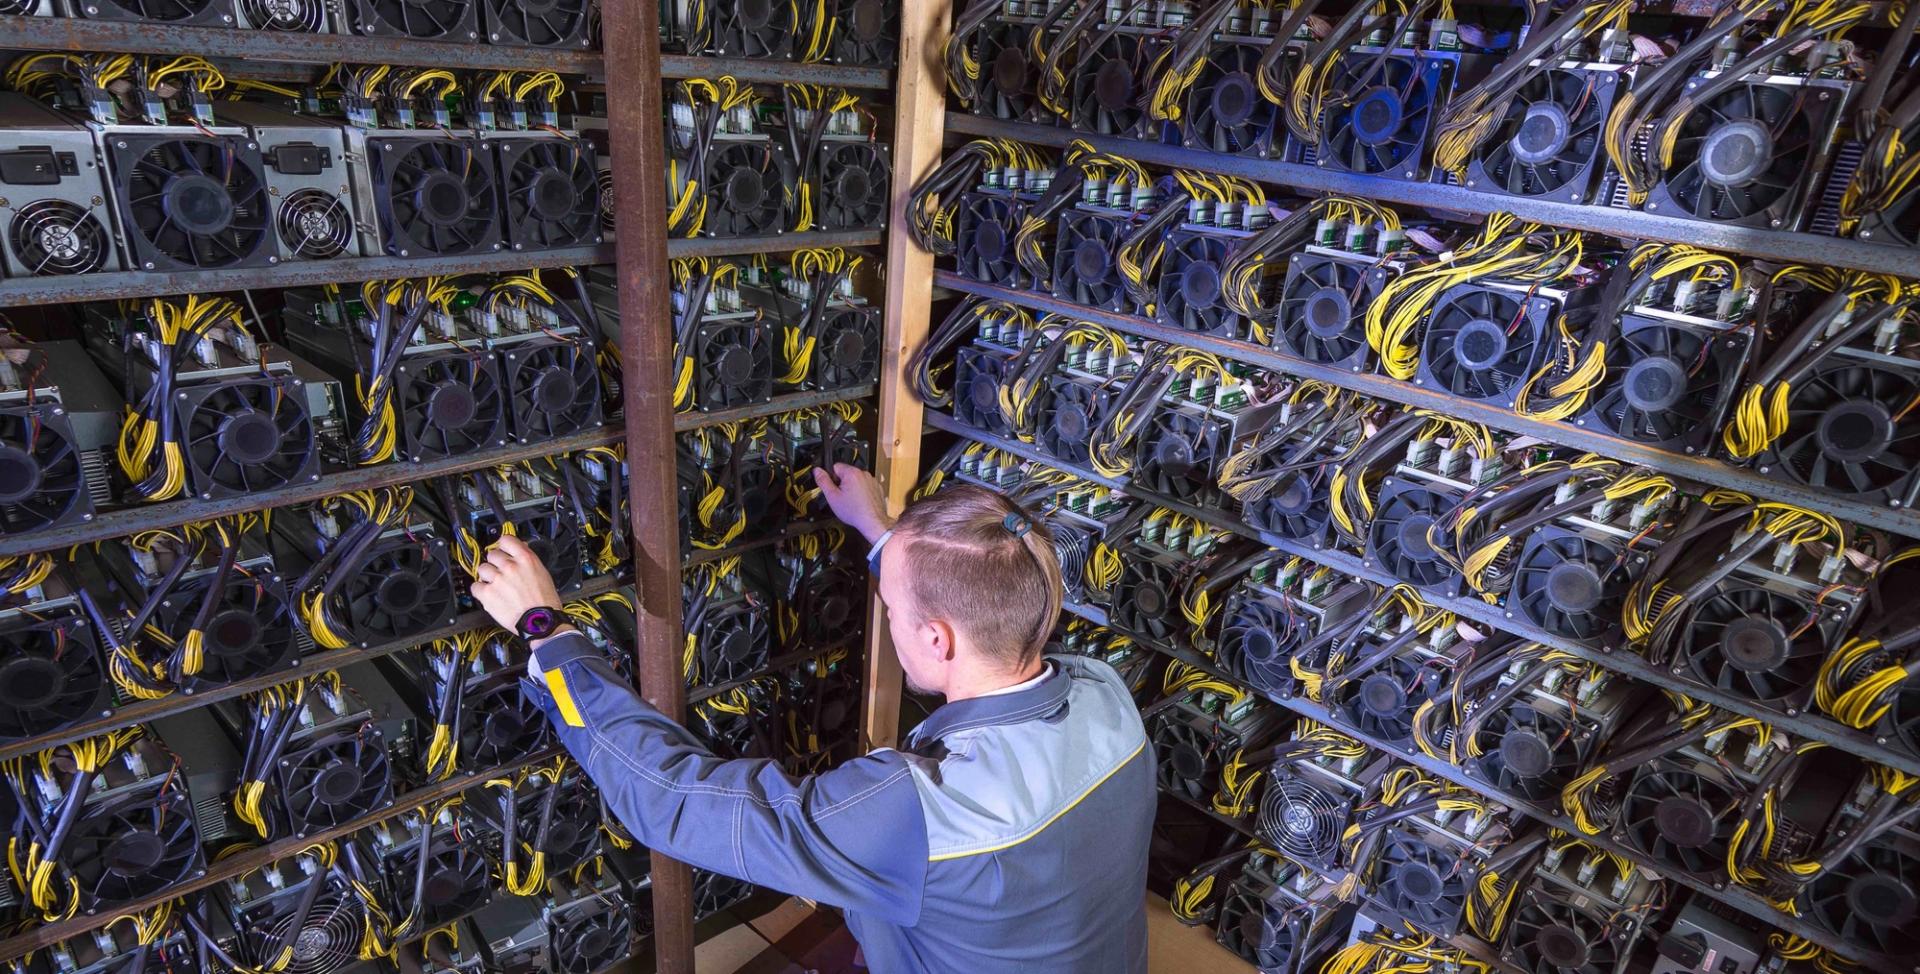

CleanSpark (CLSK) stock fell over 9.4% in pre-market trading on Tuesday after the U.S. bitcoin mining company reported a widening net loss of $378.3 million for its second fiscal quarter, hit by a significant non-cash adjustment to its digital asset holdings.
The company reported a net loss of $378.3 million for the quarter ending on March 31, a steep increase from the $138.8 million loss reported the same period last year. The loss of $1.52 per share was more than triple the analyst estimate on EPS of a 41 cents’ loss.
The firm’s bottom-hit was mainly driven by a $224.1 million non-cash bitcoin fair value loss, reflecting market volatility.
Quarterly revenue reached $136.4 million, down 25% from $181.7 million year-over-year, the report revealed, missing estimates of $154.3 million.
Despite the dip, CleanSpark expanded its infrastructure, doubling its megawatts (MW) under contract. CEO Matt Schutz said the company is pivoting to commercializing “AI/HPC-applicable assets,” joining a sector-wide shift toward leasing their computing power as AI data centers.
CFO Gary Vecchiarelly cited the firm’s balance sheet as a “competitive advantage, reporting a bitcoin holdings increase of 14% to $925.2 million in respects to last year. Total cash is $260.3 million, while total assets now sit at $2.9 billion with a long-term debt of $1.8 billion.
The estimated average cost of mining one bitcoin was $88,000 in mid-March, according to a Checkonchain difficulty regression model report. The current price of bitcoin hovers just over $80,000, meaning bitcoin mining companies across the board are operating at a loss
These economics have forced bitcoin miners to pivot toward artificial intelligence and high-performance computing infrastructure. The bitcoin mining industry had taken on roughly $70 billion in such contracts by late March.
Read More: Circle raises $222 million for Arc, beats Q1 earnings estimates but misses on revenue
Over the past week, Cardano’s ADA has surged 6%, making it one of the best-performing top-15 cryptocurrencies.
Numerous analysts have recently spotted that the asset has been following a similar pattern witnessed during previous bull cycles, suggesting this could be just the beginning of a major rally.
‘Printing by the Plan’
Earlier this month, ADA came close to reclaiming the $0.30 mark, reaching its highest level since mid-March. It currently trades around $0.27, while its market capitalization remains above $10 billion.
The asset is often among the most talked-about cryptocurrencies and becomes the subject of price predictions. One popular analyst who recently touched upon the matter is JAVON MARKS. The X user claimed that ADA continues to maintain a similar structure to that observed in 2021 and shows “signs of strength.” They set a target of $2.91, meaning that the price could be gearing up for a whopping 10x pump.
Prior to that, Sssebi opined that ADA had been consolidating over the past few months, as it did towards the end of 2024, which was later followed by a price increase above $1.30. That said, the analyst believes a surge above $1 is still in play this year.
For their part, Vuori Trading argued that ADA is still “printing by the plan” and sits in a “strong buy level.” The analyst envisioned a staggering jump to as high as $14, occurring sometime between Q3 2027 and Q1 2028.
Ali Martinez has also given his two cents lately. He emphasized the importance of the $0.25 support zone, noting that it has repeatedly acted as a major inflection point for the token.
For instance, in January 2023, ADA bounced off $0.25, resulting in an 88.27% jump over the following weeks. In September that year, this level again served as firm support, sparking a 243% surge.
More Bullish Signals
ADA’s Relative Strength Index (RSI) also supports the bullish case for further price increases. The ratio of the technical analysis tool has plunged to 22, indicating the asset has entered oversold territory and could be gearing up for a move north.

The RSI measures the speed and magnitude of recent price changes and provides traders with vital information about potential price reversal points. It runs from 0 to 100, and conversely, anything above 70 is interpreted as a warning for an impending pullback.
The post Top Cardano (ADA) Price Predictions as of Late: 10x Explosion on the Way? appeared first on CryptoPotato.

A customer shops for produce at an H-E-B grocery store on May 11, 2026 in Austin, Texas.
Brandon Bell | Getty Images
Prices in April rose at their fastest pace since May 2023. Traders on prediction market platforms think the peak in inflation isn’t here yet.
While the headline annual inflation rate rose 3.8% last month, traders on Kalshi think it is near certain that price increases will rise above 4% in 2026, and give almost two-in-three odds that it goes above 4.5%.
Traders also see an almost 40% chance that inflation will cross 5% this year. That hasn’t happened since February 2023.
That’s significantly higher than Wall Street projections. Economists polled by FactSet forecast that inflation will peak at an average of 3.8% in the current quarter, and fall to 2.8% by the end of the year.
Households, though, are more in-line with the prediction market forecast. A University of Michigan survey released Friday found that consumers see inflation of 4.5% over the next year. On Polymarket, traders believe there is a 50% chance that U.S. inflation rises above 4.5% in 2026.
Headline inflation jumped last month as energy prices soared due to the U.S.-Iran war and the closure of the Strait of Hormuz. But core inflation, which measures the change in prices excluding food and energy, also rose 0.4% in April and 2.8% year-over-year.
Food, materials, shelter, lodging
“The first order effect from the conflict in the Middle East [has] been a shock to oil prices, which [has] translated very quickly to what consumers are paying at the pump, but the next frontier to watch is rising input prices for food and materials,” said Skyler Weinand, chief investment officer at Regan Capital.
While the U.S.-Iran conflict drove energy prices higher, not all of the inflation story can be explained easily by the war. Notably, shelter prices rose 0.6% in April.
Traveling got more expensive too. Airfares jumped 2.8% in the month — as airlines passed through to consumers rising jet fuel prices — and lodging away from home rose 2.4%. Apparel was up 0.6%, albeit a smaller increase than in March.
But the energy shock is what’s driving headline inflation. So long as the strait, a passageway for 20% of the world’s crude oil before the war, remains closed, consumers are unlikely to see immediate relief. U.S. oil prices again crossed $100 a barrel on Tuesday.
Vessels in the Strait of Hormuz, Musandam, Oman, May 8, 2026.
Stringer | Reuters
In fact, a majority of Kalshi traders don’t think maritime traffic through the strait will return to normal until October.
The longer the strait is closed, the greater the risk to prices. Perhaps as a consequence, Kalshi traders now give a more than 50% chance that the Federal Reserve will raise interest rates by July 2027.
“In the first quarter of disruption, the oil supply shock is largely about higher prices,” wrote Seth Carpenter, chief global economist at Morgan Stanley, in a note on Monday. “A second quarter of disruption with continued price escalation would start to diminish the ‘transitory’ nature of the shock… and central banks would have to pivot from delays to policy stance changes.”
— CNBC’s Liz Napolitano contributed reporting
Disclosure: CNBC and Kalshi have a commercial relationship that includes customer acquisition and a minority investment.
Markets shift and headlines fade, but the core principles of building long-term wealth remain constant. Join us for our third CNBC Pro LIVE, where investors of all backgrounds – from financial professionals to everyday individuals – come together to cut through the noise and gain actionable strategies for smarter, more disciplined investing. No matter where you’re starting from, you’ll leave with clearer thinking, stronger strategies. Enter your email here to get a discount code

Why many Portsmouth trades businesses are struggling to scale despite strong demand
US stocks today: S&P 500, Nasdaq end lower as inflation, Iran tensions weigh

DTCC Picks Chainlink As Data Layer For 24/7 Tokenized Collateral Platform
Manchester United reach agreement with Casemiro over contract clause amid transfer speculation

US brings back mandatory military draft registration

Steven Gerrard disagrees with Gary Neville over ‘shock’ Chelsea and Arsenal claim | Football


-
 Crypto World4 days ago
HarrisX Poll Found 52% of Registered Voters Support the CLARITY Act
-

 Fashion4 days ago
Weekend Open Thread: Marianne Dress
-

 Crypto World5 days ago
Upbit adds B3 Korean won pair as Base token gains Korea access
-
 NewsBeat6 days ago
NCP car park operator enters administration putting 340 UK sites at risk of closure
-

 Fashion1 day ago
Coffee Break: Travel Steam Iron
-

 Fashion2 days ago
What to Know Before Buying a Curling Wand or Curling Iron
-

 Tech3 days ago
Auto Enthusiast Carves Functional Two-Stroke Engine from Solid Metal
-

 Politics22 hours ago
What to expect when you’re expecting a budget
-

 Politics4 days ago
Politics Home Article | Starmer Enters The Danger Zone
-
 Business3 days ago
Ignore market noise, India’s long-term story intact, say D-Street bulls Ramesh Damani and Sunil Singhania
-

 Tech2 days ago
GM Agrees To Pay $12.75 Million To Settle California Lawsuit Over Misuse Of Customers’ Driving Data
-

 Crypto World6 days ago
BlackRock CEO Larry Fink Discusses a New Asset Class
-

 Entertainment6 days ago
Sarah Paulson Called Out For Met Gala ‘Hypocrisy’
-

 Entertainment5 days ago
General Hospital: Ric & Ava Bombshell – Ric’s Massive Secret Exposed!
-
 Sports6 days ago
NBA playoff winners and losers: Austin Reaves is not loving Lakers vs. Thunder matchup, but Chet Holmgren is
-

 Entertainment6 days ago
Bold and Beautiful Early Spoilers May 11-15: Steffy Revolted & Liam Overjoyed!
-

 Politics5 days ago
Simon Cowell Says He Was ‘Horrible’ To Susan Boyle During BGT Audition
-

 Sports6 days ago
UEFA Champions League final schedule, teams, venue, live time and streaming | Football News
-

 Crypto World6 days ago
Robinhood says Wall Street is building onchain
-

 Tech7 days ago
Apple and Samsung are dominating smartphone sales so thoroughly that only one other company makes the top 10
You must be logged in to post a comment Login