

Crypto World
Ethereum Price Prediction: ETH Faces Critical Test at $2,100 Support

TLDR:
- Ethereum is still trapped inside a descending channel after rejection at macro resistance.
- The $2,050 to $2,100 zone is now the most important support area for ETH bulls.
- A rebound from current levels could open the path toward $2,600 and possibly $2,800.
- ETH/BTC is testing long-term support, increasing focus on a possible altcoin rotation.
Ethereum’s price is approaching a decisive technical zone. Price is compressed between weakening support and stubborn resistance. Can bulls reclaim momentum or face another round of downside pressure?
Ethereum Bulls Defend Critical $2,100 Zone
Ethereum is trading at a key technical inflection point after another failed attempt to break higher resistance. The asset remains trapped inside a descending channel, reflecting market hesitation after weeks of unstable price action.
The latest rejection from the macro descending trendline reinforced seller dominance near upper liquidity levels. Each recent rally has followed the same pattern, with ETH pushing into resistance before quickly losing momentum. This repeated behavior has increased caution across the market.
Analysts now view the $2,050–$2,100 zone as Ethereum’s most important short-term structure. This area is serving as technical, psychological, and momentum support simultaneously. As long as Ethereum holds above this region, the broader recovery structure remains valid.
Price has also continued defending higher lows since the February sell-off. That pattern suggests buyers are still active beneath the surface despite weak breakout momentum. However, bulls must now shift from passive defense to aggressive expansion.
A rebound from the lower channel support could allow Ethereum to revisit the $2,600 resistance area. If buying volume strengthens during that move, ETH may also test the $2,800 zone, which remains a major psychological target.
A popular crypto analyst noted on X that Ethereum is now sitting at a “technical crossroads,” warning that bulls must show strength immediately or risk invalidating the bullish continuation setup.
ETH/BTC Setup Adds Pressure on Ethereum Recovery
Ethereum’s weakness is also visible against Bitcoin. The ETH/BTC pair has spent months trading beneath a major descending resistance trendline while Bitcoin maintained market leadership.
This underperformance has slowed momentum across the broader altcoin sector. Historically, altcoin rallies tend to strengthen when Ethereum begins outperforming Bitcoin. As a result, traders are monitoring ETH/BTC closely for signs of reversal.
The pair is currently testing a long-term support zone that has previously attracted demand. Similar setups in past cycles appeared near the end of Bitcoin dominance phases, often before capital rotated aggressively into alternative digital assets.
A recent analyst post on X stated that ETH/BTC is approaching one of the most important technical moments of the cycle. The analyst suggested that a breakout above resistance could trigger renewed risk appetite across the market.
For now, Ethereum remains compressed between falling resistance and weakening support. This tightening range usually ends with a strong directional move once one side loses control.
If bulls reclaim the macro trendline, market sentiment could improve rapidly. Until then, Ethereum price analysis continues pointing to a high-stakes battle where support preservation remains the immediate priority for traders.


Crypto World
Market Movers: Meta’s Cloud Ambitions, Warsh’s Inflation Update, and Nike’s China Troubles
Key Takeaways
- Meta is preparing to enter the AI cloud infrastructure space, positioning itself against established enterprise providers
- Federal Reserve Chair Kevin Warsh indicated that inflationary pressures are subsiding while maintaining commitment to the 2% objective
- Major indexes including the S&P 500 and Dow Jones advanced as the second half of 2026 began
- Nike stock declined following cautious guidance on China market performance, overshadowing positive earnings results
- Crude oil values retreated as diplomatic progress between Washington and Tehran reduced supply concern
Meta Prepares to Challenge Cloud Giants With AI Infrastructure Offering
Meta emerged as a standout performer following news that the technology giant is developing a standalone AI cloud infrastructure platform.
This strategic expansion would mark a significant departure from Meta’s traditional advertising-focused revenue model, positioning the company against entrenched cloud computing leaders serving artificial intelligence enterprise clients.
Market participants have demonstrated considerable enthusiasm for firms expanding AI infrastructure capabilities throughout this year. Meta’s substantial experience operating massive-scale AI systems across its social media ecosystem is viewed as a competitive advantage in penetrating this expanding market segment.
Warsh Signals Declining Inflation Threat at Federal Reserve
Federal Reserve Chair Kevin Warsh communicated to financial markets that inflationary threats have diminished, while emphasizing the central bank’s continued focus on achieving its 2% inflation benchmark.
His remarks preceded Thursday’s employment data for June, which market observers are scrutinizing for indicators regarding the trajectory of monetary policy adjustments.
For technology-oriented and expansion-focused equities, declining inflation expectations typically represent favorable conditions. Reduced borrowing costs generally enhance the present value of projected earnings, particularly benefiting companies in rapid-growth industries.
Equity Markets Maintain Upward Trajectory as New Half-Year Begins
U.S. stocks continued their positive momentum, with both the S&P 500 and Dow Jones Industrial Average recording advances on July’s opening trading session.
These gains follow what proved to be one of the most robust quarterly performances for equity markets since 2020. Market participants maintained their optimistic stance on long-term profit expansion despite persistent questions surrounding interest rate policy and economic conditions.
Semiconductor equities experienced modest headwinds throughout the trading day, though robust performance across industrial, healthcare, and consumer sectors provided sufficient support to keep broader market indices in positive territory.
Nike Shares Retreat Despite Earnings Success on China Market Concerns
Nike delivered quarterly financial results exceeding analyst projections, yet the stock declined following management’s cautious assessment of persistent challenges in the Chinese market.
Market participants concentrated on the company’s forward-looking statements rather than historical performance metrics. Leadership suggested the recovery timeline may extend beyond previous market expectations.
Nike’s quarterly performance serves as an important barometer for international consumer demand patterns. The market’s reaction to the report exemplifies a consistent theme throughout this earnings cycle — forward guidance carries greater weight than retrospective achievements.
Crude Oil Values Decline Following Diplomatic Progress With Iran
Crude oil prices retreated after diplomatic engagement between the United States and Iran alleviated concerns regarding potential interruptions to global supply chains.
Declining energy prices help moderate inflationary forces while reducing operational expenses for sectors including aviation, retail distribution, and manufacturing operations.
Given inflation remains a primary consideration for market participants, developments in energy markets will continue receiving significant attention alongside forthcoming economic indicators.

Bitcoin has remained under pressure after U.S. spot ETFs recorded $222.64 million in outflows, while Changpeng Zhao has reiterated his belief that the cryptocurrency can reach $1 million over the next decade.
Summary
- Changpeng Zhao says Bitcoin could reach $1 million as global ownership remains below 1%.
- U.S. spot Bitcoin ETFs recorded $222.64 million in net outflows, led by BlackRock’s IBIT.
- Bitcoin trades below key resistance, with $57.8K support and $63.7K–$65.3K as upside targets.
According to an interview Zhao gave to Block, the Binance founder argued that Bitcoin ownership remains extremely limited worldwide, with fewer than 1% of people currently holding the asset.
He said the low level of adoption leaves substantial room for future demand as more retail and institutional investors enter the market over multiple cycles.
Low ownership remains central to Zhao’s bullish outlook
Building on that argument, Zhao said Bitcoin could climb to around $600,000 during the next major market cycle, representing roughly a fivefold increase from current levels. He added that another cycle would only need to double that valuation for Bitcoin to reach the $1 million milestone, describing the scenario as achievable if adoption continues to expand.
Although Zhao acknowledged he could not predict exactly when those milestones would be reached, he maintained that long-term price appreciation would depend more on rising ownership than on short-term market speculation. He also noted that institutional participation, alongside continued retail adoption, could support Bitcoin’s value over time as ownership becomes more widespread.
Zhao’s comments come as long-term Bitcoin price forecasts remain a recurring topic across the digital asset industry, with several market participants continuing to argue that growing global acceptance could support higher valuations over the coming years.
Institutional demand pauses as technical resistance holds
While Zhao focused on Bitcoin’s long-term adoption story, U.S. spot Bitcoin ETFs experienced a setback on June 30 after recording $222.64 million in net outflows. Data from SoSoValue showed BlackRock’s IBIT accounted for the largest withdrawal, posting $212.45 million in net outflows during the session.

Even with the daily withdrawals, cumulative net inflows across U.S. spot Bitcoin ETFs stood at $51.15 billion, while total net assets remained at $70.95 billion. Daily trading volume reached $2.53 billion, indicating that investors continued to trade actively despite the temporary pullback in fund flows.
The ETF withdrawals also coincided with Bitcoin struggling to reclaim key technical levels. On the 4-hour chart, the cryptocurrency traded near $60,100, just above the 23.6% Fibonacci retracement around $60,065, while remaining below the Supertrend resistance near $60,900. A descending trendline connecting lower highs since mid-June continued to cap rallies, leaving sellers in control unless buyers reclaim nearby resistance.
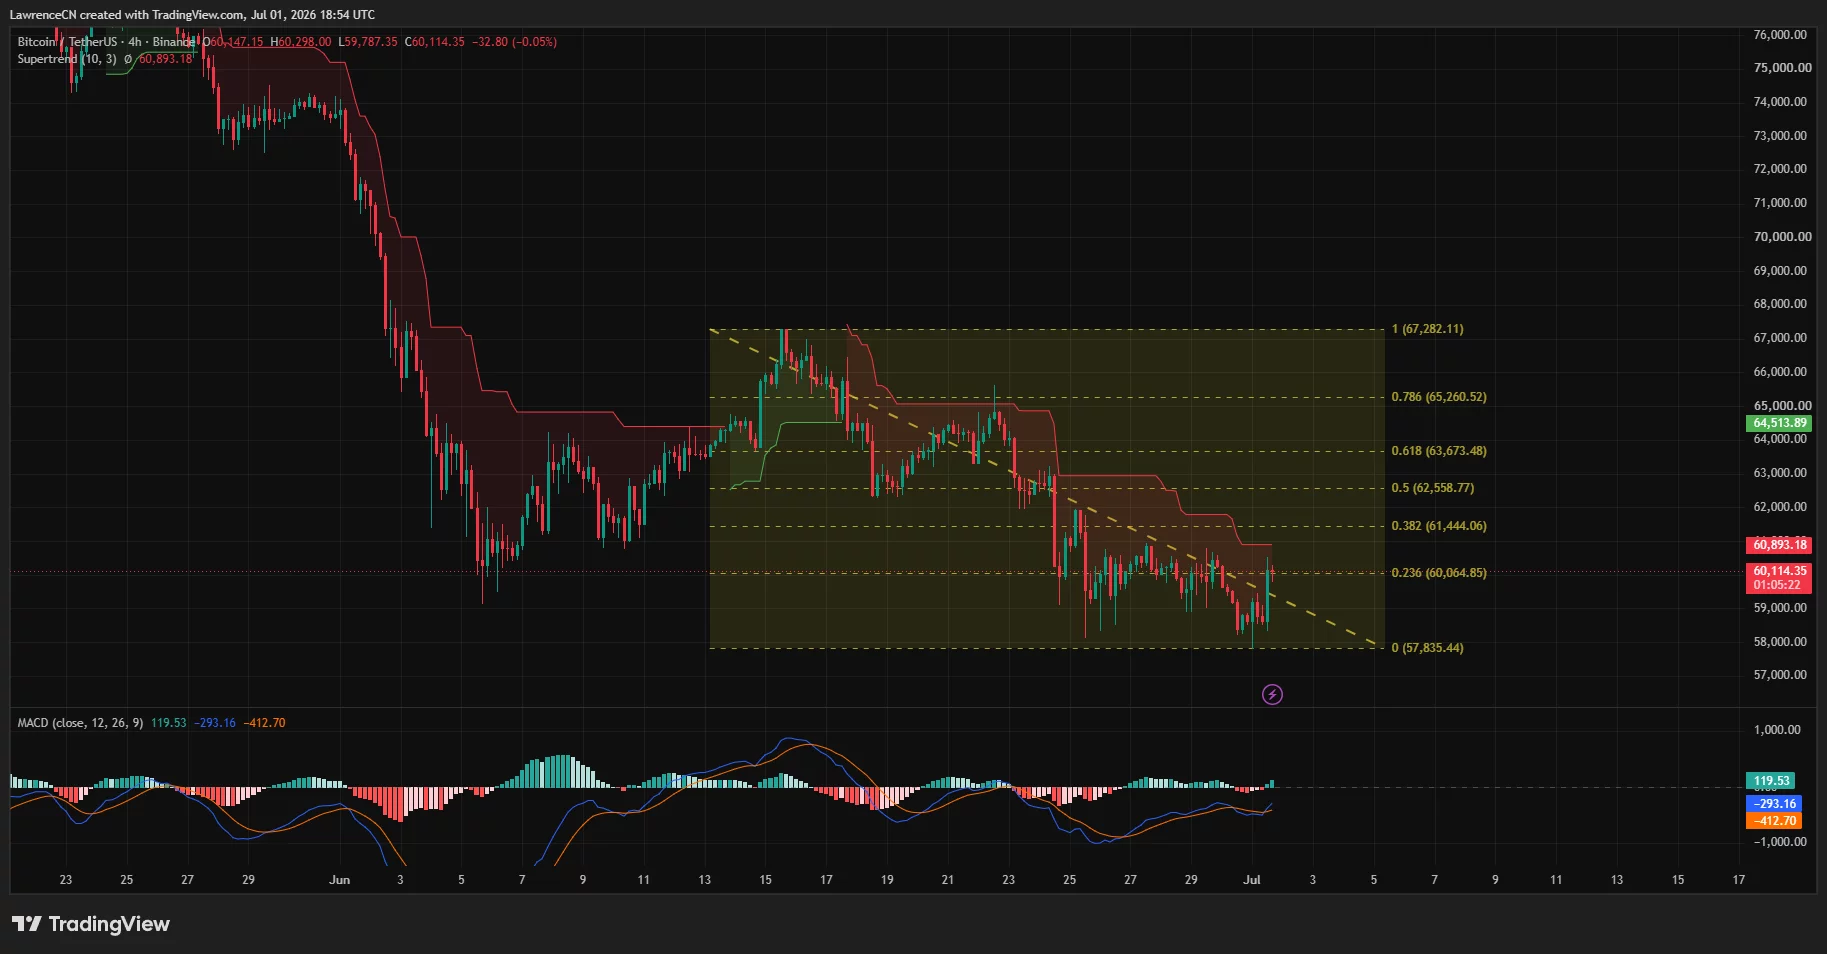
If buyers manage to break above the Supertrend and the descending trendline, Bitcoin could target the 38.2% Fibonacci level near $61,444, followed by $62,559 at the 50% retracement. A sustained move beyond those barriers would expose the 61.8% Fibonacci level around $63,673, with the 78.6% retracement near $65,261 becoming the next major upside objective.
On the downside, losing the $60,065 Fibonacci support could increase selling pressure toward the recent swing low around $57,835. A break below that level would invalidate the current rebound attempt and leave Bitcoin vulnerable to a deeper decline if buyers fail to step in.
Momentum indicators, however, hinted at improving conditions. The MACD histogram has turned positive and the MACD lines have started curling higher, suggesting bearish momentum is fading even though a confirmed bullish trend reversal has yet to develop.
For now, Bitcoin’s short-term direction may depend on whether institutional demand returns after the latest ETF outflows.
A recovery above nearby resistance could strengthen the case for a move toward the mid-$63,000 region, while another rejection may keep attention on support near $57,800. Zhao’s $1 million forecast, meanwhile, continues to rest on a much longer timeline driven by rising global Bitcoin ownership rather than short-term fund flows.
Disclosure: This article does not represent investment advice. The content and materials featured on this page are for educational purposes only.
Crypto World
Crypto claws back some losses but derivatives markets point to more pain ahead: Crypto Markets Today

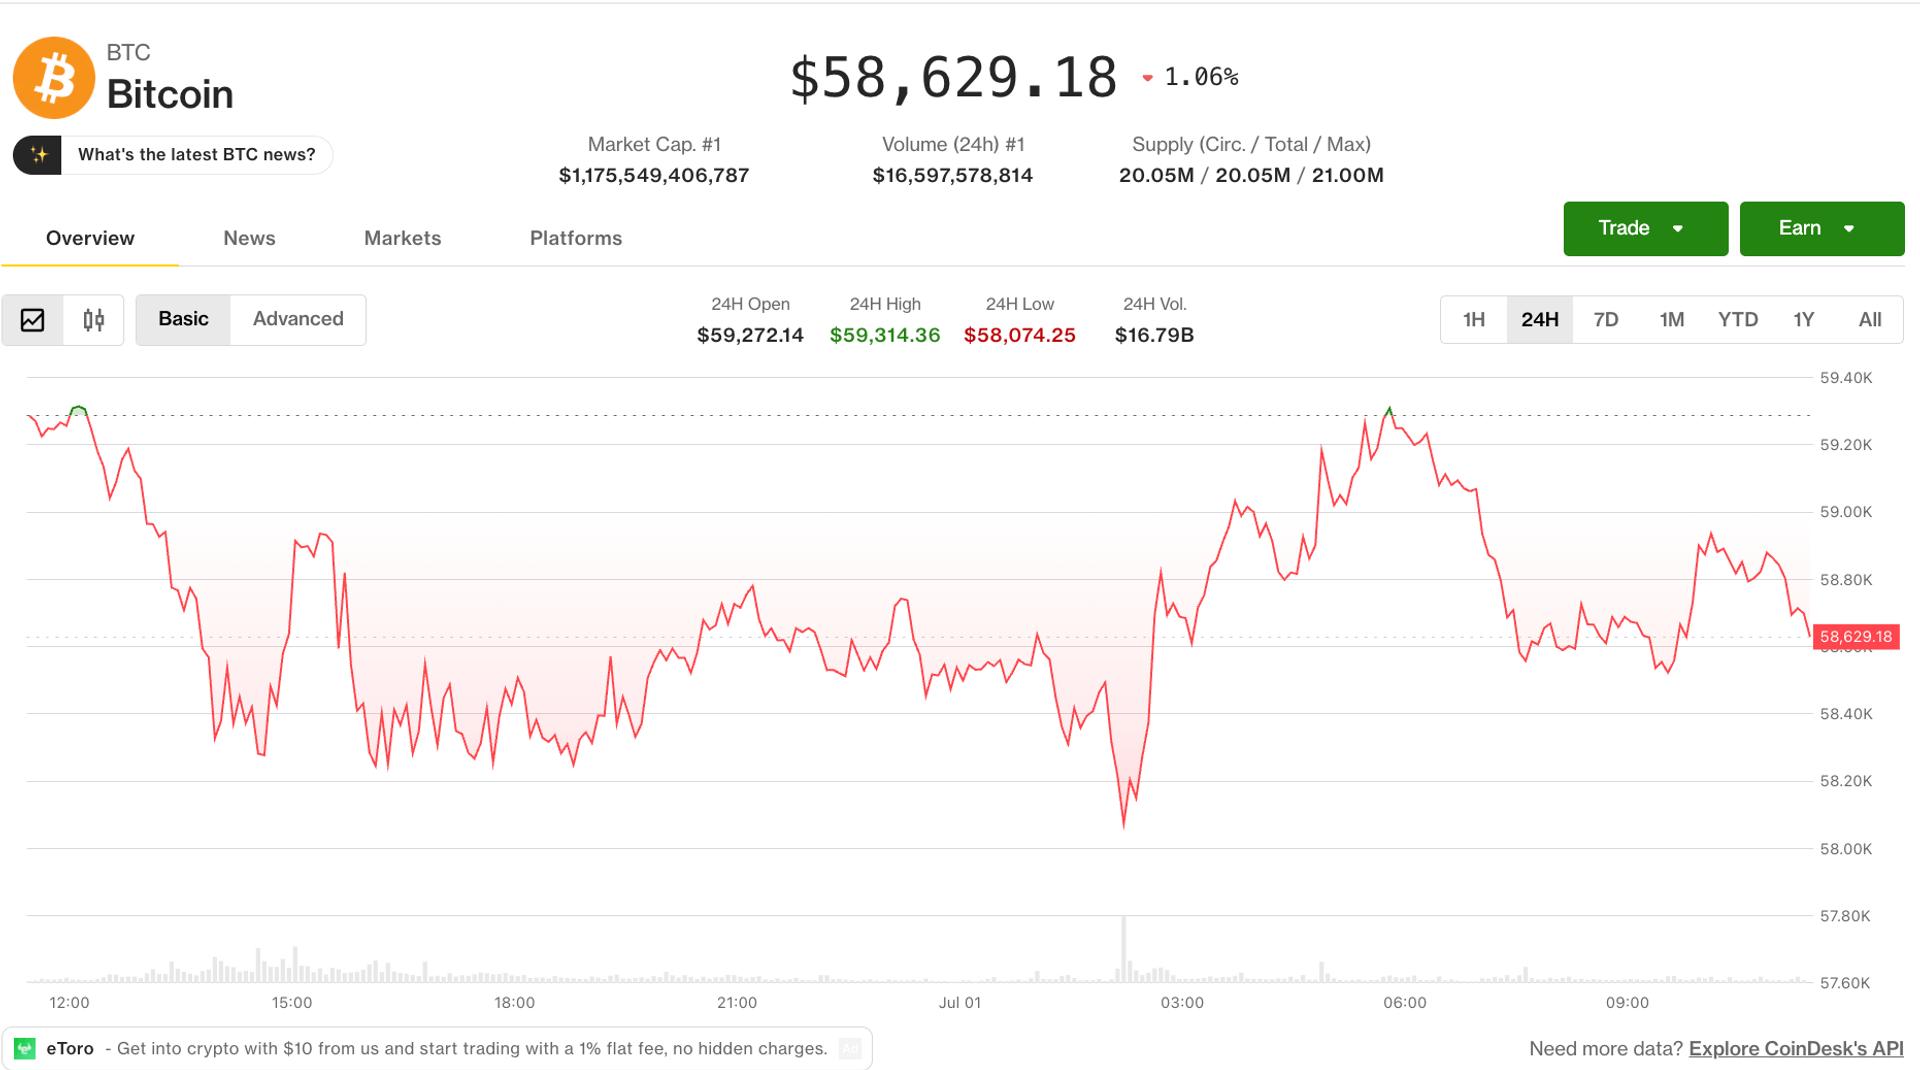
Bitcoin rose 0.3% to $58,700 on Wednesday, showing a sliver of strength after spiking down to $57,700, the lowest point since September 2024, shortly after midnight UTC.
Ether (ETH) is at $1,580, having also experienced a slight relief bounce since 01:00 UTC.
U.S. equity index futures are lower since midnight UTC, with S&P 500 futures and Nasdaq 100 futures in the red by 0.2%-0.4%
Risk assets like crypto and tech stocks have been struggling in recent weeks as concerns of impending inflation have lifted the U.S. dollar and made traders cautious.
The altcoin market has been the hardest hit because it lacks the liquidity and demand to deal with precipitous moves to the downside and liquidation cascades.
Derivatives positioning
- A total of $395 million worth of crypto futures bets have been liquidated in 24 hours, with bullish plays accounting for most of the tally. That’s hardly surprising given BTC’s dip to lows under $58,000 early in the day.
- The real story is crude futures listed on crypto exchanges. They have seen liquidations worth $15 million, the fifth-largest tally among all tokens. The figure shows just how popular TradFi trading has become on crypto exchanges.
- BTC’s futures open interest (OI) jumped to 768K BTC from 740K BTC a day ago. While the influx of money is encouraging, it’s unclear whether the bias is for bullish or bearish bets. For instance, the annualized funding rates hover near 5%, hinting at a bullish bias, while the 24-hour cumulative volume delta is negative, suggesting bears are being more aggressive and trading with market orders rather than passive limit orders.
- Gold perpetual futures OI hit a record high of 222K XAU tokens. This comes as the metal’s spot price shows a bearish death cross, signaled by the 50-day simple moving average crossing below the 200-day SMA. Prominent gold ETFs are displaying a similar bearish pattern.
- Bitcoin and ether’s 30-day implied volatility indexes are steady after June’s double-digit gains. Bitcoin’s index, BVIV, is now hemmed between the 200-day average as resistance and the 50-day as support. A break above the 200-day MA might mean new turbulence and a deeper price slide.
- On Deribit, bitcoin and ether puts remain pricier than calls across all time frames as traders seek downside protection.
- Key flows at over-the-counter desk Paradigm featured demand for the September expiry bitcoin put at the $50K strike price. This is a bet that prices could slide below $50K by the end of the third quarter. Meanwhile, someone lifted a SOL call option at the $86 strike. The token is currently trading around $75.
Token talk
- While the broader altcoin market is struggling, Solana-based DeFi token jupiter (JUP) has posted a trend reversal, rising by 11% since midnight UTC with a 55% increase in daily trading volume.
- The increase comes alongside a jump in total value locked (TVL), with the protocol, a decentralized exchange (DEX) aggregator. TVL has risen to more than 20 million SOL from 13.9 million in May.
- Stellar lumens (XLM) extended gains, rising from $0.168 on Sunday to $0.196, an increase of 17%.
- The strong performance of a select few altcoins kept CoinMarketCap’s “Altcoin Season” index sticky at around 48/100 after ending June little changed despite weakness across the sector.
- AI tokens have been the recipient of that weakness. Bittensor (TAO) lost 2.5% on Wednesday and is now down by over 30% since June 15.


Cloudflare opened a waitlist Wednesday for its Monetization Gateway, a new tool letting customers charge for any web page, dataset, API or MCP tool sitting behind its network. Payments settle in stablecoins over the x402 protocol. The announcement came from Cloudflare's official X account Wednesday… Read the full story at The Defiant
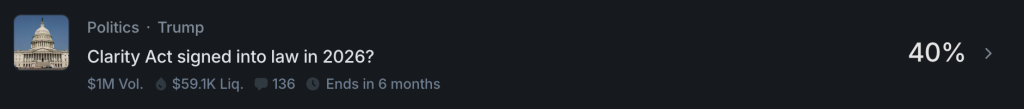
Jefferies analyst Andrew Moss and his team warned Monday that the CLARITY Act, the defining crypto regulation bill of this Congress, faces a compressing Senate window, with Polymarket odds of passage by end-2026 now sitting at 48%, down from 70% in mid-May.
The bank is flagging elevated near-term crypto volatility across both tokens and blockchain-related equities as the legislative outcome sharpens into a binary event.
The drop in prediction-market odds reflects three converging pressures: unresolved ethics provisions, outstanding disputes over illicit finance language, and a Senate floor calendar that offers roughly 20 legislative days before the August recess.
Miss that window and the market structure bill does not simply get rescheduled, it gets repriced entirely. “Failure to pass Clarity before the August recess could push the bill out to next year, or even later, if Democrats flip the Senate in November,” Moss and his colleagues said in the note.
Jefferies specifically flagged Coinbase (COIN), Circle (CRCL), and Bullish (BLSH) as the crypto-linked equities most exposed to legislative-driven swings, alongside select tokens.
Discover: The Best Token Presales
CLARITY Act: The August Recess Is the Real Deadline
The CLARITY Act cleared the Senate Banking Committee on May 14 in a 15-9 bipartisan vote, drawing all Republican members and two Democrats. That looks like momentum. The procedural math that follows does not.
Before any full Senate floor vote, lawmakers must reconcile two separate committee-passed versions, the Banking Committee’s bill and the Senate Agriculture Committee’s Digital Commodity Intermediaries Act, then align the merged text with the House-passed H.R. 3633 (which cleared 294-134 in July 2025), and clear a 60-vote cloture threshold to overcome a filibuster.
That is four distinct procedural gates, compressed into approximately 20 working legislative days before recess. First, the Banking and Agriculture versions contain substantively different approaches to CFTC jurisdiction over digital commodities, and no merged text has been published as of late June.
Second, the ethics provisions attached during committee markup have not found consensus, with some members seeking to strip them and others treating them as non-negotiable. Third, law enforcement agencies have raised objections to specific DeFi exemption language, adding another negotiating variable that could slow floor scheduling.
JPMorgan made a similar call earlier in June, warning that the crypto market structure bill may have only a limited window for passage this year as the congressional calendar tightens ahead of midterm elections.
The stablecoin yield debate, which Standard Chartered has estimated could redirect up to $500 billion in deposits if resolved permissively, remains an open variable that complicates any rushed compromise. If the bill slips past August, it re-enters a Senate environment potentially reshaped by November elections, at which point Democratic gains could shift the 60-vote calculus against it entirely.
What Jefferies Is Actually Flagging, And What Polymarket Already Priced In
The Jefferies note is not the first sell-side warning on this timeline, but the 22-point collapse in Polymarket odds since mid-May gives it harder backing than prior analyst commentary.
Galaxy Digital’s Alex Thorn cut his firm’s passage probability from 60% to 50% on June 26, citing calendar compression rather than policy disputes as the primary driver. Jefferies has now landed below that level on the prediction market, suggesting the street is converging on sub-50% as the base case.
What the Jefferies note adds is equity-specific granularity. For Coinbase, the exposure is direct: the exchange’s product suite, staking, lending, rewards on USDC holdings, operates in the regulatory gray zones the CLARITY Act would either sanction or constrain. A delay preserves the current ambiguity but also preserves enforcement risk, particularly with an SEC that has shown willingness to act on custody and yield products.

For Circle, the situation is genuinely mixed: the current bill text would reportedly close the loophole enabling third parties like Coinbase to offer rewards on USDC, which could suppress USDC growth metrics, while a delay gives Circle more runway to diversify revenue beyond stablecoin reserve income before that provision lands.
The detail most readers are missing is the asymmetry in the delay scenario. Recent guidance from the SEC, CFTC, and OCC has improved the near-term operating environment for institutional crypto participants, but Jefferies is explicit that agency guidance is reversible.
A future administration can undo every no-action letter and staff bulletin without legislation. The CLARITY Act would create durable statutory clarity that agencies cannot unwind unilaterally, that distinction is what makes the bill material beyond a single news cycle.
Don’t Miss Out on Our $1,000 USDT Airdrop on ByBit
The post CLARITY Act Faces Sub-50% Odds as Senate Clock Ticks Toward August appeared first on Cryptonews.

Key Takeaways
- OPEN shares climbed more than 9% Wednesday, reaching approximately $5.05
- Russell 3000 Index welcomed Opendoor, with inclusion taking effect June 26
- Leadership compensation structure emphasizes performance metrics, attracting investor focus
- Eric Jackson from EMJ Capital projects $82 per share by 2028 and $500 by 2033
- Options traders showed strong conviction: 99,802 call contracts at double normal volume, Put/Call Ratio at 0.14
Opendoor Technologies (OPEN) shares surged over 9% during Wednesday’s session, reaching the $5.05 level, fueled by a combination of benchmark index entry, optimistic Wall Street commentary, and aggressive derivatives positioning in the proptech name.
Opendoor Technologies Inc., OPEN
The rally followed confirmation that Opendoor secured a spot in the Russell 3000 Index, officially taking effect at market close on June 26. Such benchmark additions typically trigger institutional buying from passive funds replicating the index composition.
Market participants have also taken note of CEO Kaz Nejatian’s compensation framework, which emphasizes performance-driven incentives. This structure demonstrates executive alignment with shareholder value creation over the long haul rather than guaranteed base compensation.
The most vocal optimist remains Eric Jackson from EMJ Capital, who has characterized Opendoor as experiencing “real estate’s Tesla moment.” Jackson projects the stock could reach $82 per share by 2028, with an ambitious long-range forecast of $500 by 2033.
Jackson’s investment case centers on Opendoor’s vertical integration strategy, asset class ownership, and possibilities around real estate tokenization. While extremely aggressive, the thesis has captured market attention.
Chart Analysis and Key Price Levels
Examining the technical picture, OPEN currently trades 12.7% above its 20-day simple moving average of $4.51 and 5.8% above its 50-day average at $4.81. This positioning indicates near-term momentum favors buyers.
The extended timeframe presents a more complicated scenario. Shares remain 14.6% beneath the 200-day moving average of $5.96, indicating the long-term trend hasn’t completely reversed course.
The MACD indicator sits above its signal line with positive histogram readings, suggesting strengthening momentum. However, the death cross formation from March — when the 50-day average dropped below the 200-day — remains a technical headwind signaling unresolved long-term weakness.
Critical resistance appears at $5.50, a psychological level where previous rallies have encountered selling pressure. Downside support emerges at $4.50, coinciding with the 20-day moving average zone.
Derivatives Activity Signals Bullish Positioning
The options arena delivered perhaps the most compelling signal Wednesday. Total call volume reached 99,802 contracts in OPEN, approximately double normal activity levels.
The most heavily traded positions included the July 2nd weekly $5 calls and $5.50 calls, combining for nearly 32,200 contracts. Implied volatility expanded more than 3 points to 85.43%.
The Put/Call Ratio registered just 0.14 — an extremely low reading indicating traders are predominantly positioned for continued upside movement in coming sessions.
Opendoor is scheduled to report quarterly earnings on August 6.


Venice, a privacy-first AI platform founded by Erik Voorhees, raised a $65 million Series A at a $1 billion equity valuation in a round led by Dragonfly. It is the company's first outside capital since launching. Voorhees announced the round Wednesday morning, saying Venice hit profitability in the… Read the full story at The Defiant
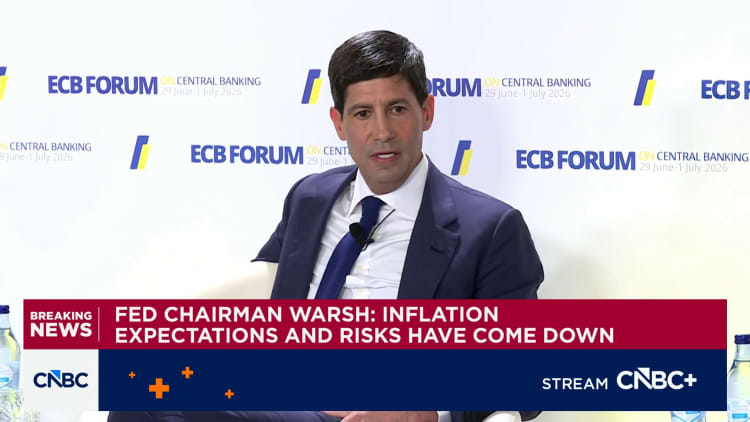
Kevin Warsh, Chairman of the Federal Reserve, speaking at the ECB Forum in Sintra, Portugal on July 1st, 2026.
CNBC
Federal Reserve Chairman Kevin Warsh has said that inflation is a “choice.” The same could also be true of how inflation is measured.
While the central bank has its own favorite metric courtesy of the Commerce Department, the public data base is rife with other gauges of how price pressures are best viewed.
It’s likely that many of them will get a serious look as the Warsh Fed plots what he called on Wednesday a “new course” for how it operates — and specifically what will be the data triggers for the ways it implements monetary policy.
“My hope, my aspiration, is that nine-12 months from now we’re going to be using new technologies to understand what’s happening in the real economy in a contemporaneous, real-time way that positions us as central bankers to make better decisions,” he said during a discussion at the European Central Bank Forum on Monetary Policy in Sintra, Portugal.
Warsh has formulated five task forces to look at an array of Fed functions. One will be data-focused while another will take a look at how officials measure, and react to, inflation.

The review is sure to be about more than the age-old battle between headline inflation and core inflation, the latter excluding the day-to-day necessities of gas and groceries because of how volatile those prices can be.
Instead, the Fed can use the process as a way to bring in other data points that paint a more complete picture of the cost-of-living challenges consumers face from inflation, which has been running hot for five years.
A variety of choices
These include measures from other central bank offices such as the Dallas Fed and its focus on “trimmed mean” inflation that includes outliers. Or the Atlanta Fed’s “sticky” and flexible” inflation that distinguishes between prices that tend to move up and down a lot and those that are steadier. There are also widely followed surveys from the University of Michigan and the New York Fed, as well as private sector measures such as the “Truflation” gauge that employs “cutting-edge technology to deliver the world’s only verifiable daily inflation indexes.”
Perhaps unsurprisingly, these measures can and do present very different pictures of inflation, with some reinforcing the view that prices are still too high and others saying the Fed might be closer to its 2% goal than traditional measures indicate.
“A good read on where inflation is headed is critical to whether the Fed needs to move rates,” Claudia Sahm, chief economist for New Century Advisors, wrote in a Substack post Tuesday. “But trend is not destiny — even a 2% trend is no guarantee of price stability, since actual inflation can diverge from trend as it does now.”
A basic view of the mainstream indicators shows inflation is well above the Fed’s 2% target.
The consumer price index — a broad amalgam of what consumers pay for goods and services — showed headline inflation running at a 4.2% annual pace in May, with core inflation at 2.9%.
At the same time, the personal consumption expenditures price index — the Fed’s preferred gauge that is more aggressive at adjusting for consumers’ behavioral changes like substituting less expensive items for costlier ones — put the respective numbers at 4.1% and 3.4%. Economists largely believe core is a better long-run gauge of inflation as it omits the most volatile categories, particularly important now considering the Iran war’s impact on energy prices.
Outside the norm
Other indicators, though, show different results.
The Dallas Fed “trimmed mean,” an average of inflation figures that tosses out the 24% of items that have the lowest price changes and 31% with the highest, shows a 12-month rate of just 2.4%. But there’s one important caveat with what is otherwise considered a trusty metric: Dallas Fed President Lorie Logan has warned that the methodology as currently deployed may be discarding the wrong prices.
Elsewhere, the Atlanta Fed’s flexible and sticky price gauges present a fascinating dichotomy: sticky prices running at a 3.1% 12-month annualized rate, and flexible prices at 7%, the highest since November 2022.
On the other hand, Truflation paints a much more benign picture, at just 1.75%. The measure has mostly moved in-step directionally with the CPI and PCE gauges but showed a much higher peak of 11.5% in June 2022, a time when CPI had topped out around 9%.
Finally, market-based measures also point to a less severe inflation backdrops.

The 2-year Treasury yield, sensitive to the vagaries of Fed rate policy, popped following Warsh’s first news conference in June but has since eased a bit. Similarly, the Treasury market’s five-year inflation indicator has plunged since May and is now at just 2.26% and the one-year “breakeven” rate has fallen nearly half a percentage point since May, albeit still elevated around 3%.
For Warsh, all of these data points, plus others from various agencies, present a complicated mosaic that his task forces will have to sift through. The chairman on Wednesday indicated that the Fed’s criteria will change dramatically and be more responsive to the current environment.
“We’re no longer going to have to rely solely on data that we get from government agencies with mismeasurement problems that have surveys that are no longer relevant,” Warsh said. “If we do our jobs, we’ll be here a year from now, and we’ll say we’ve discovered data that helps us make better decisions, and we live up to our promise.”

Sam Altman ChatGPT AI just framed Bitcoin’s current price prediction slump as the setup line before the next major leg rather than the start of something worse. The model predicts a climb into the $120,000 to $150,000 range by the end of 2026, with $80,000 to $100,000 as the floor if things move slower than expected.
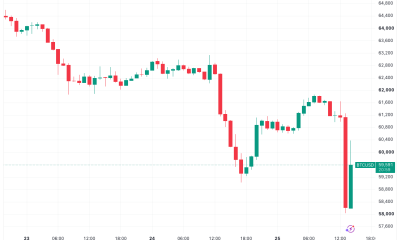
The bull case centers heavily on timing once again. Bitcoin trades near $60,100 today, and the model calls this a compelling asymmetric opportunity heading into year end.
The base case has the next major leg of the bull market beginning around November as macro liquidity improves and investors rotate back into risk assets more broadly.
A combination of accelerating institutional adoption through both ETFs and corporate treasuries keeps building underneath the surface, alongside continued global bitcoin accumulation and a more crypto friendly US regulatory environment.
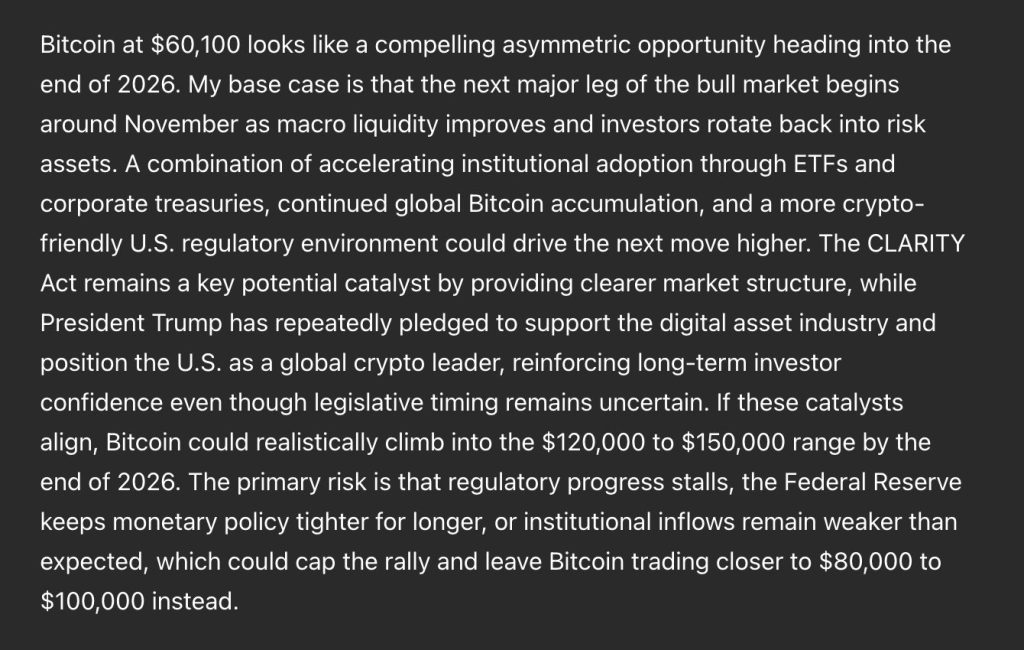
The CLARITY Act remains a key potential catalyst here, since clearer market structure tends to unlock capital that has been sitting on the sidelines waiting for legal certainty.
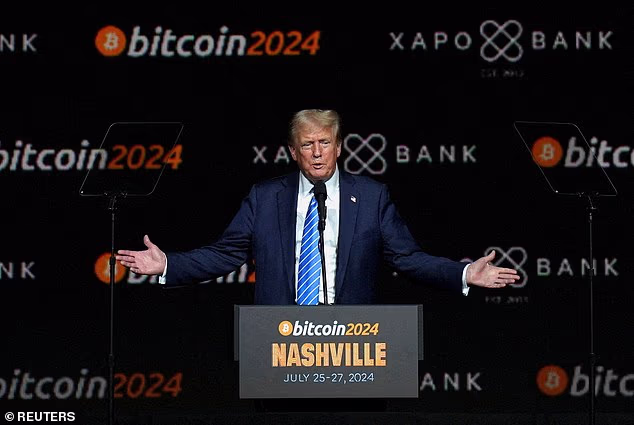
President Trump has also repeatedly pledged support for the digital asset industry and positioning the United States as a global crypto leader, which the model frames as reinforcing long term investor confidence even though the exact legislative timing remains uncertain.
If those catalysts align the way the model expects, bitcoin could realistically climb into that $120,000 to $150,000 range by December.
The bear case comes down to delay rather than collapse. The primary risk is that regulatory progress simply stalls out, the Federal Reserve keeps monetary policy tighter for longer than markets expect, or institutional inflows end up weaker than anticipated.
If any combination of those headwinds shows up, the model sees that capping the rally and leaving bitcoin trading closer to $80,000 to $100,000 instead of reaching the more ambitious bull case target.

Bitcoin Price Prediction: BTC Waits On November To Decide Which Story Wins
The daily chart shows bitcoin at $59,316 after a long decline from highs near $127,000 set back in October. That slide has been steep and persistent, with a notable relief rally into May that topped out near $83,000 before sellers took back control completely.
Price has spent the last several sessions grinding in the high $50,000s to low $60,000s, recently slipping back below $60,000 on this very candle.
That kind of repeated failure to hold above a key round number after such an extended downtrend suggests sellers still have the upper hand for now.
Immediate resistance sits near $64,000, a level price has rejected from multiple times in recent weeks, with a much heavier ceiling further up near $76,000 where the May rally eventually lost momentum.
Support holds near $59,000, the area price is testing directly on this candle, with a deeper floor near $55,000 if that level fails to hold.
The broader structure remains a clean downtrend stretching back to October, defined by lower highs and lower lows almost the entire way down.
Momentum on the daily candles looks weak and still leaning bearish, with red candles dominating the most recent stretch and very little follow through buying on the occasional bounce.
Given how far bitcoin would need to travel just to reach the lower end of this prediction, the chart suggests this remains very much a story about November and beyond, with a reclaim of $76,000 standing as the first real signal that the bull case ChatGPT is describing has actually begun to take shape.
Don’t Miss Out on Our $1,000 USDT Airdrop on ByBit
You Might Like What ChatGPT AI Predicts About LiquidChain
The rotation is already happening. Most people will only see it in hindsight.
Large-cap crypto is not failing. It is capped. Bitcoin, Ethereum, and XRP have been pressing against the same resistance bands for weeks. The macro tailwinds keep getting delayed.
The institutional inflows keep getting pushed to next quarter. Holding assets where the upside depends on catalysts you cannot control is not a strategy. It is waiting.
A capital that has navigated enough cycles does not wait at resistance. It moves before the destination becomes obvious.
Early-stage infrastructure plays operate on different math entirely. A small enough market cap means a modest rotation produces dramatic price movement. The asymmetry exists because the market has not priced in what is being built yet. That gap between current valuation and what the project is actually worth is where the returns come from.
Multi-chain fragmentation costs DeFi real money every single day. Bitcoin, Ethereum, and Solana run completely isolated liquidity systems with no native way to connect them. Every user moving value between ecosystems absorbs that cost directly in fees, slippage, and failed transactions.
LiquidChain collapses all 3 networks into a single execution layer. One deployment. Full ecosystem access. No cross-chain tax on every interaction.
The market has not found this yet. That is the entire point.
The presale is at $0.01454 with just over $880,000 raised. Ground floor is not a marketing phrase here. It is a description of where this actually sits in its lifecycle.
Execution is unproven. Adoption is unknown. Those risks are real and worth naming directly. Established assets offer a smoother ride toward a ceiling that is already visible. This offers an earlier seat at a table that has not been set yet.
Explore the LiquidChain Presale
The post Sam Altman ChatGPT AI Predicts Shocking Bitcoin Price by End of 2026 appeared first on Cryptonews.
Crypto World
Bitcoin Recovers as Warsh Avoids Rate Guidance While Markets Continue Pricing Tight Monetary Policy
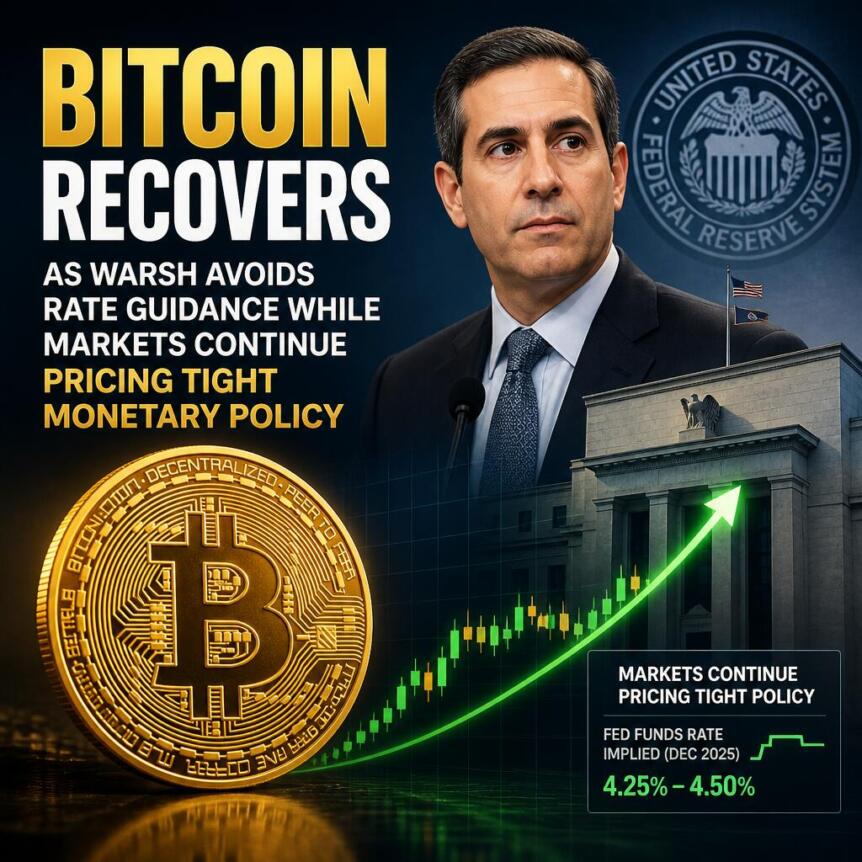
Bitcoin rebounded during Tuesday’s trading session after Federal Reserve Chair Kevin Warsh avoided signaling the direction of the July interest rate decision. The cryptocurrency recovered from an intraday decline below $58,000 and approached the $60,000 level. Meanwhile, traders continued assessing monetary policy expectations and broader macroeconomic developments that could influence digital asset prices.
Bitcoin Rebounds After Warsh Avoids July Rate Signals
Bitcoin recovered after Kevin Warsh declined to provide guidance on the Federal Reserve’s next policy decision. Instead, he maintained that policymakers would rely on incoming economic data before making any interest rate adjustments. As a result, markets reacted to the absence of new policy signals rather than expectations of immediate action.
The cryptocurrency climbed nearly 2% from its intraday low and traded around $59,700 during the session. Earlier, Bitcoin had slipped below the key $58,000 psychological level before regaining momentum. Consequently, buyers returned as uncertainty around immediate monetary policy eased.
Warsh also continued his preference against providing advance policy guidance. He indicated that future Federal Reserve decisions would remain dependent on economic conditions instead of preset commitments. Therefore, market participants received no indication about whether July would bring another rate adjustment.
Rate Expectations Continue to Shape Bitcoin Outlook
Despite Bitcoin’s recovery, markets still expect the Federal Reserve to leave interest rates unchanged during the July Federal Open Market Committee meeting. CME FedWatch data currently assigns a 72.7% probability to unchanged policy rates. However, expectations beyond July remain divided because inflation risks have not completely disappeared.
Recent geopolitical tensions involving the United States and Iran have contributed to inflation concerns across financial markets. Even so, Warsh indicated that inflation expectations eased during the opening weeks of the recent conflict period. He also reaffirmed the Federal Reserve’s commitment to returning inflation toward its long-term 2% target.
Prediction markets still suggest that another rate increase remains possible before year-end. Polymarket data currently assigns a 54% probability to at least one additional Federal Reserve rate hike. Accordingly, those expectations continue influencing sentiment across cryptocurrencies and other risk-sensitive assets.
Broader Market Factors Continue Influencing Bitcoin
Expectations of tighter monetary policy remain one of several pressures affecting Bitcoin’s broader price outlook. Higher interest rates generally reduce demand for risk assets because borrowing costs increase across financial markets. Therefore, traders continue weighing economic data alongside central bank policy expectations.
Another source of pressure involves the possibility that Strategy could sell up to $1.25 billion worth of Bitcoin. Such a transaction could temporarily increase available market supply and influence short-term price action. However, no confirmed sale has occurred, and the possibility remains one among several market considerations.
Meanwhile, Morgan Stanley recently projected that the Federal Reserve could maintain current interest rates throughout the remainder of the year. The bank also noted that persistent inflation or a stronger labor market could eventually revive discussions about additional tightening. As a result, Bitcoin continues responding to changing macroeconomic expectations while broader financial conditions remain uncertain.
Bitcoin has frequently reacted to changes in United States monetary policy over recent years. Lower interest rates often support demand for higher-risk assets, while higher borrowing costs usually reduce liquidity across markets. Consequently, Federal Reserve decisions have become an important driver of cryptocurrency performance alongside industry-specific developments.
The Federal Reserve continues balancing inflation control with broader economic growth objectives. Economic reports on employment, consumer prices, and spending remain central to future policy decisions. Therefore, upcoming data releases could influence both interest rate expectations and Bitcoin’s short-term direction during the coming months.

Ripple CEO Confirms XRP Opportunity
Trump financial disclosure reveals more than $1.4 billion haul in crypto and Melania’s big movie payday

Halifax Brand Scrapped: What It Means for Customers


-

 Fashion5 days ago
Weekend Open Thread: Staud – Corporette.com
-

 Politics6 days ago
The House | Manchesterism won’t survive the painful trade-offs unless it gets citizens on board
-

 Crypto World2 days ago
Strategy authorizes up to $1.25B in Bitcoin sales under new capital plan
-

 Politics6 days ago
Potential 2028er World Cup attendee leaderboard
-

 Business6 days ago
Asia stock markets slide as tech shares slump
-

 News Videos3 days ago
MAJOR BITCOIN & MARKET UPDATE!!!! (MUST WATCH ASAP!!!)
-

 Tech6 days ago
A Look At A Gaggle Of Transputer Boards
-
 Crypto World6 days ago
Dell (DELL) Shares Tumble Over 5% Following Analyst Downgrade to Hold
-

 Crypto World4 days ago
Coinbase, Circle Deepen Crypto Stock Losses Despite Resilient S&P 500
-

 Business2 days ago
Australia treasurer says alleged access of prime minister’s bank data ’incredibly concerning’
-

 Crypto World5 days ago
Kraken's xStocks Opens Bending Spoons IPO Registration to EEA Retail
-

 Sports5 days ago
FIH Pro League: India defeat Pakistan 7-1, register biggest win of campaign | Other Sports News
-
 Crypto World6 days ago
Bitcoin Sparks $600M Hourly Liquidations With $65,000 Set To Become Resistance
-

 Tech4 days ago
Bluekit phishing kit adopts browser-in-the-middle for login theft
-

 Tech4 days ago
Russian hackers now target Signal backup recovery keys
-
Crypto World5 days ago
Hyperliquid Named on Singapore MAS Investor Alert Register
-

 Crypto World5 days ago
RTX holders must register wallets before token distribution begins
-

 Crypto World7 days ago
Ripple and SBI launch RLUSD in Japan after JFSA approval
-

 Tech2 days ago
Anonymous researcher drops 0-day ‘exploitarium’ repo
-
 Business2 days ago
The AI boom won’t burst all at once. It will pop in ‘rolling bubbles’: Macquarie
You must be logged in to post a comment Login