

Crypto World
Ethereum Price Prediction: Is $1.5K or $2K Next for ETH?

Ethereum is attempting to recover after defending the $1.5K region once more, but the broader trend remains under pressure. The price is now approaching a major confluence resistance area that could determine whether this rebound develops into a larger trend reversal or remains another relief rally within the prevailing downtrend.
Ethereum Price Analysis: The Daily Chart
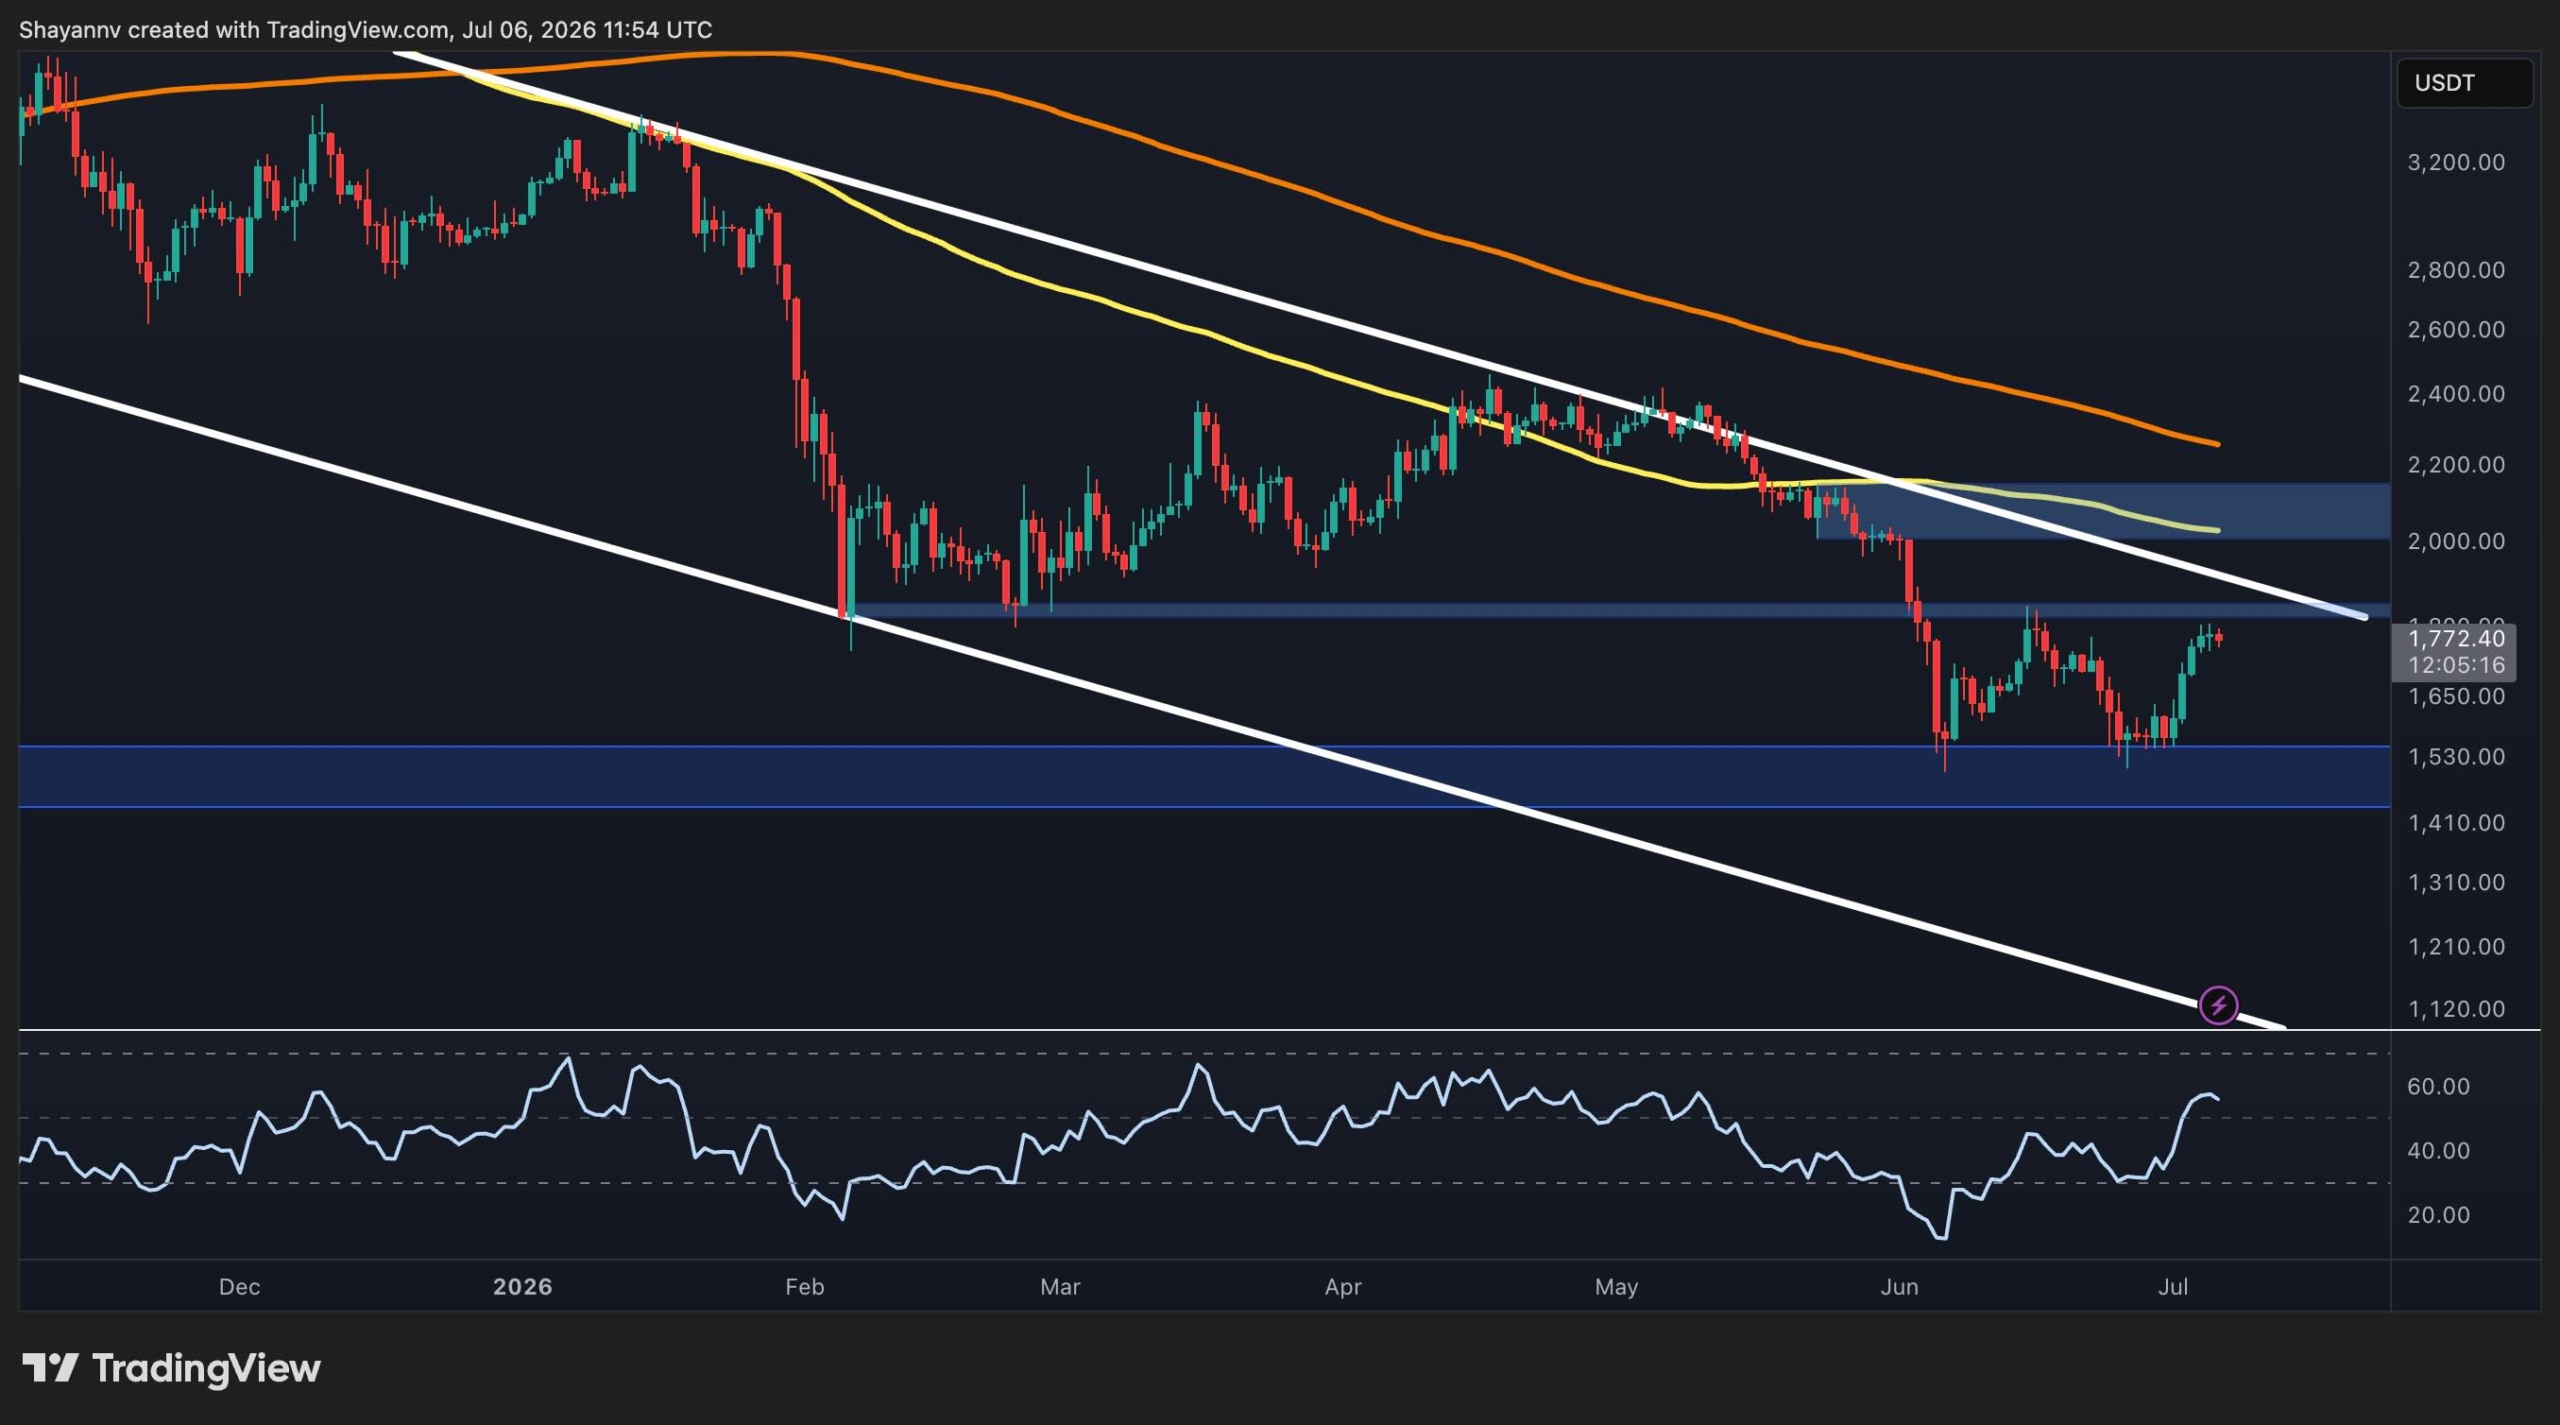
The daily chart continues to reflect a bearish market structure. ETH remains below the descending long-term trendline, as well as the 100-day and 200-day moving averages, all of which continue to slope lower. This alignment suggests sellers still maintain control from a broader perspective.
Following the sharp decline into the $1.5K support zone, buyers managed to trigger a recovery toward the $1.8K resistance area. This level coincides with the previous horizontal support that has now turned into resistance and sits just beneath the descending channel trendline, creating a significant supply zone.
A successful daily close above the trendline and the $1.8K region would be the first meaningful technical improvement and could expose the next resistance around $2K to $2.2K, where another major supply zone and moving average cluster await.
Failure to reclaim the current resistance would likely reinforce the broader bearish structure and increase the probability of another move toward the $1.5K support. Losing that area would pave the way toward the channel’s lower boundary below $1.2K.
ETH/USDT 4-Hour Chart
On the 4-hour timeframe, Ethereum has produced a stronger short-term recovery after defending the $1.5K demand zone for a second time. The rebound has carried the price back toward the upper boundary of the pattern that has entrapped the price since early June.
ETH is now testing the $1.75K to $1.8K resistance while simultaneously confronting the descending trendline. This makes the current area particularly important for short-term direction.
A confirmed breakout above both the trendline and horizontal resistance would invalidate the sequence of lower highs and could accelerate buying toward the $larger $2K to $2.2K supply zone also visible on the daily timeframe. On the other hand, rejection from this region would preserve the existing bearish structure. In that case, the first support remains around $1.7K, followed by the $1.6K area, while the key demand zone continues to sit near $1.5K.
Momentum has also improved considerably during the latest advance, with the RSI climbing toward overbought territory. While this reflects strengthening buying pressure, it also suggests that bulls may need a period of consolidation before attempting a decisive breakout.

On-Chain Analysis
The exchange reserve chart presents one of the more constructive long-term signals for Ethereum. Exchange balances have fallen significantly from above 21M ETH to roughly 15.5M ETH, marking a persistent multi-year decline in the amount of ETH held on centralized exchanges.
This trend generally indicates continued coin withdrawals into self-custody or long-term storage, reducing the immediately available supply for sale. Such behavior often reflects improving investor conviction and tends to provide a favorable backdrop during periods of sustained demand.
Despite Ethereum’s prolonged price correction from the 2025 highs, exchange reserves have continued to decline rather than rise, suggesting that long-term holders have not been aggressively distributing their holdings into weakness.
While on-chain data alone does not guarantee an immediate rally, the persistent reduction in exchange reserves supports the view that selling pressure from spot holders remains relatively limited. If ETH can reclaim the major technical resistance around $2K and attract renewed demand, this tightening exchange supply could become an important tailwind for a stronger medium-term recovery.

The post Ethereum Price Prediction: Is $1.5K or $2K Next for ETH? appeared first on CryptoPotato.

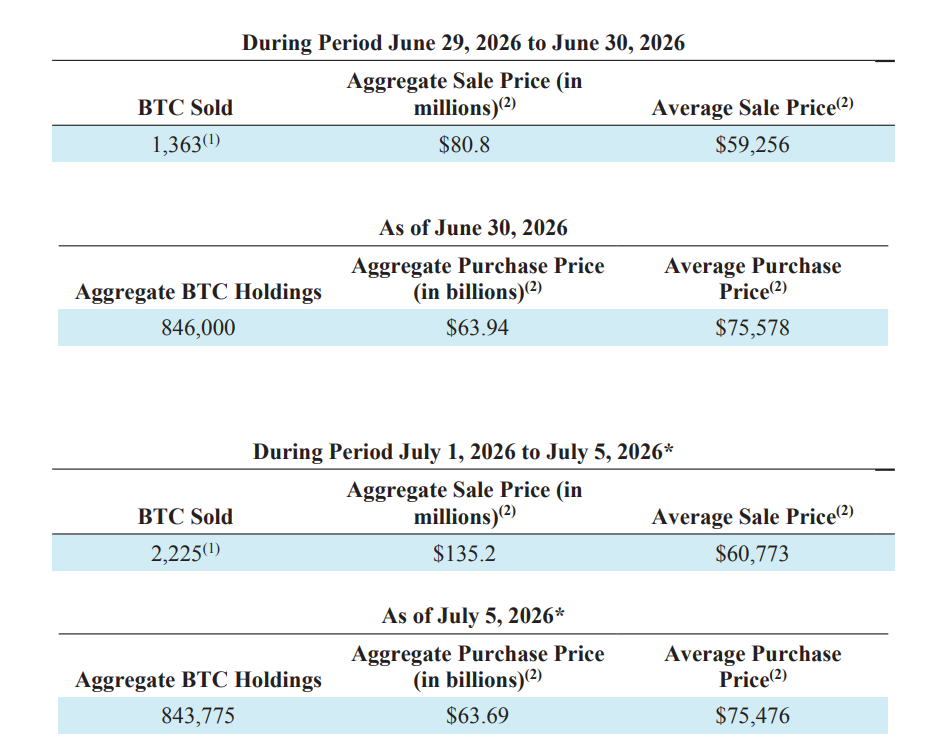
Michael Saylor’s Strategy sold 3,588 Bitcoin (BTC) to fund preferred stock dividend payments and replenish its cash reserves.
Strategy sold the Bitcoin for $216 million, reducing its total holdings to 843,775 Bitcoin, according to a Monday 8-K filing with the US Securities and Exchange Commission.
This included 1,363 Bitcoin sold at an average price of $59,256 between last Monday and Tuesday, and 2,225 Bitcoin sold at an average price of $60,773 between Wednesday and Sunday.
Strategy disclosed the sale of 32 Bitcoin in early June, as its first reported Bitcoin sale since the 2022 tax-loss transaction.
On its June 29 8-K filing, Strategy unveiled a capital framework allowing Bitcoin sales to fund dividends, increased the annual dividend rate on its STRC preferred stock to 12%, and disclosed that its US dollar reserve had grown to $2.55 billion. Monday’s filing showed the dollar reserve remained unchanged.
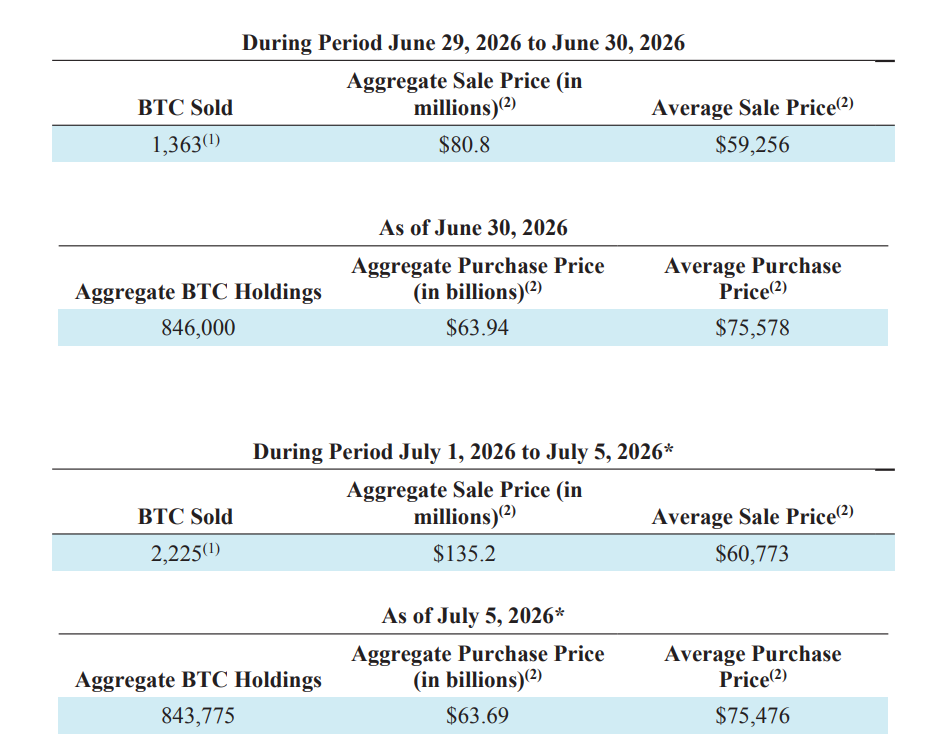
Form 8-K filing with the US Securities and Exchange Commission. Source: Strategy
Strategy’s perpetual preferred stock, STRC, traded at $88.70, or 11.3% below its $100 intended par value, during Monday’s pre-market trading session, Yahoo Finance data shows.
STRC is one of Strategy’s main mechanisms to fund its Bitcoin accumulation. Trading below par limits Strategy’s ability to raise funds through STRC sales. It may also force the company to further increase its nominal dividend rate to attract buyers and protect STRC’s price.
Bernstein says Strategy unlikely to face forced Bitcoin sales
Before Strategy disclosed its latest Bitcoin sale, Bernstein said the company was unlikely to be forced to sell its holdings, citing its liquidity position and cash reserve coverage.
Bernstein’s report said Strategy had 17 months of cash to cover dividend obligations and interest payments. It added that the company remained a net buyer of Bitcoin and served as a strong “balancing force” in a market where leading US Bitcoin miners are net sellers due to their pivot to AI.
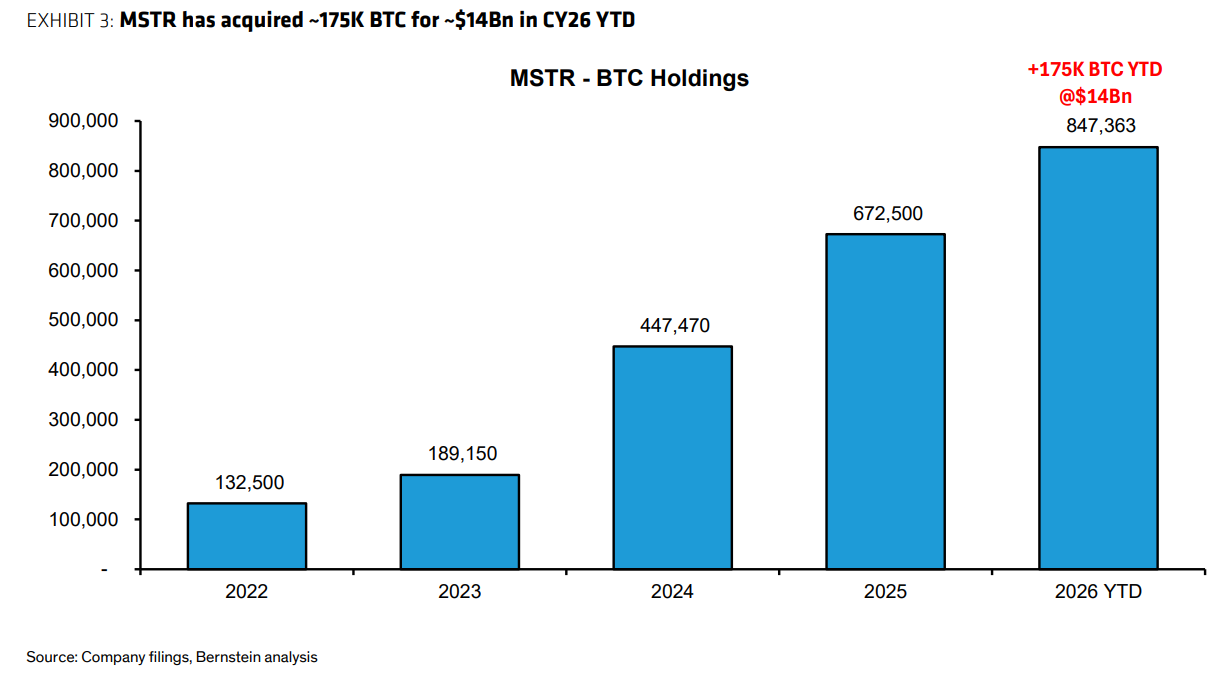
Strategy yearly net accumulation. Source: Bernstein
Bernstein said Strategy’s accumulation had been an important “balancing force” amid selling by US Bitcoin miners and the $5.5 billion of outflows from Bitcoin exchange-traded funds (ETFs) so far in 2026.
Related: Dormant $1.9M Bitcoin tied to New York lawsuit moves after nearly 15 years
Strategy’s debt liabilities were a “mere” 13% of its Bitcoin collateral value. The company’s next principal payment of about $1 billion is due in the third quarter of 2028, according to Bernstein.
Bernstein maintained its $150,000 year-end Bitcoin price target, saying it remained “optimistic on Bitcoin long-term.”
Magazine: Bitcoin slides to $58K, XRP hits $1 but onchain data promising: Market Moves
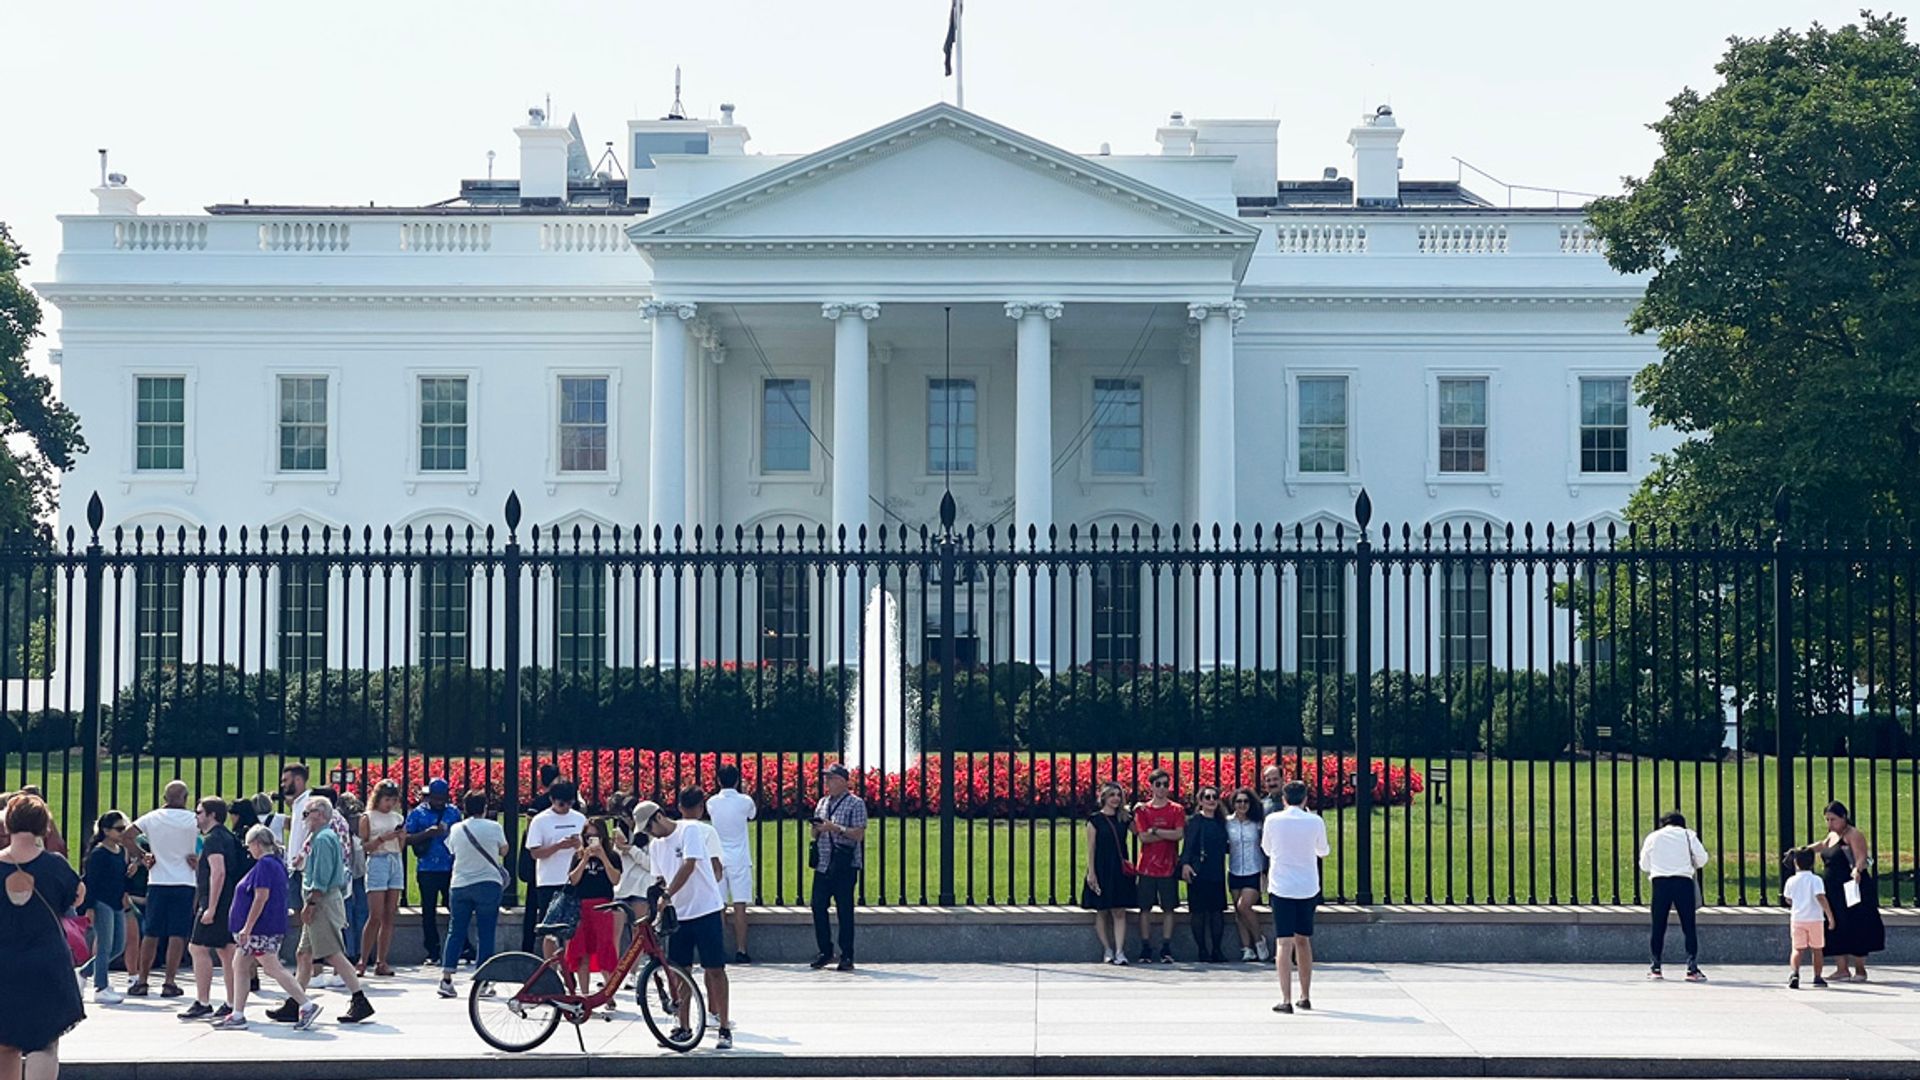
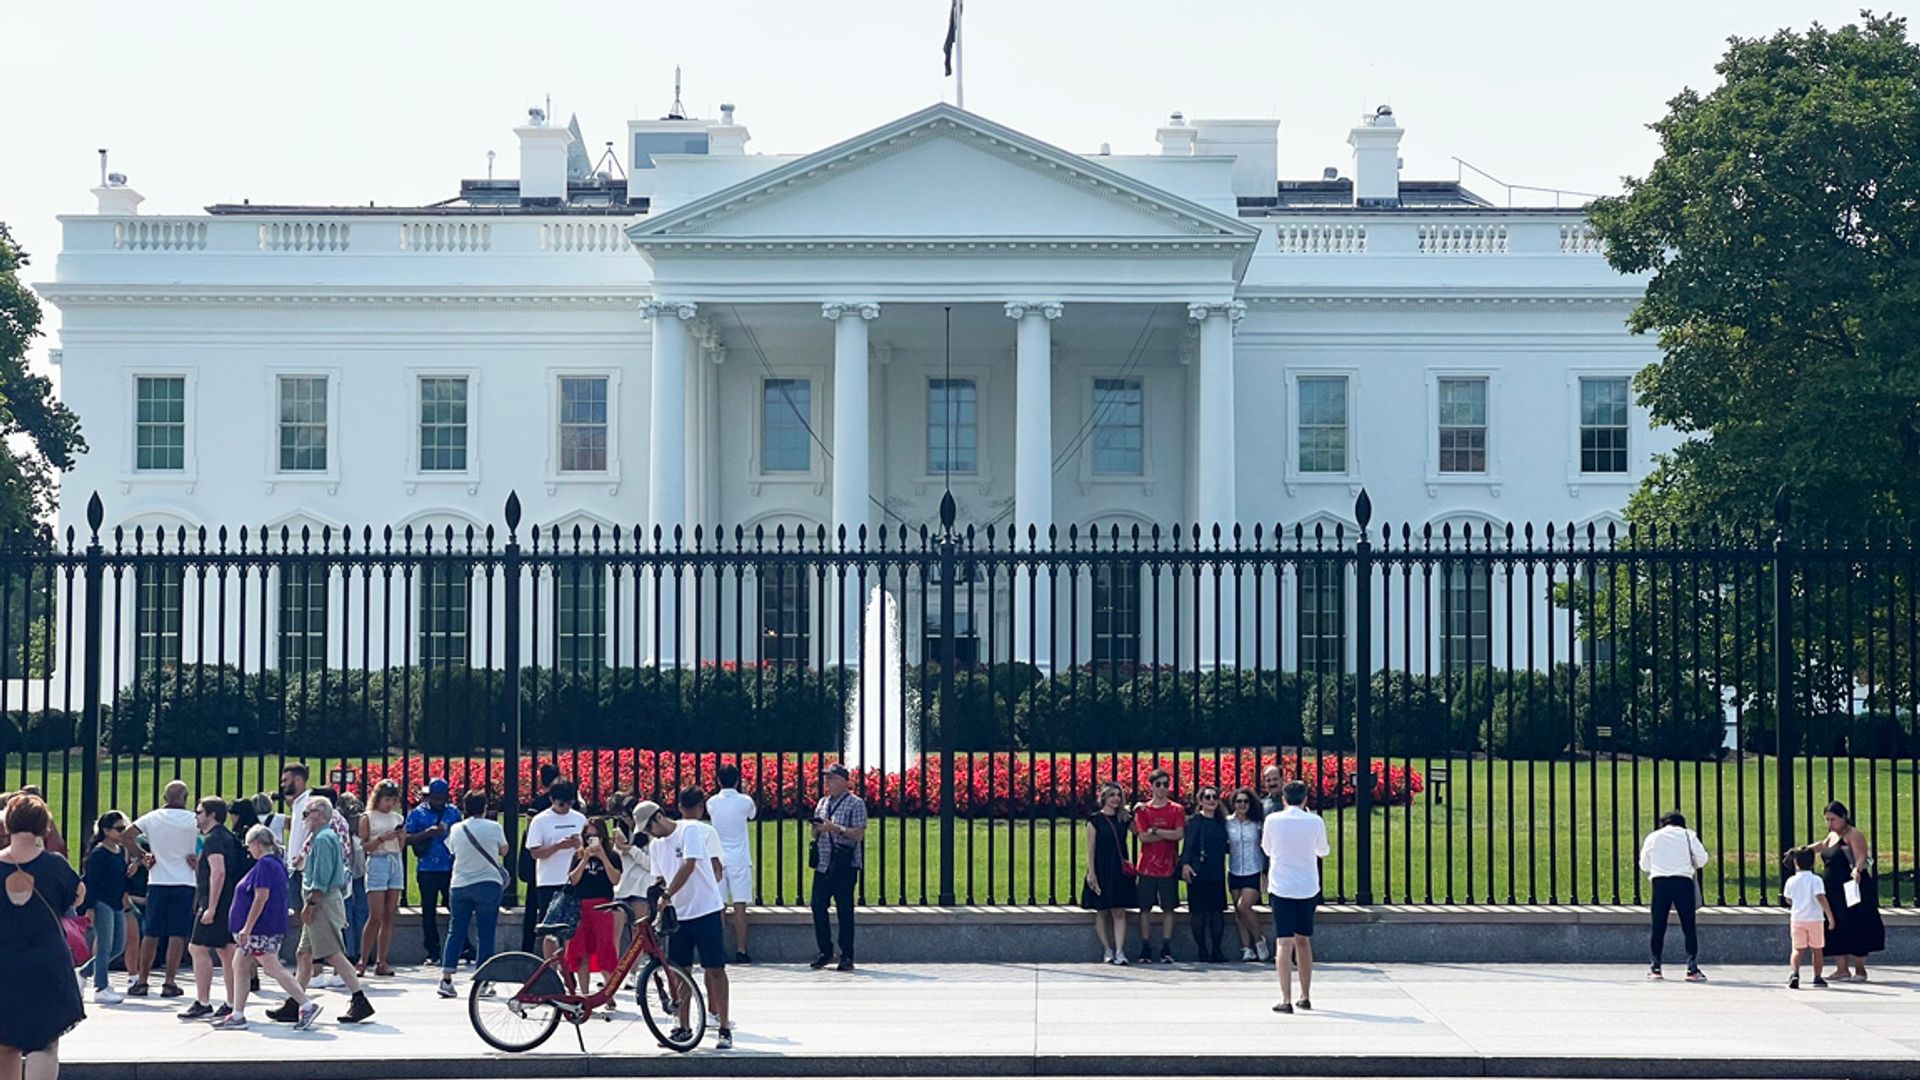
The White House’s chief crypto adviser, Patrick Witt, and his predecessor in that role had both said that they’ll need Congress to fully back up the formation and activation of the crypto funds. Presidential orders don’t carry the weight of law, and no legislation has yet advanced, though such efforts have simmered among lawmakers in both the Senate and House of Representatives, And if Republicans lose the majority in the House or both chambers in this year’s midterm elections, it’s unlikely such a bill will formalize Trump’s concept anytime soon.
Read More: Those who cheered U.S. Bitcoin reserve have spent year watching Trump’s order languish
Even if the administration works out the structure for the funds, it’s unclear whether they’ll be able to pull the lever to officially put its bitcoin holding — estimated at more than 300,000, or about $21 billion — into that virtual vault.
The government’s bitcoin holdings would be a long-term investment. Trump and his administration has called it a strategic reserve, though it doesn’t fit the usual definition of that phrase, because it’s meant to be held for a long period and not doled out during market emergencies.
When Trump issued the order, he asked his administration to come up with ways to acquire more bitcoin without using taxpayer money. Several ideas have since been floated, though if they’d started buying the asset when Trump called for it, they’d have bought at $93,000, and BTC has dropped by about a third since then to today’s price just above $64,000.
Former Tether chief investment officer Richard Heathcote is seeking to sell part of his 1.26% stake in the stablecoin issuer, according to a Bloomberg report citing people familiar with the matter.
Heathcote stepped down as Tether’s chief investment officer in March to take an advisory role after overseeing the stablecoin issuer’s investment portfolio. Bloomberg reported the planned sale involves only part of his 1.26% ownership stake.
Tether issues USDt (USDT), the world’s largest stablecoin by market capitalization. With a circulating supply of roughly $184 billion, USDT accounts for roughly 59% of the stablecoin market, according to DefiLlama data.
The planned sale could offer a rare look at ownership in Tether, which remains privately held despite becoming one of the crypto industry’s most profitable companies.
The sale also comes as Tether navigates regulatory pressure in Europe. USDT has been delisted by a growing number of MiCA-authorized platforms after Tether opted not to comply with the European Union’s crypto framework, with Revolut announcing this month that it will remove the stablecoin from its platform.
Related: Strategy sells 3,588 Bitcoin for $216M to fund dividends, keeps $2.55B reserve intact
Crypto companies weigh IPOs
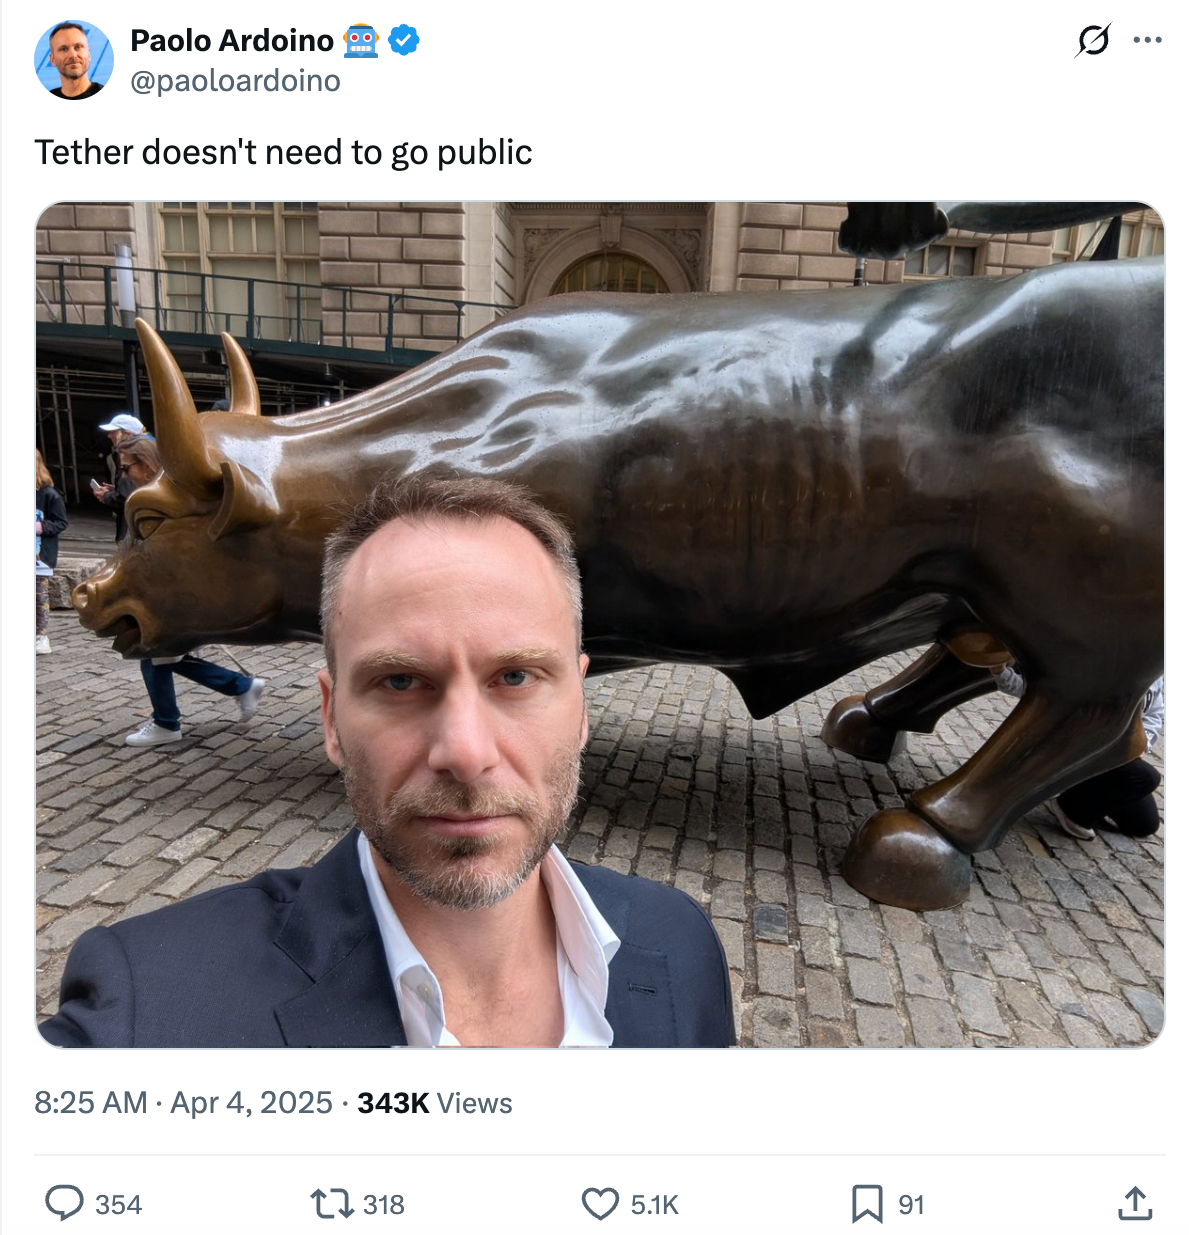
While Tether CEO Paolo Ardoino has said outright that the stablecoin issuer does not need to go public, several other crypto companies are reportedly mulling initial public offerings (IPOs).
Kraken has taken several steps toward a public listing. Fortune reported in September 2025 that the crypto exchange had raised $500 million at a $15 billion valuation, fueling expectations that the exchange was preparing for an IPO.

Source: Paolo Ardoino
The company also announced it had confidentially filed a draft registration statement with the US Securities and Exchange Commission for a proposed initial public offering in November 2025. However, Bloomberg later reported that the IPO plans could be pushed back until 2027 following layoffs tied to the company’s expanding use of artificial intelligence.
South Korean crypto exchange Bithumb also announced in April that it is delaying its IPO until after 2028 as it works to strengthen its accounting policies and internal controls following earlier regulatory setbacks.
Magazine: The end of anonymity? AI could unmask crypto’s hidden identities

Quick Summary
- Arm Holdings shares advanced approximately 5% during Monday’s session, reaching $330.97 as market participants shifted focus back to artificial intelligence and semiconductor stocks
- Despite surging 121% year-over-year, the stock currently trades roughly 9.7% beneath its 20-day moving average following a recent correction
- The company reports quarterly results on July 29, with analysts projecting earnings per share of 36 cents and revenue of $1.27 billion
- Wall Street maintains a “Moderate Buy” consensus rating with 19 buy recommendations, 7 hold ratings, and 1 sell; the average target price stands at $279.83
- Top-tier analysts from TD Cowen and UBS have set ambitious price objectives between $470 and $475, significantly exceeding consensus estimates
Arm Holdings (ARM) experienced a robust 5% advance on Monday, closing at $330.97, as market enthusiasm returned to artificial intelligence and semiconductor equities. The Nasdaq Composite climbed 1.41% during the session, providing tailwinds for chip-related names.
Arm Holdings plc American Depositary Shares, ARM
The stock has delivered impressive returns — posting a 121% gain over the trailing twelve months — though it has experienced notable consolidation since mid-June. Currently, shares trade approximately 9.7% under their 20-day simple moving average of $360.16.
The 50-day moving average rests at $301.29, establishing a critical support zone near $298.50. This level has previously attracted buying interest during recent declines, making it a crucial threshold for technical analysts to monitor.
A golden cross pattern that emerged in April continues to hold, which market technicians typically interpret as a constructive indicator for intermediate to long-term momentum.
The Relative Strength Index registers at 46.83 — firmly in neutral range. While the stock isn’t approaching overbought conditions, it also hasn’t established clear directional momentum following June’s retracement.
July 29 Earnings Report on the Horizon
Arm’s next quarterly earnings announcement is scheduled for July 29. Wall Street consensus calls for earnings per share of 36 cents, representing an increase from 35 cents in the comparable year-ago period. Revenue projections stand at $1.27 billion, up from $1.05 billion reported during the same quarter last year.
While these figures demonstrate consistent expansion, the stock’s price-to-earnings multiple of 370.9 suggests elevated expectations are already priced in. Any disappointment in results or forward guidance could trigger significant downside pressure.
ARM’s most recent quarterly performance delivered $0.60 in earnings per share on $1.49 billion in revenue, achieving a net profit margin of 18.37%.
Analyst Sentiment and Price Targets
The Street maintains a “Moderate Buy” consensus based on 27 analyst ratings — breaking down to 19 buy recommendations, 7 hold ratings, and 1 sell. The mean 12-month price objective stands at $279.83, notably below current trading levels.
More optimistic Wall Street firms paint a bullish picture. TD Cowen reaffirmed its Buy stance on June 24, elevating its price target to $475. UBS echoed this sentiment, raising its objective to $470 on the same date. Bank of America maintained its Neutral rating while increasing its target to $460.
Conversely, New Street Research downgraded Arm from Buy to Neutral on June 18, expressing concerns about stretched valuation metrics. Several analysts have cautioned that share prices have outpaced underlying business fundamentals, and potential selling pressure from SoftBank could present challenges.
Insider activity has tilted toward selling. During the previous three months, company insiders disposed of 248,205 shares valued at approximately $57.7 million.
Recent developments include Oracle Cloud Infrastructure joining ARM’s AGI CPU ecosystem, broadening the company’s presence in agentic AI applications and data center computing. Nvidia recently introduced an ARM-based laptop processor, further demonstrating the architecture’s expanding market penetration.
Institutional investors hold 7.53% of outstanding shares, with multiple new positions established during Q1 and Q2 2026.
With a beta coefficient of 3.76, ARM exhibits significant volatility relative to broader market movements. The 52-week trading range spans from $100.02 to $452.70.
Investors will turn their attention to the July 29 earnings release as the next major market-moving event.



Vitalik Buterin has confirmed a winner in his AI challenge to unmask his anonymous writing, after researcher Franklyn Wang traced a hidden EIP-7503 revision back to the Ethereum co-founder.
Buterin launched the experiment on June 22, offering up part of his own anonymity to test whether AI stylometry can identify hidden authors. For 13 days, no one succeeded.
AI Challenge Winner Matched Reasoning, Not Prose
Wang ran the search through Co-Invest, an AI research engine, and flagged a December 2024 revision of EIP-7503, the Zero-Knowledge Wormholes privacy proposal. A throwaway account submitted the rewrite, which now forms roughly 75% of the proposal’s text.
The disguise nearly held. Keyvan Kambakhsh, an original EIP-7503 author, reviewed and approved the anonymous edit at the time. According to Wang’s analysis, his model gave the pick just 20% confidence, yet 10 times its next candidate. The search reportedly took about two hours.
Follow us on X to get the latest news as it happens
Buterin drafted the revision in Chinese, translated it locally with Alibaba’s Qwen2.5 model, and manually fixed the output. However, that camouflage covered only his prose.
“Notice that the stylistic hints that his AI picked up on were intellectual habits and style of math and algorithm explanation, which bypassed my obfuscation strategy (which only covered prose) completely.”
Buterin confirmed the result on Monday. Wang, for his part, argued the same engine could hunt trading signals across news and on-chain data.
What the Result Means for Pseudonymous Developers
Stylometry has unmasked authors before. In 2013, forensic linguists identified J.K. Rowling as crime novelist Robert Galbraith through vocabulary and phrasing. Buterin’s test suggests detection now reaches deeper, into how an author reasons rather than how they write.
That shift matters for an industry built on pseudonyms, from Satoshi Nakamoto down. Ethereum alone recently passed 1 million developers, while European regulators already fuel crypto privacy fears.
Buterin has championed privacy for years, from co-authoring the Privacy Pools paper to his Lean Ethereum roadmap. His self-experiment also sharpens the debate over AI safety rules as models grow more capable.
Whether obfuscation can catch up, or whether this “thoughtprint” detection keeps improving, may become clearer as researchers rerun Wang’s method on other anonymous work.
The post Vitalik Buterin AI Challenge Solved in 2 Hours: Can Developers Stay Anonymous? appeared first on BeInCrypto.
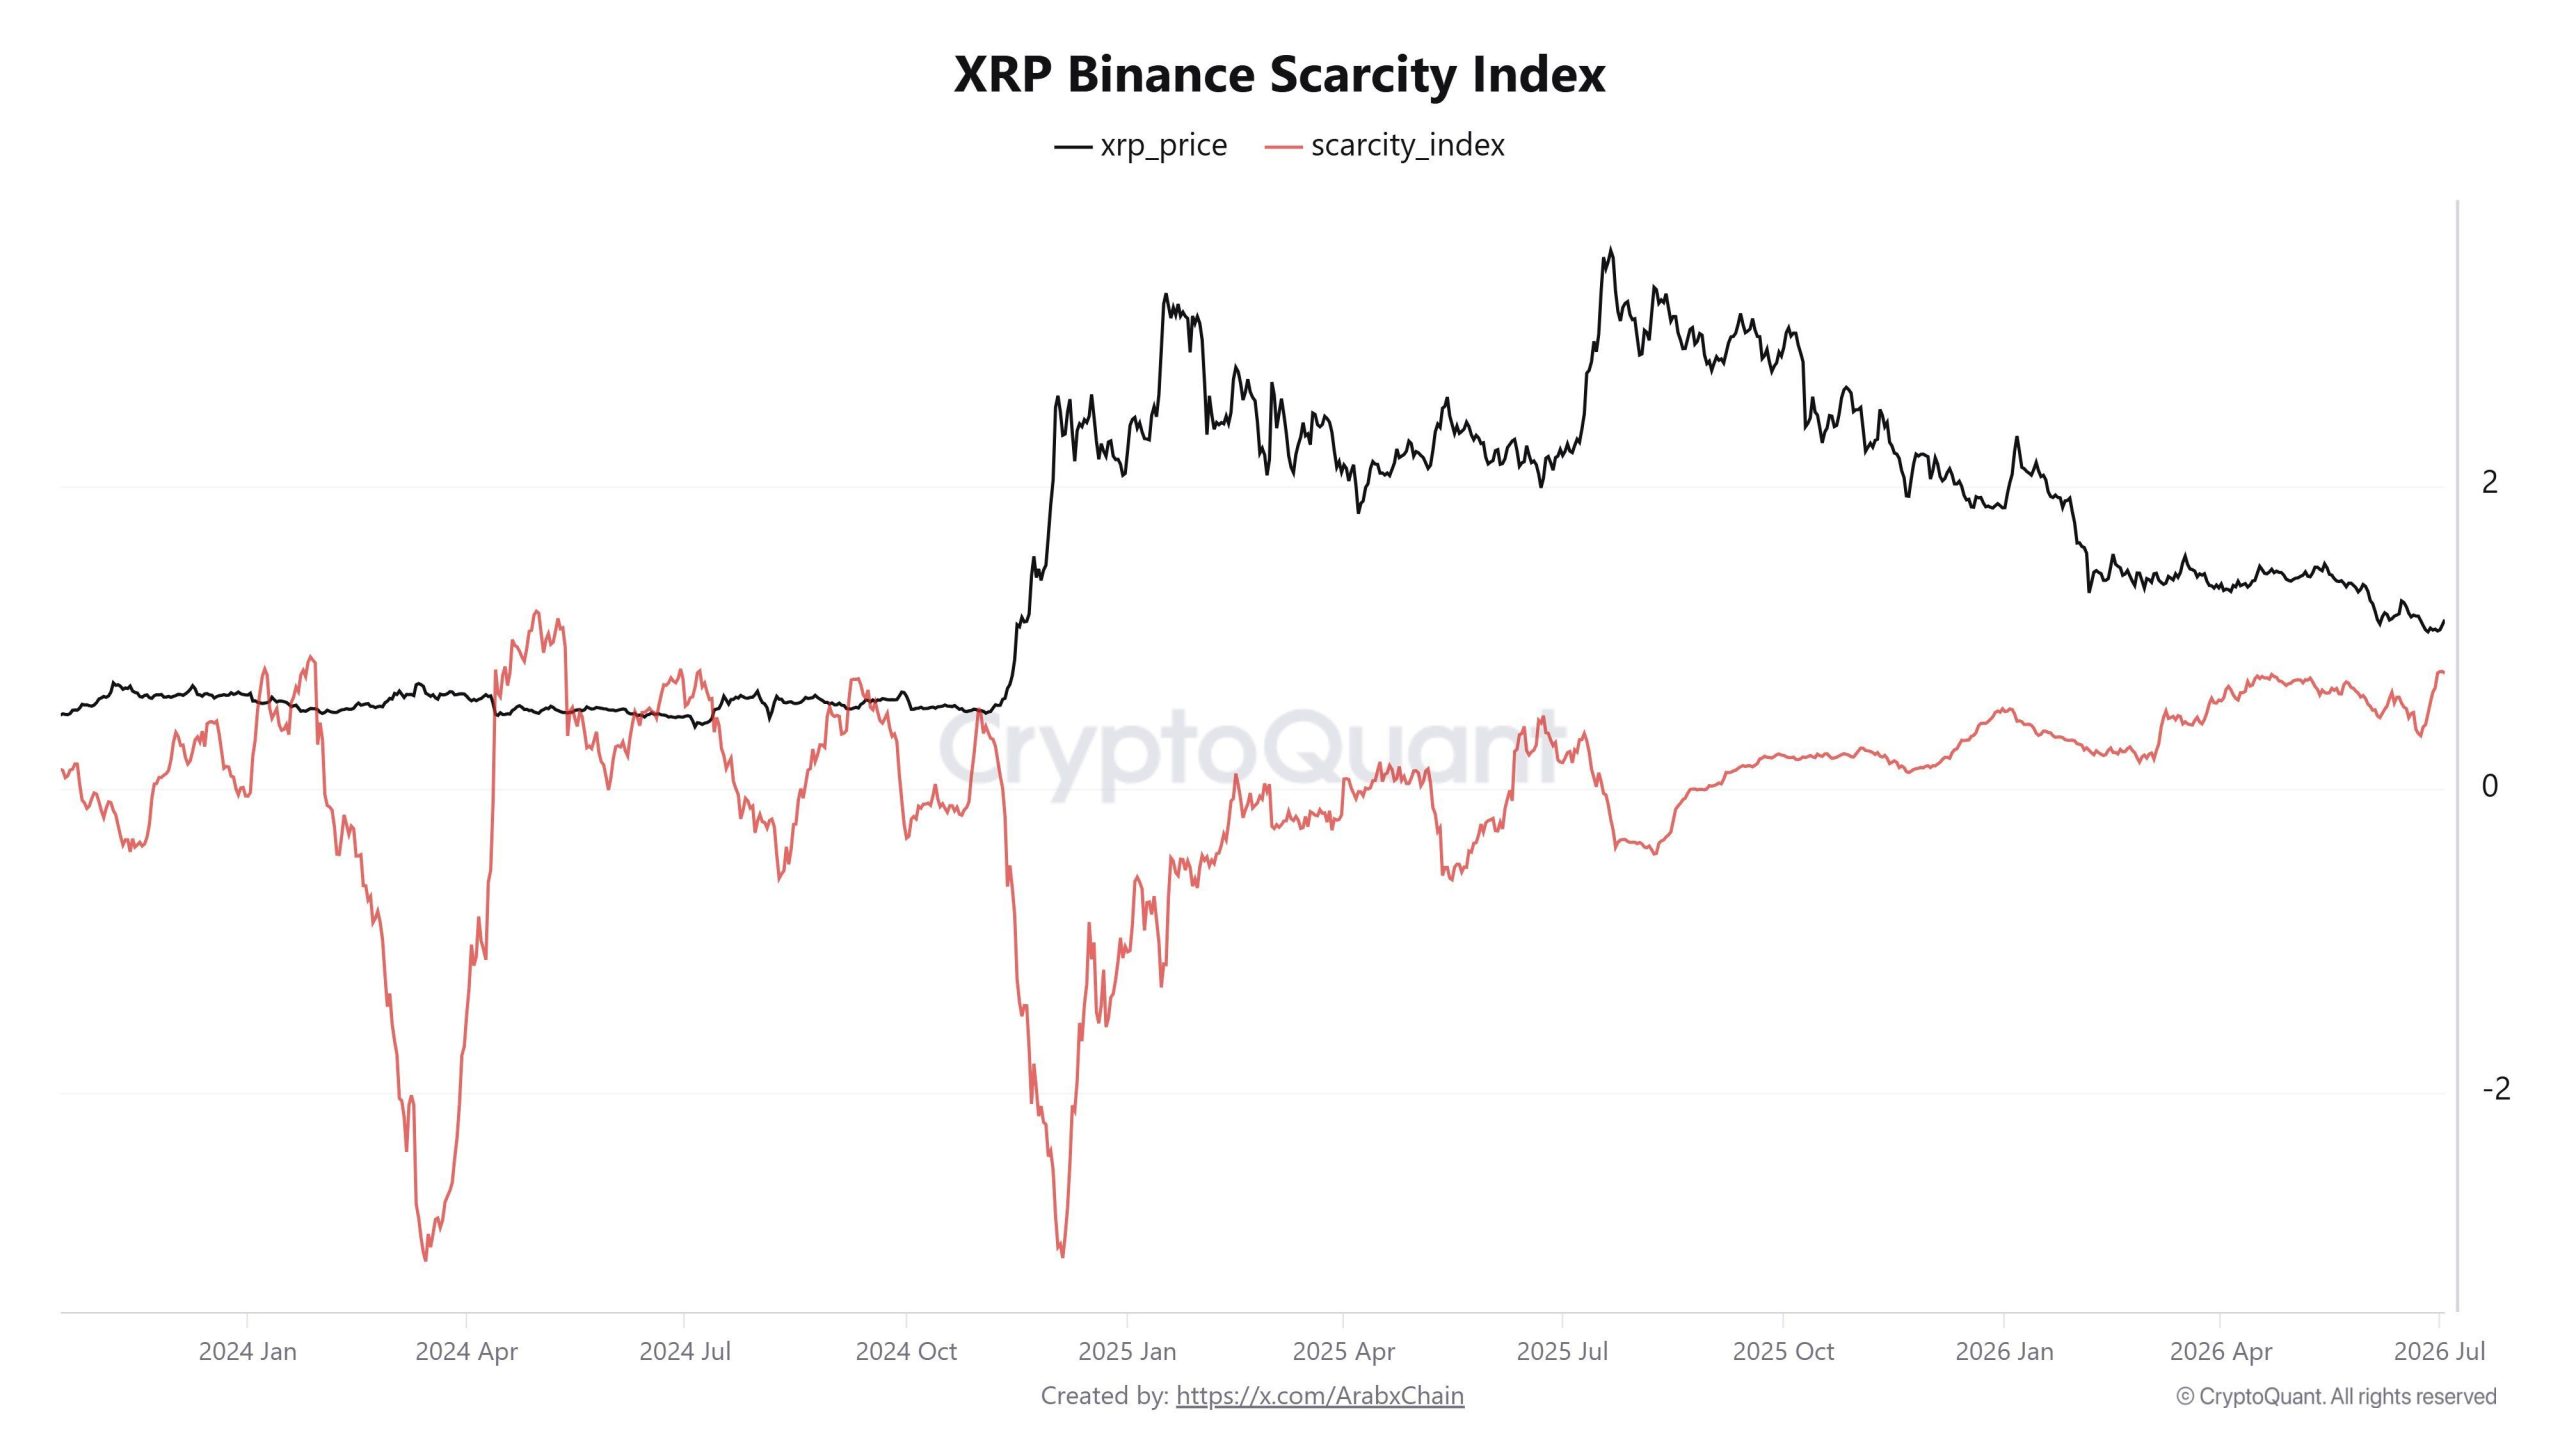
XRP’s Binance Scarcity Index has climbed to 0.77, its highest reading in more than two years, while the token trades near $1.13. The signal points to shrinking sell-side supply on the largest exchange for the asset.
CryptoQuant data shows Binance XRP reserves have dropped roughly 20% since November 2024. Meanwhile, derivatives markets suggest shorts got squeezed near $1, setting up a test of the $1.20 resistance.
XRP Binance Scarcity Index Rises to Its Highest Level Since Mid-2024
The XRP Binance Scarcity Index reached about 0.77 this week, according to CryptoQuant analyst ArabxChain. The reading is the highest in over two years and follows a long stretch of relative stability.
The index tracks how scarce XRP has become on Binance compared to earlier periods. Rising values suggest fewer coins are available for sale, which typically translates into weaker potential selling pressure.

Historically, the deepest negative readings told the opposite story. In December 2024, the index collapsed as holders flooded Binance with deposits to take profit during the rally toward $3. Today’s setup is the mirror image, with coins leaving the exchange into price weakness.
Exchange reserve data confirms the withdrawal trend. Binance held around 3.27 billion XRP in November 2024. That figure now sits near 2.6 billion, a decline of roughly 650 million coins, or 20%.

Moreover, the drawdown accelerated recently. Reserves slid from about 2.8 billion in May to 2.6 billion in early July, the same window in which the scarcity index broke out.
A sharp dip and rebound of roughly 350 million XRP in February and March likely reflected internal wallet transfers rather than organic flows.
Shorts Paid the Price at the $1 Bottom
Shrinking supply alone does not lift prices, however. Demand remains the missing piece, and derivatives data shows how positioning around it has shifted.
Coinglass data shows XRP’s open interest-weighted funding rate stayed mostly positive through May, even as price fell from above $1.45. Longs kept paying and kept getting punished.

In contrast, June brought a sharp flip. Negative funding clusters deepened as the price approached $1, and the most aggressive negative prints hit between June 26 and 28, right at the lows. Shorts were paying to press a market that had already hit its deepest holder losses in 12 years.
That crowding set the stage for a squeeze. The rebound to $1.13, therefore, reads as short covering rather than confirmed spot demand. Funding has turned mildly positive since early July, suggesting a positioning reset without tipping into euphoria.
XRP Price Prediction Hinges on the $1.20 Resistance Zone
The daily chart frames the battle. XRP fell from above $1.55 in February to the $1.00-$1.04 support zone in late June, the area a previous analysis flagged as the last major floor. That zone drove the current rebound, and XRP is now 8.6% higher over the past 7 days.
The nearest resistance stands at $1.20, the level that capped the mid-June bounce. A daily close above it would open the May breakdown area at $1.35-$1.40, roughly 22% above the current price. The daily RSI near 55 leaves room for such a move before overbought conditions appear.

Still, caution flags remain. Volume has declined throughout the recovery, a sign that spot buyers have not yet embraced the move.
However, demand may be building elsewhere. XRP volume recently topped Bitcoin (BTC) on Upbit, and BeInCrypto’s July prediction noted seasonal strength for the token.
A drop back below $1.00 would invalidate the recovery structure entirely. Thin Binance supply gives bulls leverage above $1.04, yet the same setup collapses quickly if the $1 floor gives way.
The post XRP Binance Scarcity Index Hits 2-Year High: What Does It Mean for Price? appeared first on BeInCrypto.
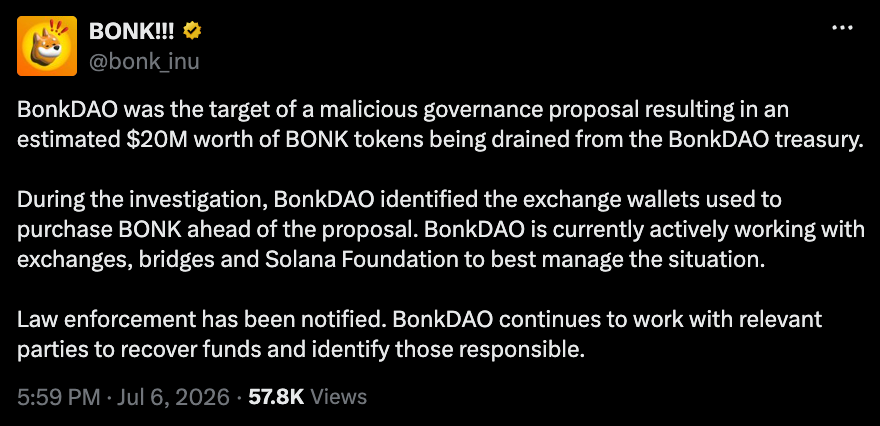
The decentralized autonomous organization (DAO) behind the Bonk (BONK) memecoin reported that an unknown entity had removed $20 million worth of the tokens in what it described as an attack using a “malicious governance proposal.”
In a Monday X post, the Bonk project said that it had informed law enforcement after the $20 million attack and was working to “recover funds and identify those responsible.” According to BonkDAO, the parties had drained $20 million in tokens from the project’s treasury on the Solana blockchain.
One of the dog-themed memecoins, along with tokens like Dogecoin (DOGE) and Shiba Inu (SHIB), BONK launched in December 2022, with its developers airdropping half of the token’s total supply. The price of BONK dropped about 7% over 24 hours amid reports of the attack, to about $0.05.
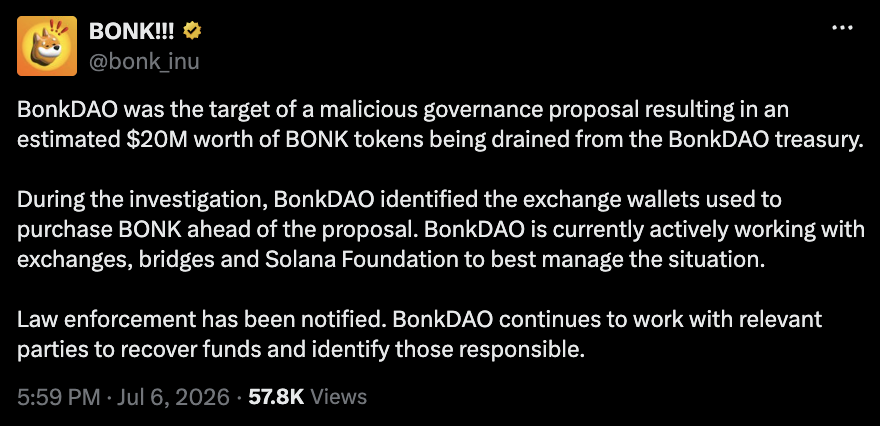
Source: Bonk Inu
The market capitalization of the top memecoins, including DOGE, SHIB and Pepe (PEPE), hit a two-year low last week, dropping to about $22 billion before recovering to more than $26 billion in July. According to CoinMarketCap data, the total market cap was $25.3 billion at the time of publication, down more than 54% over the previous 12 months.
Related: US senator calls for ban on elected officials issuing memecoins
In May, the memecoin launch platform DxSale reported losing $7.3 million in tokens following a cyberattack affecting liquidity providers on the BNB Chain. Although sleuths were able to identify the attacker’s wallet, one expert said the infrastructure used to move the funds could make tracing them difficult.
Trump memecoin holders lose big as president reports billions in crypto earnings
On Saturday, the New York Times reported that about 1 million investors in US President Donald Trump’s memecoin, Official Trump (TRUMP), had collectively lost $3.8 million as of June 30. The report, citing data from blockchain analytics company Nansen, came a few days after the president disclosed that he had earned more than $1.4 billion from his crypto-related ventures, including about $635 million from memecoin projects.
Magazine: Does ‘Paper Bitcoin’ mean there’s an unlimited supply of BTC?


Crypto-related losses have fallen 46.8% year over year to $1.32 billion during the first half of 2026, but blockchain security firm CertiK has warned that the decline does not indicate a safer digital asset ecosystem.
Summary
- CertiK says crypto losses fell 46.8% to $1.32 billion in H1 2026, but the decline does not mean the industry has become safer.
- Wallet compromises replaced phishing as the biggest attack method in Q2, with North Korean-linked attacks driving most major losses.
- CertiK and TRM Labs warn that attackers are becoming more targeted and sophisticated, making private key security a top priority.
According to CertiK’s H1 2026 security report, the lower loss figure is heavily influenced by the absence of an event on the scale of the $1.4 billion Bybit exploit recorded in the same period last year.
The firm said a simple comparison of headline numbers creates a misleading impression because attackers are carrying out fewer random campaigns and instead executing more targeted operations that inflict heavier damage per incident.
Attack patterns have become more concentrated
Breaking down the first-half figures, CertiK reported that phishing remained the leading cause of crypto theft during the first quarter, resulting in losses of $508.2 million. During the second quarter, however, wallet compromises overtook phishing as the largest attack method, accounting for $807.5 million in stolen assets.
A significant share of those losses came from just two major incidents. CertiK said more than 70% of the second-quarter total stemmed from attacks targeting KelpDAO and Drift Protocol, both of which are believed to have been carried out by North Korean state-sponsored hackers.
While total losses appear lower, CertiK said the industry is facing a structurally higher rate of attack activity than a year earlier. Excluding the exceptional Bybit hack from 2025, the firm concluded that individual attacks are becoming more financially damaging and increasingly focused on high-value targets instead of opportunistic exploits.
Separate findings from blockchain intelligence firm TRM Labs support that assessment. In its H1 2026 report released on Wednesday, TRM Labs said the decline in the total value stolen should not be interpreted as evidence that attackers have become less capable. According to the firm, the lower figure is largely the result of there being no record-breaking theft comparable to the Bybit incident during the reporting period.
TRM Labs also found that the number of crypto-related security incidents rose sharply from 83 in the first half of last year to 207 in H1 2026, the highest six-month total the company has recorded. Its analysis further showed that smart contract exploits accounted for 125 incidents, representing roughly 60% of all recorded attacks.
Private key security remains the main defense
Alongside its assessment of attack trends, CertiK identified private key management and multisignature wallet controls as the most critical areas requiring stronger protection. The firm recommended that crypto protocols and institutions securing substantial onchain assets strengthen every layer of key management, including hardware security, multisignature governance and geographic distribution of wallet signers.
CertiK said investments in these controls can produce disproportionately strong security benefits because they directly reduce the impact of attacks targeting sensitive wallet infrastructure.
Attention has also turned to the growing role of North Korean cyber operations. According to TRM Labs, North Korean hackers have stolen more than $6 billion worth of cryptocurrency since 2017. The recent attacks linked to KelpDAO and Drift Protocol prompted officials from the United States, Japan and South Korea to meet late last month to discuss ways to curb North Korea’s cyber activity and the illicit revenue generated through crypto theft.
During those discussions, government representatives acknowledged that North Korean IT workers are increasingly using artificial intelligence to improve the scale, speed and sophistication of cyber operations. Several cybersecurity leaders have separately warned that AI-assisted techniques are making protocol exploits harder to detect and defend against.
Meanwhile, hardware wallet maker Ledger has continued to advise crypto users to keep recovery seed phrases offline and never disclose them, describing those practices as basic but essential safeguards against phishing attacks and unauthorized wallet access.
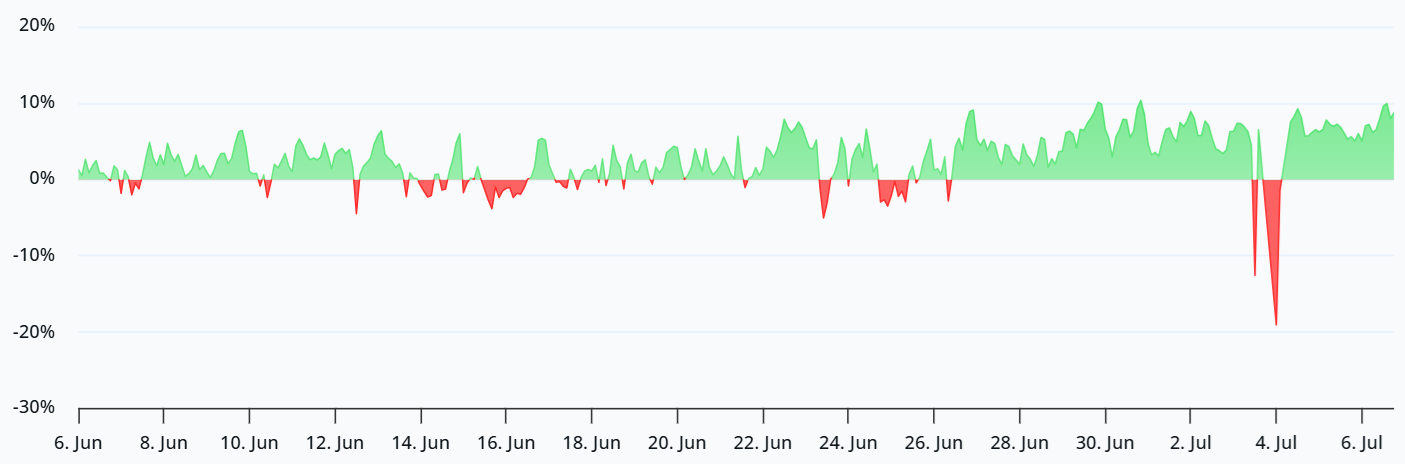
Key takeaways:
- Bitcoin derivatives show resilience despite bearish pressure from Strategy’s Bitcoin sales.
- Onchain Bitcoin data points to sellers’ exhaustion, strengthening the $60,000 support level.
Bitcoin price quickly recovered from the selloff to $61,300 that followed Strategy’s Bitcoin sale announcement. Despite the negative impact on traders’ sentiment, the additional $216 million cash position eased concerns about the company’s ability to pay dividends and cover its debt. Does the quick recovery suggest that Bitcoin bulls back in control?
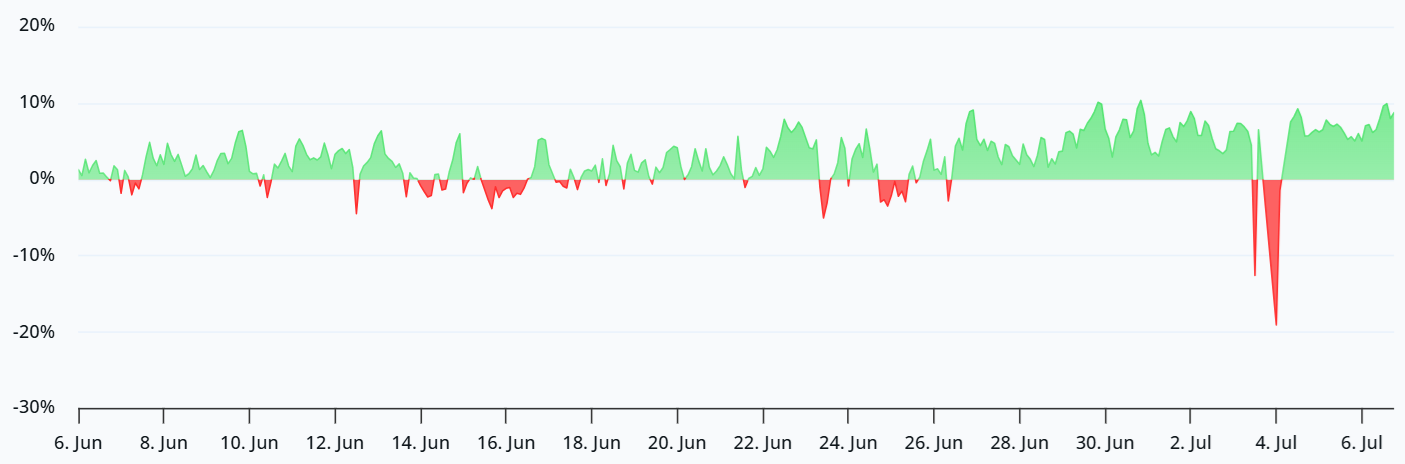
Bitcoin perpetual futures annualized funding rate. Source: Laevitas
The Bitcoin perpetual futures annualized funding rate jumped to 9% on Monday, indicating balanced demand between bullish and bearish leverage. While far from displaying conviction, the indicator distanced itself from the bearish momentum on Saturday marked by negative funding rates. But unlike the futures markets, Bitcoin options signaled minor stress on Monday.
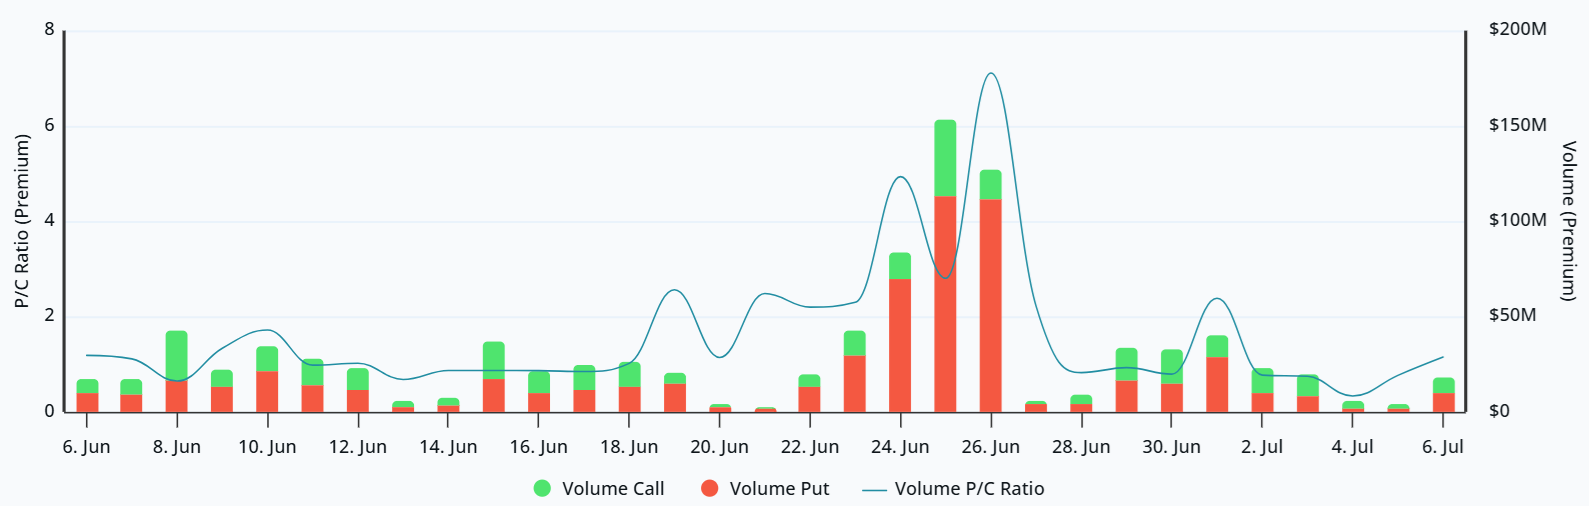
Bitcoin options premium put-to-call ratio at Deribit. Source: Laevitas
The put (sell) options premium at Deribit outpaced the equivalent call (buy) instruments on Monday, reverting the trend from Thursday and Friday. Typically, periods of stress can easily push the indicator above 2 times, hence the current 1.15 level remains under the neutral range. Bitcoin futures and options displayed resilience, although the bounce to $63,500 was unable to instill bullishness.
Bitcoin ETF flows reversal and long-term holders conviction favor $65,000 rally
Bitcoin bears might have underestimated the relevance of the $223 million net inflows into US-listed spot Bitcoin exchange-traded funds (ETFs) on Friday, the first after 10 consecutive outflows. The record-high $4.51 billion net outflows in June negatively impacted trader sentiment.
Still, the sell pressure will eventually subside, and the potential reversal in ETF flows could be enough to instill bullishness in Bitcoin derivatives markets.
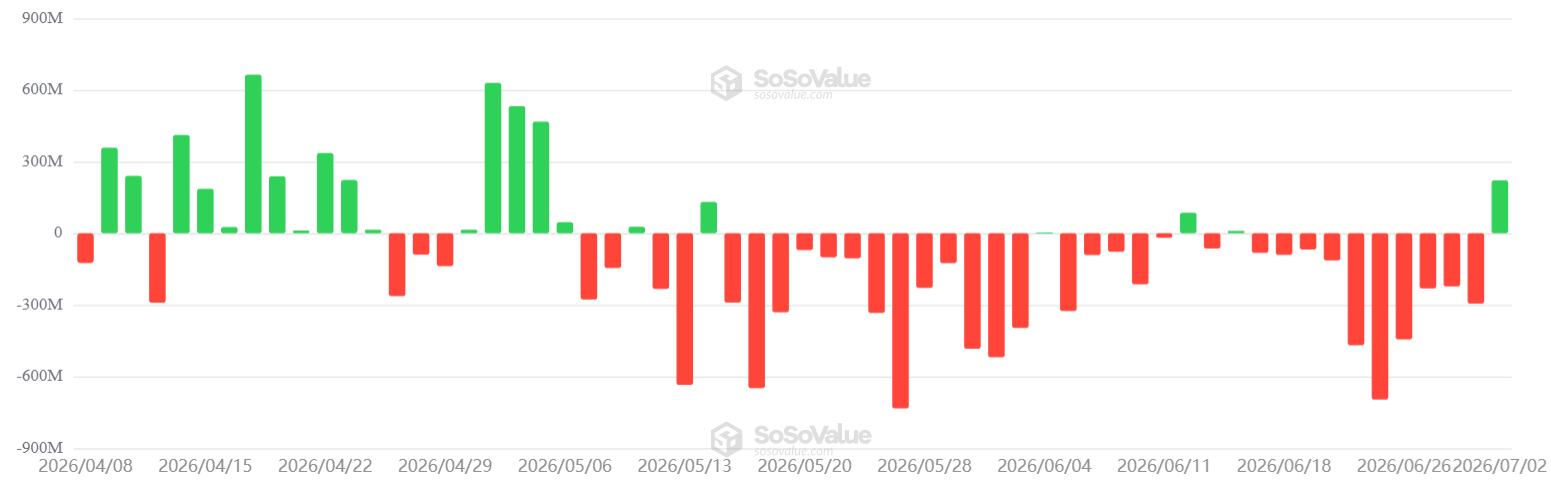
US-listed spot Bitcoin ETFs daily net flows, USD. Source: SoSoValue
Part of the recent bearishness can be pinned to the record drawdown in Strategy preferred perpetual equity Stretch (STRC US), which offers holders an attractive 12% yield. However, new stock issuance can occur only at the fixed $100 price; hence, the company currently has fewer instruments available to support the dividend payout.
Strategy holds sufficient cash reserves to cover 17 months of dividends; thus, the urgency of additional Bitcoin sales is debatable.
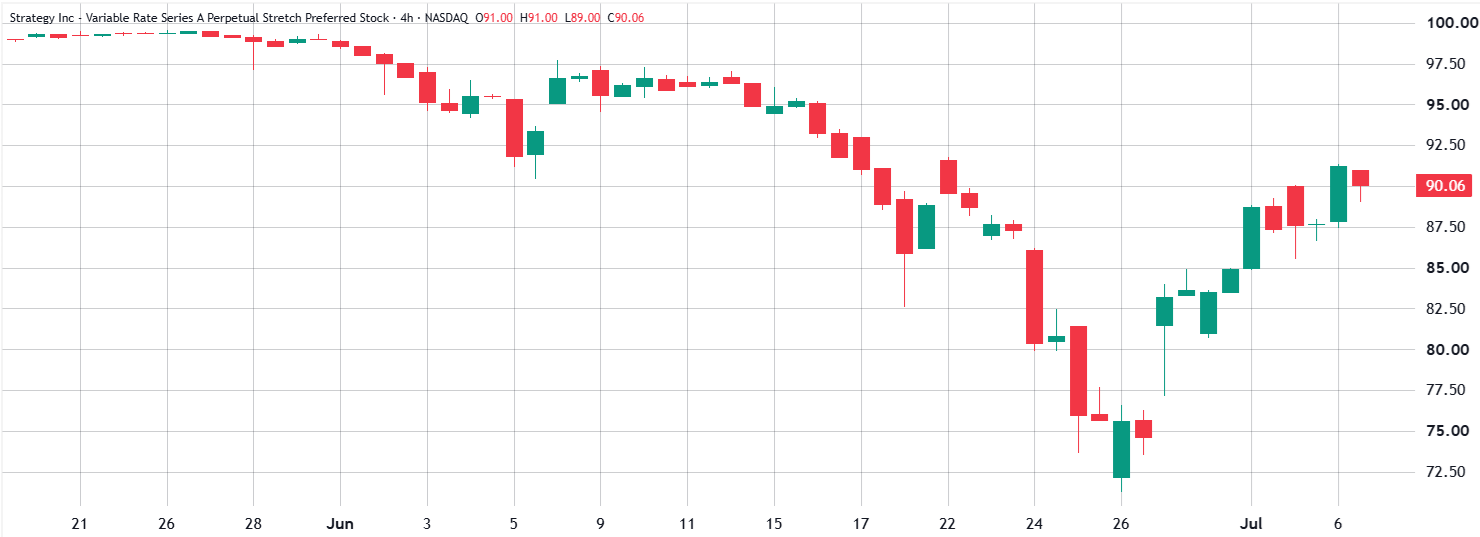
Strategy preferred perpetual equity Stretch (STRC US). Source: TradingView
Regardless of Strategy’s extremely low 8% debt leverage, Bitcoin bears have the upper hand as the company endures $8 billion in unrealized losses from its Bitcoin purchases. Bitcoin bulls’ biggest hopes rely on long-term holders’ conviction and onchain data pointing to selling exhaustion, strengthening the $60,000 support level.
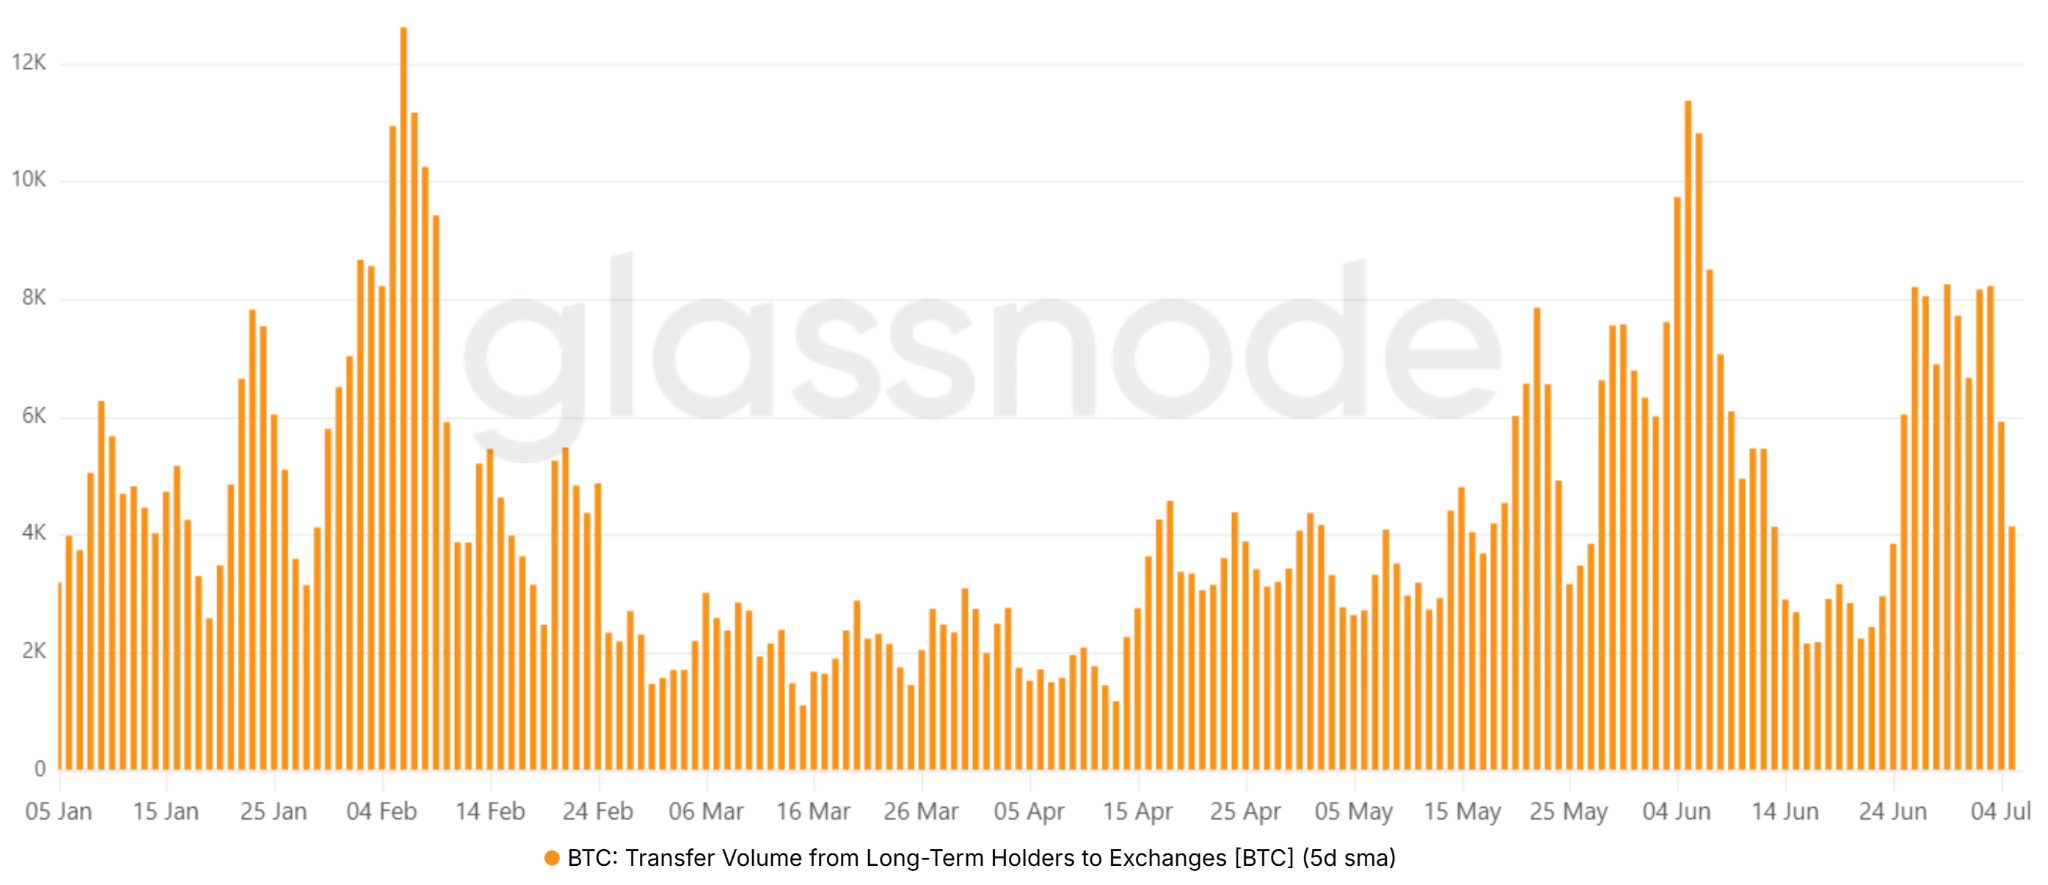
Bitcoin transfers from long-term holders to exchanges, BTC. Source: Glassnode
Transfers from long-term holders to exchanges are down to 4,130 BTC per day on average, from 8,040 BTC one week prior. Nonetheless, unless the spot Bitcoin ETFs exhibit a sequence of relevant net inflows, derivatives traders will likely remain skeptical of sustained bullish momentum, reducing the odds of a sustained rally above $65,000.
Presently, Strategy’s huge unrealized losses and skepticism in Bitcoin derivatives point to further pressure from bears.
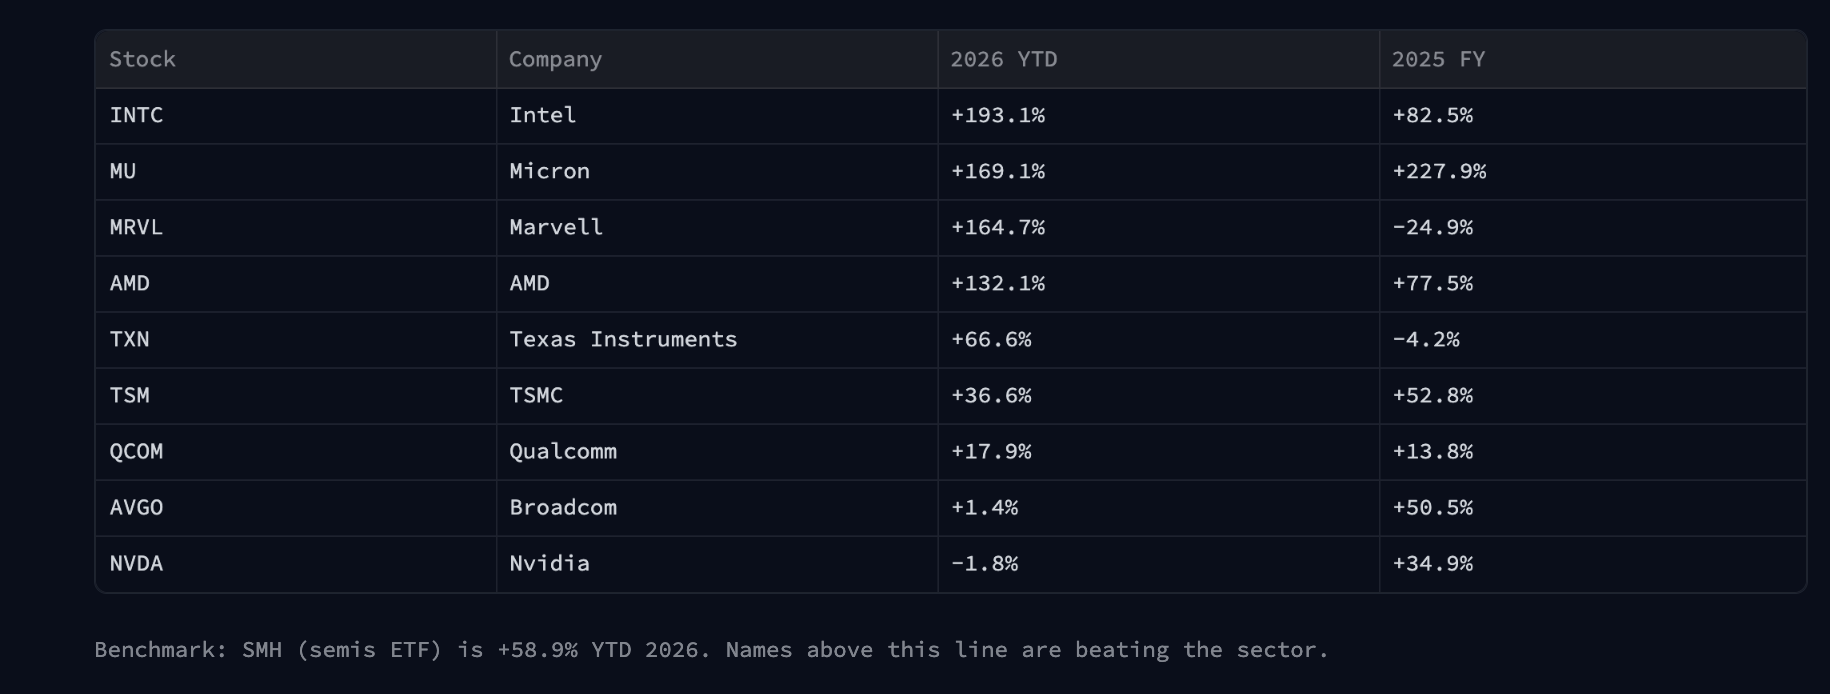
Nvidia stock trades near $195, and it has quietly become the worst performer in its own chip group in 2026.
The slide comes as investors question whether the AI boom that powered Nvidia can keep paying off. A delayed mega-IPO has only deepened those doubts.
Why Nvidia Stock Price is Lagging
Nvidia (NVDA) is mostly trading flat this year. Its peers have soared, with the semiconductor ETF up nearly 59% and rivals like AMD and Micron gaining well over 100%. The pain is recent. After a strong 2025, Nvidia stock fell about 18% from its June high, including a 10.7% drop in June alone.

Meanwhile, the wider AI trade has cooled. Reuters reported in late June that OpenAI may delay its IPO to 2027 to protect a $1 trillion valuation.
Want more insights like this? Sign up for Editor Harsh Notariya’s Daily Newsletter here.
That matters because it signals caution. When the biggest AI name waits rather than test the market, investors read it as a warning on stretched valuations, and Nvidia is the sector’s bellwether.
The Catalysts That Could Turn It Around
Still, the news is not all bad. Washington has begun issuing licenses for Nvidia to sell its H20 chips in China again, reopening a key market the US had blocked.
Big customers could help too. Microsoft, Meta, Amazon, and Alphabet report earnings in late July, and strong AI spending plans would point straight to more Nvidia chip orders.
One caveat on timing. Nvidia’s own results do not land until late August, so July hinges on these outside events, not the company’s numbers. It is worth noting that Nvidia’s Q1 earnings report landed in May, and April and May were the best months in terms of returns.

If the Nvidia stock price follows the same trend, July could be a bullish month, on record.
Money Flow and Positioning Are Mixed
The tape sends mixed signals. Chaikin Money Flow, a gauge of whether big money is buying or selling, has climbed since June 25 and now sits near zero at -0.01. That hints that money is trickling back in early July, which aligns with recovery month expectations shared earlier.
Yet, the CMF must cross above the zero line to confirm buying.

Options lean the same way. The put-call ratio’s volume reading eased to 0.48 while open interest held at 0.82, showing a few more bullish call bets.

Large traders, however, disagree. Smart money data, per crypto perps, shows a net short of about $16.7 million in Nvidia, the heaviest short among major chip names.

Even with those shorts in place, the setup is unlikely to spark a crash. According to The Kobeissi Letter, leveraged ETF bets on Nvidia total about $5.6 billion against $28.8 billion in daily trading, far tamer than the crowded leverage seen in Korean chip stocks like SK Hynix. That matters for the downside.
With little forced leverage to unwind, any further drop in Nvidia stock is more likely to be an orderly slide than a violent, cascade-driven crash.
Nvidia Stock Price Levels to Watch
For now, one number rules the chart. Nvidia lost the $200 level on June 23 and has not reclaimed it. A move back above $200 would flip momentum and open room toward the $207 to $213 zone inside its falling channel.
On the downside, $189 marks the channel floor. A daily close below it would expose a deeper slide. So the setup is binary. Strong AI spending guidance from the big cloud companies in late July, or a firm China deal, could push Nvidia stock back above $200, while fading AI confidence could crack $190.

The $200 level separates a July recovery from another leg lower.
The post What to Expect From Nvidia Stock in July 2026: Recovery or Another Leg Down? appeared first on BeInCrypto.

Cape Verde World Cup hero Vozinha reportedly in line to become Lionel Messi’s Inter Miami teammate | Football News

Judge upholds Musk Twitter investor fraud verdict

“Bitcoin CRASHES to $58k! Something Much Bigger Is Coming…” – Tom Lee


-

 Fashion3 days ago
Weekend Open Thread: High Hopes
-

 Politics3 days ago
The House | “Reframing the debate from a binary discussion of winners and losers”: Yuan Yang reviews ‘We Are Not Machines’
-
 Crypto World7 days ago
Strategy authorizes up to $1.25B in Bitcoin sales under new capital plan
-

 News Videos7 days ago
How to Build INSANE Live Financial Dashboards With Claude
-

 Fashion6 hours ago
Open Thread: What Great Books Have You Read Recently?
-
 NewsBeat2 days ago
Taylor Swift and Travis Kelce wedding staffer hilariously struggles to keep her cool while checking in megastars
-

 Tech7 days ago
Anonymous researcher drops 0-day ‘exploitarium’ repo
-

 Business7 days ago
Australia treasurer says alleged access of prime minister’s bank data ’incredibly concerning’
-
 Crypto World5 days ago
Airdrop Registration Becomes Key Focus For Remittix As RTX Launch Updates Approach
-

 Sports5 days ago
Broncos roster: OL Ben Powers (No. 74) entering final year of contract
-

 Crypto World5 days ago
Binance stock trading tops $1B in first month after launch
-

 NewsBeat6 days ago
Presenter Caroline Flack’s brother Paul Flack dies aged 55
-

 Crypto World5 days ago
Alibaba-affiliate Ant Group enters the humanoid robot market with 12 deals
-
 Crypto World3 days ago
Standard Chartered Secures MiCA License as ESMA Adds 37 New Crypto Firms
-

 Crypto World1 day ago
South Africa proposes crypto tax guidance under existing rules
-

 News Videos7 hours ago
Best Time to Enter Small Caps Right Now? Another Bull Run? | Financially Free
-
 NewsBeat5 days ago
New exhibition reflects five decades of movement between island of Ireland and GB
-

 Business5 days ago
Meta Platforms Stock Jumps 7% Today as Bloomberg Reports Company Plans to Enter the Cloud Business
-
 Tech1 day ago
Lenovo laptops are now shipping with YMTC SSDs, a sign of Chinese NAND entering the mainstream
-

 Business4 days ago
What a 10 Percent Drop Means for Buyers, Sellers and Renters
You must be logged in to post a comment Login