
Crypto World
Ethereum Price Prediction: Is ETH Heading to $2K After 15% Weekly Drop?
Ethereum remains structurally bearish, with the price reacting to demand but lacking confirmation of a meaningful trend shift. The interaction between this demand zone, nearby supply levels, and persistent sell-side pressure will be critical in determining whether Ethereum stabilises or continues lower in the coming sessions.
Ethereum Price Analysis: The Daily Chart
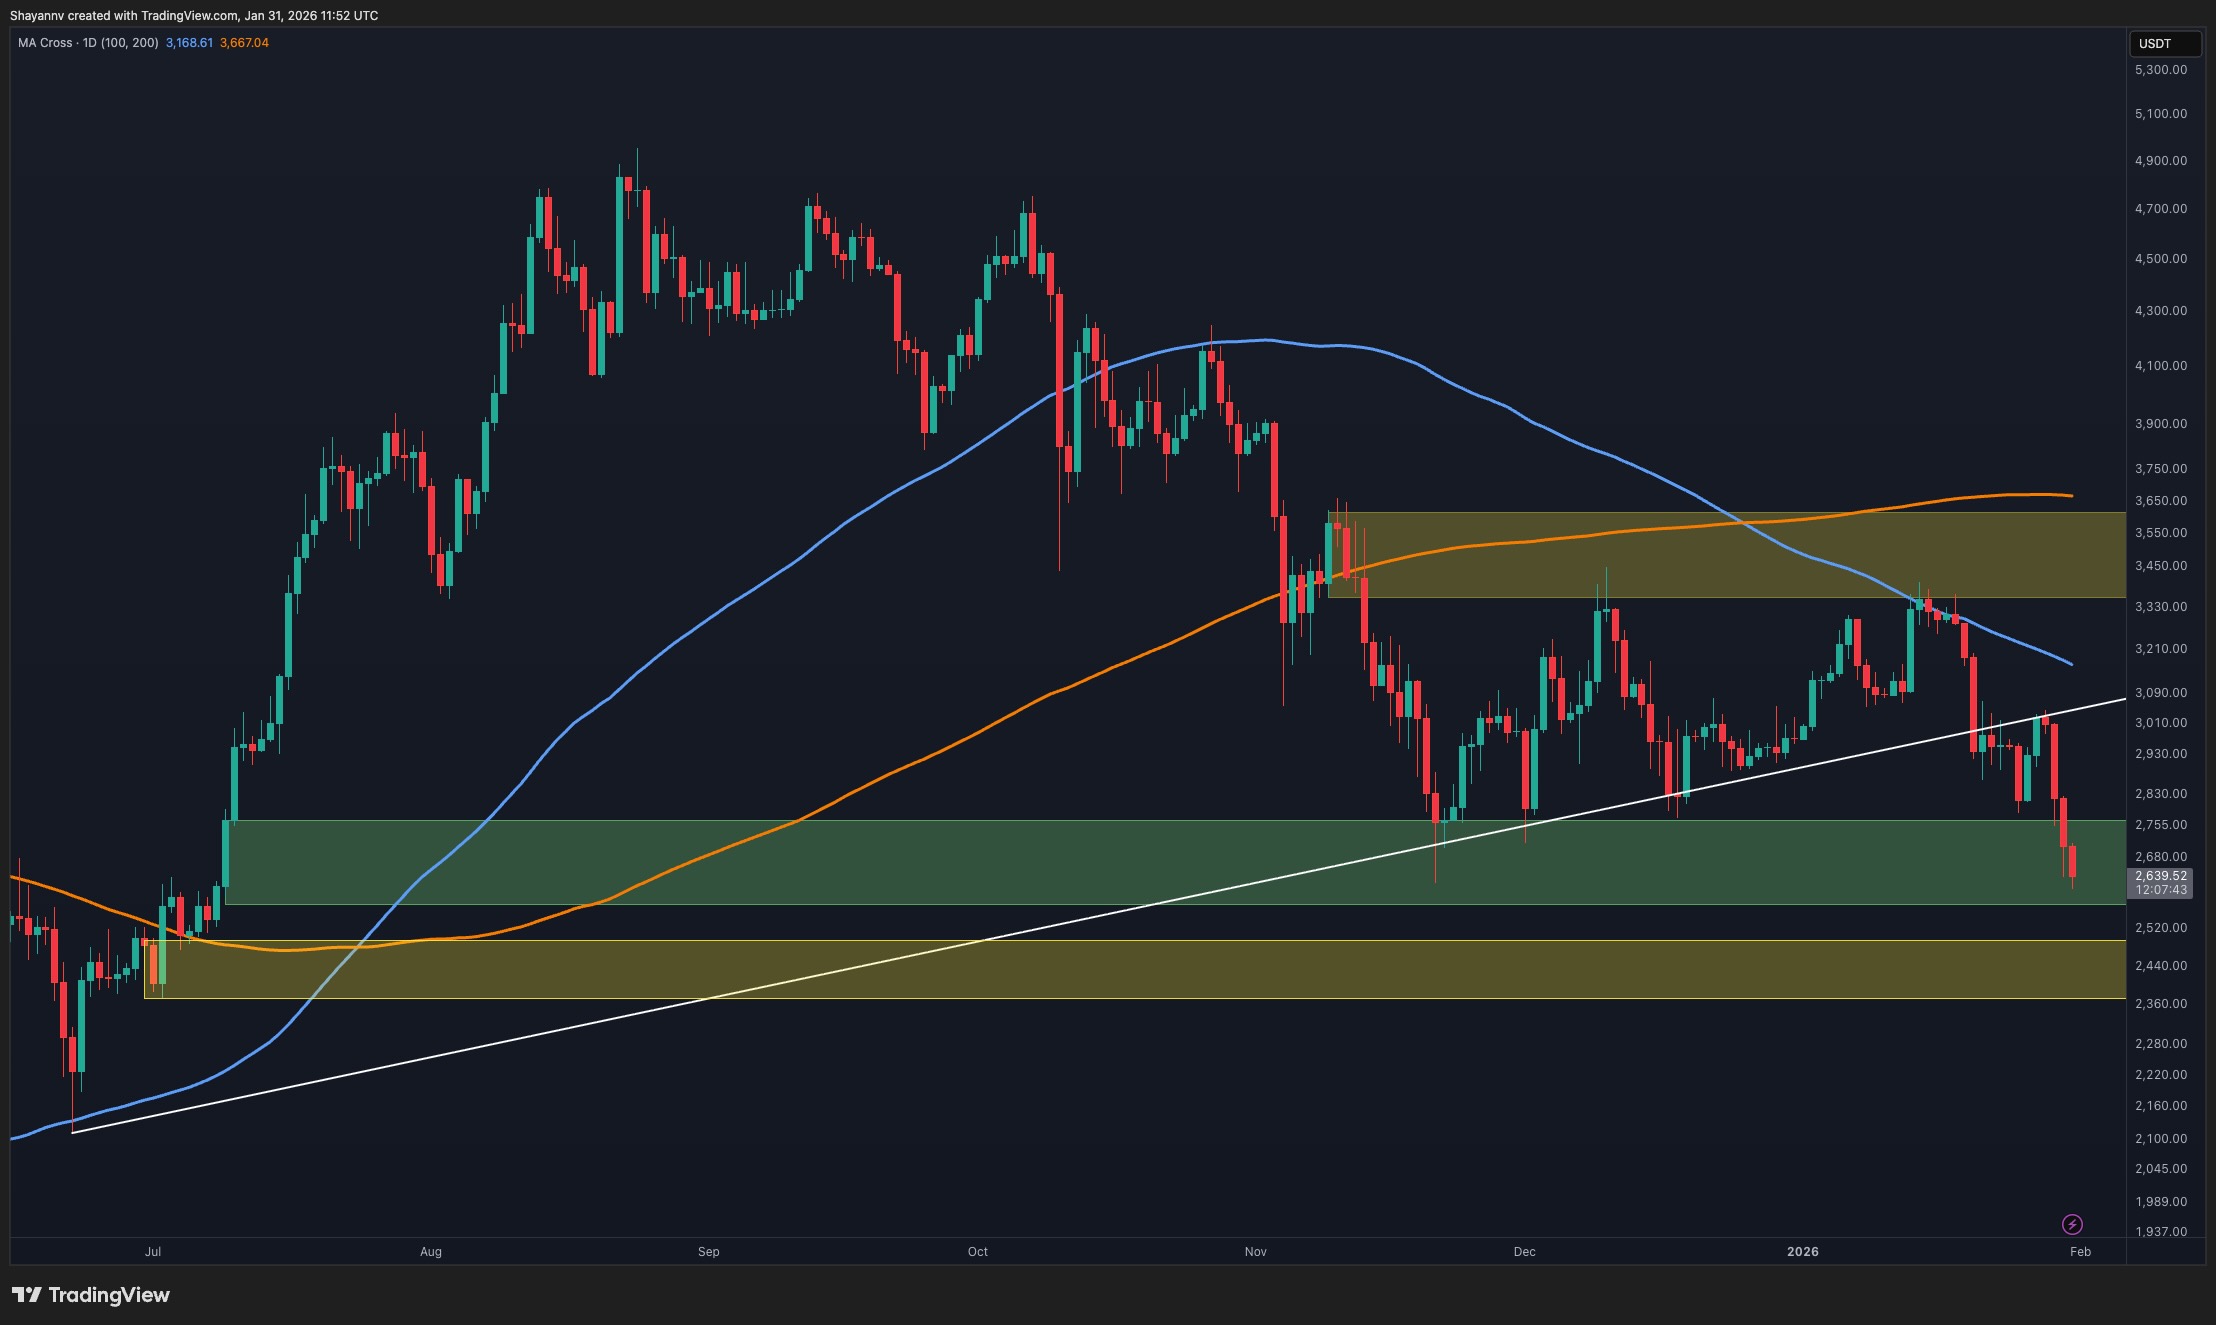
On the daily timeframe, ETH has broken down from its previous structure and is now trading well below the ascending trendline, confirming a broader bearish sentiment. The recent rejection from the crucial supply zone around the mid-$3K region marked a clear bearish continuation signal by completing a pullback.
The asset has since accelerated lower and is currently testing a well-defined demand zone around the $2.5K area. This zone has previously acted as a strong buyers’ base, and the current reaction suggests initial demand absorption. However, the overall structure remains weak as long as the price stays below the moving averages and the $3K psychological level.
Nevertheless, a daily close below the current demand zone would open the door for continuation toward the lower yellow support region, while stabilisation here is required to prevent further downside expansion.

ETH/USDT 4-Hour Chart
On the 4-hour timeframe, Ethereum has printed another bearish signal by recently breaking below a minor consolidation wedge pattern. The most recent move shows a sharp sell-off into demand, followed by a modest reaction that lacks impulsive bullish follow-through.
From a structural perspective, any upside reaction in this area at the $2.5K range is likely corrective and vulnerable to selling pressure. The most logical bearish continuation scenario involves a pullback toward the nearby supply zones around the $2.7K and $3K regions, where previous support has flipped into resistance. As long as the price remains below those supply areas and fails to reclaim the channel midpoint, sellers retain control.
Sustained acceptance below the lower channel boundary would further confirm downside continuation, while only a strong reclaim of structure would challenge the bearish bias.

Sentiment Analysis
The one-month Ethereum liquidation heatmap clearly highlights a dense liquidity pocket forming around and especially below the $2.5K level. This area stands out as one of the most concentrated zones of resting leverage on the chart, indicating a large cluster of stop losses and liquidation levels from overexposed long positions.
As prices continue to trend lower, these liquidity pools naturally become attractive targets for the market, particularly in a bearish environment in which downside extensions are driven by forced liquidations rather than organic selling alone.
The gradual build-up of liquidity beneath $2.5K suggests that many participants are still positioned defensively around this range.

The post Ethereum Price Prediction: Is ETH Heading to $2K After 15% Weekly Drop? appeared first on CryptoPotato.


STRIDE Introduces Structured Security Evaluation
Solana traded near $180 during the announcement period, reflecting stable market conditions despite recent events. The foundation launched STRIDE to standardize how protocols assess and manage risks. The framework focuses on eight areas, including governance, infrastructure, and operational security.
The program evaluates protocols independently and publishes the results for public access. This approach improves transparency for users interacting with decentralized applications. It also helps projects identify weaknesses and strengthen their defenses.
Protocols exceeding $10 million in total value locked can access funded monitoring services. Those above $100 million gain support for formal verification of smart contracts. These measures aim to reduce risks before incidents occur.
SIRN Focuses on Real-Time Threat Response
Solana introduced the Solana Incident Response Network to coordinate responses during active threats. The network includes firms such as Asymmetric Research, OtterSec, and Neodyme. It enables members to share intelligence and act quickly during security events.
The network prioritizes access based on protocol size and risk exposure. It connects security experts, exchanges, and infrastructure providers. This coordination improves reaction time when incidents emerge.
Experts noted that faster response could limit damage during exploits. Some analysts pointed to delays in freezing stolen assets in past incidents. A unified response network may help address such gaps.
Drift Exploit Highlights Human Security Risks
The recent breach at Drift Protocol exposed weaknesses beyond smart contract code. Attackers used social engineering to target contributors over several months. They compromised devices and gained approval access through trusted channels.
The attack bypassed traditional audits and monitoring systems. Transactions appeared valid, which made detection difficult in real time. This case highlighted the gap between technical security and human trust.
As a result, the new initiatives aim to address both onchain and offchain risks. The foundation emphasized that projects must still maintain strong internal security practices. It stated that ecosystem tools support, but do not replace, team responsibility.


The collateral and liquidity focused fintech is also building a node-as-a-service on Canton, which is known as an institution-focused blockchain platform.
Institutional collateral and liquidity optimization fintech Transcend announced today, April 7, that it has connected to privacy-focused blockchain Canton Network. The integration enables clients to move collateral and cash in real time across counterparties and markets using a mix of traditional and tokenized assets.
Per the release, Transcend connects to more than 45 central counterparty clearinghouses (CCPs) — the intermediaries that sit between buyers and sellers in derivatives and securities markets to reduce counterparty risk — as well as five triparty agents. The integration with Canton appears to be the fintech’s first partnership with a crypto firm, letting institutions incorporate tokenized assets into existing workflows without restructuring their operating models.
The company is also building a node-as-a-service on Canton and two-way APIs to translate between DeFi and TradFi systems, nothing it will start with Canton and extend to other blockchain platforms.
Canton has been accumulating high-profile institutional partnerships in recent months, as The Defiant previously reported. JPMorgan announced it would issue its deposit token natively on Canton, with rollout planned in phases throughout 2026. Before that, DTCC selected Canton to tokenize a subset of the U.S. Treasury securities it holds, citing the network’s privacy features.
Most recently, LayerZero became the first interoperability protocol to go live on Canton, letting TradFi institutions route tokenized assets across more than 165 public blockchains while maintaining compliance requirements.
Canton describes itself as a public blockchain with a focus on configurable privacy for institutional players, a characterization that has broadly drawn skepticism from the DeFi community, which argues the network’s permissioned validator set makes the label misleading.
It’s also worth noting that the over $262 billion in tokenized RWAs reported on Canton reflects represented value — assets that use blockchain for record-keeping, but cannot be freely transferred on-chain, per RWAxyz.
Transcend CEO Bimal Kadikar framed today’s move as a bridge between two financial paradigms. “The future of collateral is TradFi and DeFi, operating in concert,” Kadikar said in the release.
This article was written with the assistance of AI workflows. All our stories are curated, edited and fact-checked by a human.


- Shiba Inu (SHIB) faces selling pressure amid rising exchange inflows.
- The SHIB price remains stuck below the key $0.0000060 resistance.
- Breakdown below the support at $0.0000053 may trigger a drop below $0.0000050.
The price outlook for Shiba Inu (SHIB) is starting to tilt bearish as the token continues to struggle below the $0.0000060 level.
Recent price action shows that despite a brief attempt to push higher, momentum has faded quickly, leaving SHIB trading near $0.0000058.
Over the past 24 hours, SHIB has declined by around 3%, underperforming a weak crypto market.
While the broader crypto market pullback has played a role, the weakness in SHIB appears more pronounced, suggesting that internal factors are also driving the decline.
Selling pressure and fading confidence weigh on SHIB
One of the clearest signals behind SHIB’s weakness is the sharp drop in derivatives activity.
Shiba Inu’s Open interest has fallen significantly from its earlier highs, pointing to a steady exit of traders from leveraged positions.

At the same time, on-chain activity shows a noticeable increase in tokens moving onto exchanges.
This trend is typically associated with selling intentions, as traders transfer assets to trading platforms when they plan to liquidate positions.
The combination of falling open interest and rising exchange inflows creates a strong bearish undertone.
This shift in behaviour suggests that the market is gradually leaning toward distribution. Without a reversal in these flows, it becomes difficult for the price to sustain any meaningful upside.
Broader market weakness adds to downside risk
The performance of Bitcoin has also played a role in SHIB’s recent decline. As the leading cryptocurrency edges lower, risk appetite across the market has weakened.
As a result, speculative assets like Shiba Inu (SHIB) tend to face greater pressure.
There is also clear evidence of capital rotating away from altcoins. Traders appear to be moving into more stable assets or stepping away from the market altogether.
This shift has hit meme coins particularly hard, as they rely heavily on strong sentiment and active participation.
As a result, SHIB is not just dealing with its own internal challenges but also navigating a less supportive macro environment.
Resistance holds firm as price struggles to break higher
Technically, SHIB remains trapped below a key resistance zone between $0.0000060 and $0.0000063.
Several attempts to push above this range have failed, with sellers consistently stepping in to cap gains.
A closer look at the price structure shows that SHIB is currently consolidating within a narrow band.
Support is forming around $0.0000052–$0.0000053, while resistance remains firmly overhead.
This range has tightened in recent sessions, reflecting a market that is waiting for a decisive move.

Notably, the inability to reclaim $0.0000060 is particularly important. This level has acted as a short-term barrier, and until it is flipped into support, any upward movement is likely to remain limited.
For now, the balance of risks appears tilted to the downside.
The ongoing selling pressure, combined with weakening market participation, suggests that SHIB may continue to struggle unless conditions change.


CME Group expanded is looking to expand its crypto derivatives offerings with new futures contracts for Avalanche and Sui, pending regulatory approval.
CME Group announced its plans to launch Avalanche and Sui futures contracts in a press release on Tuesday, April 7. Pending regulatory review, the contracts will be available in both larger and micro sizes, designed to provide capital efficiency and strategic flexibility for traders.
The addition expands CME Group’s existing crypto product suite — which consists of Bitcoin, Ethereum, Solana, and XRP futures, per its website — and follows the exchange’s broader push into digital asset derivatives. Micro contracts typically require lower margin requirements, enabling greater accessibility for retail and institutional participants.
Source: CME Group
This article was generated automatically by The Defiant’s AI news system from publicly available sources.
Crypto World
Your crypto strategy should be about how much pain you can handle, not how much money you’ll make, Schwab finds


Charles Schwab’s latest research on digital assets argues that cryptocurrencies’ place in a portfolio hinges less on return forecasts and more on how much risk an investor is willing to take.
The report frames bitcoin and ether (ETH) as high-volatility assets that can quickly reshape a portfolio’s risk profile. “Any allocation to cryptocurrency is likely to increase a portfolio’s volatility,” Schwab writes, pointing to sharp historical swings in both assets. Bitcoin and ether have each suffered drawdowns of more than 70% in past cycles, far exceeding typical declines in stocks or bonds.
Because of that volatility, even small allocations can have an outsized effect. Schwab finds that just a low single-digit percentage in crypto can account for a meaningful share of total portfolio risk. In some cases, allocations as small as 1% to 3% can materially change how a portfolio behaves during market stress.
The report outlines two common approaches to adding crypto exposure. The first follows traditional portfolio theory, where allocations depend on expected returns, volatility, and correlations. But Schwab highlights a key weakness: assumptions about crypto returns vary widely among investors.
“Our research suggests that cryptocurrencies may not offer a large enough risk-adjusted return to justify a meaningful allocation if return expectations are less than 10%, even for an aggressive investor,” the report states. That makes portfolio outcomes highly sensitive to subjective forecasts. A modest change in expected returns can lead to large swings in recommended allocation.
The second method focuses on risk budgeting. Instead of guessing returns, investors decide how much total portfolio risk they want crypto to contribute. This approach shifts the conversation from performance to tolerance. Still, Schwab cautions that crypto’s volatility can exceed expectations, even within a defined risk budget.
“There is no ‘correct’ allocation to cryptocurrencies, and we believe the decision is largely a personal one,” the report notes. Factors such as investment horizon, familiarity with digital assets, and capacity for loss all play a role.
The firm also stresses that crypto remains a speculative investment. “Cryptocurrencies and crypto-related products are not suitable for everyone,” Schwab writes, citing risks including illiquidity, theft, and fraud. It can offer diversification and the potential for higher returns, but it behaves more like a high-risk satellite holding than a core allocation, the report concluded.
Crypto World
Anthropic Hits $30 Billion Run Rate as Enterprise Demand and Compute Deals Reshape AI Race

TLDR:
- Anthropic’s annualized revenue jumped from $9B at end-2025 to over $30B by early April 2026, a near-vertical climb.
- Enterprise clients spending $1M+ annually doubled from 500 to 1,000 in under two months following the Series G raise.
- Anthropic secured multiple gigawatts of next-gen TPU capacity through a three-way deal with Google and Broadcom for 2027.
- Claude is now the only frontier AI model available across AWS Bedrock, Google Cloud Vertex AI, and Microsoft Azure Foundry.
Anthropic’s annualized revenue has crossed $30 billion in early April 2026, marking a dramatic acceleration from just $9 billion at the end of 2025.
The AI company has also secured a landmark compute agreement with Google and Broadcom for multiple gigawatts of next-generation TPU capacity.
Enterprise adoption of Claude has doubled in under two months. The company is now positioned as a critical infrastructure provider for some of the world’s largest corporations.
Enterprise Growth Drives Revenue Surge
Anthropic’s revenue growth has followed a nearly vertical trajectory over the past year. The company reported roughly $1 billion in annualized revenue in late 2024. That figure climbed to $9 billion by year-end 2025, then jumped to $14 billion just two months ago.
Today, the run rate stands above $30 billion before the second quarter has even begun. Earlier internal forecasts projected $18 billion for all of 2026, a target the company has already surpassed as a run rate.
When Anthropic closed its Series G round in February at a $380 billion valuation, it reported 500 business customers each spending over $1 million annually. That number has since doubled to more than 1,000 enterprise customers at the same spending threshold.
Eight of the Fortune 10 companies are currently running critical workloads on Claude. That level of penetration among the world’s most powerful corporations reflects growing institutional trust in the platform.
Compute Strategy Expands Across Platforms
Anthropic announced a new agreement with Google and Broadcom for multiple gigawatts of next-generation TPU capacity expected online starting in 2027. The company published a statement noting the deal represents its most substantial compute commitment to date.
Anthropic trains and runs Claude across AWS Trainium chips via Project Rainier, Google TPUs manufactured by Broadcom, and NVIDIA GPUs across multiple data centers.
Claude is currently the only frontier AI model available on all three of the largest cloud platforms — Amazon Web Services Bedrock, Google Cloud Vertex AI, and Microsoft Azure Foundry.
This multi-chip approach allows Anthropic to match workloads to the most suitable hardware, reducing bottlenecks and improving resilience. The strategy also protects against supply chain disruptions that have affected other AI providers.
Back in December, Broadcom’s CEO revealed that a mystery customer had placed a $10 billion custom chip order, later disclosed to be Anthropic.
That was followed almost immediately by another $11 billion order in the same quarter. Broadcom CEO Hock Tan has since projected close to $100 billion in AI chip revenue for 2027, with Anthropic cited as a primary driver.
Anthropic’s internal forecast for 2027 had called for $55 billion in annual revenue. Given the current growth rate, that projection no longer appears far-fetched.


Key takeaways
- Bitcoin is holding near $69K as Iran-related geopolitical tensions keep markets cautious.
- Rising oil prices and inflation concerns are limiting upside, but strong ETF inflows and institutional support are helping BTC stay resilient.
Bitcoin is trading sideways near the $69,000 mark as investors remain cautious amid escalating geopolitical tensions tied to the conflict in Iran.
The leading cryptocurrency briefly pushed above $70,000 on Monday—its first move past that level since March—but failed to sustain momentum.
Geopolitics dominate market sentiment
The ongoing situation in Iran continues to shape global risk appetite. U.S. President Donald Trump has warned of severe consequences if a deal to reopen the Strait of Hormuz is not reached by the Tuesday 20:00 ET deadline.
Iran has rejected a proposed 45-day ceasefire, instead calling for a permanent end to hostilities alongside the removal of sanctions.
For Bitcoin, this macro backdrop is significant—higher oil prices tend to support inflation, push Treasury yields higher, and reinforce expectations that the Federal Reserve will keep interest rates elevated for longer.
Despite the current situation, Bitcoin has held up better than some traditional markets. While it has not staged a breakout, its ability to maintain levels above $65,000 suggests underlying support from positioning and institutional demand.
Meanwhile, Gold has lost more than 10% of its value as investors scale back expectations for Federal Reserve rate cuts this year.
Flows into spot Bitcoin ETFs have been a key factor. After four consecutive months of outflows, March saw $1.2 billion in net inflows. Momentum has continued into April, with spot ETFs recording $471.3 million in inflows in a single day—the largest since February.
These inflows have helped keep Bitcoin’s price, although resistance near $76,000 continues to cap upside.
For Bitcoin to break higher, a clear catalyst is likely required. A confirmed ceasefire between the U.S. and Iran could be pivotal, particularly if it drives oil prices below $100 per barrel and alleviates inflation concerns.
Technical forecast: Bitcoin eyes the $70k resistance once again
The BTC/USD 4-hour chart remains bearish and efficient as Bitcoin continues to defend the $65,000 support level.
The price has recovered from this low and is testing resistance around 69k, the 50-day EMA, and the lower band of the rising channel.
The RSI of 61 on the 4-hour chart is above the neutral level, indicating a growing bullish bias. The MACD lines are also above the zero line, adding further confluence to the bullish narrative.
Buyers will need to rise above $69,000 to bring $74,000 into focus, the mid-point of the rising channel and the falling trendline resistance dating back to October’s $126,000 record high.

A surge above the $74,000 resistance level would allow BTC to test the March high of $76,000 in the near term.
However, failure to rally higher would see the bears push the price towards the $65,000 support level once again.
Key Highlights
-
XRP attracts record $119M, dominating weekly digital asset investment flows
-
Ethereum suffers continued decline with $52M withdrawal amid policy concerns
-
Bitcoin records $107M inflows while bearish positioning expands significantly
-
Swiss markets dominate global flows as American investor appetite weakens
-
Economic data triggers late-week reversal in cryptocurrency investment momentum
Cryptocurrency investment products attracted $224 million in fresh capital over the past week, representing a short-lived bounce following previous withdrawals. However, macroeconomic headwinds dampened enthusiasm as the week concluded. XRP emerged as the clear winner while Ethereum’s outflow streak extended.
XRP Commands Investment Flows with Record Weekly Performance
[[LINK_START_0]]XRP[[LINK_END_0]] captured the lion’s share of investment activity, pulling in $119.6 million during the week. This represented the digital asset’s most impressive showing since late December 2025. The momentum persisted even as broader cryptocurrency markets displayed vulnerability. Year-to-date, XRP has accumulated $159 million in net inflows.
The impressive performance followed sustained investor interest after the introduction of spot XRP exchange-traded products in American markets. These investment vehicles enhanced accessibility and facilitated continuous capital movement into the asset. Consequently, XRP now represents approximately seven percent of aggregate assets managed across cryptocurrency funds.
European financial centers played a significant role in driving XRP’s success. Switzerland emerged as the top contributor with more than $157 million in capital inflows, while Germany and Canada also participated strongly. This geographic distribution indicated evolving capital deployment strategies across international cryptocurrency markets.
Bitcoin Displays Conflicting Trends as Investor Sentiment Splits
Bitcoin attracted $107.3 million in new investments, demonstrating modest revival following earlier capital withdrawals. However, monthly performance remained in negative territory, with cumulative outflows reaching $145 million. This divergence underscored persistent indecision regarding the asset’s trajectory.
Inverse bitcoin products drew $16 million in capital, revealing heightened pessimistic positioning among certain market participants. Simultaneously, American spot bitcoin exchange-traded funds contributed minimally to overall flows. These contradictory indicators exposed a fundamental divide in investor outlook.
Meanwhile, Solana accumulated $34.9 million in inflows, extending its positive momentum throughout the current year. Its aggregate inflows now constitute roughly ten percent of total managed assets. This reliable performance reinforced broader portfolio diversification trends within digital asset investment products.
Ethereum Suffers Substantial Withdrawals Amid Legislative Uncertainty
Ethereum maintained its negative trajectory, experiencing $52.8 million in weekly capital flight. This followed an even larger $222 million exodus the preceding week. The asset’s year-to-date outflows have now reached $327 million.
Legislative ambiguity surrounding the Digital Asset Market Clarity Act continued exerting downward pressure on Ethereum-focused investment vehicles. The proposed legislation remained gridlocked in the Senate due to disputes regarding stablecoin yield components. This impasse negatively impacted sentiment toward Ethereum’s ecosystem positioning.
Ethereum’s fundamental importance to stablecoin infrastructure heightened its vulnerability to regulatory developments. This strategic exposure amplified pressure on capital movements during periods of policy ambiguity. Ethereum stood out as the poorest performer among leading cryptocurrency assets.
Broader economic conditions also shaped overall investment product activity throughout the period. Robust American retail sales figures reinforced projections of continued restrictive monetary policy. This evolution diminished risk tolerance and prompted modest withdrawals as the week closed.
Simultaneously, rising crude oil valuations and receding interest rate reduction expectations intensified market headwinds. These dynamics interrupted early-week positive momentum across digital asset investment vehicles. Ultimately, the weekly recovery proved incomplete and varied substantially across geographic regions and individual assets.

Ether treasury companies may need to use liquid staking and other active yield strategies if they want to offer investors something beyond the staking rewards already available through listed Ether products, Kean Gilbert, head of institutional relations at Lido, told Cointelegraph at ETHCC 2026.
Liquid staking lets Ether (ETH) holders stake their tokens while receiving a transferable token that can still be deployed elsewhere in decentralized finance (DeFi).
Gilbert said strategies such as posting ETH as collateral and borrowing against it could help treasury companies generate higher returns than passive staking products.
US-listed staked ETH products now include the REX-Osprey ETH + Staking ETF, launched in September 2025, Grayscale’s Ethereum Staking ETF and Ethereum Staking Mini ETF, and BlackRock’s iShares Staked Ethereum Trust ETF, introduced on March 12.
Issuer disclosures show different staking economics across Ether products, making direct yield comparisons difficult. Grayscale’s ETHE page showed 2.26% net staking rewards as of April 6, while Grayscale’s ETH page showed 2.56% as of April 2. Native ETH staking was yielding about 2.72% annually, according to Staking Rewards.
Related: Bitmine paper loss nears $8.8B as Ether slump tests cyclical thesis
Still, Jimmy Xue, co-founder and chief operating officer of quantitative yield platform Axis, said Ether treasury companies do not necessarily need to beat staked Ether products on headline yield because they are different investment vehicles.
“A staked ETH ETF is a passive vehicle. A DAT trading at a meaningful mNAV premium is promising something a passive ETF structurally cannot deliver, which is active, dynamic deployment of spot inventory across opportunities as they arise.”
“The mNAV premium investors pay reflects confidence in management’s ability to put that treasury to work,” Xue said, adding that basis trading is a major yield source for treasury companies.

Public filings show liquid staking adoption
Public disclosures show several Ether treasury firms using staking or liquid-staking-related strategies, though the level of detail varies by company.
Sharplink Gaming, the second-largest corporate Ether holder, has generated 14,516 ETH (around $30.8 million) in staking rewards as of March. It derived 33% of these rewards from liquid staking and 66% from native staking, according to a March 1 filing with the US Securities and Exchange Commission.
Sharplink reported a $734 million net loss for 2025, largely driven by the sharp crypto market downturn in the second half of the year.

BTCS Inc., the 10th-largest Ether treasury company by returns, has also staked a part of its Ether holdings through the liquid staking protocol Rocket Pool. Out of its total 29,122 ETH holdings, the company has liquid staked 4,160 ETH ($8.8 million) through Rocket Pool nodes, according to a July 2025 SEC filing.
Cointelegraph has approached BitMine, SharpLink and The Ether Machine for comment on the role of liquid staking in their strategies.
Magazine: Sharplink exec shocked by level of BTC and ETH ETF hodling — Joseph Chalom

Phone logs obtained by federal prosecutors in Argentina show seven calls between President Javier Milei and entrepreneur Mauricio Novelli – one of the architects of the LIBRA crypto token, on the same night in February 2025 that Milei posted the now-infamous promotion on X, directly contradicting Milei’s public claim of no connection to the coin’s launch.
Recovered notes from Novelli’s phone outline a $5 million deal structure tied to Milei’s official endorsements, including payments contingent on Milei naming Hayden Davis of Kelsier Ventures as a cryptocurrency advisor.
The documents place Milei inside the deal’s mechanics, not outside them.
- The Core Evidence: Argentine federal prosecutors have obtained phone logs showing seven calls between Milei and Novelli before and after his February 14, 2025, X post promoting $LIBRA at 7:01 pm local time.
- The Financial Trail: A deleted note recovered from Novelli’s phone describes a $5 million arrangement with an individual identified as “H” – likely Davis – including $1.5 million upon Milei announcing Davis as a crypto advisor.
- The Scale of Losses: An estimated 114,410 wallets lost funds in the $LIBRA collapse, with total investor losses ranging from $251 million to $400 million; only 36 wallets cleared more than $1 million in profit.
- Milei’s Legal Status: Milei is named as a person of interest in the ongoing federal probe but has not been formally charged; he has not publicly responded to the call logs or recovered documents.
- Obstruction Signal: Milei dissolved Argentina’s Investigation Task Unit (UTI) via Decree 332/2025 in May 2025 – after the UTI had forwarded insider trading findings to prosecutors.
- What to Watch: Argentina’s Chamber of Deputies begins questioning government officials on April 8, 2026; any move toward formal charges or new forensic disclosures from that session will be the next inflection point in this investigation.
Discover: The Best Crypto Presales Live Right Now
What the Phone Logs Actually Show – and Why Milei “No Connection” Defense No Longer Holds
Milei posted about LIBRA crypto at 7:01 pm Argentina time on February 14, 2025. The seven documented calls to Novelli occurred in the hours immediately before and after that post – a timeline that prosecutors are now treating as evidence of coordination, not coincidence.
The contents of the calls remain unknown, but the pattern of contact alone is legally significant: it establishes proximity between Milei and the token’s operators at the precise moment of maximum promotional impact.
The recovered deleted note from Novelli’s phone goes further. Forensic analysis of the document – dated October-November 2024 – describes a three-tranche payment structure: $1.5 million upfront to “H,” $1.5 million upon Milei’s public announcement of Davis as an advisor, and $2 million in blockchain and AI advisory contracts involving both Milei and his sister Karina Elizabeth Milei.

Milei met Davis at Casa Rosada on January 30, 2025, posting a selfie on X that same day and describing him as a cryptocurrency advisor – the precise trigger for the second $1.5 million tranche outlined in Novelli’s note.
Computer experts confirmed that the 44-character $LIBRA contract code Milei included in his February promotional post was not publicly available online prior to the post, meaning Milei had access to insider technical data before the token launched publicly.
WhatsApp audio messages reviewed as part of the investigation also reference recurring payments made to Milei during his time as a congressman, with specific sums reportedly allocated to Karina Milei as well.
Novelli allegedly brokered regulatory favors in exchange, including tax exemptions, suggesting the financial relationship predates the $LIBRA launch by years. Milei’s dissolution of the UTI via Decree 332/2025 in May 2025, after that body had already forwarded insider trading findings to prosecutors, adds an obstruction dimension that investigators are unlikely to set aside.
Explore: The Best Pre-Launch Token Sales With Asymmetric Upside Potential
The post New Evidence Emerges in Argentina President Milei’s Libra Token Probe appeared first on Cryptonews.

This NAS drive helped me get control of my spiralling subscription costs

Solana Expands Security Framework After Major DeFi Breach
“Charlie's Angels” star Cheryl Ladd reveals she 'was bald' after 'aggressive' breast cancer: 'A humbling experience'


-

 NewsBeat5 days ago
Steven Gerrard disagrees with Gary Neville over ‘shock’ Chelsea and Arsenal claim | Football
-

 Business5 days ago
No Jackpot Winner and $194 Million Prize Rolls Over
-

 Fashion4 days ago
Weekend Open Thread: Spanx – Corporette.com
-

 Crypto World6 days ago
Gold Price Prediction: Worst Month in 17 Years fo Save Haven Rock
-

 Business2 days ago
Three Gulf funds agree to back Paramount’s $81 billion takeover of Warner, WSJ reports
-

 Business3 days ago
Expert Picks for Every Need
-

 Sports3 days ago
India men’s 4x400m and mixed 4x100m relay teams register big progress | Other Sports News
-

 Business6 days ago
Login and Checkout Issues Spark Merchant Frustration
-

 Sports7 days ago
Tallest college basketball player ever, standing at 7-foot-9, entering transfer portal
-

 Crypto World7 days ago
Bitcoin enters the public bond market as Moody’s gives a first-of-its-kind crypto deal a rating
-
Crypto World7 days ago
Bitcoin stalls below key resistance as technical signals skew bearish
-

 Tech5 days ago
Commonwealth Fusion Systems leans on magnets for near-term revenue
-
Business2 days ago
No Jackpot Winner, Prize to Climb to $231 Million
-

 Politics7 days ago
Starmer’s centre has collapsed, and the left was right all along
-

 Crypto World6 days ago
Ripple rolls out enterprise crypto treasury platform for corporates
-

 Fashion1 day ago
Massimo Dutti Offers Inspiration for Your Summer Mood Board
-
Crypto World7 days ago
AI Memory Rout Wipes 9% Off Nvidia Stock: Chart Says More Pain Ahead
-

 Crypto World6 days ago
Why It’s Partnering, Not Issuing
-
 Sports7 days ago
How to teach yourself the perfect impact position with every club
-
 Sports6 days ago
Steal Gary Woodland’s subtle power move for longer drives
You must be logged in to post a comment Login