

Crypto World
Ethereum Price Prediction March 2026: Bearish, But With Hope
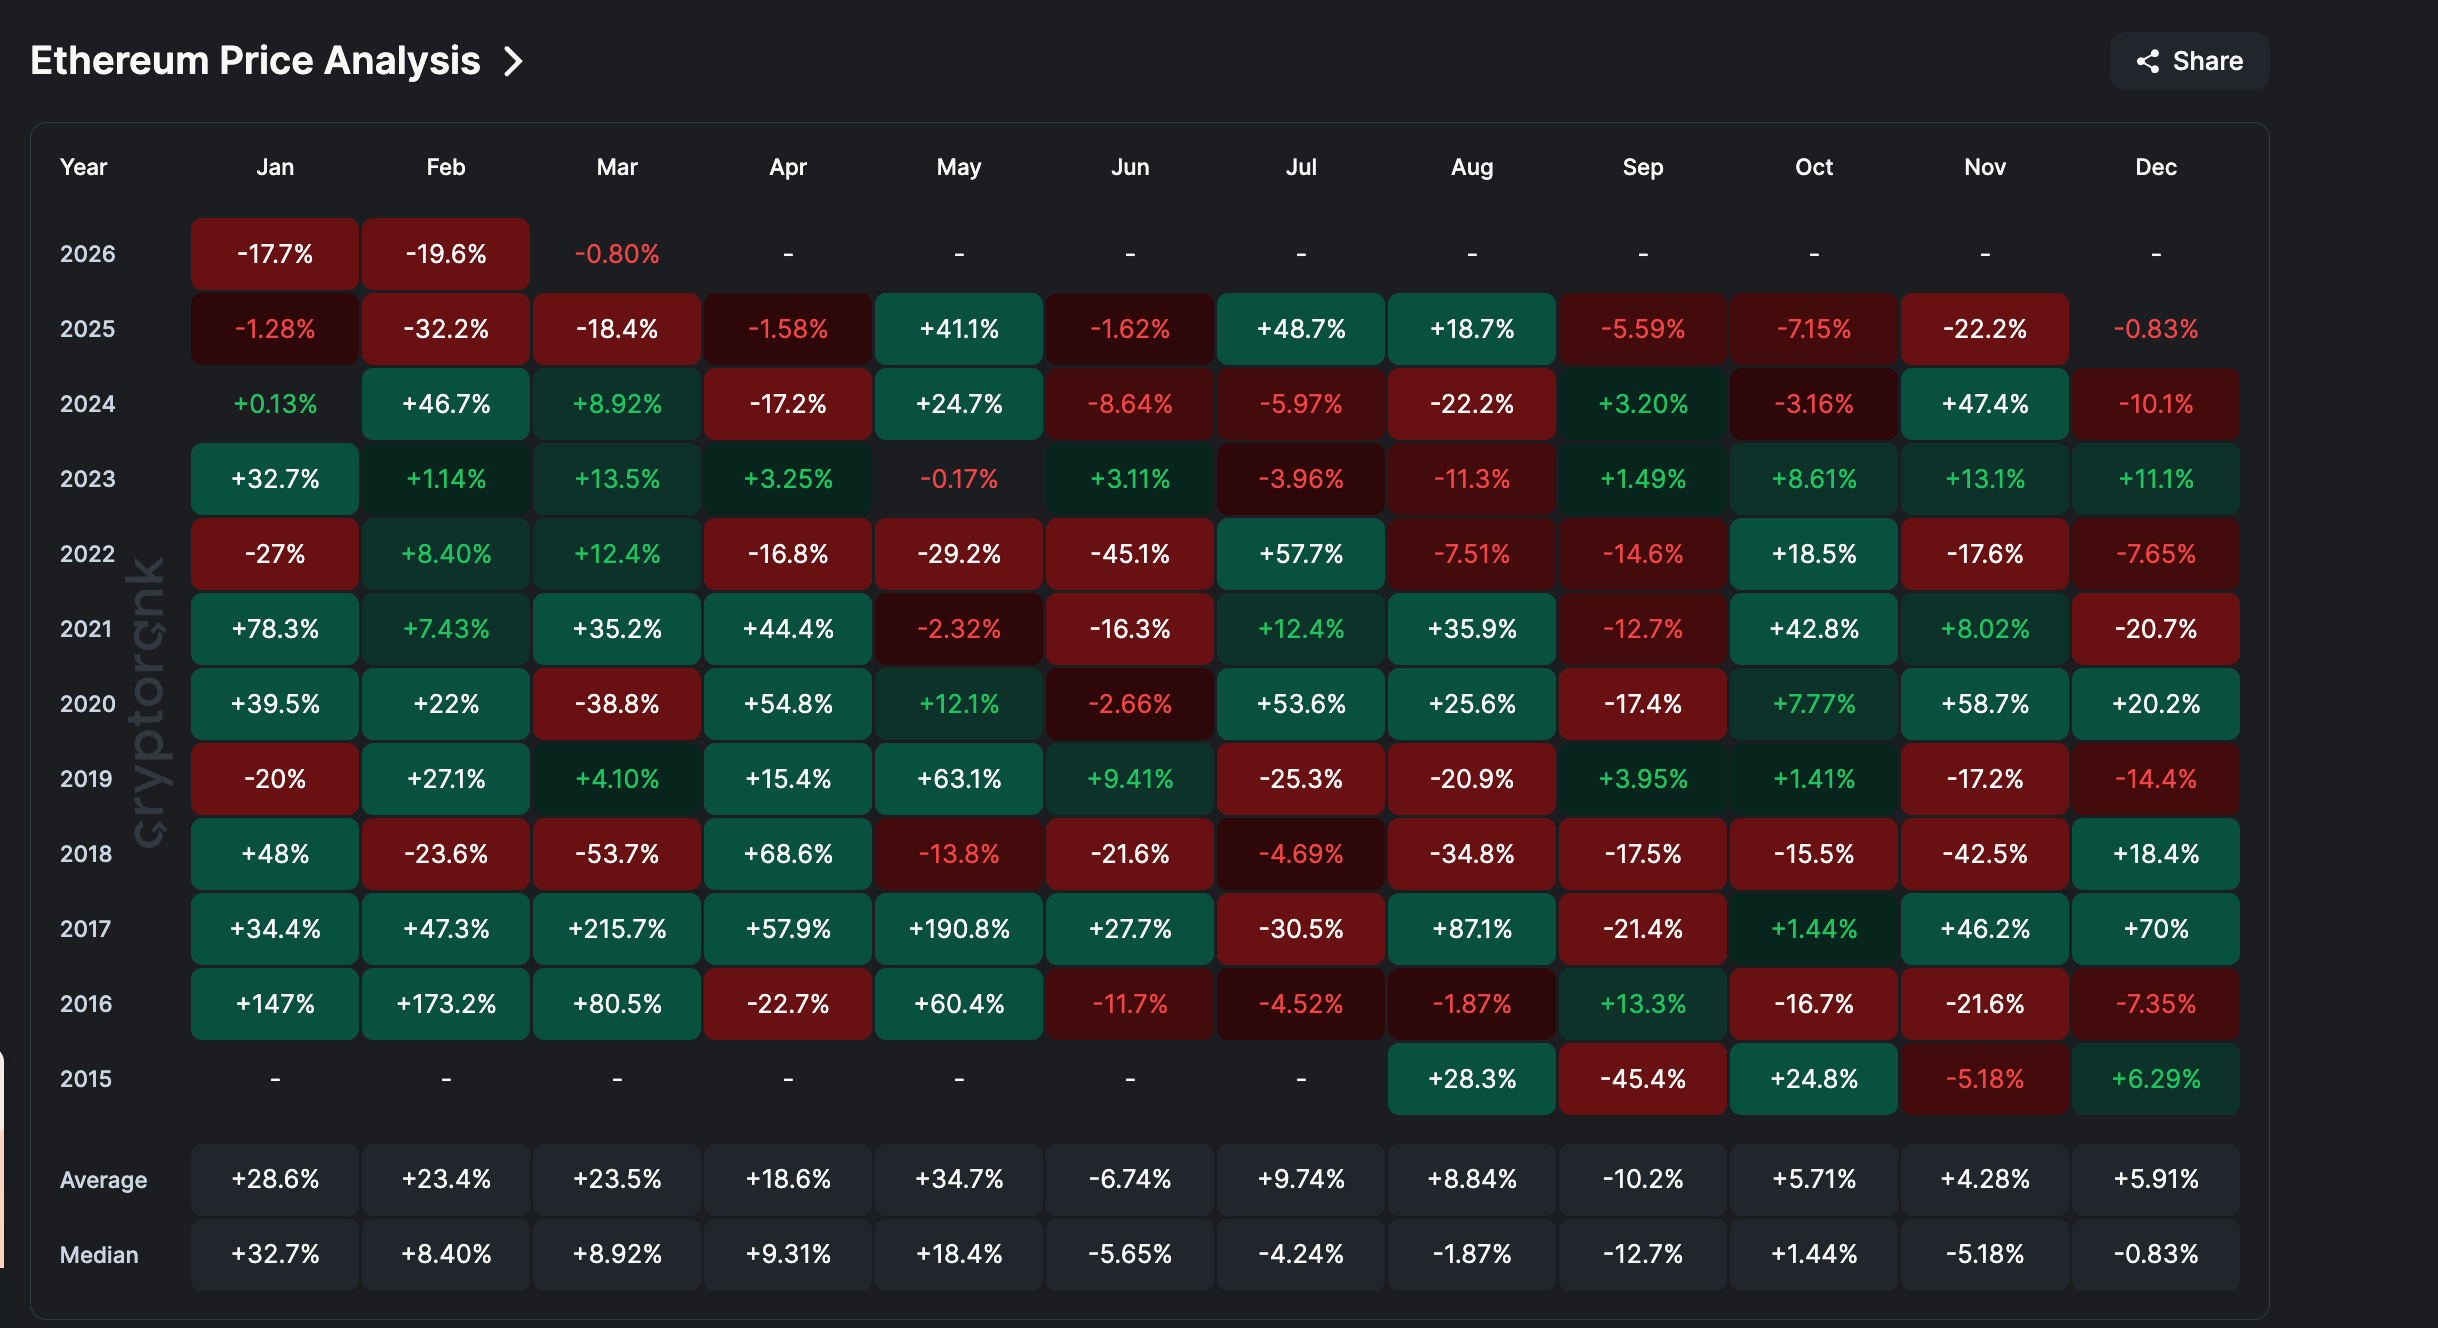
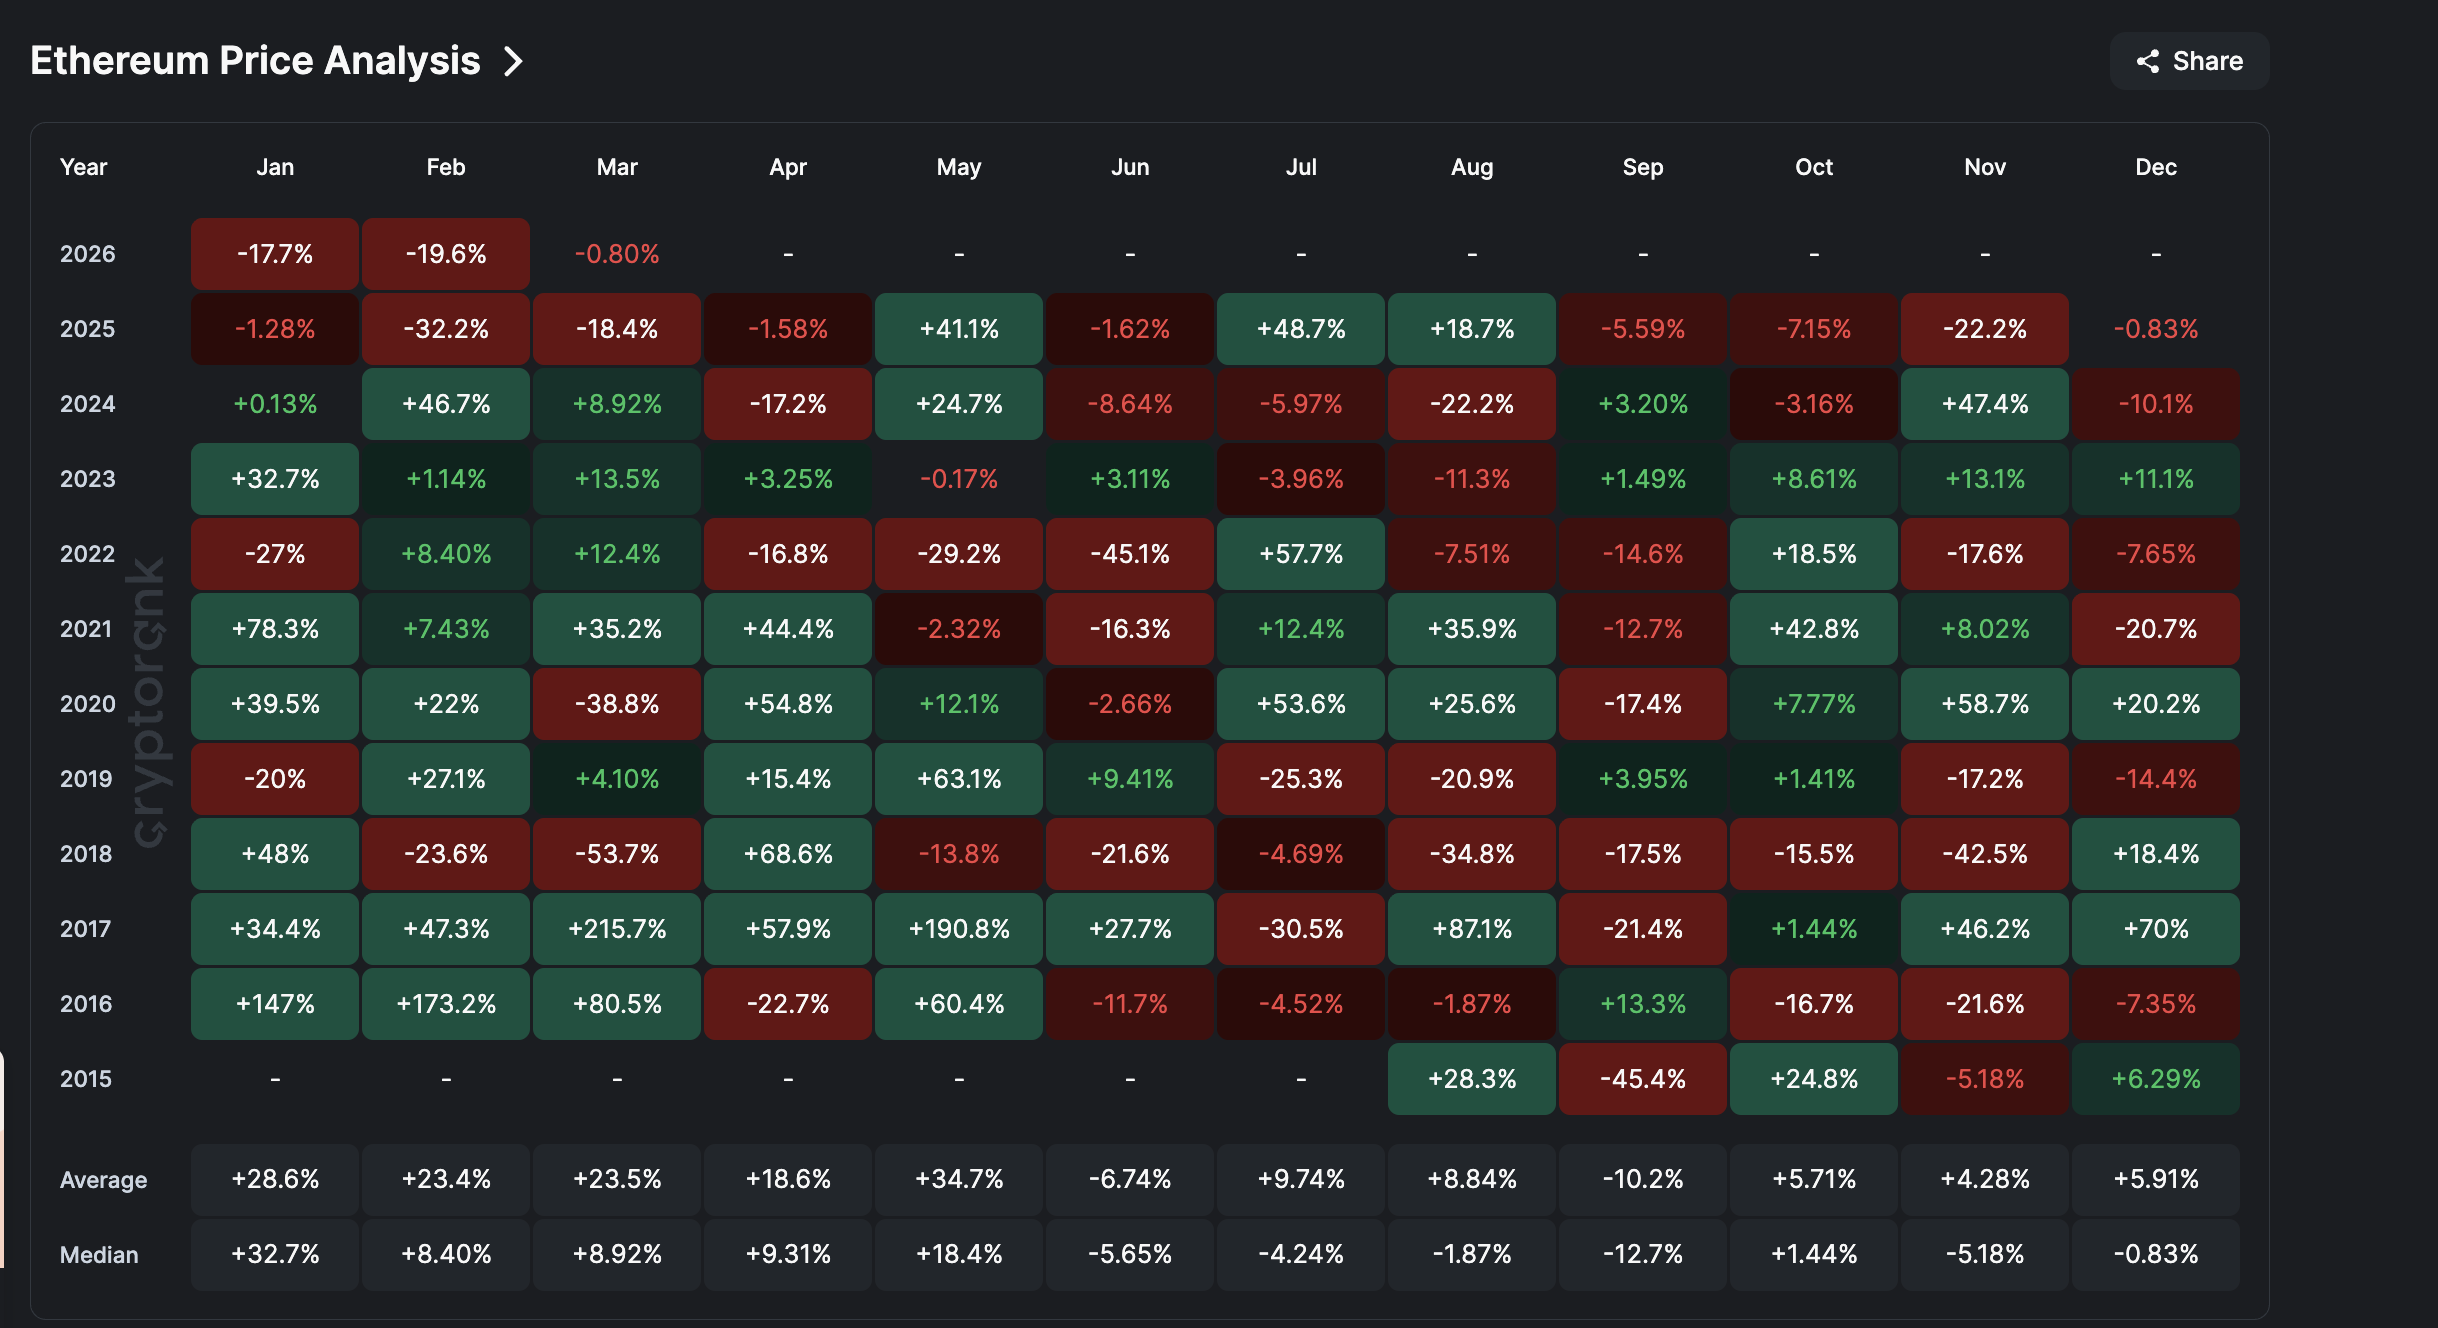
The Ethereum price enters March after a brutal February that delivered close to 20% losses. ETH has now posted six consecutive red months starting from September 2025, a streak unprecedented in the token’s history. If March finishes in the red, it would extend to seven months, further cementing this as the longest sustained decline Ethereum has ever seen.
While March historically carries a median return of nearly 9% for ETH, the current setup suggests history may offer little guidance. Here is what the data shows.
The Weekly Chart Has Already Broken Down
Even February 2025, which saw a 32% decline, immediately saw a recovery attempt over the next few months. This time, the selling has been relentless, and the weekly chart explains why. Six straight months of red, excluding March (just formed), is no mean bearish feat.
Want more token insights like this? Sign up for Editor Harsh Notariya’s Daily Crypto Newsletter here.
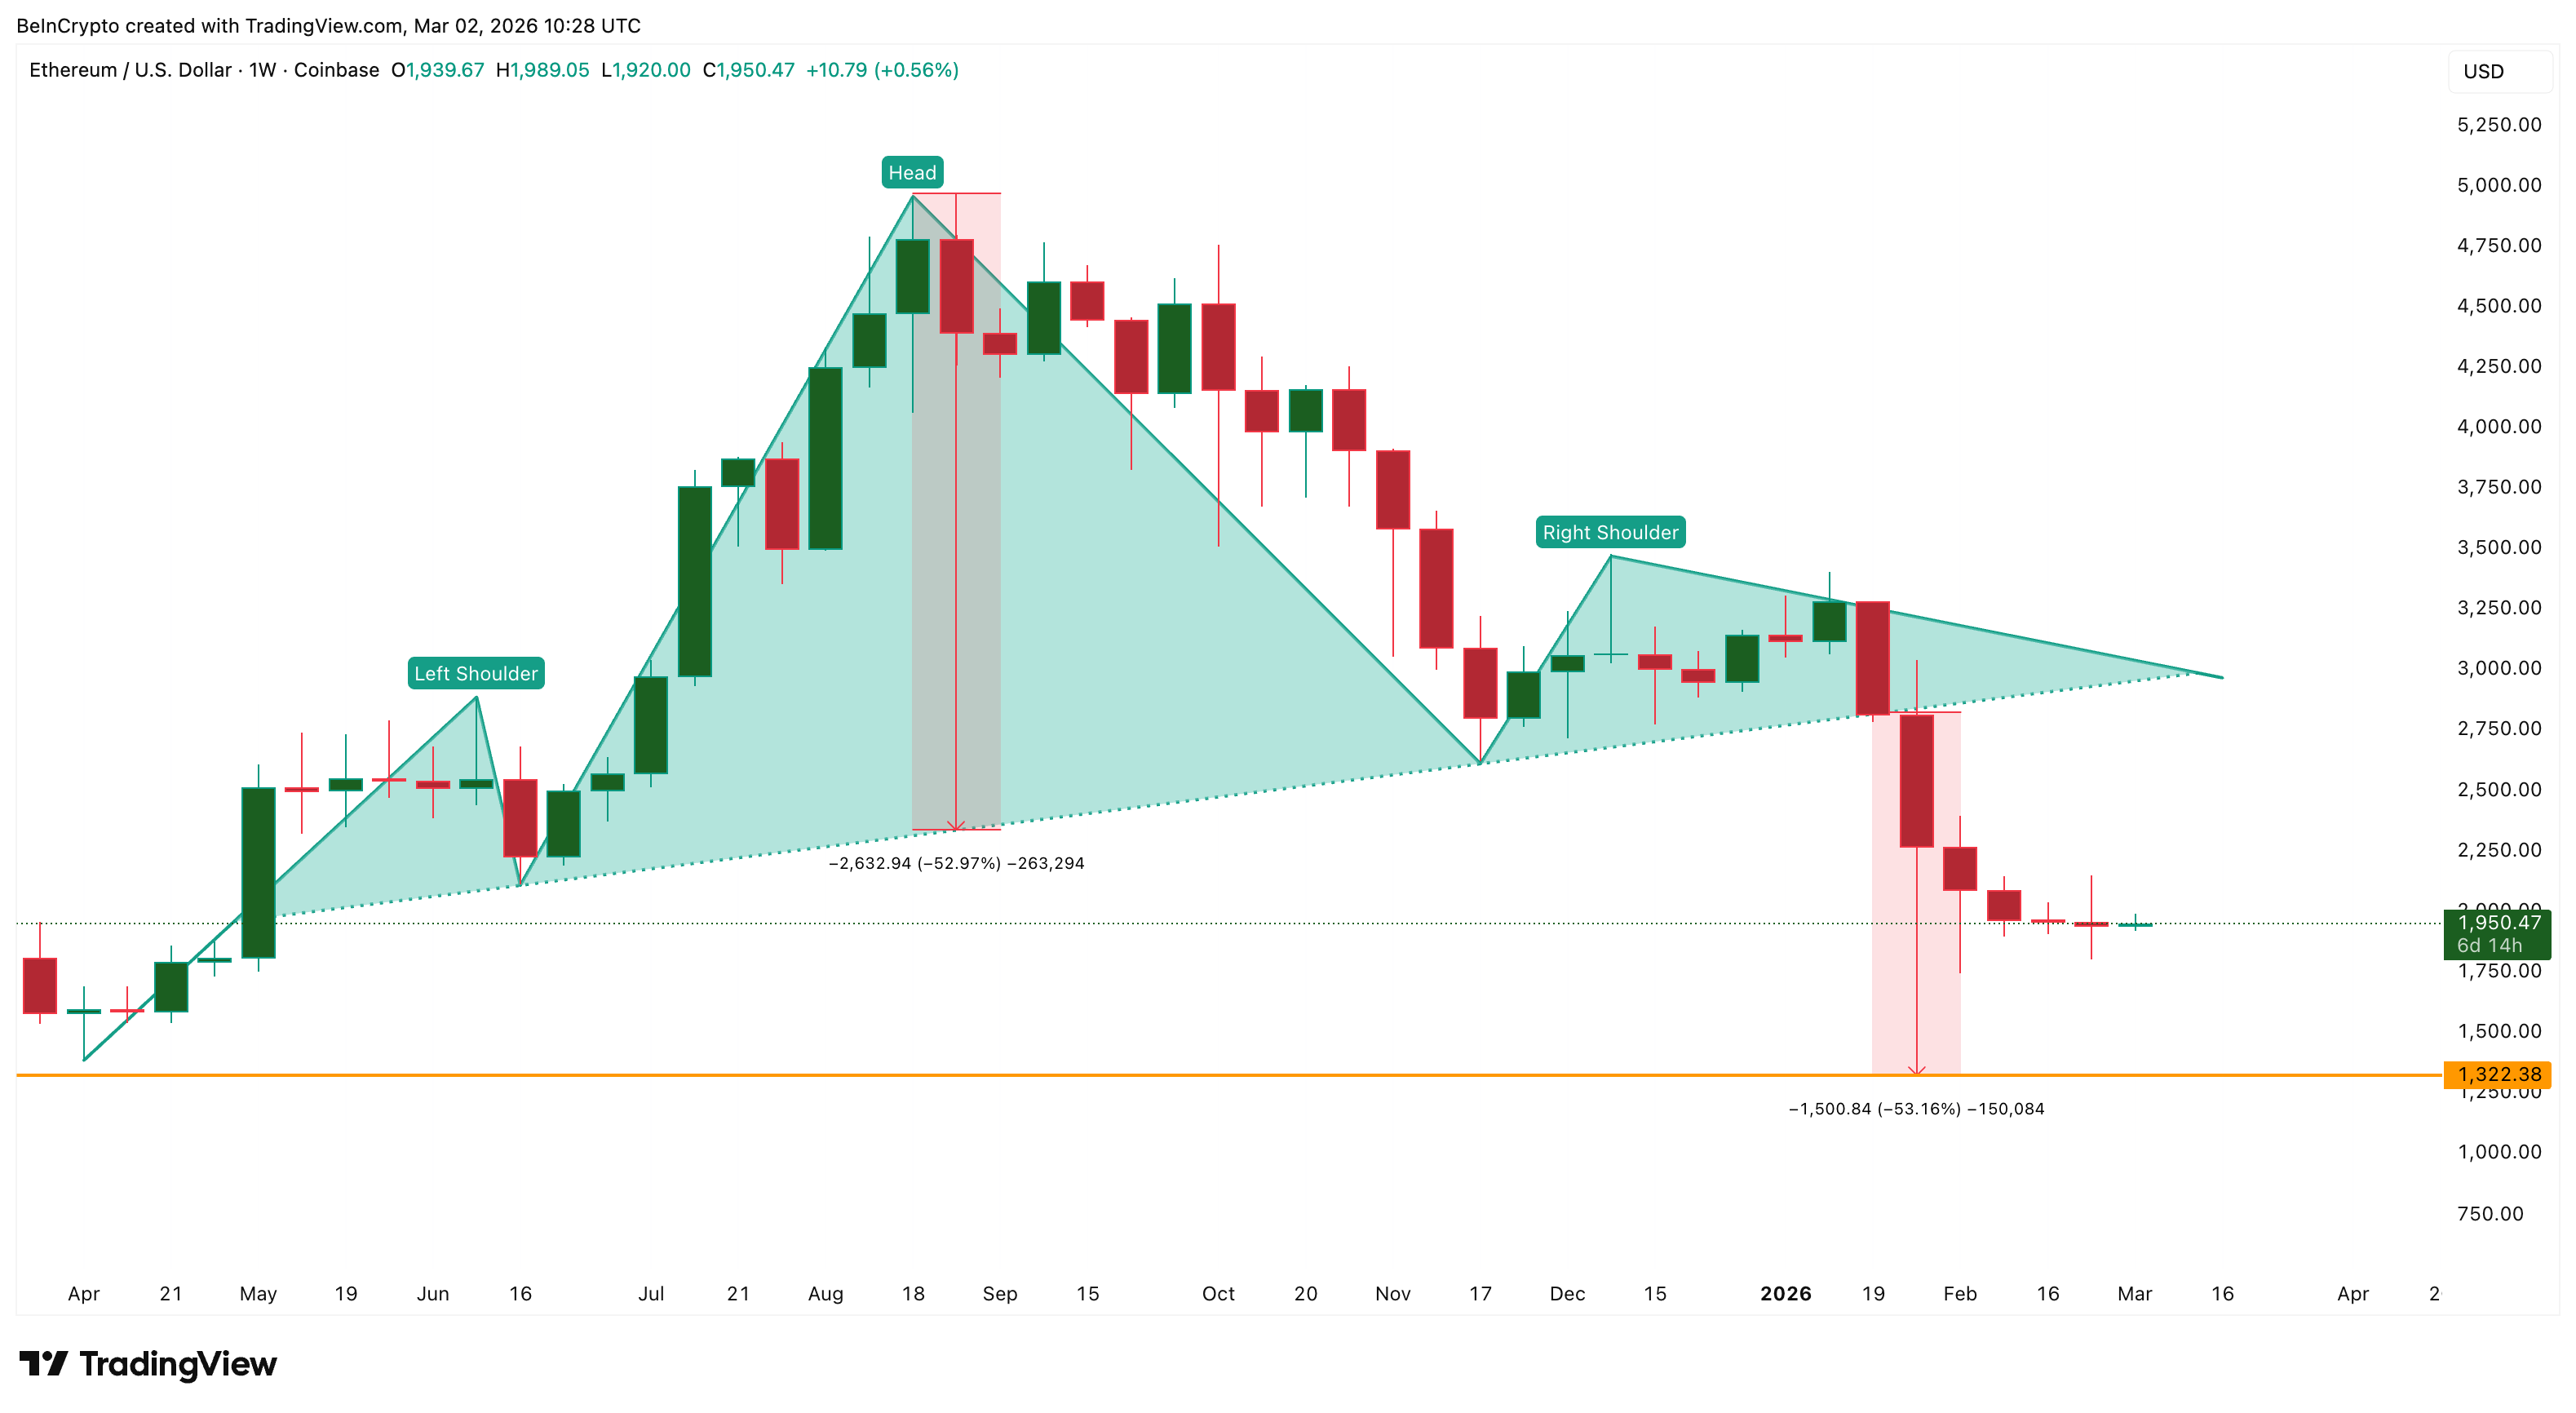
Since April 7, 2025, the Ethereum price has been trading within a head-and-shoulders pattern. It is a bearish reversal structure in which a central peak (the head) is flanked by two lower peaks (the shoulders). The breakdown confirmed in early January 2026, and it was not a minor dip. It was a structural break.
The measured move from this pattern projects a roughly 53% decline from the breakdown line, targeting approximately $1,320. While that level has not yet been reached, the pattern remains active and unresolved.
Making matters worse, two additional bearish crossovers are forming on the weekly Exponential Moving Averages (EMAs), which smooth price data to highlight trend direction.
The 50-period EMA is closing in on the 100-period EMA, and the 20-period EMA is approaching the 200-period EMA. The last confirmed crossover — when the 20 EMA crossed below the 50 EMA in early January — preceded a 46% correction.
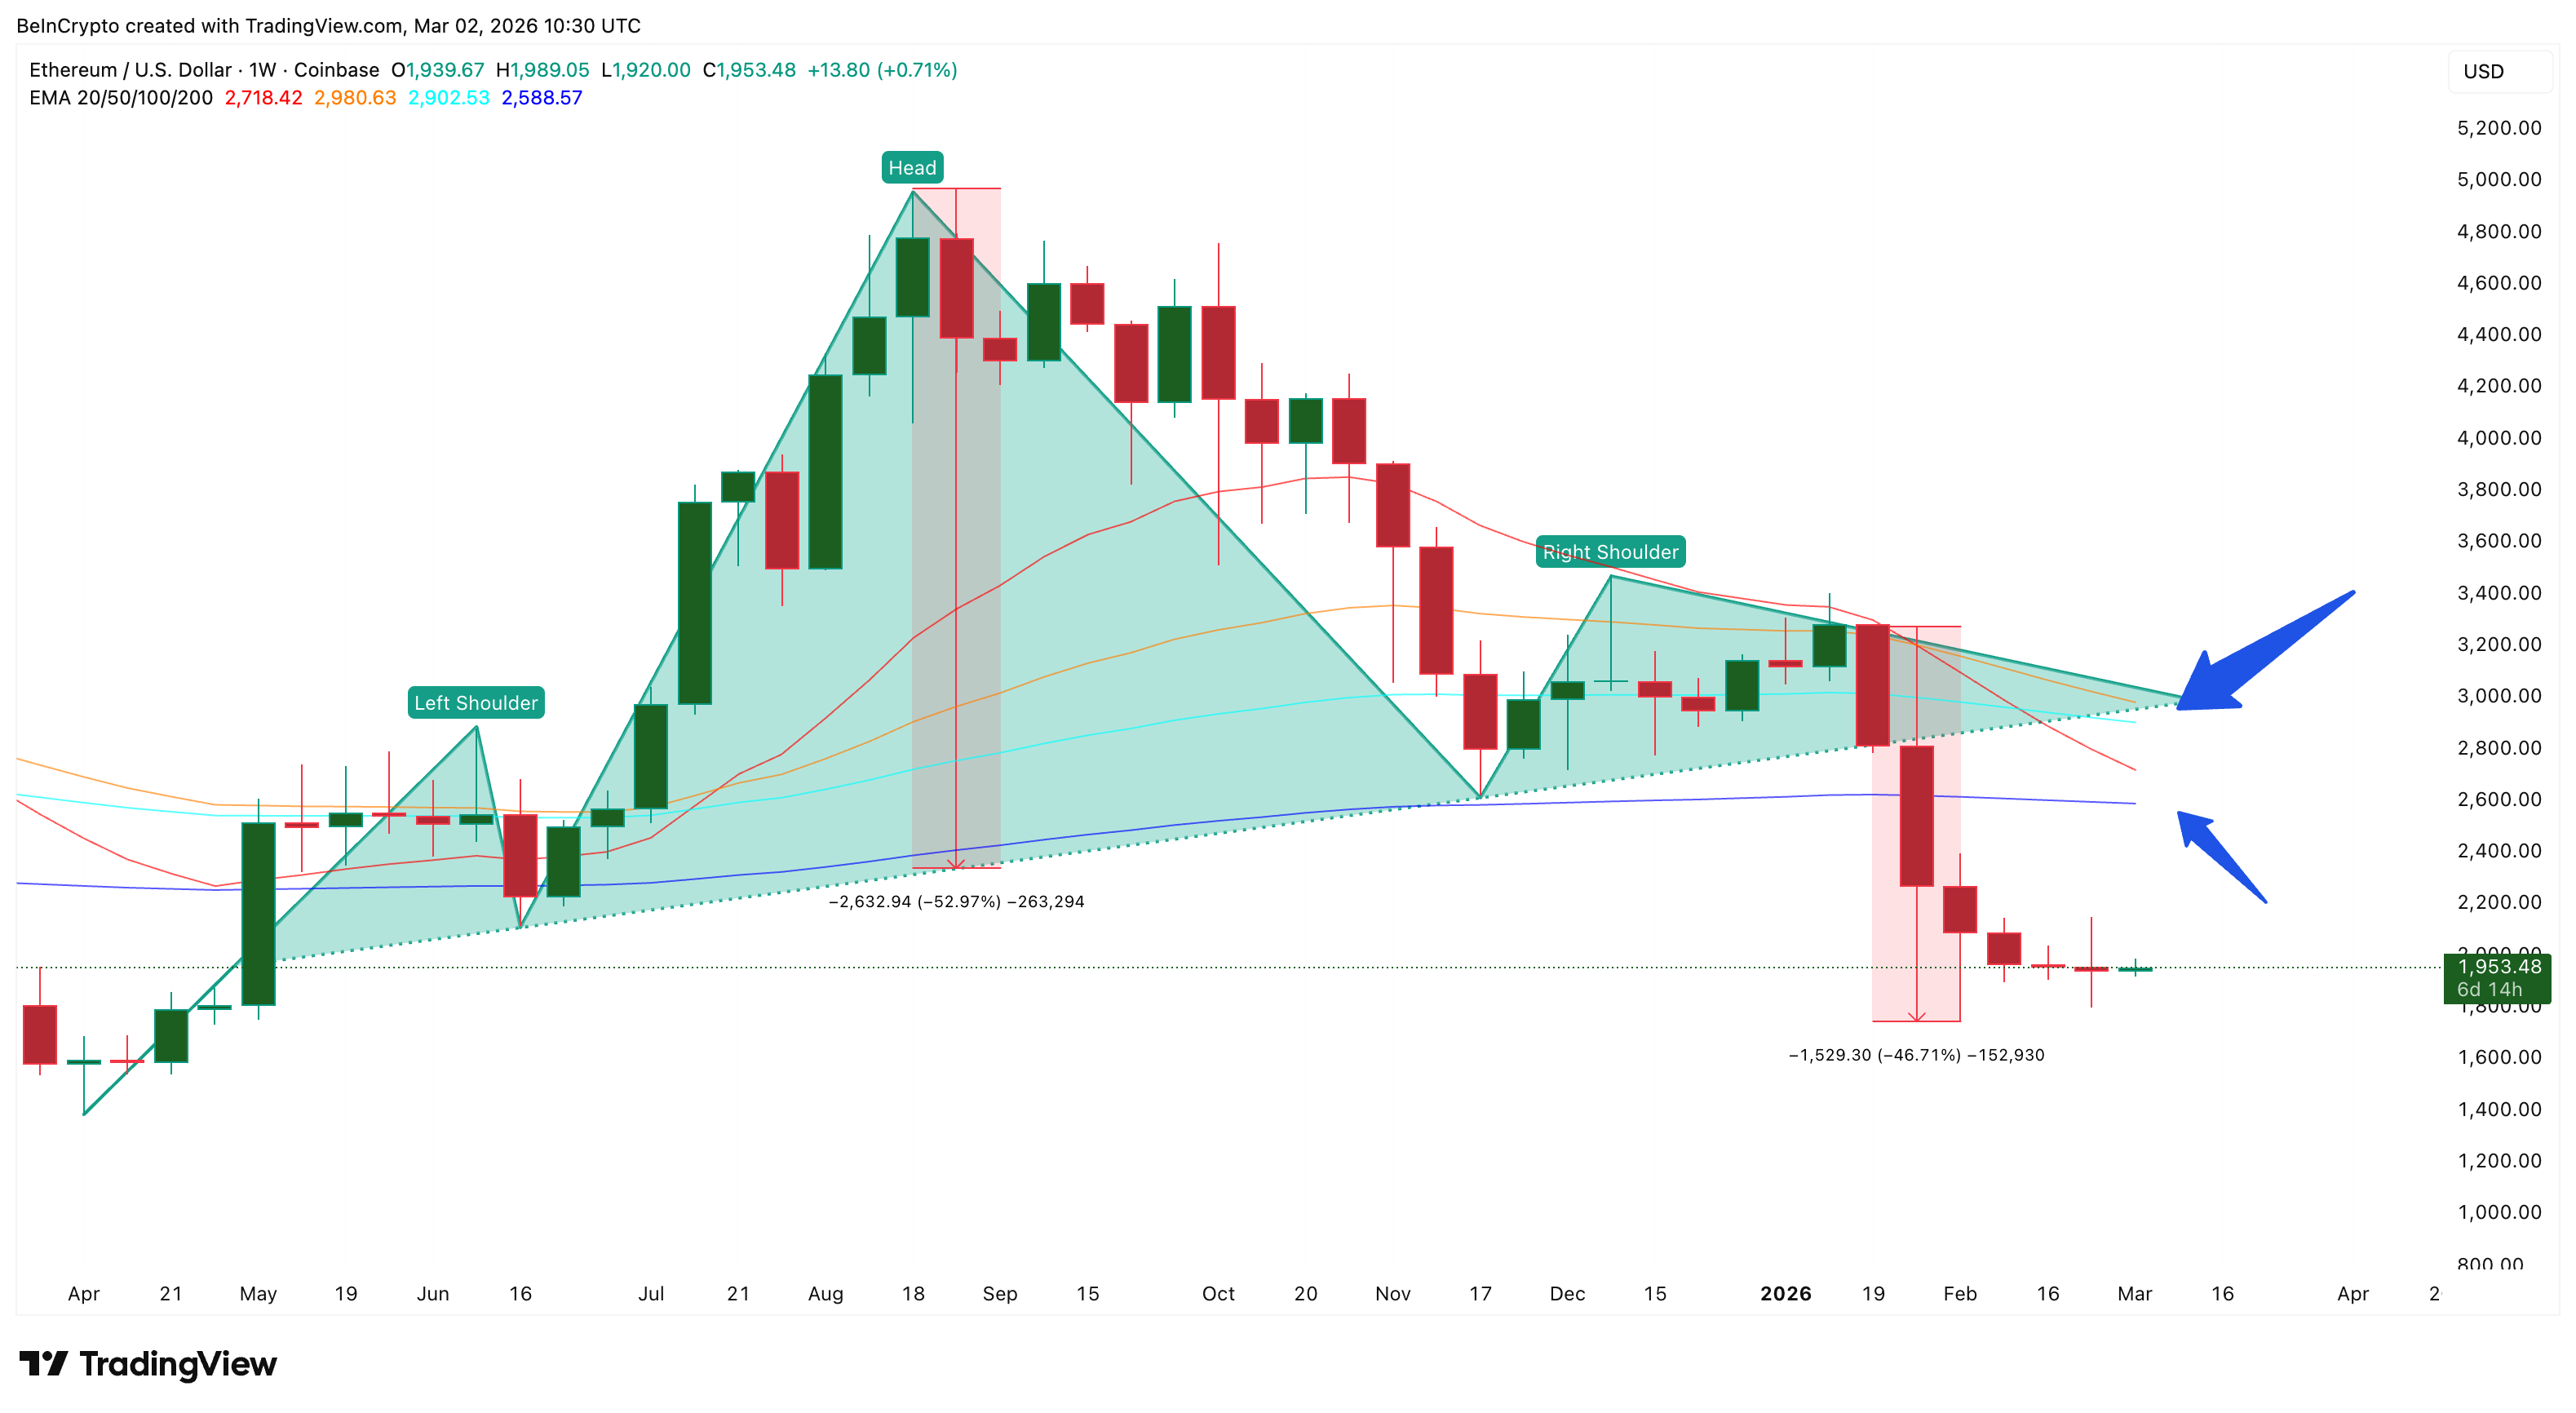
If these new crossovers confirm, they would reinforce the bearish trend on the higher timeframe.
Ethereum ETF Outflows Offer No Institutional Floor
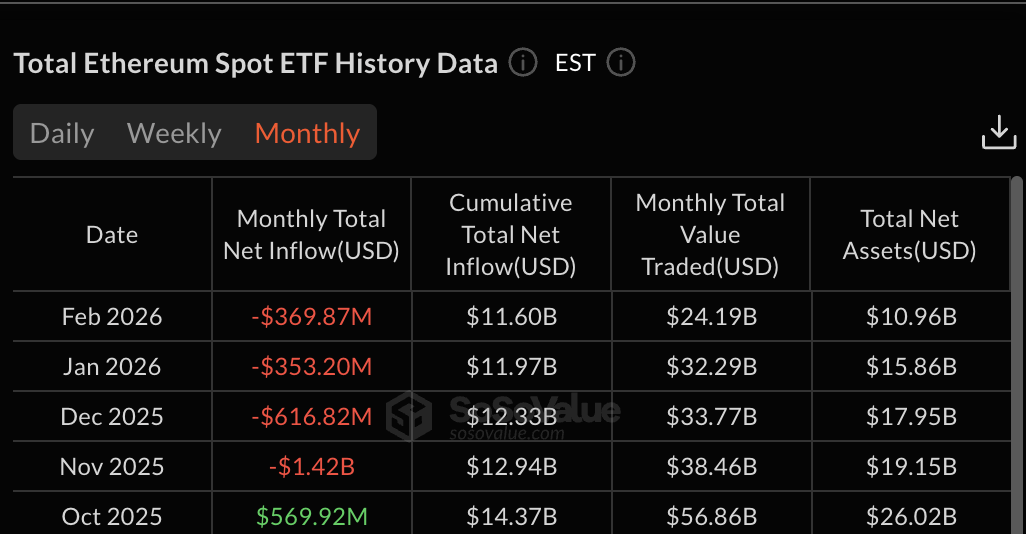
Unlike Bitcoin, where spot ETF outflows have been steadily declining, Ethereum’s ETF picture is deteriorating. February recorded $369.87 million in net outflows — higher than January’s $353.20 million. This reversed the improving trend that had briefly offered hope when January’s outflows shrank compared to December’s $616.82 million.
This marks four consecutive months of outflows since November 2025, when $1.42 billion exited. The last positive inflow month was October 2025 at $569.92 million.
For the Ethereum price, this means there is no institutional demand floor forming heading into March. The capital that once supported ETH through ETF channels is withdrawing, and unlike Bitcoin, the bleeding is not slowing down.
HODLers Are Buying, But The Plot Thickens
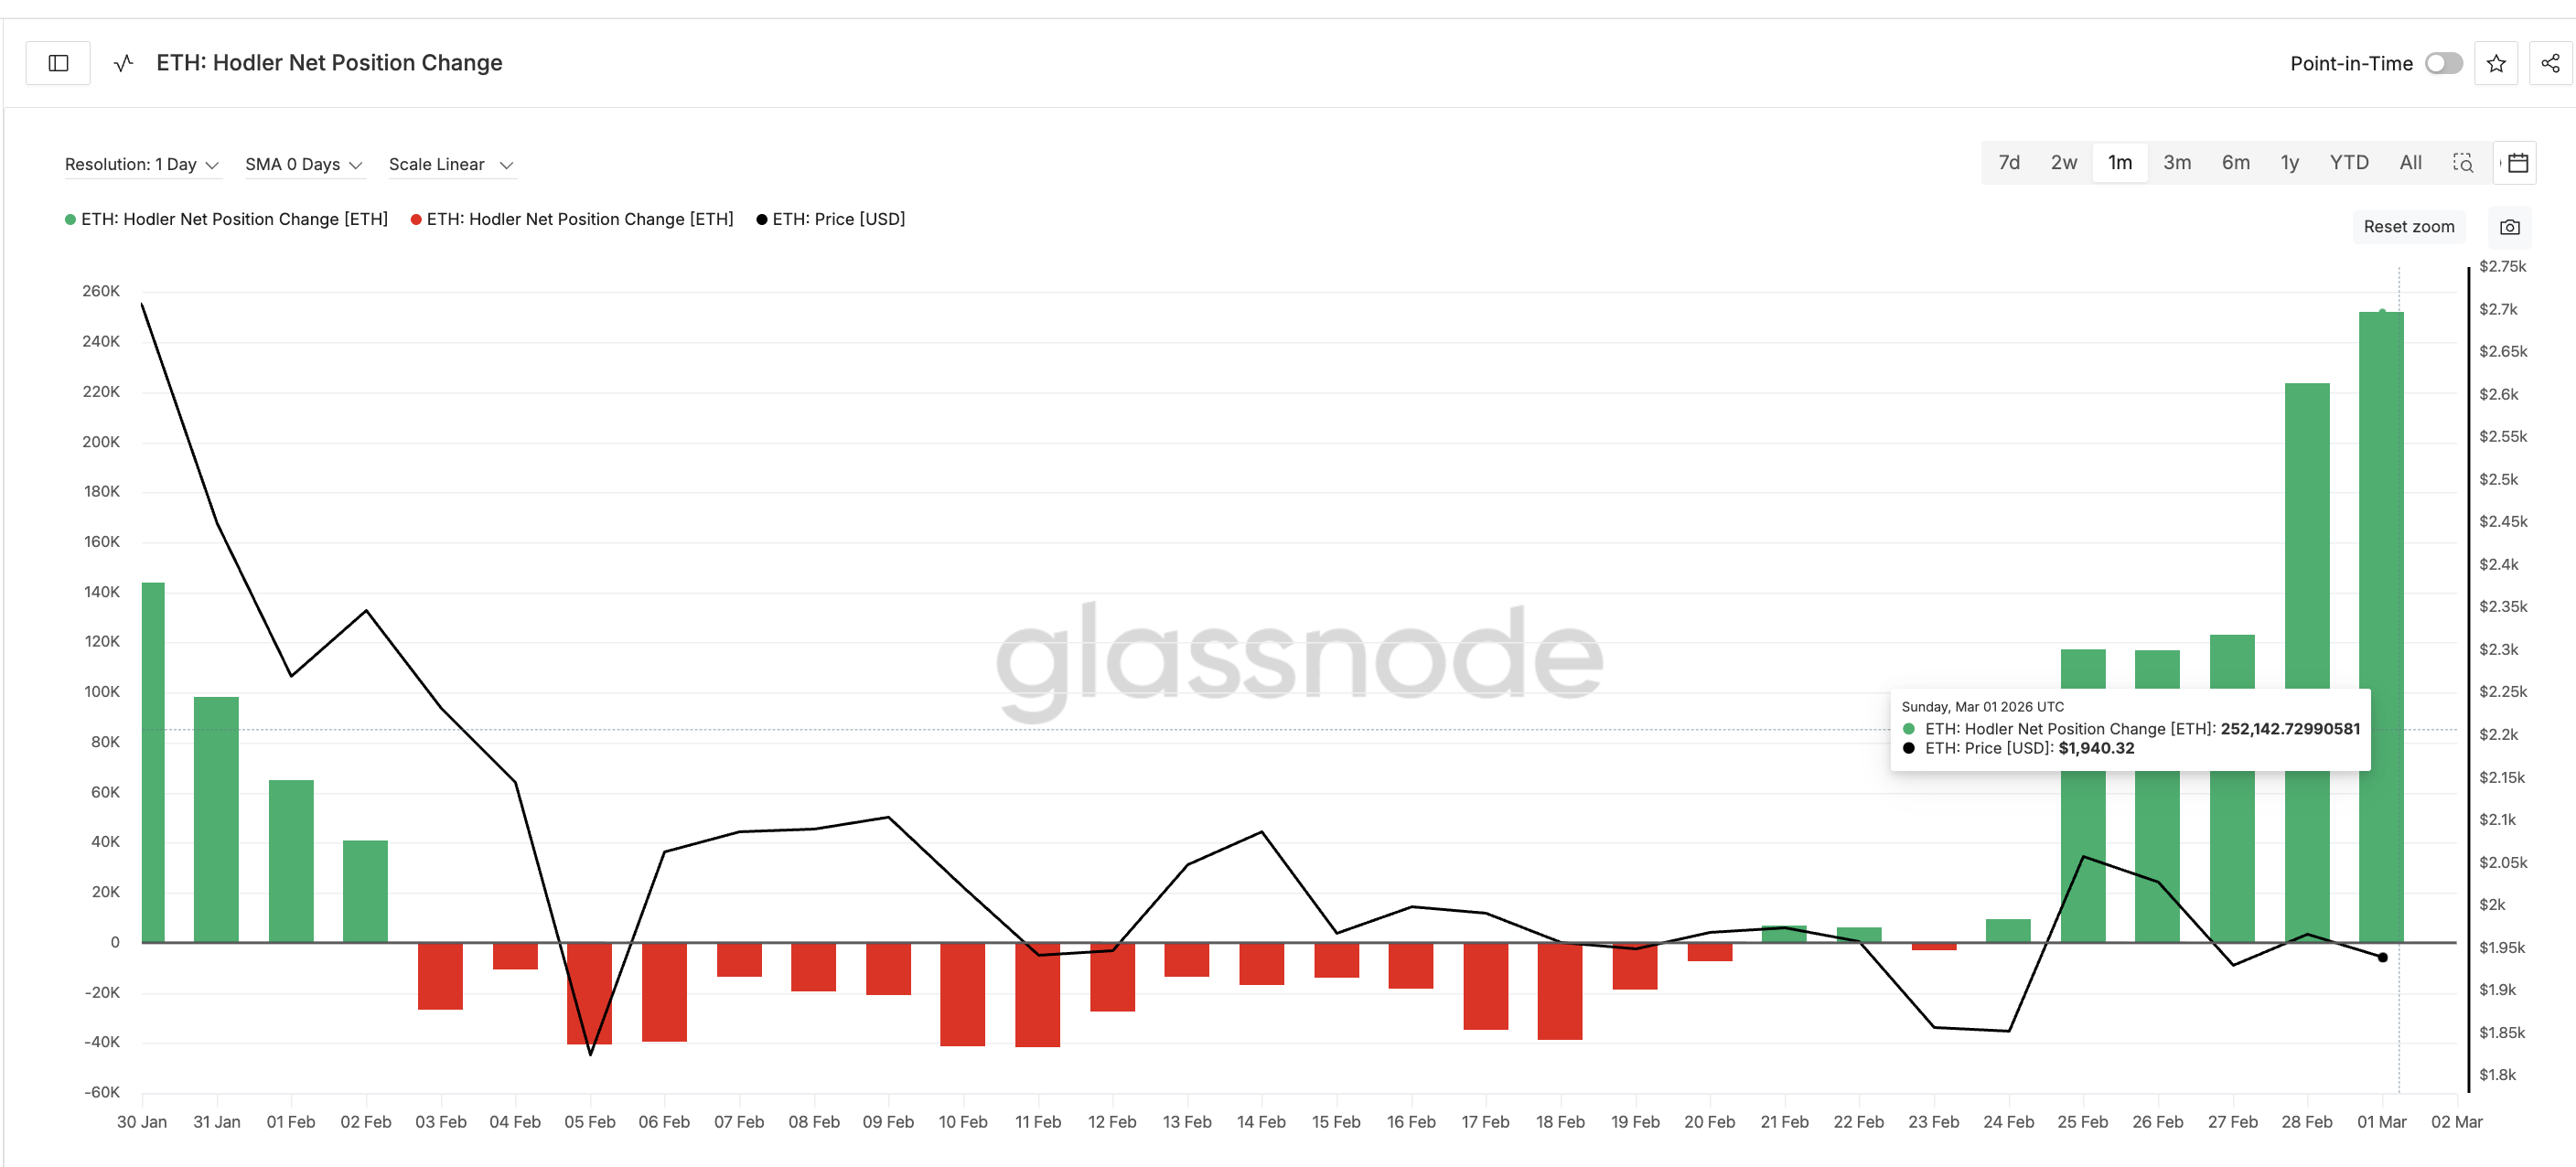
Against this bearish backdrop, one on-chain metric stands out. Ethereum hodlers — wallets that have held ETH for 155 days or more — have sharply increased their buying. On February 21, the hodler net position change metric was a modest +6,829 ETH. By March 1, it surged to +252,142 ETH, a massive 3,500% spike that on the surface looks like strong conviction.
But context complicates this signal. The last major hodler buying spell began on December 26, 2025, when the Ethereum price was around $2,920. They kept accumulating as the price climbed to $3,350 by January 14. Then the weekly EMA crossover triggered, and the price began falling sharply. Hodlers continued buying through the decline. Their net position only turned negative on February 2, when the price had already dropped to $2,340.
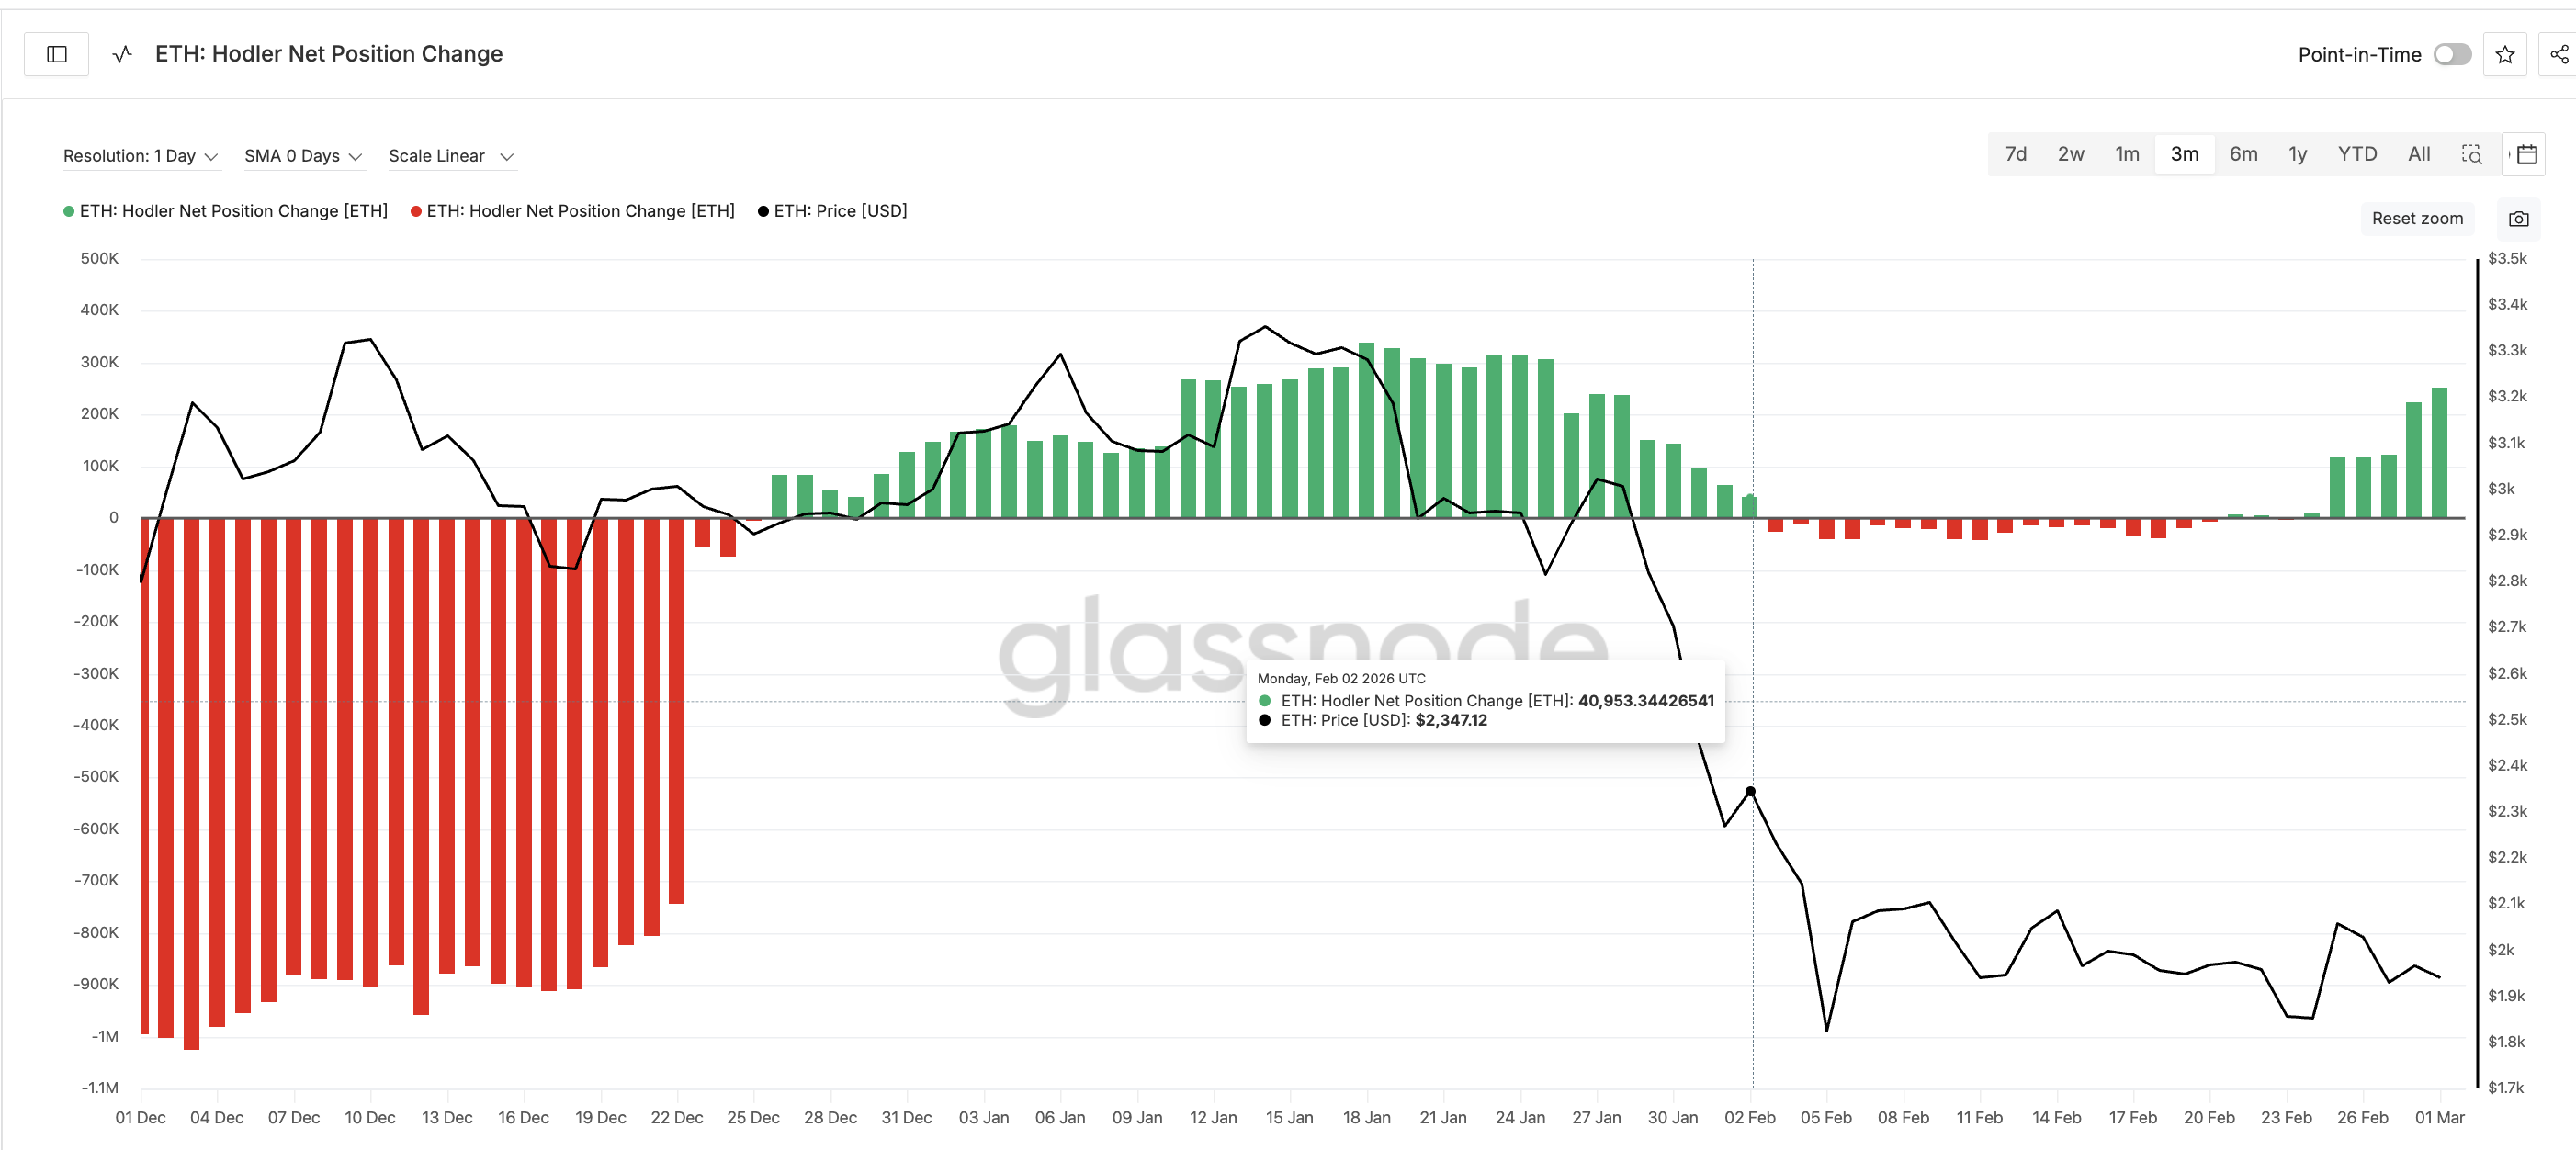
Many of these hodlers are therefore likely trapped between $2,340 and $3,350. The current buying surge may not represent fresh bullish conviction but rather an attempt to average down and break even. Retail investors should be cautious about following this signal blindly — the motivation behind the buying may be survival, not strategy.
But There Is a Reason They Are Buying; And the Key Ethereum Price Levels to Watch
If hodlers are trapped, why are they increasing exposure now, in a weak market? The 12-hour chart may hold the answer.
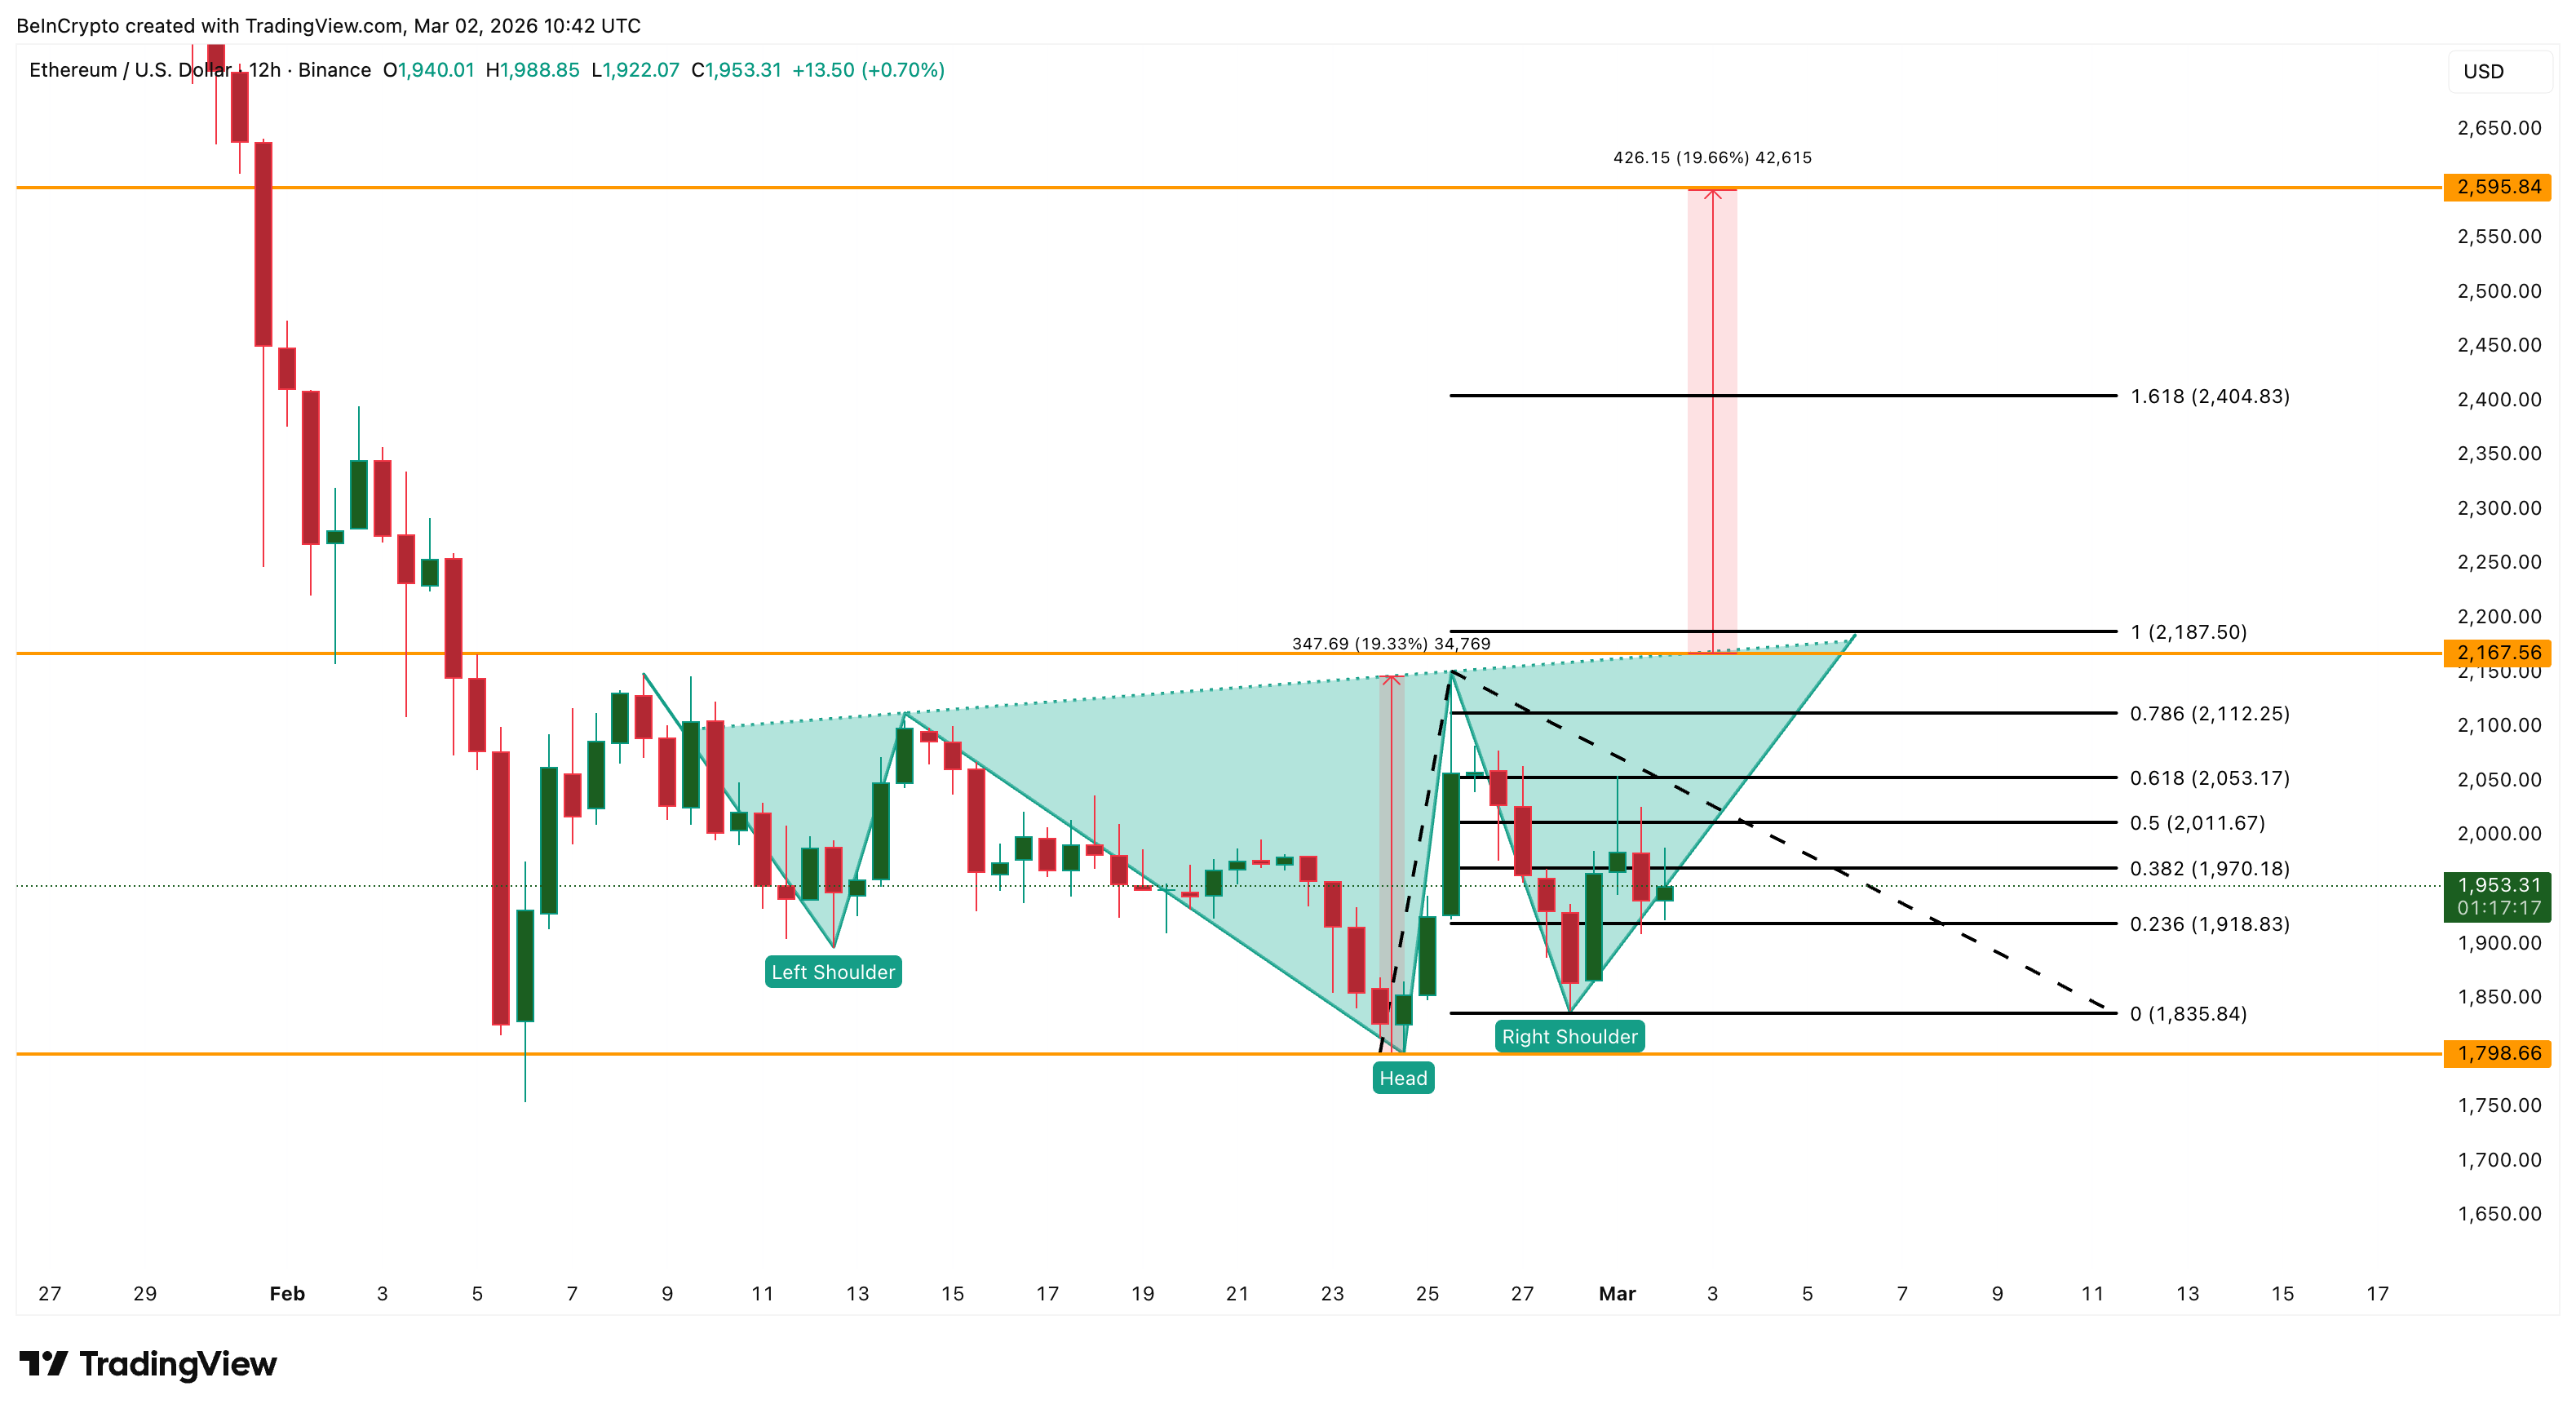
Between February 12 and February 28, the Ethereum price printed a lower low while the Relative Strength Index (RSI) — a momentum oscillator — printed a higher low. This forms a bullish divergence, a signal that selling momentum is weakening even as the price drops. That divergence has already triggered a bounce, with the Ethereum price rallying approximately 11.7% from the lows.
More importantly, this bounce is shaping an inverse head and shoulders pattern on the 12-hour chart; a bullish reversal structure. This is likely what hodlers are positioning for — a short-term breakout that could help them recover losses from the January trap. The technical setup is real, and the RSI divergence has already been validated by the initial bounce.
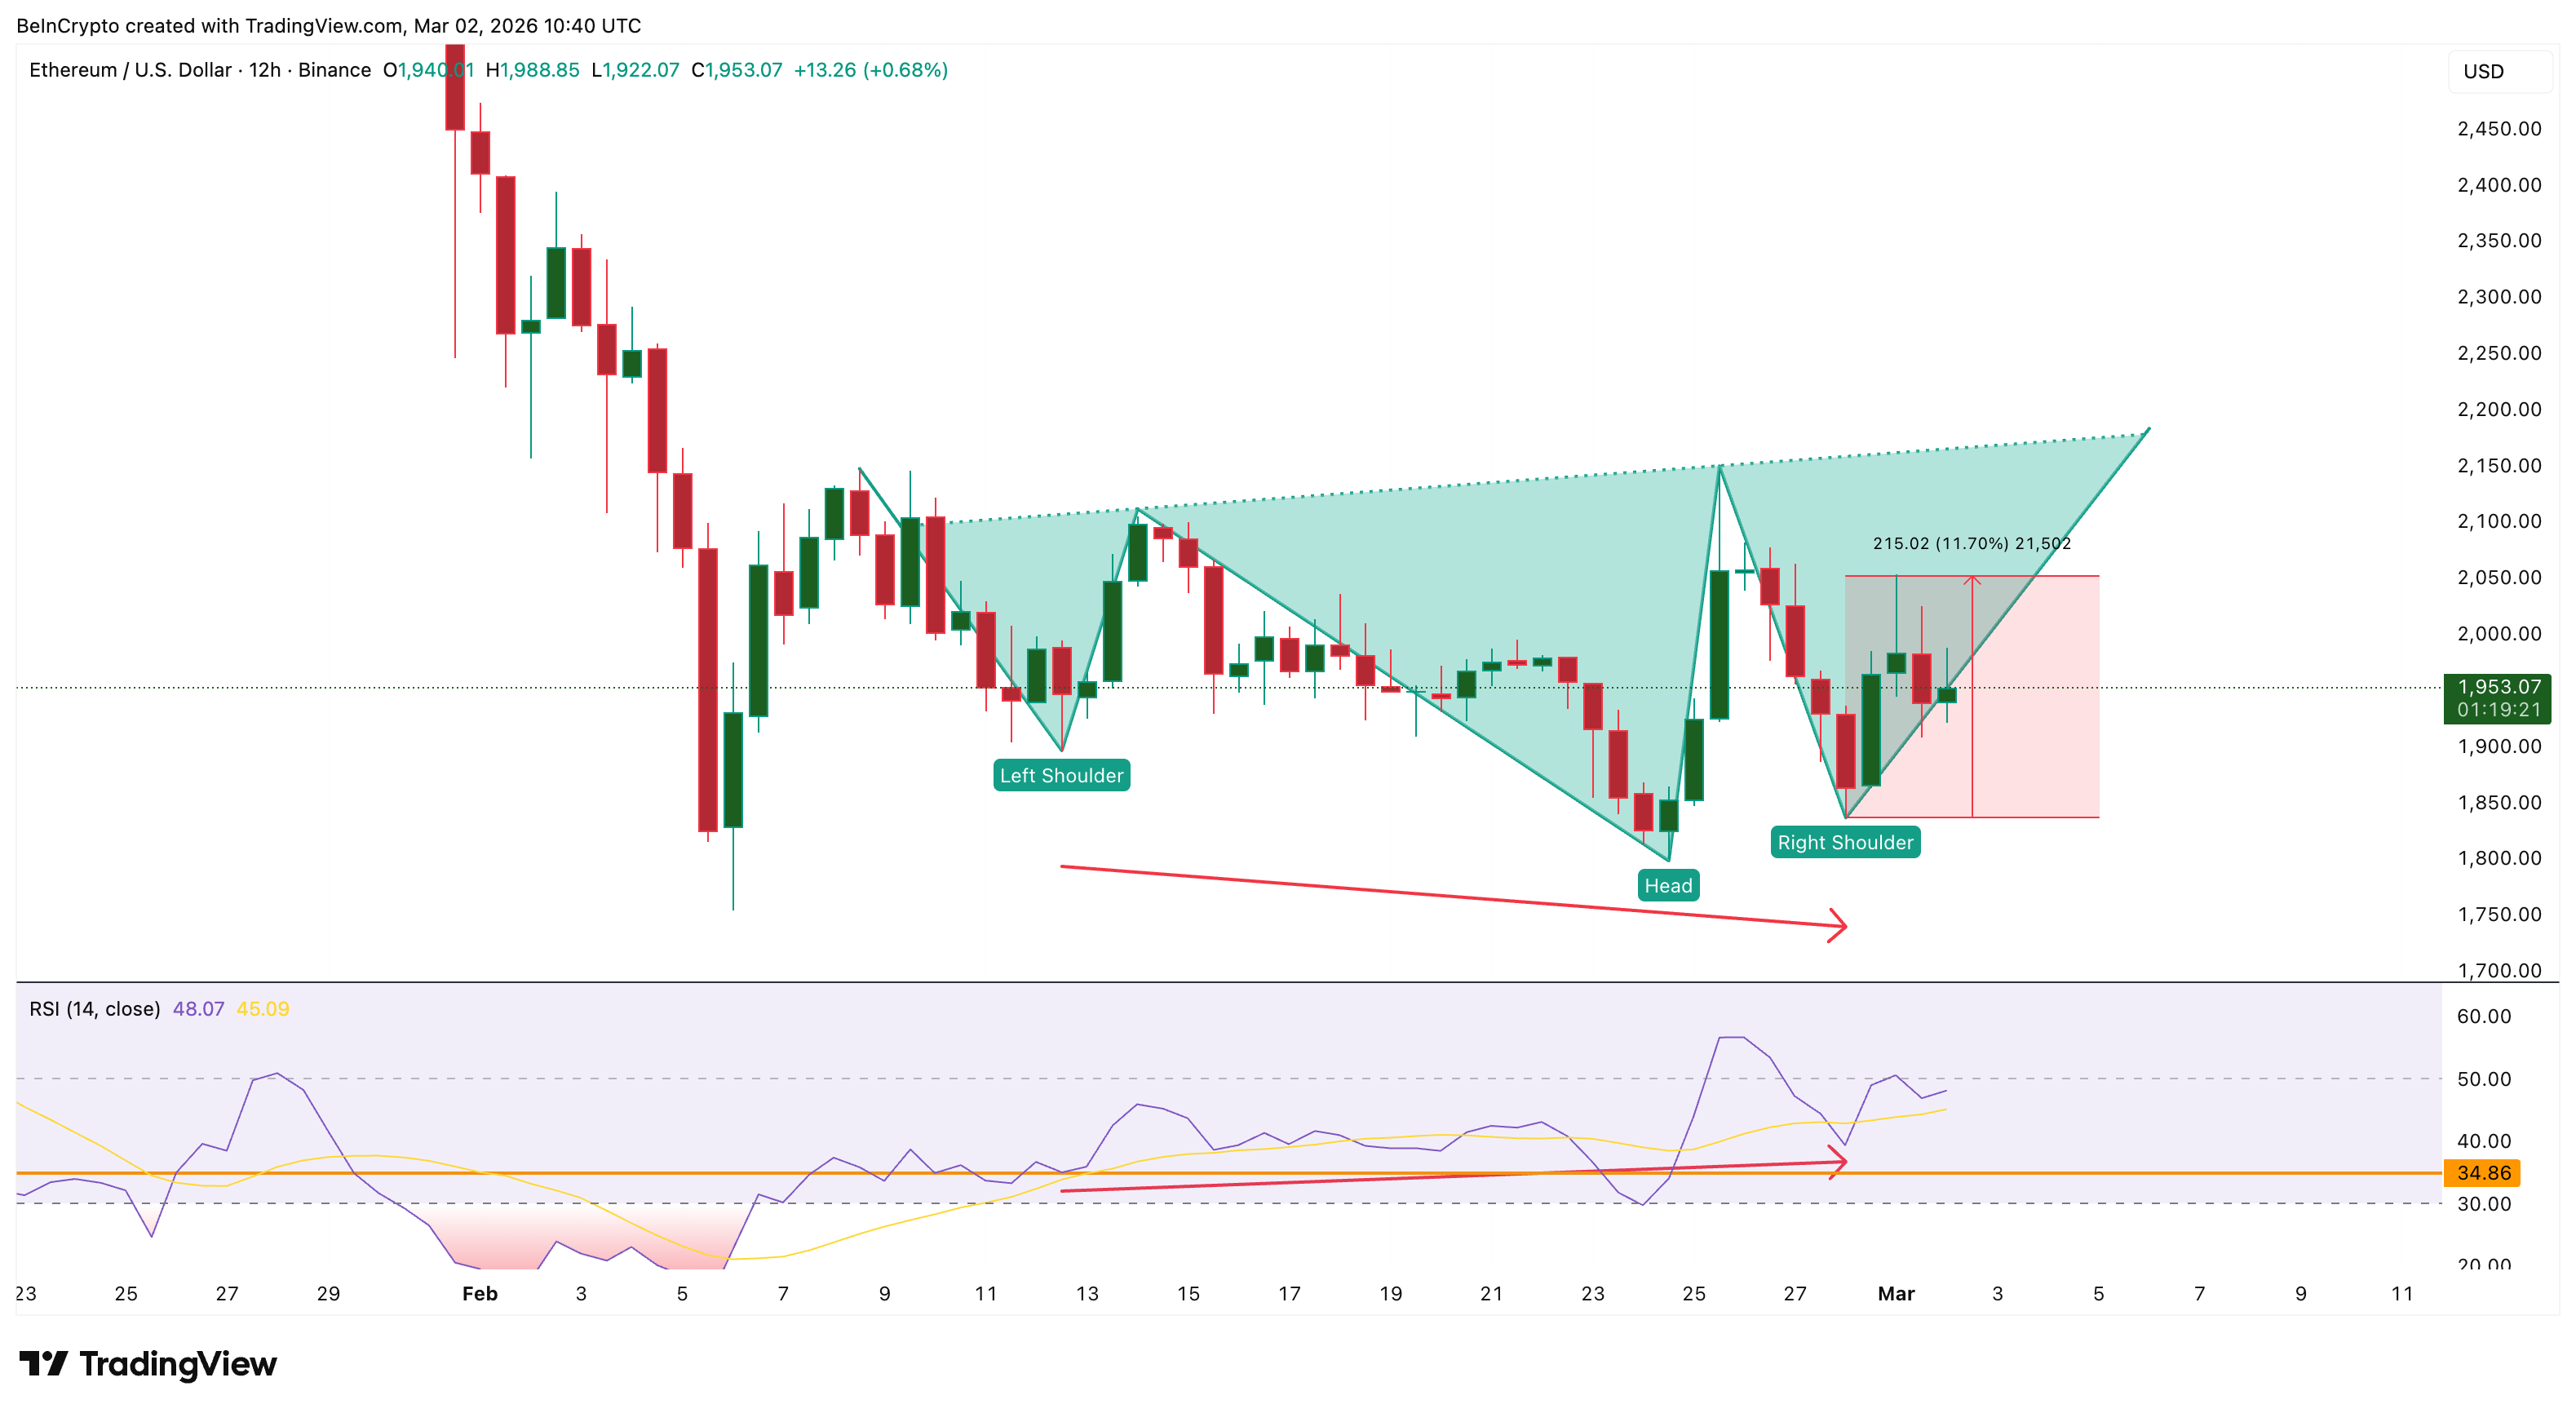
The neckline sits around $2,160–$2,180. If the Ethereum price closes above this level, the measured move projects a roughly 19% rally, targeting approximately $2,590. Before that, the Fibonacci extension levels at $2,050 and $2,400 would serve as intermediate resistance zones.
On the downside, a drop below $1,830 weakens the inverse head and shoulders. A close below $1,790 invalidates the bounce thesis entirely, and the weekly head and shoulders reasserts dominance — placing the $1,320 target back in focus.
The most probable path for March mirrors Bitcoin’s setup: a bounce attempt driven by the 12-hour structure and hodler accumulation, followed by renewed pressure as the weekly trend remains firmly bearish.
The bounce is real, but it is fighting against a much larger breakdown.


XRP is back in focus after new infrastructure developments tied to Ripple’s institutional push. Hidden Road ($HRFI) officially went live on the NSCC directory on March 2, 2026, per a DTCC notice.
Summary
- Hidden Road’s NSCC listing strengthens Ripple’s institutional positioning, potentially positive for long-term XRPL adoption.
- XRP remains below its 50-day SMA, signaling ongoing bearish structure.
- Support sits near $1.30 and $1.20; resistance stands at $1.45 and $1.62.
The development deepens the integration between Ripple and Hidden Road and strengthens Ripple Prime’s role in bridging traditional finance (TradFi) with decentralized finance (DeFi).
The NSCC (National Securities Clearing Corporation), a subsidiary of DTCC, handles post-trade clearing and settlement for U.S. equities.
If Ripple Prime infrastructure facilitates post-trade flows that eventually settle or interact with the XRP Ledger (XRPL), it could represent meaningful real-world volume moving onto blockchain rails.
While the integration does not automatically translate into direct Ripple token (XRP) demand, market participants often interpret institutional connectivity as a long-term bullish signal. The key question remains whether XRPL usage scales in a way that structurally increases XRP utility rather than simply expanding enterprise tooling.
XRP price analysis
From a technical standpoint, XRP is currently trading around $1.36 on the daily chart, consolidating after a prolonged downtrend from the $2.40 region earlier this year. Price remains below the 50-day simple moving average near $1.62, indicating the broader trend is still bearish.
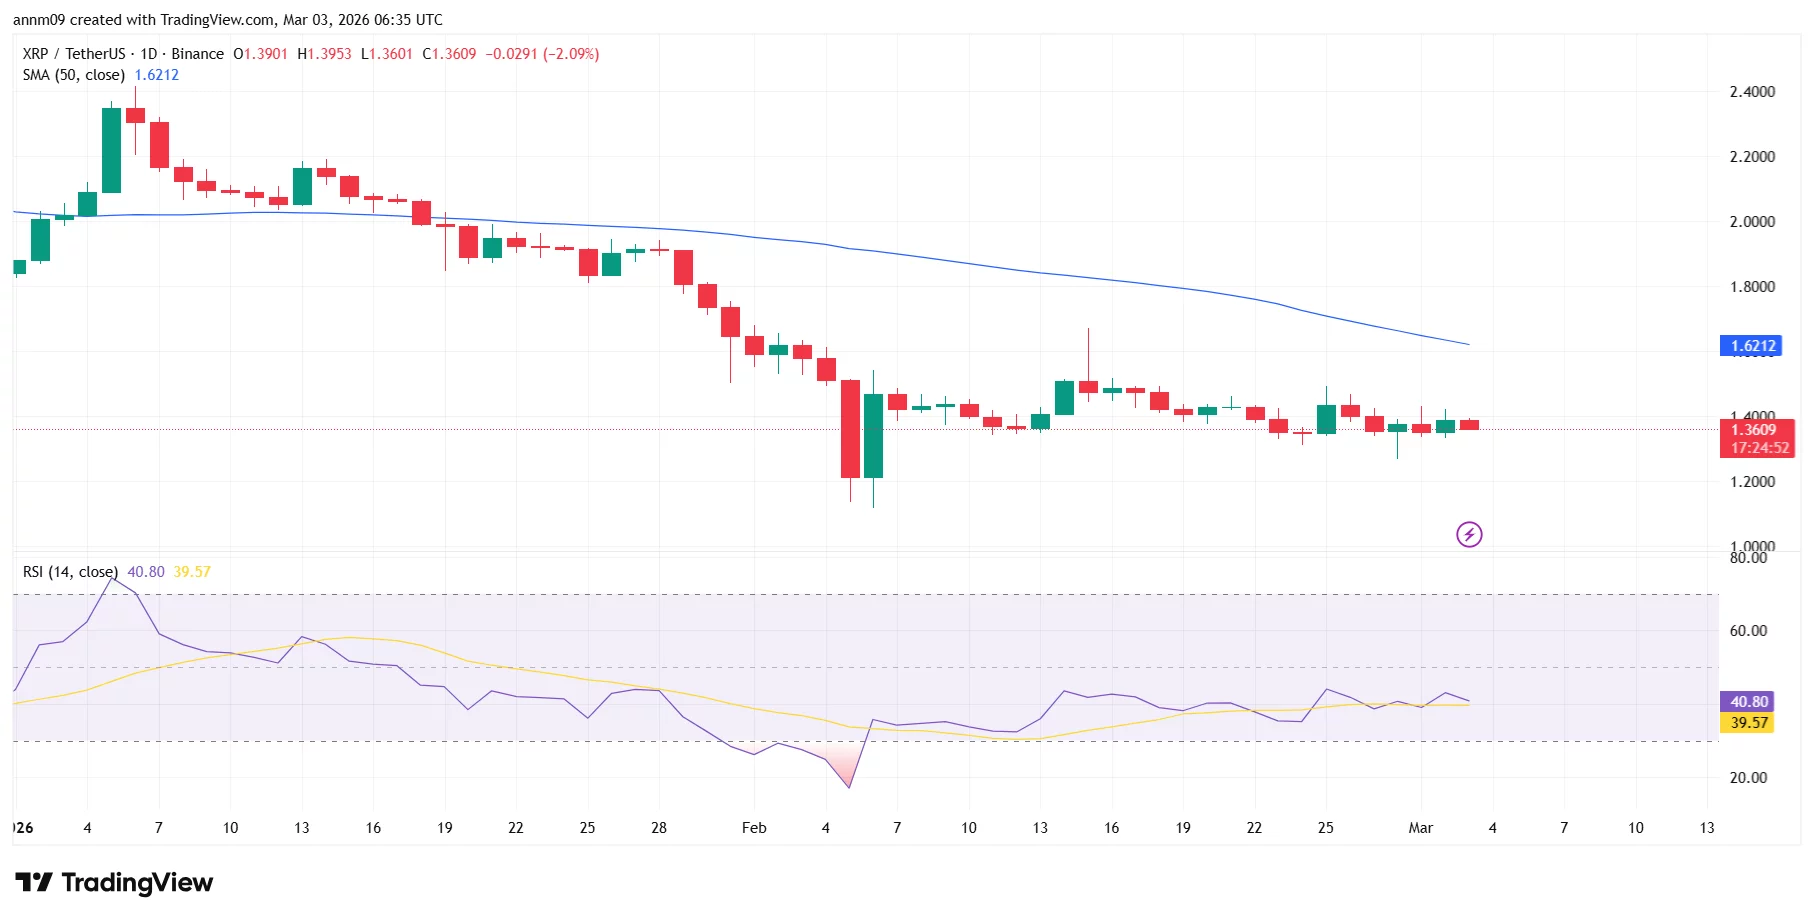
Immediate support sits near $1.30–$1.32, with a stronger demand zone around $1.20, where buyers previously stepped in aggressively.
On the upside, resistance is clustered at $1.45, followed by the 50-day SMA at $1.62. A decisive break above that level would be needed to shift medium-term momentum.
The RSI (14) is hovering near 40, suggesting weak momentum but not yet oversold conditions. This reflects consolidation rather than strong accumulation. Unless XRP reclaims $1.45–$1.62, rallies may face selling pressure.
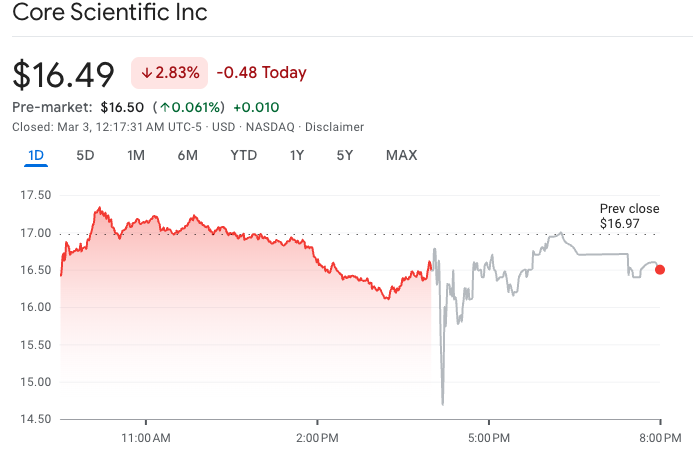
Shares in Core Scientific moved lower on Monday after the Bitcoin miner and artificial intelligence compute provider’s fourth-quarter earnings missed analyst expectations amid a late-year drop in crypto markets.
Core Scientific reported Q4 revenues of $79.8 million, down 16% from the year-ago quarter and missing Wall Street expectations of $90.4 million. Its crypto mining revenue fell nearly in half from Q4 2024 to $42.2 million.
The company posted net income of $216 million for the quarter, largely boosted by a $330.3 million fair value gain on its non-cash holdings. Its adjusted EBITDA showed a loss of $42.7 million.

The earnings come as Bitcoin (BTC) is trading nearly 50% below its peak in early October at around $68,000. The cryptocurrency fell sharply late last year after hitting a peak of over $126,000, ending 2025 at just under $88,500.
The drop has hurt Bitcoin miners’ profits, which are also facing headwinds from higher energy and computing costs, as many, including Core Scientific, spend big on pivoting to AI by offering colocation services for high-performance computers.
Core Scientific CEO Adam Sullivan said the company was “now past the halfway point on our existing builds and scaling our colocation platform into a 1.5-gigawatt pipeline of leasable capacity.”
The company added that it is expanding one of its sites in Texas to support 430 megawatts of gross power capacity and has increased power capacity at other sites in Georgia and Texas by 300 megawatts.
Shares in Core Scientific (CORZ) ended trading on Monday down 2.8% to $16.49. Its stock fell to a low of $14.69 after the bell, but recovered to end the after-hours session flat. Core Scientific’s stock is up over 13% so far this year.
Related: Nasdaq files for prediction market-style options on Nasdaq-100
Riot Platforms trades flat on Q4 revenue miss
Rival Bitcoin miner and AI compute hoster Riot Platforms also posted its Q4 results on Monday, reporting revenue of $152.8 million, up 7% from a year ago but missing analyst expectations of $157 million.
Shares in Riot Platforms (RIOT) traded flat on Monday, ending the day at $16.43 and moving less than 1% after hours to $16.28.
Magazine: Bitcoin may take 7 years to upgrade to post-quantum — BIP-360 co-author

Bitcoin (CRYPTO: BTC) has shown signs that selling pressure may be fading, though analysts caution that a durable bottom is far from guaranteed. In recent sessions, the asset has hovered around key technical levels, with the 20-day moving average offering a critical backdrop near $68,500 and volatility compressing as traders digest macro headlines. While one market update noted that BTC did not accelerate lower on risk-off news, the broader bear-market narrative remains intact for many observers, keeping upside exposure tactical rather than structural.
Key takeaways
- Bitcoin appears to have shifted tactically rather than signaling a structural reversal, with near-term momentum stabilizing but persistent bearish conditions.
- The price has regained the vicinity of the 20-day moving average around $68,500, and Bollinger Bands are narrowing, potentially setting the stage for a defined trading range rather than a fresh down leg.
- BTC touched just above $70,000 in late trading on Coinbase but retraced to roughly $68,400, indicating continued volatility and intra-session shifts.
- The $62,500 level has held on three tests, reinforcing it as meaningful support amid a broader bear-market context.
- Bullish divergences are emerging in momentum indicators like RSI and stochastic, hinting at a possible stabilization even if the larger trend remains down.
Tickers mentioned: $BTC
Sentiment: Neutral
Price impact: Positive — a price bounce driven by crowd-long liquidations in derivatives and easing selling pressure.
Trading idea (Not Financial Advice): Hold. With no confirmed trend change, tactical exposure is reasonable while monitoring for a clear breakout or breakdown.
Market context: The price action unfolds against a backdrop of narrowing volatility, strengthening ETF-related flows, and evolving macro headlines that influence risk appetite across crypto markets. As liquidity conditions remain nuanced, traders are weighing whether recent moves represent a genuine shift in momentum or a temporary pause within a continuing bear market.
Why it matters
The latest price dynamics matter because they illuminate how traders are positioning around a potential bottom without assuming a durable reversal. The evidence for a tactical shift—such as stabilizing momentum indicators and a guarded recovery after tests of critical support—could influence risk management decisions for both hedge funds and retail participants. Yet the overarching framework remains cautious: many analysts still classify Bitcoin as being in a bear-market regime, meaning that any bullish exposure should be limited in scope and time-bound unless a clear directional breakout occurs.
From a market mechanics perspective, several indicators align to suggest a pause rather than a pivot. Volatility appears to be compressing, ETF flows have shown resilience, and the once-widening Coinbase discount has faded, all of which are inconsistent with a market rushing into a fresh leg lower. Still, analysts caution that these are characteristics of consolidation, not confirmation of a new uptrend. The resilience around the $62,500 level—tested multiple times—provides a potential platform for range-bound activity or a gradual accumulation phase, should buyers step in at these levels with sustained interest.
Additionally, the narrative around derivatives markets cannot be ignored. Recent observations point to deeply negative funding rates as a key driver of a short-term rebound, where crowded short positions were forced to unwind as price found support. While that dynamic can produce sharp, short-lived bounces, it does not by itself constitute a lasting reversal or a trigger for sustained upward price action. The absence of durable macro catalysts—such as clear liquidity inflows or institutional commitments—underscores why traders remain cautious about calling a new bull leg.
What to watch next
- Observe BTC’s behavior around the 62,500 support level over the coming sessions to see if buyers maintain conviction or if bears pressure the price lower again.
- Monitor momentum indicators (RSI, stochastic) for continued bullish divergences or a retreat back into bearish territory.
- Track ETF flow data and any shifts in the Coinbase-related pricing discounts as signals of broader liquidity and investor sentiment shifts.
- Watch for changes in funding rates in derivatives markets; a sustained shift back to positive funding could alter the risk-reward dynamic for long positions.
- Keep an eye on macro catalysts that could reintroduce risk-off pressures or, conversely, catalyze renewed risk appetite in crypto assets.
Sources & verification
- 10x Research market update: Is the Bitcoin correction over, bottom formed, or is this a bear-market trap? ( https://update.10xresearch.com/p/is-the-bitcoin-correction-over-has-the-bottom-formed-or-is-this-a-bear-market-trap )
- Bitcoin price context and market observations referenced in BTC price coverage (Cointelegraph article on price movements and bear-market context): https://cointelegraph.com/news/bitcoin-holders-show-zero-panic-as-btc-hits-dollar70k-amid-middle-east-tensions
- TradingView BTCUSD price data (Coinbase exchange view): https://www.tradingview.com/symbols/BTCUSD/?exchange=COINBASE
- ETF flows and related analysis referenced in coverage of how ETF activity affects Bitcoin price dynamics: https://cointelegraph.com/news/are-bitcoin-etfs-quietly-accumulating-or-just-not-selling-the-flow-data-that-matters
- Derivatives funding rate context and potential short-squeeze signals: https://cointelegraph.com/news/negative-bitcoin-funding-rate-may-signal-pending-short-squeeze-above-dollar70k
Bitcoin price action: tests of support and momentum signals
Bitcoin (CRYPTO: BTC) has been navigating a delicate balance between tactical resilience and structural risk. After a period in which selling pressure appeared to intensify alongside macro headwinds, the market is displaying a constellation of signals that traders read as a potential shift in near-term dynamics without confirming a new long-term trend. The most cited technical talking points center on the interaction with the 20-day moving average, the narrowing of volatility bands, and the resilience of a critical support zone around $62,500.
The 20-day moving average has re-emerged as a yardstick for assessing near-term momentum, with BTC hovering near that level at the time of writing. A tightening of Bollinger Bands reinforces the notion that price action may be compressing into a more defined range, which often precedes a breakout or a sustained consolidation. In practical terms, a break above the upper band could portend a bullish continuation, while a break below the lower band would reaffirm downside risk in a bear-market context. These technical nuances are amplified by the price’s behavior around the $70,000 mark in late sessions, where a brief ascent gave way to a retracement as traders reassessed risk and liquidity conditions.
From a supply-demand perspective, the $62,500 threshold has proven notable. It withstood tests on three separate occasions, suggesting authentic support that buyers have targeted in a market characterized by fragile liquidity. The price’s ability to rebound from the $63,000s demonstrates that demand exists at specific price points, even as overall sentiment remains cautious. In tandem, momentum indicators—specifically RSI and stochastic—have started to exhibit bullish divergences, a pattern that traders often interpret as an early harbinger of stabilizing momentum. While these signals are encouraging at the margin, they are not a substitute for a decisive trend shift, especially as macro catalysts remain uncertain.
Beyond the price action, market mechanics play a central role in interpreting the recent bounce. Negative funding rates in derivatives markets have contributed to a squeeze dynamic, where crowded short positions were unwound as price rose from the mid-$60,000s. This type of price activity is not inherently indicative of a durable reversal; it reflects the intricacies of leverage and risk parity in a market that remains susceptible to rapid shifts. The absence of broad, structural inflows—particularly from institutional buyers—keeps the door open for renewed pressure should liquidity conditions deteriorate or if macro risk sentiment deteriorates further.
Looking ahead, the market will be watching for sustained price action that can convert tactical gains into a more persistent trend. Traders will evaluate whether the momentum divergences sustain themselves, whether ETF flow dynamics continue to provide relief to selling pressure, and whether any macro event can catalyze a more pronounced shift in risk appetite. In the meantime, market participants are likely to treat any move that reclaims or holds above the $68,000–$70,000 zone as a potential cue for cautious optimism, while remaining mindful of the longer-term bear-market framework that many analysts still cite as the prevailing context.
The decline in altcoin market capitalization has started to slow in the first week of March despite numerous negative geopolitical developments. In addition, the newly released PMI index is reviving hopes that altcoins may recover soon.
However, any recovery could face significant challenges as the proportion of altcoins trading near their all-time lows continues to rise.
Why Could the PMI Report Influence Capital Flows into the Altcoin Market?
A positive macroeconomic signal has just emerged, bringing renewed optimism. The US ISM Manufacturing PMI has remained above the 50 threshold for two consecutive months.
The ISM Manufacturing PMI reflects survey results from purchasing managers about their business conditions. It helps assess whether the US manufacturing sector is expanding or contracting.
Specifically, the February 2026 PMI reached 52.4. Although it came in slightly lower than January’s 52.6, it still exceeded the forecast of 51.8.
Historical data shows that when the ISM PMI rises above 50—indicating economic expansion—it often coincides with strong rallies in Bitcoin and altcoins.
Analyst Ash Crypto explained that when PMI exceeds 50, the US economy enters an expansion phase. Corporate profits increase. Household income improves.
Consumer spending accelerates. Investor risk appetite strengthens.
“If ISM stays above 50 for a few more months, the crypto winter could be over soon,” Ash Crypto stated.
Analysts expect that the ISM Manufacturing PMI remaining above 50 for two consecutive months signals the beginning of a new US business cycle. This environment creates favorable conditions for capital to flow into high-risk assets such as cryptocurrencies.
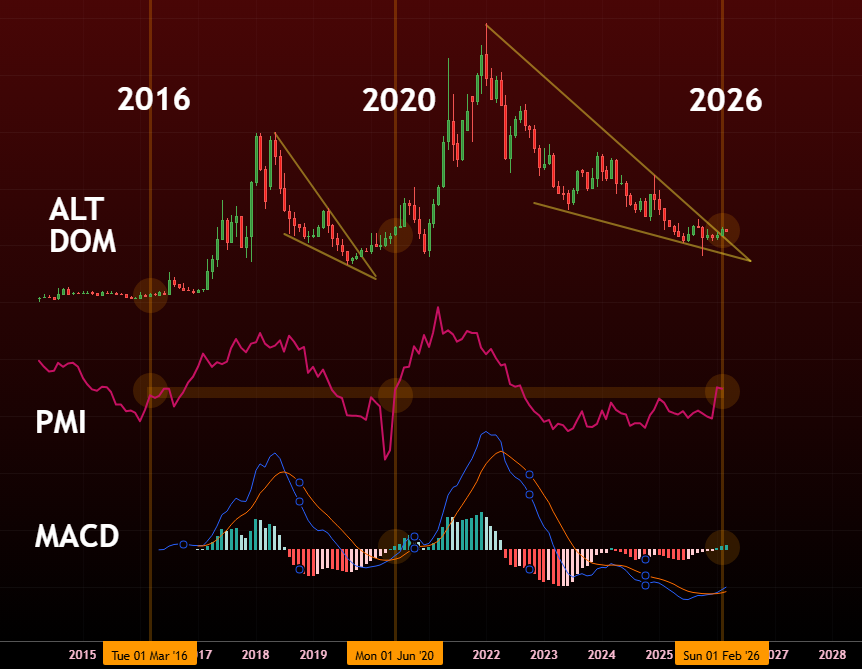
Analyst Matthew Hyland combined PMI data with historical models and indicated that altcoin dominance has just confirmed a breakout signal.

The rising PMI, together with the recovery of the monthly MACD-H indicator and the breakout from a falling wedge pattern in altcoin dominance, suggests a potential altcoin season scenario in 2026.
38% of Altcoins Are Trading Near All-Time Lows
A recent report by CryptoQuant analysts reflects a still-bleak outlook for altcoins.
Darkfost, an analyst at CryptoQuant, stated that approximately 38% of altcoins are trading near their all-time lows. This marks the lowest level in the current cycle and appears even worse than the period immediately following the collapse of FTX.
“This chart perfectly illustrates the current situation for altcoins. Investors remain cautious and continue to lose interest in altcoins,” Darkfost explained.
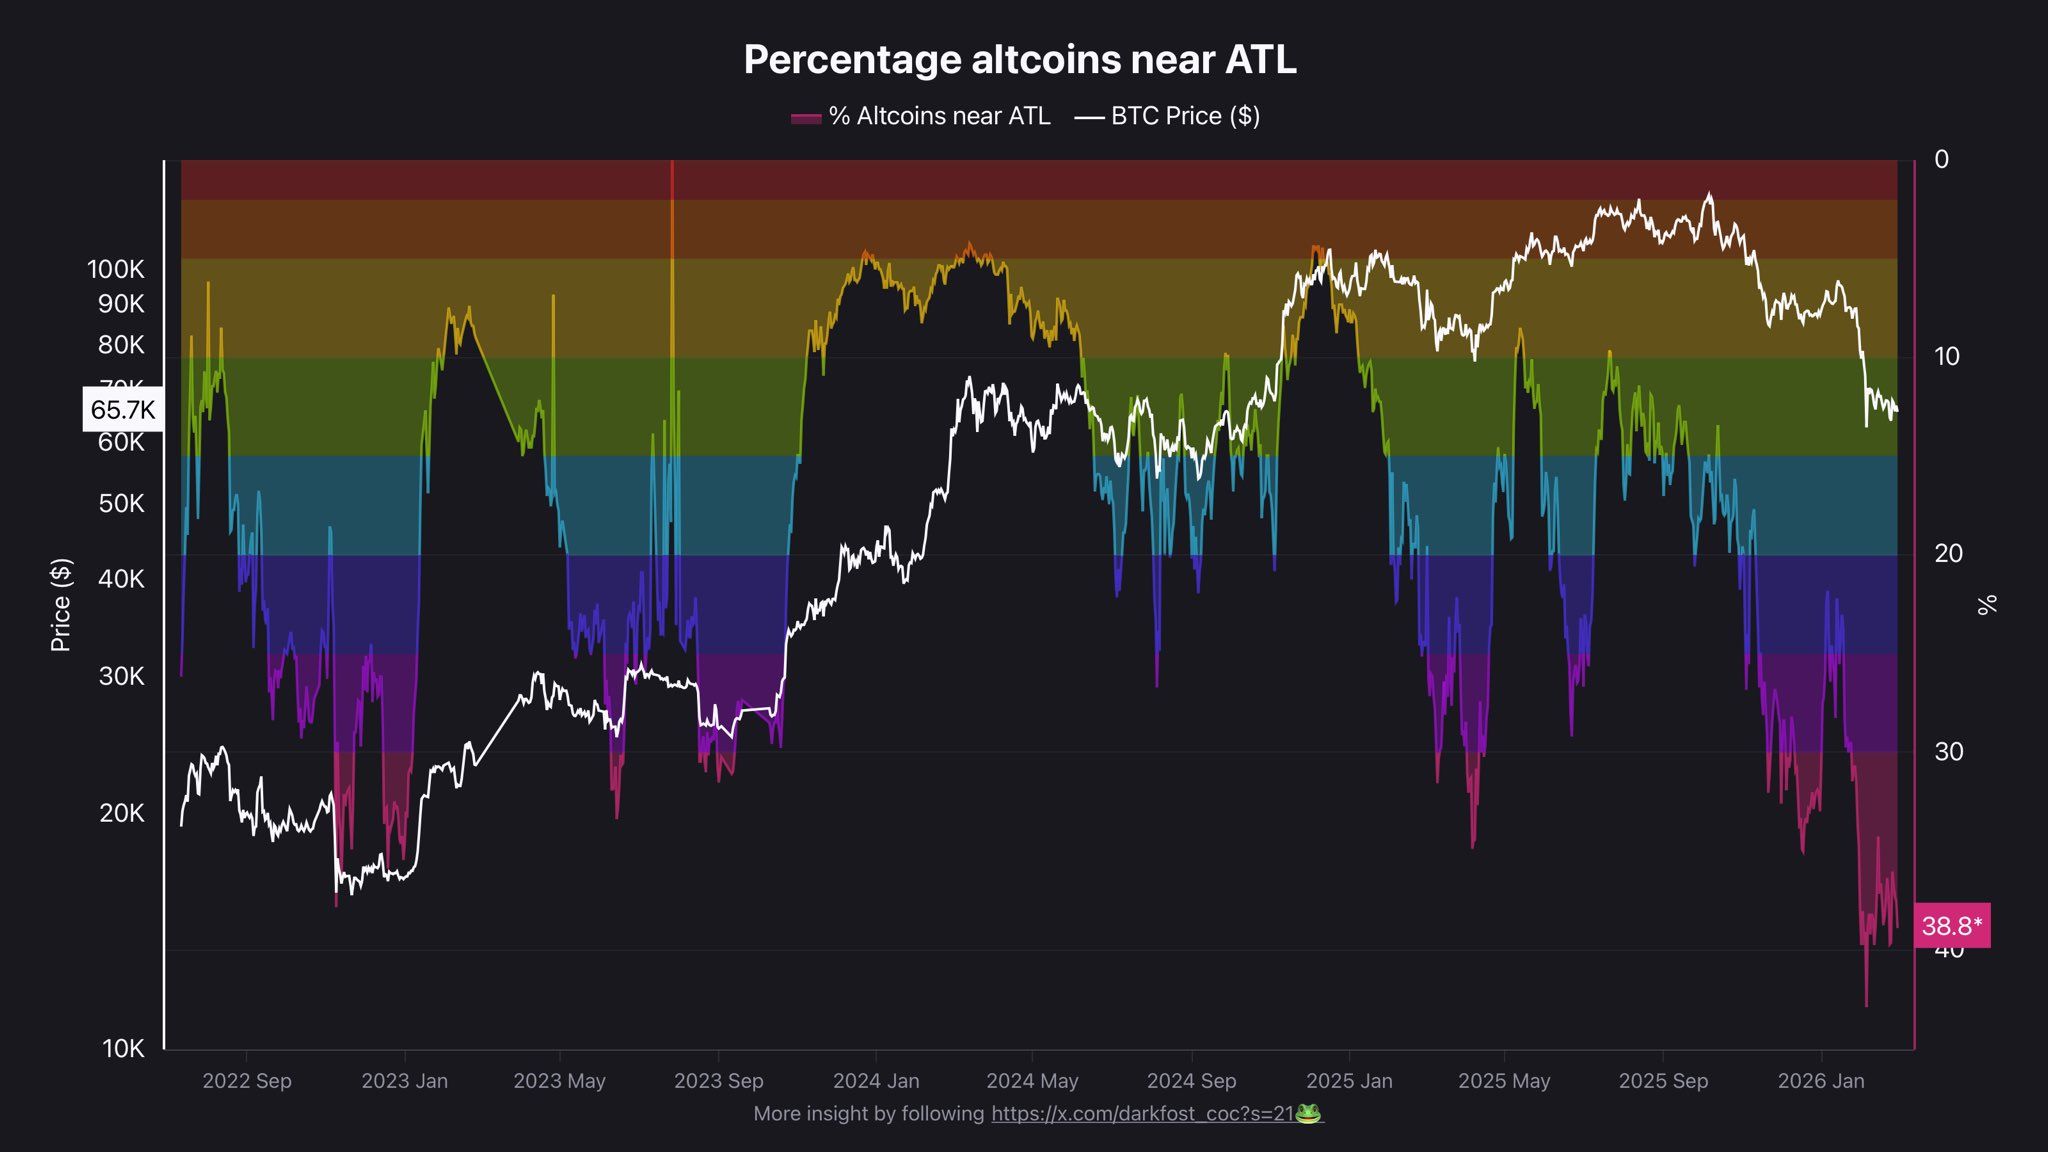
However, he added that severely deteriorating conditions can also create an environment where opportunities begin to emerge.
A recent report by BeInCrypto highlighted additional signals in March that suggest altcoins could recover. However, the excessive number of altcoins combined with tight liquidity conditions may limit the extent of any rebound.

Analysts argue that geopolitical shocks have failed to invalidate the existing bullish short-term and bearish mid-term outlooks.
Bitcoin’s reaction to escalating geopolitical tensions over the weekend was limited, even as traditional markets reacted more sharply. BTC slipped to around $65,500 on Monday after trading in a volatile range between roughly $63,000 and $68,000, as markets responded to rising US-Iran tensions and reports that Iran’s Supreme Leader, Ayatollah Ali Khamenei, was killed in a joint US-Israeli airstrike.
Despite the intense, volatile backdrop, market commentators say that the conflict has not changed Bitcoin’s trajectory.
High Risk Zone
In a post on X, Mr. Wall Street stated that “nothing changed with the new war.” He said that he does not believe the cycle bottom is in at $60,000. According to him, the cycle bottom will form later this year, around $45,000, but only after Bitcoin first rallies to the $80,000-$85,000 range.
The analyst’s outlook is bullish in the short term, bearish in the mid-term. This indicates that while geopolitical shocks may create volatility, he does not believe they invalidate the expectation of a near-term pump followed by a deeper corrective phase. Another prominent crypto market commentator, Doctor Profit, also maintained that the war does not alter his broader bearish positioning.
He wrote that Bitcoin “remains in an absolute high risk zone” and that the market has not bottomed yet.
“The war changes nothing in my bearish outlook for Crypto and Stocks.”
He also added that he remains fully bearish and that his “big short” has remained open since September. Both analysts, despite differing on short-term direction, emphasized that the geopolitical escalation has not fundamentally changed their pre-existing market theses.
US-Iran Conflict Already Priced In?
Trader CrypNuevo said the market had already been pricing in the US-Iran conflict throughout the previous week. He went on to explain that markets cannot fall much further because the event was largely anticipated, but pointed to uncertainty around the length of the war and the status of the Strait of Hormuz. According to them, stock futures, which Bitcoin tends to follow, would probably open negatively, and could potentially recover as soon as de-escalation talks emerge.
You may also like:
They said a prolonged conflict is unlikely, citing concerns that extended closure of the Strait of Hormuz would push oil prices higher and spike US CPI inflation, something they do not expect to occur. The strategy is to wait for Monday’s stock market reaction. As such, if there is a sharp sell-off, they would long Bitcoin around $61,000-$60,000 ahead of de-escalation news. On the other hand, if there is only a slight decline, sideways movement, or a pump, they would delay entering a long position until later in the week.
Binance Free $600 (CryptoPotato Exclusive): Use this link to register a new account and receive $600 exclusive welcome offer on Binance (full details).
LIMITED OFFER for CryptoPotato readers at Bybit: Use this link to register and open a $500 FREE position on any coin!
Crypto are under pressure as war around Iran intensifies and traders begin pricing in the unthinkable: disruption in the Strait of Hormuz.
If that chokepoint closes, oil spikes. And if oil spikes, inflation follows. That puts the Federal Reserve in a corner, forcing rates to stay higher for longer.
Crypto is not immune. While there has been some speculative buying on regional capital flight headlines, the broader macro picture is heavy. Bitcoin is moving more in sync with traditional risk assets, not decoupling from them.
Instead of acting like digital gold, the market is behaving as if liquidity is the real safe haven. In a true energy shock scenario, the first reaction is not rotation into crypto. It is de-risking across the board.
- Bitcoin volatility has spiked as traders hedge against a potential Strait of Hormuz closure that could disrupt one-fifth of global oil flows.
- Surging Oil Price levels above $90/barrel would likely stick inflation higher, potentially taking a Q2 Fed rate cut off the table.
- While Capital Flight into USDT offers localized support, global risk-off flows are dominating market structure and capping upside momentum.
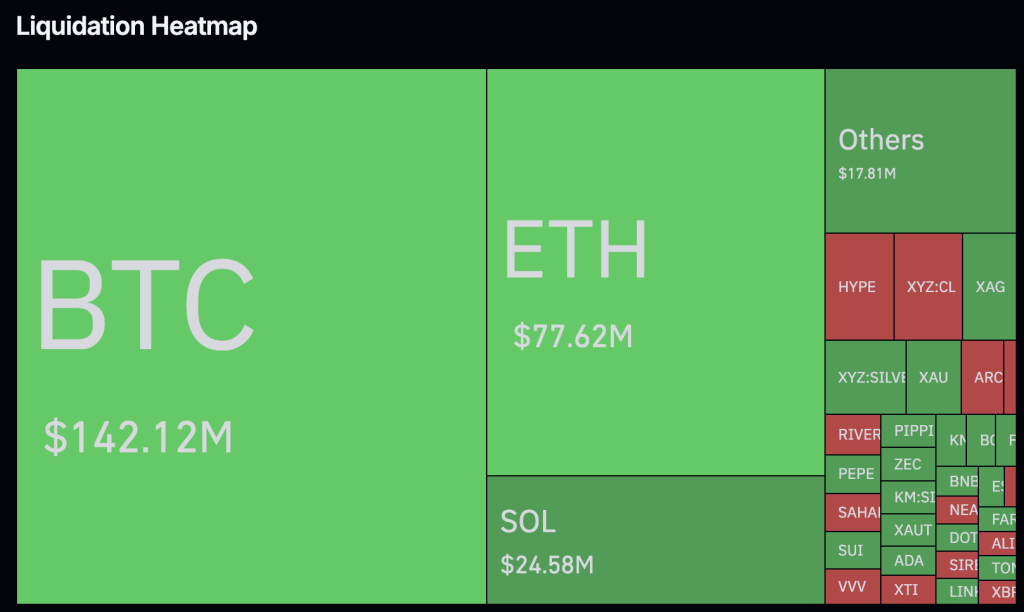
Bitcoin Crypto Volatility Spikes as Iran War Jitters Trigger $128M Liquidations
The first crypto reaction to the Iran war was chaos, not clarity. CoinGlass data shows more than $128 million in liquidations in just 4 hours after reports of the IRGC’s “Operation True Promise 4.” Nearly 80% were longs. Leverage traders were leaning the wrong way and got wiped fast.

Bitcoin initially dropped toward $63,000 on the headlines, then bounced as more details came out. But the rebound feels mechanical, not confident. Open Interest has cooled sharply, which tells you desks are cutting risk, not aggressively buying dips.
This is classic panic behavior. Sell first. Reassess later.
Equities are showing the same pattern. The S&P 500 has seen outflows, and Bitcoin’s correlation with tech remains tight during stress events. Whatever the digital gold narrative says, in moments like this BTC trades like a high-beta risk asset, not a safe haven.
Oil Price Surge Threatens to Derail Fed Pivot Plans
The real risk to crypto might not be the headlines; it could be oil. If the Strait of Hormuz is disrupted, up to 21 million barrels per day could be affected. That is around 20% of the global supply. Even partial disruptions historically trigger instant price spikes.
If crude holds above $100, inflation comes back fast. That traps the Federal Reserve. Rate cuts get delayed. Liquidity stays tight. And crypto suffers in a higher-for-longer environment.
Some analysts are floating extreme downside scenarios again. While most institutional desks still see $58,000 to $60,000 as Bitcoin’s key support zone, that floor depends heavily on the Fed not turning more hawkish.
There is a counter-force: capital flight. Stablecoin demand in parts of the Middle East has jumped as local currencies wobble. Bitcoin and USDT become escape valves. But retail flows from crisis regions rarely offset large institutional outflows driven by macro tightening.
Altcoins are already showing the strain. Without fresh liquidity, Ethereum and the broader sector struggle to sustain rallies. If yields on the U.S. 10-year push back toward 5% on energy-driven inflation, risk assets likely stay capped.
Discover: The best new crypto in the world
The post Crypto, Iran War, and Oil Price: Geopolitical Shock Could Delay the Crypto Bull Run appeared first on Cryptonews.


The price of Bitcoin is close to its bottom, according to VanEck CEO Jan van Eck, pointing to the winding down of the four-year cycle.
Speaking with CNBC on Monday, van Eck said his firm expects Bitcoin (BTC) to gradually start picking up this year, arguing that the four-year halving cycle has been the primary driver of price over the past few months, as opposed to anything related to BTC’s fundamentals.
“Our view coming into 2026 is that Bitcoin is governed by […] limited supply at 21 million, and the halving cycle where the Bitcoin miners who run the network get paid half the number of Bitcoin every four years,” he said, adding:
“There’s been an investing cycle, Bitcoin goes up three years in a row, goes down pretty massively in that fourth year. 2026 is that fourth year. So that’s why we are in a Bitcoin bear market. So I think we can overcomplicate it. Now I think we are making a bottom.”
The four-year crypto cycle has been a hot topic of debate overt he last year, with crypto analysts split over whether the chart pattern is still applicable today given the level of institutional adoption and crypto market maturity.
Arguments against the cycle include macro demand from exchange-traded funds, the weakening USD, and positive regulatory developments.
Jan van Eck’s comments come as the price of BTC is up 2.6% over the past 24 hours and is trading at $68,400 at the time of writing, and 7.6% over the past seven days, according to data from CoinGecko.
Related: Bitcoin slide slowing, but bear market still in play: Analysts
The crypto pump has coincided with growing geopolitical tensions, after the United States and Israel initiated air strikes on Iran, which has since prompted Iran to launch strikes in response against Israel.
Van Eck speculated that Bitcoin’s recent recovery may be partly sparked by the conflict, with crypto payment rails serving as a key tool to move funds outside of banks in times of economic uncertainty.
“When one thinks forward to some sort of solution with Iran, how are you gonna move money around? And I do think it’s a very, very crypto-friendly region, UAE, Dubai, everything,” he said, adding:
“So it could be that if we wanted to move money to good actors, we would wanna use crypto payment rails as opposed to going through decrepit Iranian banks that we don’t control.”
Magazine: Would Bitcoin really be at $200K if not for Jane Street? Trade Secrets


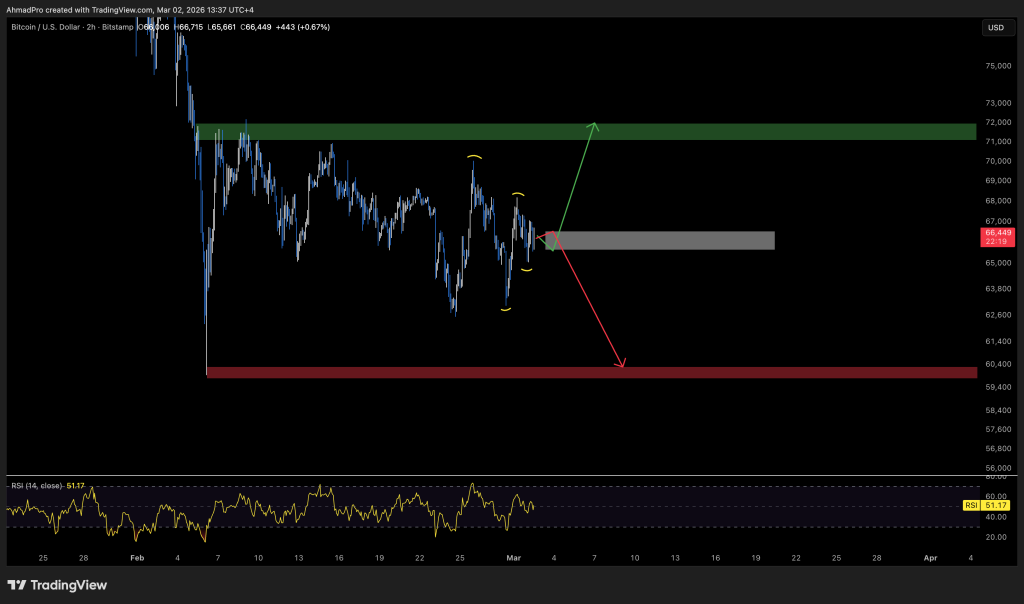
Bitcoin has returned to a key psychological price level as markets bounced back amid ongoing tensions in the Middle East.
Bitcoin prices reached $70,125 in late Monday trading on Coinbase, according to TradingView.
However, it hit resistance there as it did on Feb. 25 and had pulled back slightly to trade at $68,000 at the time of writing during the Tuesday morning Asian trading session. There has been an “insane reversal in the markets,” observed crypto analyst ‘Bull Theory’ on Tuesday.
“Just 24 hours ago, we saw extreme fear and panic when US futures opened Sunday night,” they said. US stock markets and crypto markets have rebounded strongly, they observed before adding:
“Markets don’t hate bad news; they hate uncertainty. Khamenei’s death didn’t spark chaos; it removed ambiguity, and the market priced that in immediately.”
Bitcoin Bucks War Panic Trend
“Traditional ‘risk-off’ playbooks say Bitcoin should be dumping right now,” said Macro outlet Milk Road. “If BTC can maintain this divergence from risk assets during sustained geopolitical stress, the ‘digital gold’ argument finds itself a new tailwind.”
“We understand war headlines make investors nervous, but we expect stocks to be up in March,” commented Fundstrat’s Tom Lee on Monday.
“This is exactly what happened in 2022 when Russia invaded Ukraine,” said analyst ‘CrediBull Crypto’.
They added that the day of the invasion marked a local bottom after months of drawdown, “and we spent a month climbing 40% back to the upside before continuation back down.”
“People’s first inclination during events like this is to panic and sell, which would have made you sell the local bottom in both these instances.”
Meanwhile, CryptoQuant analyst ‘Moreno’ said, “the sell-side pressure from recent buyers is fading. Panic is being replaced by patience, or at least exhaustion.”
“Despite the recent geopolitical escalation involving Iran, a type of event that historically triggers reactive selling, the data shows no meaningful spike in exchange inflows from short-term holders.”
There was no panic profit-taking, no loss capitulation, no reactive behavior from this typically event-sensitive cohort,” he added.
Santiment reported that as markets have rallied, social data indicated there was a “huge surge in positive sentiment as Bitcoin’s price was threatening to fall below $65,000.”
You may also like:
“Discourse is heavily invested in the Iran, Israel, and US conflict currently, so expect volatile movement based on any notable updates with the developments,” it added.
📈 As today’s markets have rallied, social data indicated there was a huge surge in positive sentiment as Bitcoin’s price was threatening to fall below $65K. Over the next 2 hours and 20 minutes, $BTC rallied +7% and reached $69.9K before running into $70K resistance for the time… pic.twitter.com/B3lWwtqABz
— Santiment (@santimentfeed) March 2, 2026
Crypto Market Outlook
Crypto market capitalization has gained 2.6% on the day to reach $2.42 trillion at the time of writing. The move was largely driven by Bitcoin, but Ether also reclaimed the $2,000 level and remains just above it at the time of writing.
Altcoin gains were minimal in comparison to the top two digital assets.
Binance Free $600 (CryptoPotato Exclusive): Use this link to register a new account and receive $600 exclusive welcome offer on Binance (full details).
LIMITED OFFER for CryptoPotato readers at Bybit: Use this link to register and open a $500 FREE position on any coin!
Crypto World
Bitcoin climbs as IBIT posts one of the quarter’s biggest inflow days amid Iran volatility


Bitcoin traded near $68,000 on Tuesday as U.S. spot ETFs pulled in $458 million, according to data curated by SoSoValue, marking one of the quarter’s strongest inflow days despite the ongoing conflict with Iran.
The inflows suggest institutional investors are treating bitcoin’s recent volatility stemming from the war as contained rather than systemic.
Singapore-based trading firm QCP Capital said in a recent note that the roughly $300 million in long liquidations triggered by the weekend headlines were “notable but contained,” arguing that positioning had already been materially lightened in recent weeks.
Options markets told a similar story, QCP wrote, with one-day implied volatility briefly spiking to 93% before quickly retracing, a sign traders were hedging event risk rather than bracing for prolonged escalation.
Meanwhile, U.S. spot bitcoin ETFs added $1.1 billion over three consecutive sessions last week, according to SoSoValue data previously reported by CoinDesk, with BlackRock’s IBIT accounting for roughly half.

Crypto hackers attempting to use “ClickFix” attacks to steal crypto have now turned to impersonating venture capital firms and hijacking browser extensions in their two most recent attacks.
According to a report by cybersecurity firm Moonlock Lab on Monday, scammers are using fake venture capital firms such as SolidBit, MegaBit and Lumax Capital. The hackers are using the firms to contact users via LinkedIn with partnership offers, then funneling them to fake Zoom and Google Meet links.
When a target clicks the fraudulent link, they are taken to an event page featuring a fake Cloudflare “I’m not a robot” checkbox. Clicking it copies a malicious command to the clipboard and prompts the user to open their computer’s terminal and paste the so-called verification code, which executes the attack.
“The ClickFix technique is what makes the final step so effective,” the Moonlock Lab team said. “By turning the victim into the execution mechanism—having them paste and run the command themselves—the attackers sidestep the very controls the security industry has spent years building. No exploit. No suspicious download.”
Moonlock Lab alleges that a person using the name Mykhailo Hureiev, listed as the co-founder and managing partner at SolidBit Capital, has been a primary point of contact for the initial LinkedIn phase of the scam. Two X users have also reported suspicious conversations with a Hureiev account.

However, Moonlock Lab notes that the campaign’s infrastructure is sophisticated and designed to rotate identities as soon as one front is exposed.
Chrome extension hijacked to steal crypto
Meanwhile, crypto hackers have, until recently, been spreading a malicious Chrome extension with a “ClickFix” attack angle.
QuickLens, an extension that lets users run Google Lens searches directly in their browser, was removed from the web store after it was compromised to push malware, John Tuckner, the founder of cybersecurity firm Annex Security, said in a Feb. 23 report.
After QuickLens changed ownership on Feb. 1, a new version was released two weeks later containing malicious scripts that launched ClickFix attacks and other information-stealing tools. Tuckner noted that the extension had around 7,000 users.

The hijacked extension reportedly searched for crypto wallet data and seed phrases to steal funds. It also scraped the contents of Gmail inboxes, YouTube channel data, and other login credentials or payment information entered into web forms, according to a eSecurity Planet report on March 2.
ClickFix attacks are used to target many industries
The ClickFix technique has gained popularity among threat actors since last year, according to Moonlock Lab, because it forces victims to execute the malicious payload manually, bypassing standard security tools.
Related: February crypto losses hit lowest level since March 2025, says PeckShield
However, security researchers have been tracking its use since at least 2024, with targets spanning a wide range of industries.
Microsoft Threat Intelligence sent out a warning in August last year that it had been tracking “campaigns targeting thousands of enterprise and end-user devices globally every day.”
Meanwhile, cyber threat intelligence company Unit42 reported in July last year that the “relatively new social engineering technique” has been impacting industries such as manufacturing, wholesale and retail, state and local governments, and utilities and energy.
Magazine: Would Bitcoin really be at $200K if not for Jane Street? Trade Secrets

XRP price outlook as Ripple Prime connects XRPL to NSCC for post-trade settlement
Lisa Rinna reveals why she 'butted heads a lot' with “Melrose Place” costar Jack Wagner: 'Don't f— with me'

Iranian women’s soccer team refuses to sing national anthem at Asian Cup


-

 Politics4 days ago
ITV enters Gaza with IDF amid ongoing genocide
-

 Fashion4 days ago
Weekend Open Thread: Iris Top
-

 Tech2 days ago
Unihertz’s Titan 2 Elite Arrives Just as Physical Keyboards Refuse to Fade Away
-

 Business6 days ago
True Citrus debuts functional drink mix collection
-
Sports3 days ago
The Vikings Need a Duck
-

 Crypto World7 days ago
XRP price enters “dead zone” as Binance leverage hits lows
-

 NewsBeat5 days ago
Cuba says its forces have killed four on US-registered speedboat | World News
-
 NewsBeat3 days ago
Dubai flights cancelled as Brit told airspace closed ’10 minutes after boarding’
-

 Tech7 days ago
Unsurprisingly, Apple's board gets what it wants in 2026 shareholder meeting
-
 NewsBeat5 days ago
Manchester Central Mosque issues statement as it imposes new measures ‘with immediate effect’ after armed men enter
-
 NewsBeat3 days ago
The empty pub on busy Cambridge road that has been boarded up for years
-

 NewsBeat2 days ago
‘Significant’ damage to boarded-up Horden house after fire
-

 NewsBeat2 days ago
Abusive parents will now be treated like sex offenders and placed on a ‘child cruelty register’ | News UK
-
 NewsBeat6 days ago
Police latest as search for missing woman enters day nine
-

 Entertainment23 hours ago
Baby Gear Guide: Strollers, Car Seats
-

 Business5 days ago
Discord Pushes Implementation of Global Age Checks to Second Half of 2026
-

 Business4 days ago
Only 4% of women globally reside in countries that offer almost complete legal equality
-
 Tech4 days ago
NASA Reveals Identity of Astronaut Who Suffered Medical Incident Aboard ISS
-

 Crypto World6 days ago
Entering new markets without increasing payment costs
-
Politics2 days ago
FIFA hypocrisy after Israel murder over 400 Palestinian footballers