

Crypto World
Ethereum Store Value Debate Heats Up as Analysts Question ETH’s Monetary Value and Market Performance

Key Points
- The success of Ethereum going forward may depend on ETH’s ability to hold long-term monetary value
- With the development of Layer-2 networks, there is debate regarding the impact of Ethereum’s adoption on ETH’s value
- Weakness in ETH prices and lower support levels have raised questions about Ethereum’s economic model
Identity of Ethereum Undergoes Scrutiny Again
Questions have emerged once more about whether Ethereum serves as a good store of value as stakeholders analyze the link between the success of the Ethereum network and the intrinsic value of ETH. This discussion came into focus when comments from one of the co-founders of Bankless were widely shared within the cryptocurrency community.
In his comments, Ethereum was said not to be distinct from its underlying asset. This point led some people to believe that backing the future of Ethereum while disregarding its value was contradictory. This triggered further discussion from different quarters about the economic base of Ethereum.
Layer 2 Expansion Brings Up Value Creation Considerations
Moreover, the discussion grew even more heated when a co-founder of Bankless gave his point of view about how Ethereum creates value. The latter’s consideration was based on the question of whether an increase in blockchain usage means that the value of its token will go up.
The topic has been highly relevant lately due to Layer 2 expansion on Ethereum. Networks built on top of Ethereum perform increasingly more transactions, allowing better scaling and decreasing costs for end users. At the same time, however, it brings up concerns whether the activity conducted on Layer 2 brings direct value for ETH holders.
According to the critics, the broad use of applications does not mean that the demand for tokens goes up as well. The reason behind is that there might be no connection between the network’s development and token growth in case all the actions happen within the apps.
Advocates of Ethereum state that ETH has remained the centerpiece of the ecosystem despite Layer 2 development. ETH still acts as the main asset for staking, is used as a major type of collateral in DeFi protocols, and is one of the sources of network security.
Scarcity and Proof-of-Stake
Ethereum’s shift to proof-of-stake resulted in a reevaluation of its monetary policy. The upgrade implemented a mechanism that allows for the reduction of net ETH creation in periods of high network activity. It has led to the emergence of narratives regarding Ethereum’s supply dynamics among supporters who claim that the token becomes scarce under such conditions.
Supporters believe that the introduction of scarcity will contribute to Ethereum’s attractiveness as an investment. However, skeptics argue that scarcity is not enough to ensure long-term demand due to the rise of competition among new blockchain-based projects that use other technologies to provide services and attract capital at lower costs.
Market Performance Brings Additional Pressure
Market performance recently added yet another aspect to the debate. ETH was trading at $1,669, marking a decline of about 3.7% over the reporting period.
The crypto had been struggling in a crucial support area of $1,725 before undergoing a notable drop. Even though the buyers were able to stop the fall in the $1,650 range, this downturn brought increased focus on the future prospects of the asset.
At this point, the main concern does not revolve around the capability of Ethereum to attract new projects and developers. More and more investors start questioning whether the progress made by Ethereum would eventually lead to an increase in the price of the coin itself.
The further development of the crypto project remains controversial with some investors focusing on the expansion of the ecosystem whereas others place emphasis on the need for ETH appreciation.

Crypto World
Zcash’s Orchard Vulnerability Leaves Users Unable to Verify ZEC Circulating Supply, Says Zooko Wilcox

TLDR:
- Zooko Wilcox confirms users cannot independently verify if ZEC supply was hit by the Orchard flaw.
- The Ironwood upgrade would create a new shielded pool using the patched Orchard circuit upon activation.
- Turnstile mechanisms will block any excess ZEC from exiting the old Orchard pool after Ironwood activates.
- Wilcox says exploitation is unlikely but users should not rely on Shielded Labs’ assessment alone.
Zcash co-founder Zooko Wilcox has confirmed that users currently cannot independently verify whether ZEC’s circulating supply was affected by the recently disclosed Orchard counterfeiting vulnerability.
Wilcox, alongside Jason McGee and Taylor Hornby of Shielded Labs, published a proposal for the Ironwood network upgrade.
The upgrade would restore user-level supply verification through consensus rules. No deployment timeline has been announced.
Wilcox: Privacy Properties of Orchard Block Independent Verification
The Orchard vulnerability was patched through an emergency network upgrade completed on June 2. That fix closed the security gap, but it did not resolve a separate problem.
The privacy architecture of the Orchard pool makes it impossible for users to confirm whether the vulnerability was exploited before the patch.
Wilcox acknowledged that Shielded Labs believes exploitation was unlikely. However, he was direct about the limits of that position.
Users should not have to rely on the team’s assessment when verifying the integrity of the ZEC supply, he stated in the published proposal.
The proposed Ironwood upgrade addresses this gap at the protocol level. It would create a new shielded pool using the corrected Orchard circuit.
Simultaneously, any transaction attempting to create new outputs in the existing Orchard pool would be rejected as invalid.
Once Ironwood activates, users would gain immediate, trustless verification of the circulating supply. They would simply sum the balances across active pools by running a node, with no need to reason about other parties’ actions or wait for fund migrations to complete.
Ironwood’s Two-Outcome Framework Targets On-Chain Evidence of Counterfeiting
Wilcox and his co-authors structured Ironwood around what happens when users begin migrating funds out of the old Orchard pool. The migration process creates conditions that may surface evidence of whether counterfeiting occurred.
Any counterfeiter holding excess ZEC in the old pool would face two options. Moving those funds into the new pool would expose their existence on-chain. Leaving them behind would risk permanent inaccessibility as legitimate users complete their migrations.
Wilcox outlined two resulting outcomes. Under the first, no excess ZEC attempts to exit the old pool. That result would serve as strong on-chain evidence that the vulnerability was never exploited.
Under the second, excess ZEC attempts to cross the turnstile and gets blocked by the protocol, destroying those funds while creating publicly verifiable proof of counterfeiting.
Turnstiles, Zcash’s existing cross-pool accounting mechanism, enforce these rules automatically. They track the total ZEC entering each pool and reject any withdrawal attempt that exceeds the legitimate balance. This prevents excess ZEC from escaping into other pools regardless of outcome.
Wilcox recommended that all wallets supporting the existing Orchard pool add support for the new one ahead of activation.
Existing Orchard addresses would remain valid after Ironwood activates, with incoming ZEC automatically received in the new pool. The team noted that the transition from zcashd to the Zebra node client may affect the upgrade’s timing.

TLDR:
- Peter Schiff warns Bitcoin could plunge to $30,000 if sellers force a decisive break below $50,000.
- Bitcoin’s RSI dropped below 30, highlighting extreme bearish momentum and oversold market conditions.
- Prediction markets assign an 83% probability that Bitcoin trades below $55,000 during 2026.
- BTC remains trapped between $60K and $61.8K as traders await a breakout from consolidation.
Bearish sentiment about BTC intensified across markets following renewed warnings from economist Peter Schiff in recent sessions.
Schiff predicted a potential drop toward $30,000, arguing that complacency among investors remains at excessively high levels.
He stated that a break below $50,000 could trigger a rapid move toward lower levels in markets. He suggested that Market sentiment remains fragile amid macroeconomic uncertainty.
Market data shows Bitcoin RSI falling below 30, indicating strong selling pressure in recent sessions. However, readings below 30 sometimes signal oversold conditions that can precede short-term relief rallies in markets.
Furthermore, Strategy’s sale of 32 Bitcoins worth approximately $2.5 million during the late May period marked a bearish transition for traders. This marked their first reduction since 2022.
Polymarket contracts saw about $15 million in trading volume tied to Bitcoin price outcomes recently. Traders are still monitoring macroeconomic signals for direction. Sentiment remains cautious among institutional investors.
Schiff Warns of Deeper Market Correction
Peter Schiff reiterated expectations of a deeper Bitcoin correction, citing persistent investor complacency across current market conditions. He argued that a break below $50,000 could accelerate selling toward $30,000 levels rapidly in markets.
Market observers remain divided on near-term Bitcoin trajectory. He also suggested Bitcoin weakness could signal broader risk asset declines across markets globally.
He questioned whether Bitcoin would act as a harbinger for wider financial turbulence globally. Risk sentiment across crypto markets remains highly reactive.
He linked Bitcoin weakness to political debates surrounding proposed strategic Bitcoin reserve policies in the United States.
He claimed that pressure could build from crypto supporters seeking government-backed interventions in the future. Regulatory discussions continue to influence investor positioning.
Market Structure and Technical Pressure Intensify
Bitcoin traded in a narrow consolidation range between $59,300 and $61,800 during recent sessions this week. Analysts noted repeated resistance near $61,500 as bullish momentum continued to weaken in markets.
Price action showed lower highs forming after an initial sharp upward spike earlier. A brief dip below $60,000 suggested stop-loss activity and liquidity-driven volatility recently. Support remained concentrated near $60,000 while resistance held between $61,500 and $62,000 levels.
Market participants awaited a breakout direction as trading volume gradually declined recently. Volatility remains elevated across major trading sessions. Short-term traders reacted quickly to intraday price swings.
Market makers adjusted positions throughout the session. Liquidity conditions appear thinner during consolidation phases. Investors await clearer directional signals.
Crypto investors endured one of their toughest week in years as a wave of selling wiped out hundreds of billions of dollars from digital asset markets.
Bitcoin fell 17.3% this week while ether (ETH) dropped 22%, putting both assets on track for their largest weekly declines since November 2022, when the collapse of Sam Bankman-Fried’s FTX exchange triggered a market-wide panic.
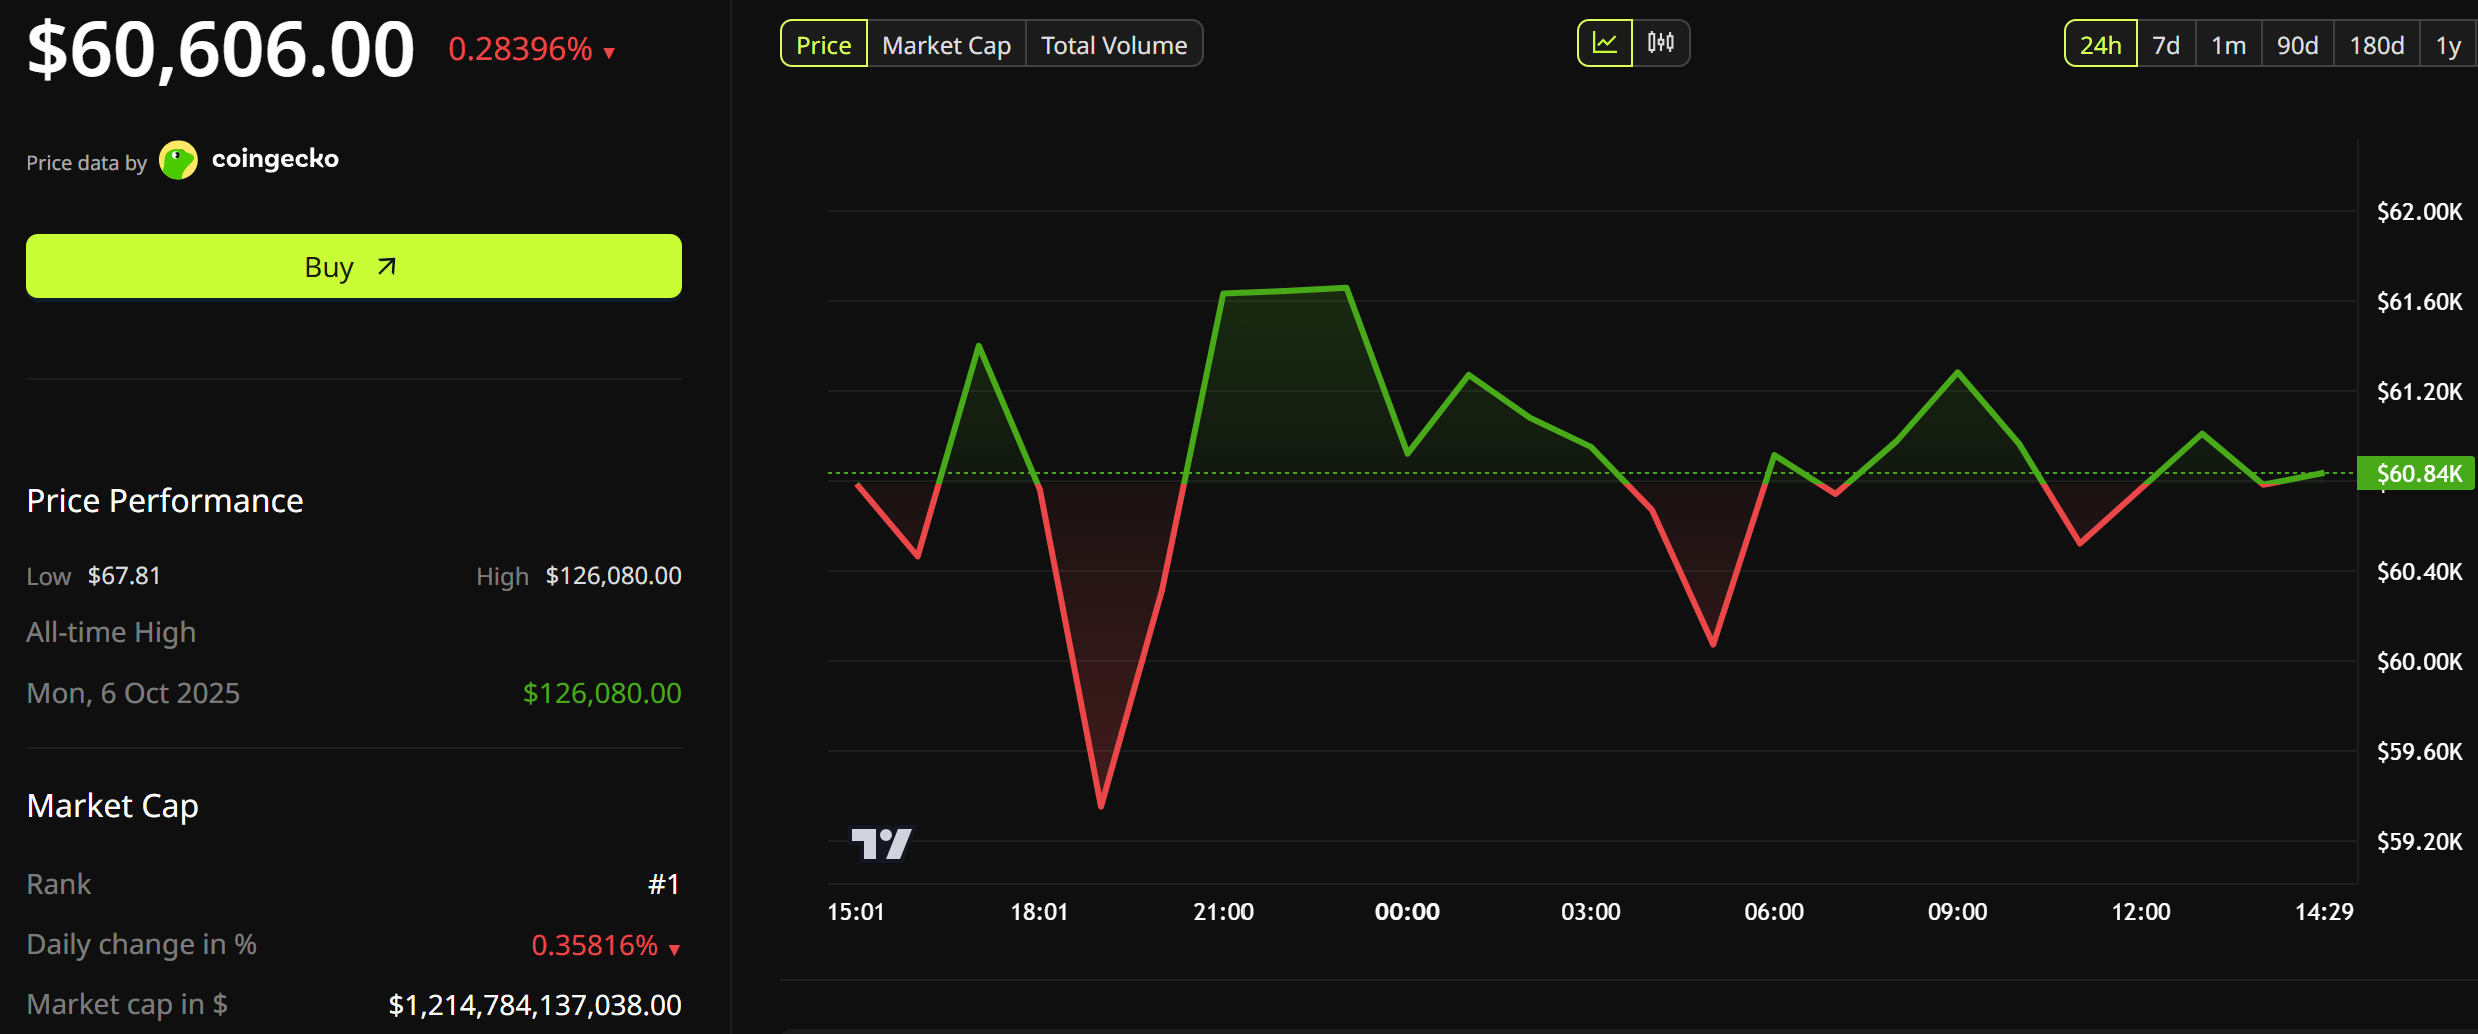
Despite a modest stabilization on Saturday, both assets remained near their lows, with BTC trading just above $60,000 and ETH changing hands around $1,550.
The damage extended far beyond the two largest cryptocurrencies. The digital asset market shed roughly $390 billion in value during the week, leaving total market capitalization hovering just above $2 trillion, according to TradingView data. That’s less than half of the nearly $4.2 trillion peak reached in October.
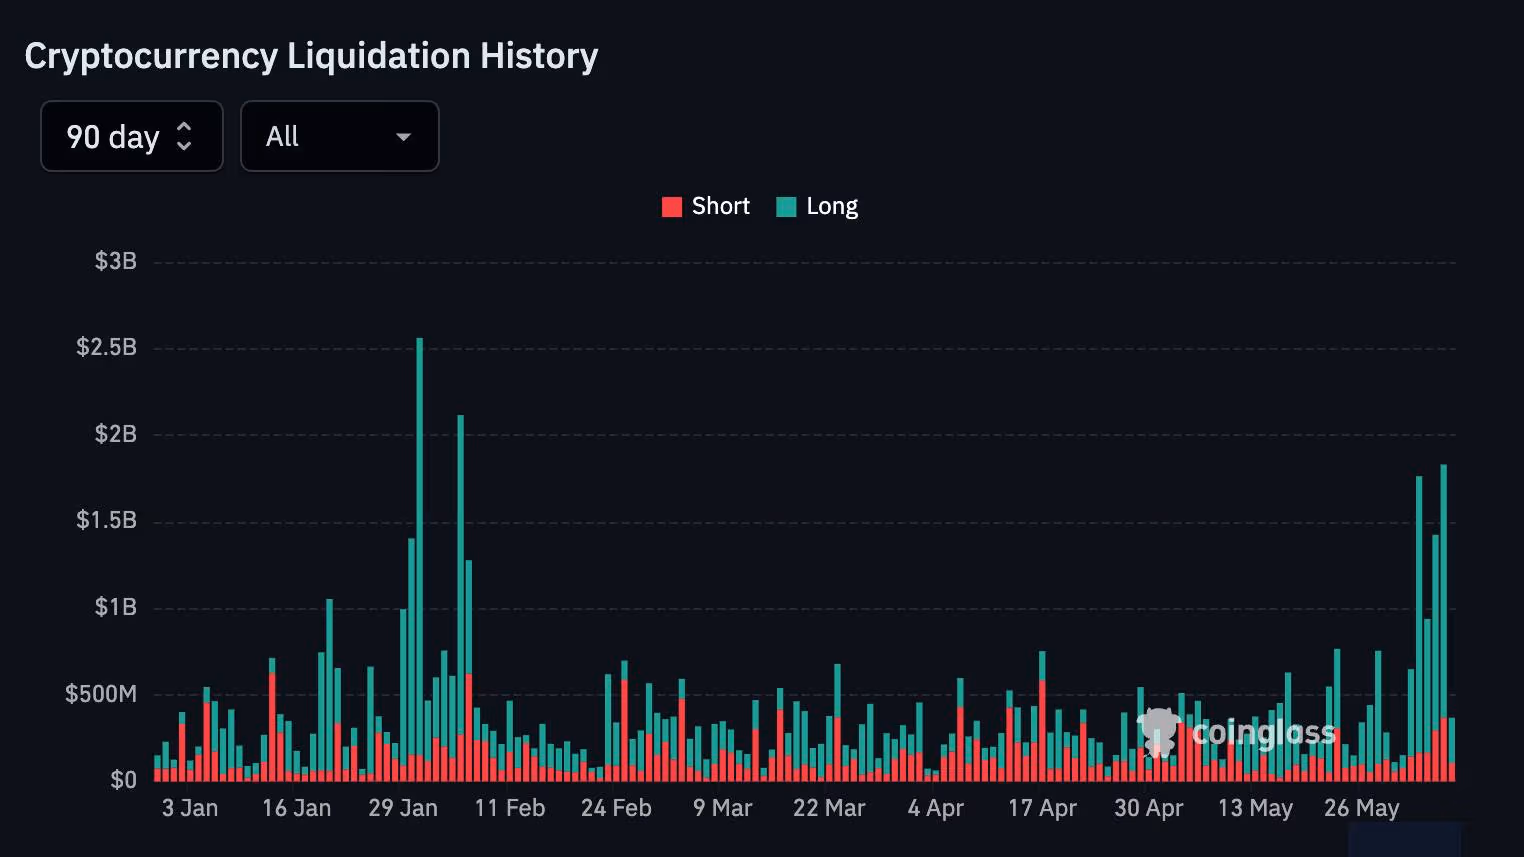
It wasn’t just prices that got hit. Crypto derivatives traders suffered one of the largest wipeouts of this year.
Roughly $7 billion in leveraged positions were liquidated across digital assets during the week, according to CoinGlass data, with Monday and Friday delivering the most severe flushes.
About $5.7 billion of those were long positions, or bullish bets on higher prices.

Why crypto crashed this week
The selloff came as several bearish forces converged at once.
Starting the week, Strategy (MSTR), the largest corporate holder of bitcoin, disclosed it sold BTC for the first time in nearly four years. The transaction was negligible — just 32 BTC worth roughly $2.5 million — but the sale rattled investors who had long viewed Michael Saylor’s company as a perpetual source of demand.
Investors also began questioning whether Strategy may need to sell additional bitcoin to help cover obligations tied to its growing stack of preferred equities.
At the same time, bitcoin ETFs continued to bleed assets. K33 Research head Vetle Lunde argued earlier this week that some of those outflows reflected a broader rotation of capital away from crypto and into artificial intelligence (AI) investments.
With AI-related stocks pushing to record highs and investors anticipating potential IPOs from companies such as OpenAI, Anthropic and SpaceX, “the opportunity cost of holding BTC” has become increasingly difficult for some investors to ignore, Lunde said.
Concerns about AI’s ability to expose flaws in crypto protocols also added to the pressure. Zcash (ZEC), one of the best-performing cryptos earlier this year, tumbled more than 40% after researchers used Anthropic’s latest AI model to uncover a critical vulnerability in the network’s privacy system.
The final blow came with Friday’s stronger-than-expected U.S. jobs report, forcing investors to rethink the Federal Reserve’s next move. Markets that earlier this year anticipated rate cuts are now increasingly expect that the central bank could hike if inflation remains stubbornly high.
U.S. Treasury bond yields surged, while the Nasdaq 100 suffered its worst day since the tariff-driven selloff in April 2025, snapping a record-setting rally that had fueled much of Wall Street’s enthusiasm this year.
For now, the selling appeared to have paused with traditional markets closed for the weekend and crypto prices stabilizing on Saturday.
Whether this week’s rout marked the capitulation that often comes at market bottoms or was merely the latest episode in the downtrend may come down to the broader macro picture. Higher bond yields, rate-hike fears and continued competition from AI investments and IPOs remain key hurdles for the recovery.
TLDR:
- Solana RSI oversold signal falls below 2022 FTX-era lows as momentum weakens across charts
- SOL drops nearly 80% from highs, printing eight consecutive red monthly candles in trend
- URPD shows heavy supply concentration between $76 and $83, forming a strong resistance zone
- Key support zones emerge at $53, $35, and $24 as liquidity thins below current price levels
Solana RSI oversold signal has caught market attention as Solana extends its steep correction from recent highs. Market momentum has weakened across multiple timeframes.
Meanwhile, traders are comparing it to the historical FTX-era crash that led to high on-chain distribution and liquidity conditions across markets.
Momentum Breakdown Mirrors FTX-Era Stress Levels
The Solana RSI oversold signal reflects extreme downside momentum across monthly charts and broader crypto market structure. Current readings show a weakening market structure across long-term timeframes today.
Price action confirms sustained selling as Solana extends its longest red monthly streak in recorded market history.
Market participants track momentum divergence as RSI drops below levels seen during the 2022 FTX crash period.
This reading signals stronger bearish pressure than the FTX crash phase recorded earlier in previous market cycles now.
Derivatives traders reduced exposure as volatility expanded across spot and futures markets under sustained liquidation pressure.
Analysts observe eight consecutive red monthly candles that confirm persistent distribution behavior across extended correction phases in market cycles.
The Solana RSI oversold signal aligns with weakening liquidity conditions across exchanges and broader trading environments today globally.
URPD Structure Maps Key Liquidity Zones
URPD data maps strong accumulation clusters between $76 and $83 across historical Solana holder cost basis zones.
These zones act as resistance as price trades below prior holder cost bases during the ongoing market correction phase.
Sellers reappeared near breakeven levels and reinforced pressure around key supply pockets during recovery attempts in market conditions.
Below current levels, URPD shows thinner liquidity until the $53 support zone becomes active in market structure now.
Market structure weakens further if selling pressure pushes toward mid-range clusters across lower liquidity zones, forming ongoing pressure.
Traders monitor these zones closely to identify potential reversal or continuation signals in volatile conditions across markets.
Analysts’ Crypto Patel reports show accumulation activity between $70 and $50 during extended correction phases in spot markets.
Long-term holders position for recovery targets extending toward higher valuation zones across multi-year outlook frameworks in market conditions.
Market participants are watching liquidity pockets at $35 and $24 for deeper support during ongoing analysis of extended drawdown phases.
TLDR:
- Glassnode data shows Bitcoin long-term holders shifting from distribution to re-accumulation phase
- Bitcoin tests $60K support while RSI nears 15, signaling oversold momentum conditions now
- Price structure shows lower highs and potential double-bottom forming near key support zone
- Reduced liquid supply from long-term holders may strengthen price response if demand remains stable
Bitcoin is experiencing a notable shift in long-term supply behavior alongside a critical technical test in price structure.
Glassnode’s Old Supply Net Position Change metric has moved back into positive territory after nearly two years of sustained distribution.
Bitcoin held for more than six months is now being accumulated rather than spent. This change coincides with broader adjustments in spot and derivatives market activity.
Long-term Holders Return to Accumulation after Extended Distribution Phase
Glassnode data previously showed prolonged negative readings as long-term holders reduced exposure during price rallies.
These distribution phases aligned with the 2024 and 2025 uptrends when veteran investors realized profits at elevated levels.
This selling increased circulating supply and supported absorption from institutional and retail demand. On-chain data suggests this phase marked consistent profit realization during upward price movements.
The current transition shows the indicator crossing above zero after an extended negative period. Data indicates that dormant coins beyond six months are no longer actively spent.
Instead, inactive Bitcoins are rising as holders keep coins off exchanges. Exchange flow data reinforces the view that supply was actively redistributed during the earlier phase.
Market participants now interpret the change as a shift in holder psychology toward longer holding periods. Even near elevated price levels, long-term investors appear less willing to liquidate positions for profit.
This behavior reflects expectations of continued market strength or higher future valuation. The absence of aggressive selling supports strengthening conviction among holders.
Bitcoin tests key $60,000 support as RSI signals extreme oversold conditions
Bitcoin trades near a critical support zone between $60,000 and $61,000 during the ongoing corrective phase. The level has repeatedly acted as a structural floor throughout the current market cycle.
Price action continues to show lower highs and lower lows since the cycle peak. Market volatility has compressed around this level as buyers and sellers contest direction.
Technical indicators show RSI near 15, indicating deeply oversold market conditions. Historically, such readings have coincided with selling exhaustion and potential relief rebounds.
Market participants note that weak hands typically exit positions during these momentum extremes. Such technical alignment often attracts attention from traders seeking short-term reversal opportunities.
The $60,000 level represents both psychological and technical support for Bitcoin. A sustained hold could shift market structure toward accumulation and potential recovery.
Price action over the next sessions may determine whether consolidation or recovery develops. A breakdown below this zone would expose the market to deeper downside pressure.
TLDR:
- BitMEX Research disputes claims of $64B spent vs $50B BTC value, calling it an incomplete accounting view
- Strategy raised capital via premium stock issuance, boosting shareholder value beyond Bitcoin price
- Michael Saylor Bitcoin Strategy spans multiple cycles, combining cash, debt, and equity funding
- Debate centers on valuation method, not BTC holdings, amid volatile crypto market conditions
Michael Saylor’s Bitcoin Strategy has returned to the spotlight after Arkam data suggests that Strategy spent nearly $64 billion acquiring Bitcoin, which is now worth considerably less.
However, new analysis argues the narrative overlooks how the company generated shareholder value while building one of the largest corporate Bitcoin positions in history.
BitMEX Research Pushes Back Against $14 Billion Loss Claims
The latest debate emerged after data circulated online suggesting that Michael Saylor’s company spent roughly $64 billion to accumulate Bitcoin, which is currently valued at near $50 billion. Critics quickly framed the difference as evidence of a multibillion-dollar paper loss.
Some observers questioned whether Strategy’s aggressive accumulation model had exposed shareholders to excessive risk.
The discussion focused primarily on Bitcoin’s current market value compared to the total capital deployed over several years.
However, BitMEX Research challenged that conclusion. In a public response, the research firm argued that measuring Strategy’s performance solely through Bitcoin’s market value presents an incomplete picture.
According to the firm, Michael Saylor generated substantial shareholder value by issuing stock at significant premiums while demand for Strategy shares remained elevated.
BitMEX Research noted that although Bitcoin’s price may have declined from certain purchase levels, the company benefited from investors willingly paying premium valuations for exposure to its Bitcoin-focused corporate structure. As a result, shareholder value creation extended beyond Bitcoin’s spot price performance.
Michael Saylor Bitcoin Strategy Centers on Long-Term Capital Allocation
The Michael Saylor Bitcoin Strategy has never been based on short-term price movements. Since initiating Bitcoin purchases in 2020, Strategy has consistently accumulated the asset through market rallies, corrections, and prolonged downturns.
The company initially deployed cash reserves before expanding acquisitions through convertible notes and equity offerings.
Rather than pausing purchases during volatile periods, Strategy continued increasing its Bitcoin holdings across multiple market cycles.
Saylor has repeatedly described Bitcoin as a superior store of value and a scarce digital asset capable of preserving purchasing power over long periods. Under that framework, temporary drawdowns are viewed differently from traditional investment losses.
Supporters of the strategy argue that the strategy effectively transformed itself into a publicly traded vehicle offering leveraged Bitcoin exposure.
This structure enabled the company to access capital markets while benefiting from strong investor demand for its shares.
Critics remain focused on concentration risk and the company’s dependence on Bitcoin’s future performance. Yet the current debate increasingly revolves around valuation methodology rather than Bitcoin ownership itself.
For now, BitMEX Research maintains that Michael Saylor is assuming the shareholder value created through premium stock issuance.
As Bitcoin continues to fluctuate, the discussion surrounding Strategy’s approach remains one of the most closely watched narratives in corporate finance and digital assets.
Crypto World
Senator Cynthia Lummis Calls CLARITY Act the Most Consequential Financial Legislation of This Generation
TLDR:
- Senator Cynthia Lummis describes the CLARITY Act as the most consequential financial bill today.
- The legislation establishes clear SEC and CFTC oversight rules for digital asset classification.
- Tokens meeting decentralization standards may transition from securities to commodities oversight.
- Senate negotiations continue on stablecoins, DeFi protections, and expanded crypto tax reporting
CLARITY Act advances in the United States Congress as lawmakers shape a digital asset regulatory framework during the 2026 legislative cycle.
Senator Cynthia Lummis describes the CLARITY Act as a defining financial legislation effort in the ongoing Senate discussion.
Lawmakers passed the bill in the House in July 2025 and advanced Senate committee versions in the 2026 stage. Negotiations are still ongoing over stablecoin rules, DeFi treatment, and tax reporting requirements within the Senate framework committees.
Congress advances CLARITY Act with SEC and CFTC division model
Lawmakers advanced the CLARITY Act after the House passed it with bipartisan support in July 2025, final vote. Senate committees reviewed the legislation and approved versions for consolidation into a unified draft process stage in the 2026 cycle.
Senator Cynthia Lummis played a central role in shaping regulatory language and the bipartisan coordination process.
The CLARITY Act establishes a framework that divides SEC and CFTC authority for digital asset classification system rules structure.
Classification depends on decentralization, control, and network structure under federal regulatory criteria applied across the token assessment process framework. Assets that pass the mature blockchain test may shift from SEC oversight to CFTC jurisdiction over time.
Market participants monitor classification outcomes as they affect compliance planning across crypto industries under an evolving regulatory framework.
Industry stakeholders are evaluating how decentralization thresholds may influence long-term token governance structures across blockchain networks review process stage.
Developers and exchanges adjust operations based on regulatory expectations and classification outcomes within the compliance planning cycle framework stage.
Stablecoin rules and exchange oversight in CLARITY Act framework
Senate negotiators are reviewing stablecoin provisions within the CLARITY Act framework during the ongoing legislative discussion stage cycle.
Provisions address restrictions on yield-like rewards and define boundaries for stablecoin financial activity under regulatory framework review process.
Final rules depend on Senate agreement and technical drafting between committees for the final legislative approval process.
The CLARITY Act requires centralized exchanges and intermediaries to register under CFTC oversight framework for compliance enforcement.
Registration introduces customer protection reporting and transparency obligations similar to traditional financial markets within a regulated system framework.
The bill expands tax reporting definitions, requiring more broker disclosures through Form 1099-DA filings to the Internal Revenue Service.
The Blockchain Regulatory Certainty Act provision is meant to protect non-custodial developers within a decentralized protocol framework under specific legal conditions.
It distinguishes decentralized protocols from custodial intermediaries that control user assets directly under regulatory classification rules framework.

Bitcoin is trading amid unusually deep selling pressure, with on-chain momentum and widely watched momentum indicators signaling an extreme oversold state. The daily relative strength index (RSI) has slid toward the mid-teens, marking the most oversold reading since the March 2020 COVID crash. After a roughly 30% drop over the last month, bulls are clinging to the $60,000 level as analysts weigh whether a meaningful relief rally could unfold in the near term.
Key takeaways:
- Bitcoin’s daily RSI sits near 15.5, its lowest level since the COVID-era selloff in March 2020.
- Historical precedents show that similar oversold readings in 2020 and February 2026 preceded notable rebounds of roughly 50% and 30%, respectively.
- BTC has held above $60,000 despite heavy selling, with a potential move toward the 20-day exponential moving average near $70,650 if demand returns.
- A decisive break below $60,000 could open the door to a deeper slide into the mid-$50,000s, undermining the bounce setup.
- On-chain stress signals point to concentrated selling among newer entrants, with around 5.3 million BTC held by short-term holders underwater and long-term holder supply exceeding 15 million BTC.
Oversold RSI sets the stage for a potential relief move
As of the latest session, Bitcoin’s RSI hovered around 15.5, placing it in territory typically associated with short-term exhaustion and potential capitulation relief rallies. The move comes after a sharper-than-average decline that has erased a significant portion of recent gains and revived conversations about whether a bottom is in place.
Market context remains unsettled. Geopolitical tensions, higher oil prices, and fading expectations for a 2026 Federal Reserve rate cut have all contributed to risk-off sentiment. The price action has been framed by sharp, near-term catalysts, including Strategy’s latest Bitcoin sale, which added to selling pressure in some pockets of the market. For readers and traders, that confluence is a reminder that macro headlines can compound oversold dynamics, even if a short-term bounce appears plausible from a technical standpoint. For reference, recent related developments have been covered by Cointelegraph links to geopolitical risk threads and macro commentary.
Historically, severe RSI overshoots have sometimes foreshadowed relief rallies as buyers seek to step in at perceived bargain levels. In the COVID crash era, Bitcoin’s RSI around 15.5 preceded a substantial rebound aided by accommodative policy moves. In one notable episode, the late-stage oversold signal was followed by a rally of roughly 50% in the ensuing months as liquidity and risk appetite rebounded. The comparison matters because it underlines a recurring theme in crypto markets: extreme oversold readings often coincide with late-stage capitulation, creating a setup for a technical bounce if demand returns.
Support under pressure, but the floor at $60k holds for now
Despite relentless selling, Bitcoin has defended the key $60,000 support level. The lack of a decisive breakdown at this level—despite heavy volume—suggests that sellers may be exhausting, opening room for a relief move if buyers re-enter. A bounce toward the 20-day exponential moving average, currently around $70,650, would fit a classic oversold-to-relief pattern, potentially setting the stage for a multi-week recovery should the macro backdrop stabilize.
On the flip side, a confident break below $60,000 would weaken the rebound thesis and could accelerate a test of the mid-$50,000s. That scenario would not only prolong the risk-off phase but could also invite further on-chain stress as capitulation dynamics re-emerge. In that sense, technicians and traders alike are watching not just the price level itself but the accompanying order-flow and volume signals that could confirm or deny the nascent relief rally.
On-chain stress indicators illuminate near-term fragility
From an on-chain perspective, stress signals are pronounced. Checkonchain data highlighted by crypto analyst Scott Melker show that short-term holders are realizing large losses, a dynamic that often accompanies rapid price declines and can cap any immediate bounce. The profit-and-loss (P/L) ratio for short-term holders has dropped to a new all-time low, indicating a higher likelihood of near-term selling pressure as newcomers exit positions at a loss.
“Sentiment has tracked price almost perfectly,” Melker noted, adding that traders were euphoric at the May peak and then faced despair by early June — a pattern that has historically preceded a bottom, though not always in a uniform fashion.
Further tailwinds for the bears come from the long-term holder segment. Roughly 5.3 million BTC held by long-term investors are currently underwater, a figure that climbs past the post-FTX low and sits at the highest since the COVID crash. This concentration of underwater positions among long-term holders signals that a broad portion of the investor base is facing a costly retracement, which historically has spurred a willingness to wait out volatility rather than chase fresh positions at elevated risk.
For broader context, the literature on Bitcoin’s macro cycles remains mixed. The market has seen dramatic drawdowns followed by outsized rebounds in the past. After the FTX collapse, Bitcoin bottomed near $15,500 and later surged more than sixfold to around $126,000 in 2025. The COVID-driven decline earlier in the decade produced an even more dramatic advance, underscoring the potential for outsized moves from deeply oversold conditions, even if the timing and catalysts vary each cycle.
These on-chain signals do not guarantee a bottom or a rapid reversal, but they provide valuable context for traders looking for the next foothold. The combination of an oversold RSI, a stubborn $60,000 floor, and heavy underwater exposure among both short- and long-term holders suggests investors should be prepared for a choppy ride in the near term, with a clear watch on whether demand re-emerges to sustain any upside move.
For readers seeking a broader frame, some market observers have pointed to a pattern of relief rallies following deep oversold readings during periods of macro uncertainty. In February 2026, when the RSI touched a comparable low around 15.86 while price hovered above $60,000, Bitcoin advanced toward roughly $82,850, illustrating that oversold conditions can coincide with substantial, albeit not guaranteed, counter-moves. The present setup bears similarities to that moment, though the current macro complexity adds layers of risk for any potential bounce.
What investors should watch next
Looking ahead, the critical juncture remains at the $60,000 level. A robust defense there would keep alive the case for a relief rally toward the 20-day EMA near $70,650, offering a path to a short-to-medium-term relief trade if macro catalysts stabilize. A decisive break below $60,000 would raise the odds of revisiting the mid-$50,000s, challenging the bulls’ conviction and inviting further on-chain stress as new entrants rethink positions.
Beyond price and RSI, investors should monitor on-chain metrics for signs of exhausted selling and renewed demand. The trajectory of long-term holder supply, the rate of new coin creation and distribution, and the behavior of short-term holders in the wake of renewed liquidity will be telling indicators of whether this oversold episode morphs into a durable bottom or remains a precarious zone of accumulation and risk-off trades.
As always, readers should pair technical and on-chain signals with macro developments and liquidity conditions. The coming weeks will reveal how much of the current price action is driven by structural shifts in demand versus transient headlines, and whether the market can sustain a bid that takes BTC toward higher targets or whether volatility will keep traders in a high-alert posture.
In short, the extreme oversold signal is a meaningful data point to watch for potential near-term upside, but the path forward hinges on whether buyers can absorb selling pressure and push price beyond the defining $60,000 floor with conviction. Until then, traders will likely remain nimble, weighing risk and reward as new information unfolds.
Readers should stay tuned for updates on macro policy expectations, evolving on-chain signals, and potential shifts in liquidity that could alter the balance of power between bears and bulls in the weeks ahead.
Michael Saylor doubled down on his Bitcoin conviction today, but while he did that, his MicroStrategy CEO, Phong Le, sold roughly $11.1 million in company stock tied to the same exposure.
The timing drew attention across crypto markets. Saylor frames Bitcoin as the premier long-term asset, yet the executive running his company trimmed shares that give investors leveraged exposure to that same bet.
Michael Saylor’s Conviction Meets an Inconvenient Sale
Saylor posted his message as Bitcoin hovered just above the $60,000 threshold, only hours after a brief break below that critical psychological level for the first time in years.

He argued the AI capital boom validates Bitcoin rather than threatening it.
“The AI buildout is absorbing capital at historic scale, creating temporary pressure across global markets. That does not weaken Bitcoin. It strengthens the case for scarce, liquid, digital capital. Bitcoin remains the premier asset for the long term,” Saylor explained.
Follow us on X to get the latest news as it happens
It comes amid market uncertainty as the pioneer crypto continues to show weakness. Some associate that weakness with the latest MicroStrategy BTC sale, a move seen as a symbolic crack in the “never sell” fortress.
In some ways, it eroded faith in MicroStrategy as pure BTC proxy.
To worsen the matter, a regulatory filing shows that on June 5, Le filed to sell 93,738 MicroStrategy (MSTR) shares at a weighted average near $118.73. The proceeds came to about $11.1 million.
It is imperative to note that the sale may not necessarily be a bearish call.
It covered the tax bill on 190,740 performance stock units that vested on June 3. Le still holds 119,925 Strategy shares. Notwithstanding, the timing raises concerns.
“Not a good time to do this,” analyst Ted Pillows remarked.
Why the Optics Sting
The vesting itself sharpens the irony. Those units paid out at 200% because Strategy’s three-year total return ranked in the top quartile of the Nasdaq Composite. The reward for years of outperformance landed in the worst week of the year.
MicroStrategy trades as a leveraged Bitcoin proxy. Investors buy it for the firm’s huge BTC treasury and Saylor’s refusal to sell.
The sales ran through a Rule 10b5-1 plan set in May 2024, so the timing was automatic rather than chosen.
Even so, the company recently made a dividend-driven Bitcoin sale of 32 BTC, its first since 2022.
Critics have long warned about a MicroStrategy problem for Bitcoin, and the move reopened the maximalism debate among holders.
The Bitcoin price showing weakness heading into this weekend leaves Saylor’s long-term thesis and his CEO’s tax bill colliding in public view.
The post MicroStrategy CEO Sells $11 Million Worth of Shares appeared first on BeInCrypto.


Here is a pattern that should not make intuitive sense. Cardano’s ADA token has collapsed to four-year lows below $0.20, down more than 90% from its 2021 peak, in one of the worst stretches the ecosystem has ever faced.
Summary
- Cardano’s ADA has fallen to multi-year lows below $0.20, while active addresses reached a four-month high and social dominance climbed near its 2026 peak.
- Santiment data shows network activity and social engagement increased during the selloff, highlighting a rare divergence between price action and user attention.
- The surge in activity could reflect either accumulation by long-term holders or heightened selling and speculation as the ecosystem faces governance and development challenges.
Its founder warned of a coming “wave of failures,” a respected developer firm shut down, the community voted against funding its own flagship conference, and Charles Hoskinson announced he was taking a break. And yet, while the price cratered, Cardano’s social activity did the opposite of what you would expect.
According to on-chain analytics firm Santiment, ADA’s active addresses hit a four-month high and its social dominance, the share of crypto conversation devoted to it, climbed near its 2026 peak precisely as the price hit bottom.
More people are talking about Cardano and using its network at the exact moment its token is worth the least in years. This divergence between collapsing price and surging attention is one of the more interesting signals in crypto right now, because it could mean two completely opposite things.
This piece explains what the data shows, why it happens, and how to tell whether it is a bottom signal or a warning.
The divergence, precisely stated
Start with exactly what the data shows, because the specifics matter for interpreting it.
On the price side, the collapse is severe and well-documented. Cardano (ADA) price fell below $0.20 to its lowest level in over five years, down roughly 90% or more from its 2021 all-time high near $3.09. The drop accelerated through a brutal market-wide selloff and a cascade of Cardano-specific bad news: the shutdown of the analytics firm TapTools, Hoskinson’s public warning of a “wave of failures” in the ecosystem, the community’s vote against funding the 2026 Cardano Summit, and the founder stepping back with a terse message that he was taking a break.
On the attention side, the numbers ran the other way. Santiment data showed Cardano’s active addresses climbing to a four-month high even as the price fell, meaning more distinct wallets were transacting on the network during the crash than in the preceding months. At the same time, ADA’s social dominance, a measure of how much of the total crypto conversation across social platforms is about a given asset, rose to near its peak for 2026. So on two independent measures, on-chain usage and social chatter, Cardano activity surged while its token cratered.
This is the divergence, and it is worth being precise about why it is strange. Normally, price and attention move together. Rising prices generate excitement, which drives social chatter and draws users onto the network; falling prices generate silence as people lose interest and drift away. The intuitive expectation during a 90% founder-is-taking-a-break collapse would be declining engagement, fewer active addresses, and fading social presence. Cardano did the opposite. Understanding why requires looking at what actually drives social activity, and the answer is that attention is not the same as optimism.
Why attention spikes when price crashes
The counterintuitive truth is that dramatic price crashes often generate more social activity than steady rallies, and the reasons are rooted in how people behave around money and drama.
The first driver is simply that crises are interesting. A token quietly grinding higher generates contentment, and contentment is quiet. A token collapsing to four-year lows while its founder warns of ecosystem failures and walks away generates argument, anxiety, blame, and analysis, and all of that is loud. The Cardano story in early June had everything that drives engagement: a dramatic price move, a charismatic and polarizing founder behaving unusually, an existential debate about the project’s future, and a community split between defenders and critics. Drama drives clicks and posts in a way that calm never does. Social dominance measures volume of conversation, not sentiment, so a flood of worried, angry, and argumentative posts pushes the metric up just as effectively as celebration would.
The second driver is the active-address spike, which has its own logic. When a token crashes hard, on-chain activity often increases instead of falling, because crashes force action. Holders move tokens to exchanges to sell. Bargain hunters open positions to buy the dip. Liquidations and margin calls trigger forced transactions. Long-term holders reshuffle. Panic and opportunism both produce on-chain transactions, so a four-month high in active addresses during a crash does not necessarily mean a wave of new believers arriving. It can equally mean a wave of existing holders capitulating, traders speculating on the bottom, and capital changing hands at high speed. The metric counts activity, not conviction.
The third driver is specific to Cardano’s situation: the community itself is famously large, devoted, and vocal. Cardano has one of the most committed retail followings in crypto, and a crisis mobilizes that community rather than silencing it. Defenders rally to argue the technology is sound, and the sell-off is overdone. Critics seize the moment to say they were right all along. The governance fight over the treasury and the canceled summit gave that community concrete things to argue about. A devoted base under attack generates more conversation, not less, which is why an embattled Cardano can dominate social feeds even as its token dominates the loss leaderboards.
So the divergence resolves once you separate attention from approval. Surging social activity during a crash is not evidence that people are bullish. It is evidence that people are engaged, and engagement during a collapse is driven as much by fear, anger, and opportunism as by faith. The question that actually matters is which of those is dominant, and that is where the interpretation splits.
The bullish reading
There is a genuine case that the activity surge is a positive signal, and it rests on a well-known piece of market psychology.
The contrarian principle holds that market bottoms tend to form at the point of maximum pessimism, when sentiment is worst, and capitulation is heaviest. In this framing, the surge in active addresses and social dominance during the crash is exactly what a bottom looks like. The four-month high in active addresses could reflect bargain hunters and long-term believers stepping in to accumulate at four-year lows, quietly buying what panicked sellers are dumping. The spike in social dominance could reflect the kind of peak attention that often coincides with capitulation, the moment when everyone is talking about how bad it is, which historically is closer to the bottom than the top.
There is supporting logic in the on-chain behavior. When active addresses rise during a price crash, one interpretation is accumulation: strong hands taking advantage of weak hands, moving coins from sellers who have given up to buyers positioning for a recovery. If that is what is happening on Cardano, then the activity surge is the footprint of smart money entering, and the crash is transferring ADA from short-term holders to long-term ones, the classic precondition for a base to form. The devoted community, in this reading, is not just talking; it is buying, and the elevated engagement is the sound of conviction being tested and held.
The bullish case also points to the fundamentals that have not changed. Cardano’s underlying technology, its peer-reviewed development approach, and its roadmap items like the Midnight privacy project and Hydra scaling did not break during the crash. If the activity surge reflects a community that is mobilizing to support the ecosystem through its hardest moment, and if that translates into resolving the treasury fight and funding development, then the crash could mark the bottom of a confidence trough that the network climbs out of. Maximum pessimism, maximum attention, capitulation selling, and accumulating believers: assemble those, and you have a plausible bottom.
The bearish reading
The opposite interpretation is equally coherent, and it is the one the broader context arguably supports more.
In the bearish framing, the activity surge is not accumulation but distribution and panic. The four-month high in active addresses is holders rushing to exit, moving ADA to exchanges to sell before it falls further, plus traders piling into short positions and liquidations forcing transactions. On this reading, the elevated on-chain activity is the footprint of people leaving, not arriving, and the social dominance spike is fear and recrimination, not engaged optimism. A community arguing bitterly about whether the project is dying is generating enormous social volume, but the content of that conversation is anxiety, not conviction.
The context strengthens this reading. This is not a crash happening against a healthy backdrop where contrarian accumulation makes obvious sense. It is a crash accompanied by genuine structural problems: a founder publicly warning of a “wave of failures,” a real developer firm actually shutting down, a governance deadlock preventing the ecosystem from deploying its own treasury to defend itself, and the founder stepping away at the worst moment. When the attention surge coincides with deteriorating fundamentals rather than just a price dip, the “maximum pessimism equals bottom” logic gets shakier, because the pessimism might be justified. Maximum pessimism only marks a bottom if the pessimism is overdone. If the ecosystem really is contracting, then close attention during the decline is just a crowd watching a slow-motion problem unfold.
The social-dominance metric carries a specific trap here. High social dominance during a crash can mark an extreme local sentiment that precedes a bounce, but it can also reflect a token becoming the market’s designated cautionary tale, the name everyone points to as the example of what is going wrong. A surge in conversation driven by “look how badly Cardano is doing” is bearish attention, the kind that accompanies continued decline, not recovery. Without knowing the sentiment behind the volume, the raw dominance figure is as consistent with a token being publicly written off as with one being quietly accumulated.
How to tell which one it is
Since the same data supports both readings, the practical question is what additional evidence would distinguish them, and there are specific things to watch.
The first is the composition of the on-chain activity. Active addresses rising is ambiguous, but the direction of token flows is not. If exchange inflows dominate, ADA moving onto exchanges, that points to selling and the bearish distribution reading. If accumulation by long-term holder wallets dominates, with coins moving into addresses that historically hold rather than trade, that supports the bullish accumulation reading. The headline active-address number cannot tell you which, but deeper on-chain analysis of where the tokens are going can.
The second is whether the social sentiment is fear or conviction. Social dominance measures volume, but sentiment analysis measures tone. If the surge in conversation is dominated by capitulation, panic, and “I’m out” posts, that is a bearish sign that often accompanies further downside. If it is dominated by accumulation talk, defense of the fundamentals, and long-term conviction, that is more consistent with a bottom. The volume tells you Cardano is being discussed; only the tone tells you whether the discussion is people leaving or people doubling down.
The third, and most decisive, is whether the underlying problems get resolved. The activity surge is a sentiment signal; the fundamentals are the substance. If the Cardano community uses this moment of peak attention to break the treasury-funding deadlock, support developers, and stop the “wave of failures,” then the engagement was productive, and the crash can mark a turning point. If the deadlock holds, more firms follow TapTools out the door, and Hoskinson’s break extends, then the attention was just a crowd witnessing a decline, and the bearish reading wins. The social and on-chain metrics are the symptoms. The governance and development response is the disease, and watching the response matters more than watching the metrics.
The honest synthesis is that surging activity during a crash is a real and meaningful signal, but it is a question, not an answer. It tells you Cardano is at a moment of maximum attention and maximum action, which is exactly where bottoms can form, but only if the attention reflects accumulation and the underlying problems resolve. Right now, the data is consistent with both a community capitulating and a community mobilizing, and the broader context of genuine structural trouble tilts the odds toward caution. The activity surge means Cardano’s fate is being decided in real time, with everyone watching. It does not tell you which way the decision goes. For that, watch the token flows, the sentiment behind the chatter, and above all, whether the ecosystem fixes what is actually broken
This article is for informational purposes and does not constitute financial or investment
advice. Cryptocurrency markets are highly volatile. The figures and analysis described
reflect data available as of June 5, 2026. Always do your own research and consult with
qualified financial professionals before making investment decisions

Inspired by Robinson, NY bench gives Knicks 2-0 series lead

Netflix says there is no future for theatrical releases in its streaming universe
England vs New Zealand LIVE: Harry Kane heads in opener as Tuchel changes ENTIRE team


-

 Business5 days ago
Jade Biosciences, Inc. (JBIO) Discusses Positive Interim Results From JADE101 Phase I Healthy Volunteer Study and Development Plans Transcript
-

 Fashion1 day ago
Weekend Open Thread: Evereve – Corporette.com
-

 Sports4 days ago
French Open 2026 results: Alexander Zverev beats Rafael Jodar and will play Jakub Mensik in semi-finals
-
 Crypto World1 day ago
Jensen Huang Approves Samsung, SK Hynix, and Micron for NVIDIA (NVDA) HBM4 Memory Supply
-

 Tech4 days ago
CryZENx Releases Fresh Playable Content Deep Inside Jabu-Jabu for His Ocarina of Time Remake
-

 Business4 days ago
Trump Taps Housing Chief Bill Pulte as Acting Intelligence Director After Gabbard Exit
-
Crypto World1 day ago
LBank Surpasses 25 Million Users Worldwide as AFA Partnership Continues to Drive Global Growth
-
 NewsBeat4 days ago
Republicans balk at Trump’s attempt to appoint a MAGA enforcer to lead National Intelligence
-
 Crypto World4 days ago
Seagate (STX) Stock Surges to Record High on AI Boom and Legal Settlement
-

 Tech1 day ago
RCS Messages Between iPhone and Android Get End-to-End Encryption With iOS 26.5
-
Crypto World4 days ago
EU AI Data Center Project Faces Delays as Funding Gaps Grow
-

 Entertainment4 days ago
Did The Mandalorian And Grogu Already Ruin The Next Star Wars Movie?
-

 Business4 days ago
Aehr Test Systems Stock Soars 17% Amid Surging AI Demand and Conference Spotlight
-
 Business4 days ago
Claude AI Down Today Reason: Why Anthropic’s AI is not working today? What’s the latest quota update
-

 Business4 days ago
Relay Therapeutics Shares Surge 20% on ASCO Momentum for Zovegalisib Breast Cancer Program
-
 Crypto World1 day ago
Merlin (MRLN) Stock Soars 32% on Major USSOCOM Autonomy Milestone
-

 Tech4 days ago
Instagram will stop bombarding teens with the same kind of obsessively unhealthy content
-

 Tech1 day ago
Credit card theft campaign abuses Stripe to host stolen payment info
-
Crypto World5 days ago
Tether Brings Google’s TurboQuant to Production, Unlocking Long-Context AI on Everyday Devices
-
 Entertainment4 days ago
‘Aliens’ Star Reveals How the US Military Co-Opted James Cameron’s Sci-Fi Tech [Exclusive]
You must be logged in to post a comment Login