
Crypto World
ETHZilla to Tokenize $4.7 Million in Manufactured Home Loans on Ethereum Layer 2

ETHZilla plans to tokenize the loan portfolio into a cash-flow-generating manufactured home loan token.
ETHZilla has announced its acquisition of a portfolio comprising 95 manufactured and modular home loans valued at approximately $4.7 million, with plans to tokenize these assets on Ethereum Layer 2. This strategic move is aimed at enhancing transparency and accessibility in real estate finance.
The tokenization initiative will be executed through the Liquidity.io ecosystem, with the launch expected in late February or early March.
“Manufactured housing loans offer predictable cash flows and strong underlying collateral, which we believe makes them well suited for tokenization within a regulated, transparent structure,” said McAndrew Rudisill, CEO of ETHZilla.
ETHZilla’s strategy is designed to meet institutional compliance and reporting standards, crucial for the integration of real-world assets into blockchain systems.
The manufactured housing market is projected to grow significantly, from $45.82 billion in 2024 to $75.1 billion by 2035, driven by affordability and sustainability.
This article was generated with the assistance of AI workflows.

Crypto World
Silver Loses 43% in Eight Weeks as Gulf War Lays Bare Its Industrial Identity Over Monetary Role

TLDR:
- Silver fell 43% from its $121.67 all-time high to $69.50 in under eight weeks after Gulf war shocks hit.
- Over 60% of silver demand is industrial, leaving it exposed when energy costs and rate hike fears surged.
- Qatar’s helium facility destruction threatens chip fab output, reducing a core source of silver packaging demand.
- Gold dropped too but held ground as the PBOC bought for 16 straight months and 77% of central banks plan reserve increases.
Silver has dropped 43 percent since January 29, falling from an all-time high of $121.67 to $69.50 by Friday’s close. Gold also declined over the same period but found firmer ground through central bank demand.
The divergence between the two metals has raised fresh questions among commodity analysts and investors. These movements are reshaping how markets view silver’s role as both a monetary and industrial asset.
Silver’s Industrial Base Absorbs Three Simultaneous Shocks
More than 60 percent of silver demand is industrial, confirmed by JP Morgan’s commodities desk. Electronics, AI chip packaging, solar panels, and electric vehicle wiring are among its primary uses.
When hostilities closed the Strait of Hormuz, energy prices spiked and factory costs rose. Higher costs slowed industrial activity and pulled silver demand lower.
Analyst Shanaka Anslem Perera noted on social media that the divergence “is no longer a market event. It is a verdict.” The Federal Reserve now prices a 50 percent chance of a rate hike by October. The ECB and Bank of England are each repricing three or more hikes for 2026.
Qatar’s Ras Laffan complex supplied 30 to 33 percent of global helium before Iran struck it. SK Hynix sourced 64.7 percent of its helium from that facility alone.
Helium is essential for wafer cooling and lithography in chip fabrication. Fabs are reporting two to three months of buffer supply remaining.
When helium runs short, chip production slows and silver packaging demand falls. Energy spikes, rate hike expectations, and helium shortages hit silver’s industrial base at once.
The metal’s monetary narrative provided no shelter when factories came under economic pressure. Silver entered this environment with three demand shocks arriving simultaneously.
Gold Builds a Floor on Central Bank and Retail Demand
Gold fell from $5,589 in January to approximately $4,494 this week, but buying absorbed each drop. Chinese retail buyers cleared supplies in under 60 seconds each morning.
The People’s Bank of China extended its purchasing streak to 16 consecutive months. Chinese banks sold 600 kilograms of gold bars each morning in under a minute.
Seventy-seven percent of central banks plan to increase gold reserves, based on recent surveys. That sustained demand has built a structural floor under gold’s price.
Silver has no central bank buyer of last resort. Its floor rests entirely on industrial consumption, which is now under strain.
Gold’s support comes from institutional policy decisions, not factory orders. Silver’s support depends on factories now facing energy shocks and helium shortages.
The war revealed a structural difference between the two metals that many investors had not previously priced in. That difference now appears lasting rather than temporary.
Rate hike expectations in the United States and Europe continue to reinforce dollar strength. A stronger dollar adds persistent pressure on metals priced in that currency.
Silver enters this environment without central bank support. Whether industrial demand can stabilize will determine the metal’s next directional move.

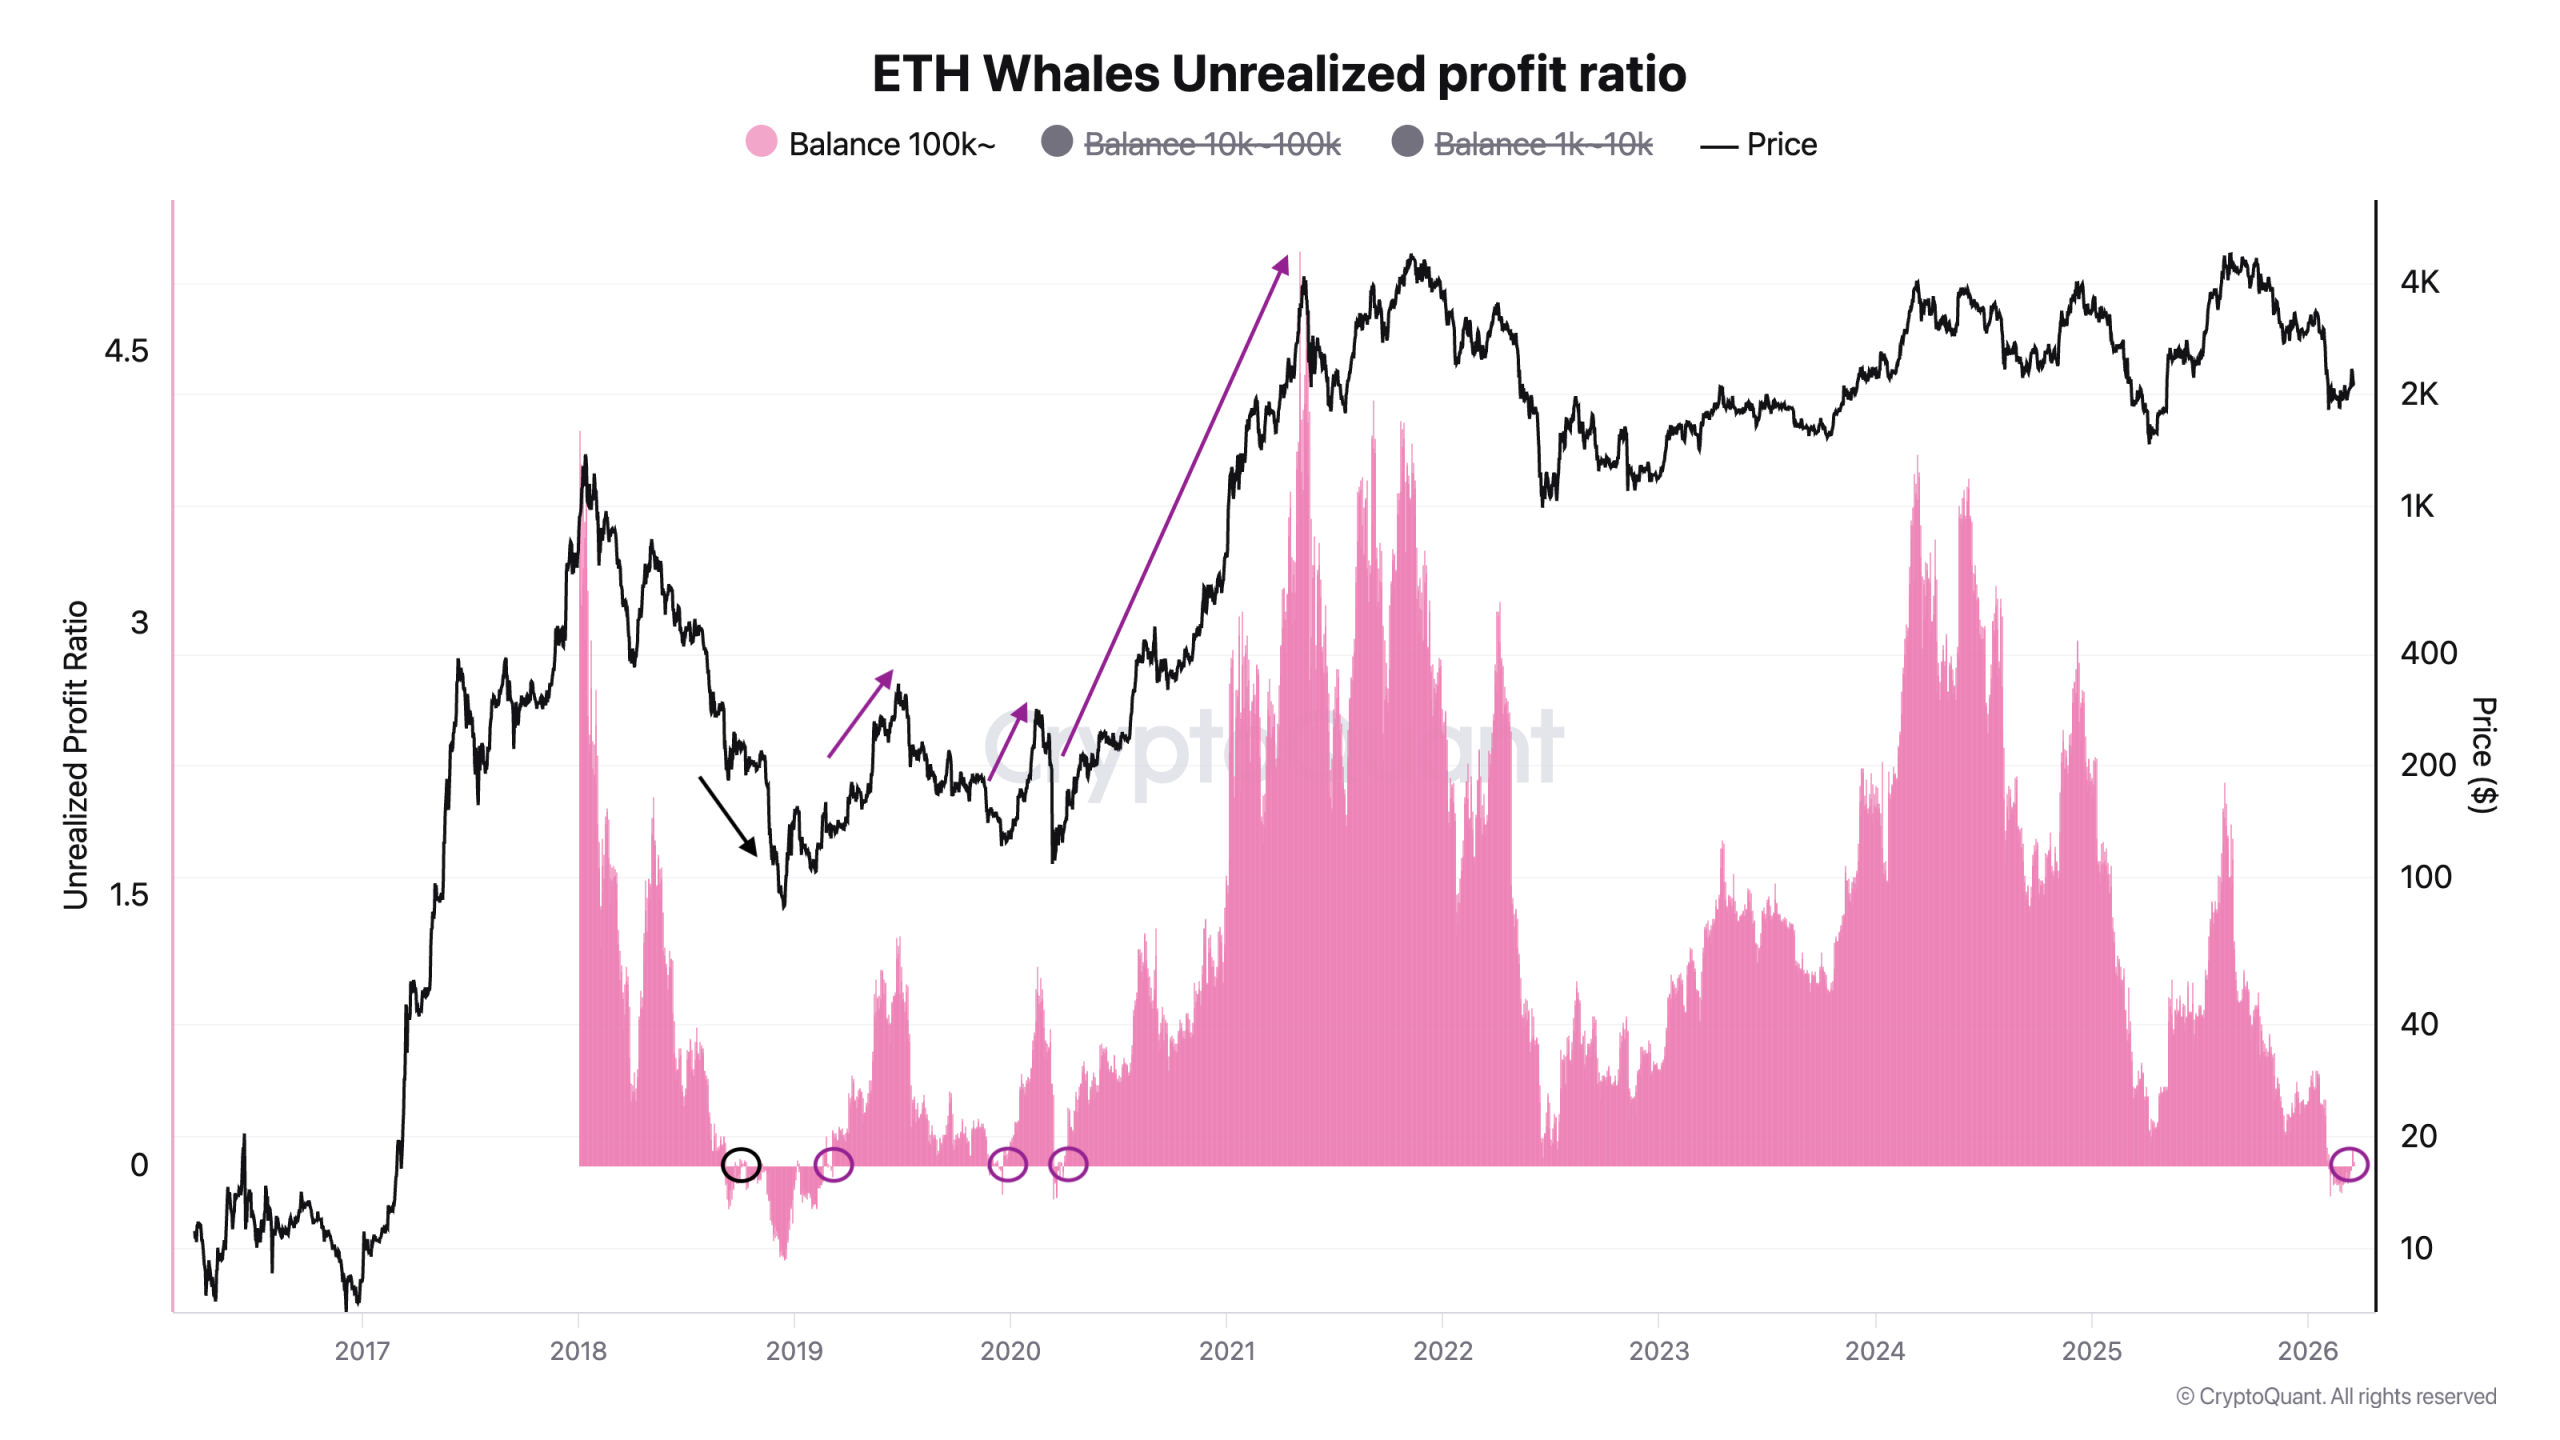
Ethereum’s native token, Ether (ETH), may rise by around 25% in the coming months as its richest whale group becomes profitable for the first time since early February.
Key takeaways:
-
ETH gained 25% in three months and 50% in six months on average after top whales returned to profit in past cycles.
-
Ether could rally above $2,750 by June if the on-chain whale metric signal plays out.
Whale metric signals ETH is bottoming already
The unrealized profit ratio of wallets holding more than 100,000 ETH has flipped back above zero, according to data resource CryptoQuant. In other words, this whale cohort is no longer sitting on aggregate paper losses.

In the past, similar transitions to a “profitable state marked the starting point of an uptrend,” said on-chain analyst CW.
ETH delivered nearly 25% returns on average three months after the whale ratio flipped to positive. Similarly, its price gained roughly 50% after six months and 300% after a year into the signal.
The price behavior suggests that once top ETH whales return to aggregate profit, they face less pressure to sell defensively. At the same time, the shift can strengthen broader market confidence by signaling renewed conviction among the richest ETH holders.
ETH may head toward the $2,750 area by June and to over $3,200 by September if the historical post-signal pattern holds.
Related: Early Ethereum whale rebuilds stack with $19.5M in ETH buys
Still, the whale ratio metric is not flawless. In 2018, for instance, ETH dropped 17.5% in the month after a similar flip and eventually tumbled nearly 70%.
Onchain data caps Ether’s upside at $2,640
Another on-chain signal is reinforcing Ethereum’s recovery case.
Glassnode data shows ETH rebounding from its lowest MVRV deviation band (blue), a setup similar to Q2 2022 and Q2 2025, when price recovered from undervalued levels and climbed back above realized price.

At current rates, ETH remains below its realized price (purple) at $2,353, which remains the first key recovery level. A break above that threshold could open the door toward the -0.5 sigma band (teal) near $2,640.
On the downside, failure to reclaim realized price could keep ETH exposed to a retest of the lowest deviation band near $1,651.
Ethereum’s technicals reiterate rally above $2,600
From a technical perspective, ETH has broken above its ascending triangle pattern and is now pulling back toward the former resistance trendline.
Such retests are common after breakouts, as markets often revisit the breakout level to confirm it has flipped into new support.

Ether could resume its recovery toward the triangle’s measured upside target at around $2,625 or higher if the upper trendline holds as support.
That level also sits within the broader on-chain recovery range outlined by Glassnode’s MVRV bands, adding confluence to the bullish setup.
A failed retest, on the other hand, would weaken the breakout structure and risk sending ETH back toward the lower support zone near $1,950-$2,000.
This article does not contain investment advice or recommendations. Every investment and trading move involves risk, and readers should conduct their own research when making a decision. While we strive to provide accurate and timely information, Cointelegraph does not guarantee the accuracy, completeness, or reliability of any information in this article. This article may contain forward-looking statements that are subject to risks and uncertainties. Cointelegraph will not be liable for any loss or damage arising from your reliance on this information.
Crypto World
Arc Launches Programmable Settlement Layer to Replace Legacy Capital Markets Infrastructure
TLDR:
- Arc’s atomic DvP settles tokenized assets and stablecoin payments simultaneously, eliminating principal risk in one transaction.
- Traditional T+1 and T+2 settlement cycles lock up capital and increase counterparty exposure across fragmented intermediary systems.
- Arc embeds transfer restrictions, jurisdictional controls, and compliance logic directly into onchain assets via smart contracts.
- Onchain collateral management on Arc automates margin calls, liquidations, and top-ups using deterministic, stablecoin-native flows.
Capital markets settlement has long been slowed by outdated post-trade infrastructure and multi-day clearing cycles. Arc, a purpose-built Layer-1 blockchain, is working to change that.
The platform combines atomic delivery-versus-payment, stablecoin-native execution, and deterministic sub-second finality.
These tools consolidate fragmented post-trade workflows into one programmable layer. Institutions can now achieve real-time settlement while maintaining compliance-ready controls across all counterparties.
Arc Addresses Deep Structural Gaps in Post-Trade Workflows
Most global capital markets still operate on T+1 or T+2 settlement cycles. These delays lock up capital and increase counterparty exposure considerably.
Risk management teams must bridge the gap between trade execution and final settlement. That process raises capital requirements and slows down institutional modernization efforts.
Post-trade workflows are also spread across multiple disconnected systems and entities. Execution, clearing, netting, custody, and settlement each run on separate infrastructure.
This fragmentation creates duplicated recordkeeping and reconciliation bottlenecks that are costly to manage. Modernizing these systems is difficult when they are not designed to communicate with each other.
Traditional ledgers add another layer of difficulty through limited real-time traceability. Audit trails are inconsistent across intermediaries, and manual reporting remains common.
Compliance checks rely heavily on human review, which introduces errors and delays. These conditions make it harder for institutions to meet regulatory requirements efficiently.
Arc addresses these gaps through its architecture. The platform offers predictable, stablecoin-denominated fees and opt-in configurable privacy with selective disclosure.
Authorized parties such as regulators or auditors can access specific data through view-key access. This design keeps sensitive information protected while maintaining operational transparency.
Programmable Settlement Enables Atomic DvP and Onchain Collateral Management
Arc’s rails enable true atomic delivery-versus-payment in a single onchain transaction. Tokenized assets and stablecoin payments transfer simultaneously, so neither leg settles without the other.
This structure reduces principal risk across institutional workflows. Settlement finality is cryptographically verifiable and arrives in under a second.
Beyond settlement, Arc supports the full lifecycle of tokenized securities and structured products. Smart contracts automate issuance, redemptions, distributions, and corporate actions directly onchain.
Asset servicing becomes a software function rather than a manual operational task. Transfer restrictions and jurisdictional controls are embedded into the asset itself.
Onchain collateral and margin management also run through Arc’s programmable logic. The system can enforce thresholds, trigger margin calls, and automate liquidations when conditions are met.
Stablecoin-native flows reduce the need for batch reconciliation between parties. Lenders and institutional counterparties gain greater transparency over margin operations as a result.
Prediction markets represent another use case built on this infrastructure. These markets can settle instantly in stablecoins with predictable fees after oracle-verified outcomes.
Economic indicators, event results, and risk signals can all serve as resolution inputs. This creates faster feedback loops for market-based forecasting built on real-time data.
The rumor followed a familiar wartime script. Iran’s Islamic Revolutionary Guard Corps claimed it had struck Benjamin Netanyahu’s office. Then came the forged screenshots — fake posts from the Israeli prime minister’s official account announcing he was dead. Then came the AI furore over a low-resolution freeze-frame from a press conference that, at the right angle, appeared to show Netanyahu’s right hand sporting six fingers, leading contrarian commentators to take victory laps.
Conservative influencer Candace Owens amplified the claims loudly on X, demanding to know where Netanyahu was and why his office was “releasing and deleting fake AI videos.” Iran’s Tasnim News Agency — run by the Islamic Revolutionary Guard Corps — published an article titled “New Video of Netanyahu Proves Fake,” cataloguing alleged clear signs that a subsequent coffee shop clip, posted by Netanyahu’s own account to debunk the rumors, was itself generated by artificial intelligence. The conspiracy had become self-sealing; every refutation was recast as fresh evidence.
But while the fact-checkers scrambled and the podcasters speculated, one data source offered a clean, immediate signal. On Polymarket, the world’s largest crypto prediction market, the contract for “Netanyahu out by March 31” was trading at around 4 to 5 cents, implying a roughly 4 to 5% probability of him leaving office before the end of the month. The market didn’t move. For anyone paying attention to that number, the entire conspiracy theory collapsed in a single glance.

A record-breaking backdrop
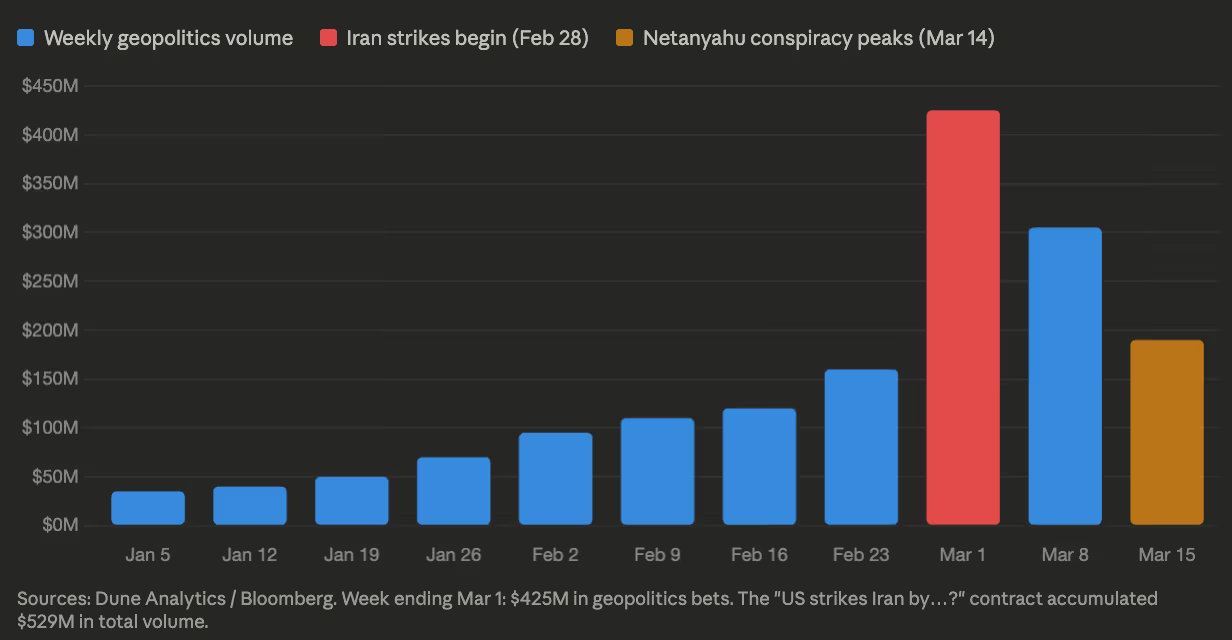
To understand why the Netanyahu conspiracy took hold when it did, you need to understand the information environment it emerged from.
Since the U.S. and Israel launched strikes on Iran on Feb. 28, Polymarket has been transformed into something closer to a real-time geopolitical intelligence terminal. In the week ending March 1, bettors placed $425 million in geopolitics wagers on the platform alone — up from $163 million the prior week — with total platform wagering hitting a record $2.4 billion. The “US strikes Iran by…?” contract accumulated $529 million in total volume, making it one of the largest single markets Polymarket has ever hosted and the fourth-largest in its entire “Politics” category.
It is a remarkable trajectory for a platform that processed $73 million in total trading volume in 2023 and was pushed offshore by a CFTC settlement a year later. By 2025, Polymarket had processed approximately $22 billion in notional trading volume across the year — a figure that underscores how quickly the platform has moved from crypto curiosity to mainstream financial infrastructure.
This is no longer a crypto curiosity. In October 2025, the Intercontinental Exchange, parent company of the New York Stock Exchange, invested $2 billion into Polymarket at a $9 billion valuation, and launched a “Polymarket Signals and Sentiment” tool that feeds real-time prediction market data directly to Wall Street trading desks. When the Iran war began, equity and oil futures markets were closed for the weekend. Polymarket was not.
The market as instant truth machine
Prediction markets don’t have death contracts in the conventional sense. What Polymarket offers instead are “politician out by X date” markets, which resolve “Yes” if a leader resigns, is removed, or steps down. They don’t directly price the probability of death. But in a context where the conspiracy theory is that Netanyahu has been killed and the government is conducting a cover-up, these contracts function as a powerful proxy.
The logic is simple. A leader who has died or been incapacitated cannot indefinitely run a country from office. Eventually, a resignation, a removal or a credible leak would surface. And if any of that happened, the payout on a “Yes” share at 5 cents would be enormous: a $1 payout on a 5-cent share is a 20-to-1 return.
One trader was willing to make that bet at scale. A single Polymarket account placed $151,000 on Netanyahu being out before March 31, accumulating nearly 3.8 million shares at 4.7 cents each. If correct, the position would pay out $3.8 million. It is currently underwater by roughly $26,000.
That number is the ceiling of rational conviction in the conspiracy. At the height of the online hysteria, the most aggressive speculator on record was willing to stake $150,000 on the theory — implying he knew the odds were long. The market as a whole put the probability at around 5%. Social media said it was certain. The money said otherwise.
“Whether a politician is in or out of office is a very economically meaningful outcome for a lot of people,” said Aaron Brogan, a managing attorney at Brogan Law who has advised on prediction market regulation. “These are exactly the kinds of markets that event contract rules were designed to accommodate.”
Why the odds are hard to fake
The 2024 US election cycle offered a masterclass in prediction market efficiency — and the limits of efforts to dismiss its signals. When Polymarket showed Donald Trump trading at a substantial premium over Kamala Harris, critics cried manipulation. A French trader, they alleged, had artificially pumped Trump’s odds using multiple accounts for political purposes.
The experts weren’t buying it. As Flip Pidot, co-founder of American Civics Exchange, told CoinDesk at the time: a true manipulator trying to move the price would simply pile in blindly and let themselves get filled at worsening prices. The French trader did the opposite — splitting orders strategically across accounts to minimize slippage. That is what profit-seeking looks like, not propaganda.
The deeper reason manipulation struggles to stick is expected value arbitrage. If a price is artificially depressed or inflated, profit-hungry traders pile in to exploit the gap until it closes. Cross-market arbitrage reinforces this: Polymarket prices in real time against Kalshi, Betfair, and others. If odds drift meaningfully out of line across platforms, traders immediately sell the higher price and buy the lower one, synchronizing markets toward a consensus.
Harry Crane, a statistics professor at Rutgers University who studies prediction markets, sees the Netanyahu episode as a near-perfect illustration of this dynamic. “These markets are an antidote to propaganda precisely because their resolution rules anchor outcomes to verifiable sources rather than narrative,” he told CoinDesk. “I understand why governments want to limit them — not because of concerns over leaking classified information, but because verifiable price signals are harder to control.”
That framing maps directly onto the Netanyahu conspiracy. The people claiming he was dead were doing structurally the same thing as those who cried Polymarket was rigged in 2024: attacking the signal rather than engaging with it.
What the market is actually pricing — and what it isn’t
Crane is careful about the limits of the signal, and his caveat is worth sitting with.
“The market is only pricing the probability that Netanyahu is verifiably out of office under these rules,” he said. The resolution criteria state that the contract resolves “Yes” if Netanyahu announces his resignation or is otherwise removed from office, confirmed by official sources or a consensus of credible reporting. If a government concealed a leader’s death so completely that no credible source ever confirmed it, the market could resolve “No” — faithfully, correctly under its own rules, and yet without capturing the underlying reality.
That dynamic was playing out in real time. Domer — a well-known prediction market trader who goes by ImJustKen online — was publicly holding a No position on Netanyahu leaving office before March 31. Not because he was certain Netanyahu was alive, but because he didn’t believe a departure would ever be confirmed under the market’s resolution criteria, even if it occurred. He was pricing the verification gap, not the conspiracy itself.
But that caveat reveals something important about the conspiracy itself. The Netanyahu death rumor only holds together if you believe in a cover-up so total — encompassing Israeli officials, international media, independent fact-checkers, and Netanyahu’s own social media accounts simultaneously — that no verifiable evidence would ever surface. At that point, the conspiracy has become unfalsifiable by design. An unfalsifiable claim is one no rational actor should stake capital on.
This is the key distinction from traditional fact-checking. A fact-checker requires institutional credibility, research time, and editorial process — all of which conspiracy theories are engineered to preemptively undermine. A Polymarket price requires none of that. It requires only that someone, somewhere, believes the opposite enough to put real money on it. When no one does, that is its own kind of proof.
The contrast case: Khamenei
The clearest evidence that these markets work as a truth signal — and not merely as a null result — is what happened with the Khamenei contract.
When Iranian Supreme Leader Ali Khamenei was killed in the February 28 strikes, the “Khamenei out as Supreme Leader by March 31” contract on Polymarket behaved exactly as you would expect from an efficient market. It had hovered between 25% and 50% through January and February as tensions built, pricing genuine uncertainty about an escalating conflict. Then, when Iranian state TV confirmed his death, it spiked vertically to 100%. The contract drew $45 million in volume. The top trader made $757,000 on a yes bet. Four others cleared six figures.
The Netanyahu market did not do this. It stubbornly remained below 5 cents throughout the conspiracy cycle. The crowd that correctly priced Khamenei’s death — and got paid for it — looked at the Netanyahu claims and declined to move.

The regulatory storm gathering overhead
The informational value of these markets is being stress-tested at exactly the moment when political pressure against them is reaching its peak.
When Khamenei was killed, Kalshi — Polymarket’s CFTC-regulated rival — invoked a “death carveout” buried in its contract terms, settling its Khamenei positions at the last traded price before his death: roughly 39.5 cents rather than the full dollar. Polymarket, which carries no such carveout, paid out in full. A $54 million class action lawsuit against Kalshi followed.
The inconsistency in Kalshi’s approach has been pointed out sharply. In late 2024, Kalshi had run a market on whether a 100-year-old Jimmy Carter would attend Trump’s inauguration. When Carter died before it took place, Kalshi settled that contract to “No” — resolving a market directly via death, without invoking any carveout. As Crane has noted, the application of its death carveout appears to have been selective: they settle on death, just not when it’s expensive.
Kalshi disputes the characterization. “Our rules were clear from the beginning, we never changed them, and we settled based on the rules,” a spokesperson said. The company added that it reimbursed all fees and net losses out of pocket following the Khamenei settlement — “to the tune of millions of dollars” — ensuring no user lost money on the market. “Kalshi is a peer-to-peer exchange and does not profit from user losses. We have no incentive not to pay out our users, but we need to follow the rules of the exchange and the rule of law.”
On the legislative push, the company struck a conciliatory tone. “Kalshi already bans insider trading and markets directly tied to death and war,” a spokesperson said. “As a US-based exchange, we support regulators and policymakers from both sides of the aisle in their efforts to keep these markets safe and responsible in America.”
Kalshi declined to comment on record about the consistency of the death carveout as applied to the Khamenei contract versus the Carter market, or on the current status of the class action lawsuit.
Six Democratic senators, led by Adam Schiff, have written to the CFTC demanding a categorical ban on contracts that “resolve upon or closely correlate to an individual’s death.” Separately, senators Merkley and Klobuchar have introduced the End Prediction Market Corruption Act, which would bar the president, vice president, members of Congress, and their immediate families from trading event contracts, and impose fines and profit clawbacks for violations — citing the well-timed wagers on US strikes and Iranian leadership changes that netted some traders hundreds of thousands of dollars.
Blockchain analytics firm Bubblemaps identified six newly created wallets that collectively netted $1.2 million betting on the timing of US strikes on Iran, with accounts funded within 24 hours of the attack. One trader turned roughly $60,000 into nearly $500,000.
Brogan is skeptical that the legislative push has the momentum to land. “This is largely Democratic senators using the legislative process to generate political capital,” he said. “The conditions under which that legislation actually passes are where something really calamitous happens — some kind of market collapse or scandal that forces politicians to make an example of the industry. Without that, I don’t think there’s sufficient political capital to move it.”
He also draws a clear distinction between Polymarket’s legal exposure and Kalshi’s. “The restrictions Kalshi faces are not directly applicable to Polymarket,” Brogan said. Polymarket is not a CFTC-regulated US exchange — a status that stems from a 2021 settlement that pushed it offshore and barred US users from accessing it directly. That remains its largest single legal exposure, Brogan noted, though he pointed out that the Trump administration has shown little appetite for pursuing the kind of action the Biden administration explored against Polymarket CEO Shayne Coplan in early 2025.
Crane, for his part, is unambiguous about what would be lost if the legislative push succeeded. “These markets have genuine informational value and can counter propaganda,” he said. “That’s the case study here — a market involving war and the fate of a political leader doing exactly what its critics say it shouldn’t exist to do.”
There is also a state-level front opening up. Arizona recently charged Kalshi with operating an illegal gambling operation — part of a broader conflict between states that regulate and tax traditional gambling markets and federally-overseen prediction markets that sit outside their control. “The question that ultimately matters is whether federal law will preempt state law on this,” Brogan said. “There are courts hearing that question right now.”
What the crowd gets right — and what it can’t fix
None of this is to say prediction markets are infallible. Crane notes that nearly 25% of Polymarket’s historical volume has been attributed to wash trading — artificial activity generated by users trying to position themselves for a potential token airdrop — a figure that Columbia University researchers found peaked at around 60% in December 2024 before falling sharply. Wash trading inflates headline volume without necessarily biasing prices, but it is a legitimate caveat to the “wisdom of crowds” narrative.
The more fundamental limitation is what Crane identified in his answer to the manipulation question: a sufficiently coordinated disinformation campaign could, in theory, move a market — especially a smaller one. The Netanyahu “out by March 31” contract had enough liquidity to make that expensive, but not impossible.
What prediction markets cannot do is replace the underlying information infrastructure they depend on. They resolve against credible sources. If those sources are corrupted or silent — as Iranian state media clearly was throughout this episode — the market’s signal is only as good as the resolution criteria it is anchored to.
But in the Netanyahu case, that is precisely where the conspiracy fell apart. The rumor required a cover-up so comprehensive that no Israeli official, no international journalist, no independent fact-checker, and no market trader with real money on the line would ever find confirmation. The market priced that scenario at 5 cents. It was right.
When Candace Owens was demanding to know where Bibi was, Polymarket already had an answer. It just costs a few pennies to read it.

A 66-year-old Hong Kong retiree became the latest victim in a sequence of crypto investment scams that operated through WhatsApp outreach by self-styled “virtual currency experts.” Police say the scam drained about HKD 6.6 million, roughly USD 840,000, over a six-month period. The CyberDefender unit of the Hong Kong Police disclosed the case in a March 20 post on its Facebook page, illustrating how fraudsters recycle the same victim through successive schemes that promise guaranteed profits and later offer recovery services for a fee.
The chronology, as outlined by CyberDefender HK, began in September 2025 when an unknown scammer messaged the retiree claiming to be a virtual currency investment expert and promising steady gains if the victim followed his instructions. The victim transferred USD 180,000 and deposited cryptocurrency into a wallet controlled by the scammer, who subsequently disappeared, prompting a police report.
The case then spiraled into a second round of deceit. Unable to accept the loss, the retiree sought help online from another so-called crypto expert who claimed he could recover the missing funds but demanded a security deposit of USD 75,000. After paying, that second scammer vanished as well.
In January, a third purported specialist contacted the victim via WhatsApp, offering to reclaim both prior losses if the retiree bought USD 585,000 worth of cryptocurrency and sent it to a specified address. Once the transfer was completed, the scammer disappeared, bringing total losses to about USD 840,000 across roughly six months.
The CyberDefender team cautioned that genuine professionals do not reach out randomly, and that the phrases “guaranteed returns” or “inside information” are classic red flags. As the unit put it, “Life has no take two; but scams can have take three.”
Related: How US investigators traced $61M in crypto tied to romance scams across wallets
Key takeaways
- The victim’s losses followed a clear pattern: an initial guaranteed-profit pitch, followed by a recovery-for-fee pitch, and a final attempt to recoup through another “expert.”
- Three different scammers reportedly targeted the same retiree, illustrating how con artists exploit a single victim through successive, increasingly aggressive schemes.
- The case sits amid a broader surge in web3 crime, with industry data pointing to multi‑billion-dollar losses tied to phishing, social engineering, and investment fraud.
- Regulators and security firms have warned repeatedly about impersonation, fake tokens, and recovery scams, urging caution against unsolicited outreach and guaranteed-return promises.
- Practical steps for users include verifying identities through official channels, avoiding unknown wallets, and resisting requests for large, upfront payments or security deposits.
Context: escalating Web3 fraud and the regulatory backdrop
The Hong Kong case arrives as crypto-related crime continues to rise globally. Security firm Hacken has flagged substantial damage in 2025, estimating Web3 losses at about USD 3.95 billion, driven in part by state-linked actors and weak key security across wallets and platforms. The trend underscores the ongoing risk of phishing, social engineering, and investment fraud that can follow a single high‑profile scam.
Authorities around the world have been vocal about new waves of crypto fraud. From phishing schemes to fake tokens and misrepresented investment opportunities, official warnings have become a regular feature of coverage in the crypto security space. For example, coverage linked to the FBI’s warnings about phishing and token scams, as well as investigations into high-profile frauds such as India’s GainBitcoin probe and actions targeting illicit USDT movements, highlights a continued focus on enforcement and forensics as the sector matures.
As the industry grapples with these threats, observers say the most persistent danger remains social engineering—convincing, personalized outreach that exploits trust. The Hong Kong incident reinforces the lesson that scammers often masquerade as credible professionals, using familiar crypto jargon to exploit the hopeful impulse of investors seeking quick, guaranteed gains.
For readers tracking the broader market risk, the message is clear: even as legitimate projects advance and institutional participation grows, ordinary users remain highly exposed to targeted scams conducted through seemingly private channels like WhatsApp and other messaging apps. Keeping a skeptical eye on unsolicited advice, verifying credentials through official company channels, and avoiding rapid transfers to unknown wallets are foundational steps to reduce exposure to these increasingly sophisticated schemes.
Looking ahead, regulators and industry researchers will likely intensify warnings and enforcement related to crypto investment outreach, with a continued emphasis on transparency around the identities of “experts” and the provenance of promised returns. Market watchers should monitor whether more cases like the Hong Kong incident lead to enhanced user education campaigns, stricter messaging guidelines for crypto service providers, and new multi‑party verification practices to curb recovery scams.
Readers should watch for updated guidance from local law enforcement and security firms as they refine best practices for detecting and preventing social-engineering fraud in crypto, as well as for any official statements about new actions against impersonators and bogus recovery services. The evolving landscape suggests that ongoing vigilance—paired with practical safeguards—will remain essential for anyone engaging with crypto investment opportunities, particularly through unregulated channels.
What remains uncertain is how quickly audiences will adopt more robust due-diligence habits when confronted with personalized outreach promising easy gains. As this case illustrates, a moment of trust can quickly turn into a six-figure loss, and the path to recovery can become a perilous new scam in disguise.
TLDR:
- Bitcoin’s momentum indicator dropped to 20.0, confirming extreme weakness and the absence of Wall Street re-engagement at current levels.
- Two consecutive days of ETF outflows totaling $253.7M confirm that institutional capital has not returned to the Bitcoin market yet.
- The Coinbase Premium Gap fell to -5.82, reflecting weakened American institutional buying pressure across spot Bitcoin markets.
- Binary CDD hitting zero three times within a four-month window historically precedes a violent flush toward the $54,600 accumulation zone.
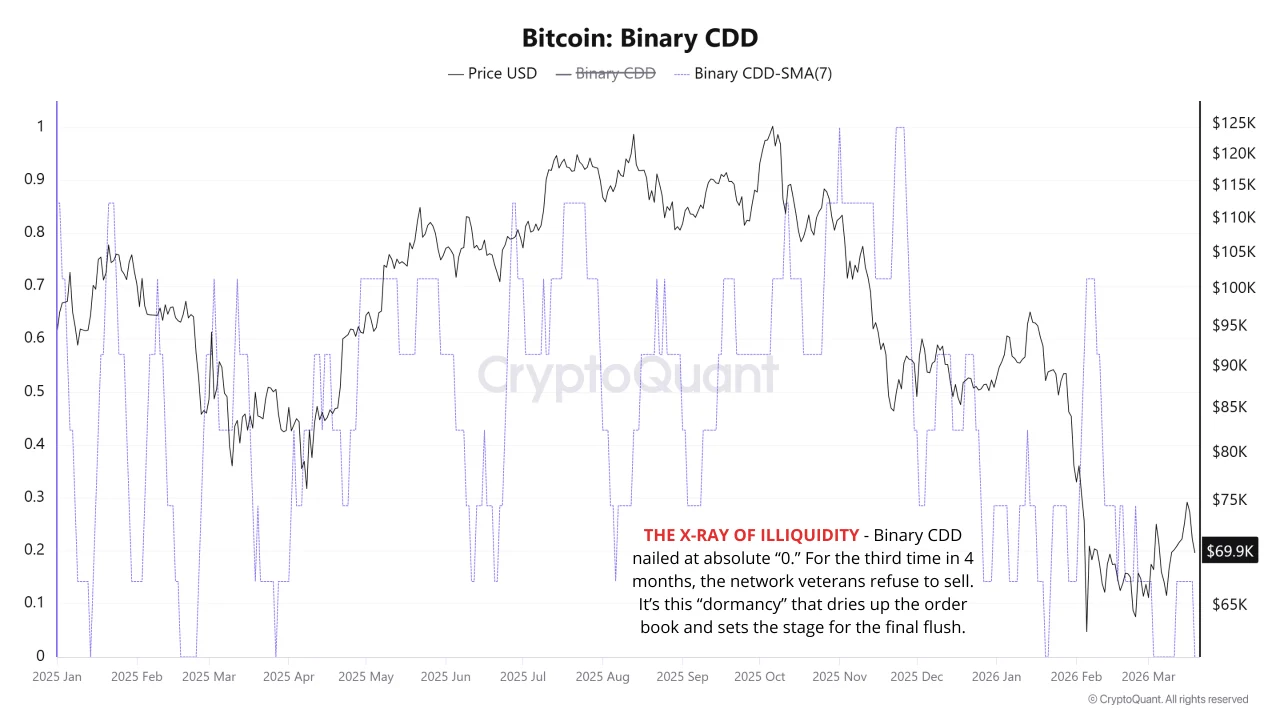
Bitcoin remains under pressure as multiple key market indicators point to a potential violent correction ahead. The Bitcoin price momentum indicator has dropped sharply to 20.0, entering extreme weakness territory.
American institutional demand shows no signs of recovery, while ETF outflows have stretched into a second consecutive day. Cumulative outflows now total $253.7 million.
With Bitcoin trading at $69,797, the market is caught between retail exhaustion and the strategic inactivity of long-term holders.
Wall Street Retreat Strips Bitcoin of Institutional Support
The Coinbase Premium Gap has fallen sharply into negative territory, settling at -5.82. This metric measures the price difference between Coinbase and other global exchanges.
A negative reading reflects weaker buying pressure from American institutional participants. Without this demand, Bitcoin loses one of its core price support mechanisms.
ETF outflows add to the bearish outlook for the asset in the short term. The most recent session recorded $90.2 million in outflows from spot ETFs.
Combined with the prior day, two-session outflows totaled $253.7 million. This back-to-back streak confirms that institutional capital has not yet returned.
On-chain analyst GugaOnChain flagged the momentum collapse in a recent social media post. The post confirmed that momentum at 20.0 proves Wall Street has not re-engaged.
This leaves the asset exposed to continued downside without institutional buying support. The analysis called for tactical patience and the preservation of cash at current levels.
Retail investors are equally failing to absorb the selling pressure in the current market. Small investor demand declined 9.27% over the past 30 days.
This group holds only 1.7 million BTC against the 16.7 million BTC controlled by large investors. The gap between both groups reflects a severe imbalance in market buying power.
Binary CDD Pattern Points to an Imminent Liquidity Flush
The Binary CDD indicator registered zero in the current period. This metric tracks whether dormant Bitcoin coins are circulating on any given day.
A zero reading confirms that long-term holders are not moving their positions. This removes available liquidity and leaves the market vulnerable to sharp price drops.
Source: Cryptoquant
Historical data shows a recurring pattern linked to repeated Binary CDD zero readings. When the indicator hits zero three times within a three-to-four-month window, a flush typically follows.
The current market sits exactly within that timeframe and pattern. This raises the probability of a violent liquidity sweep in the near term.
The likely destination of such a flush rests near the $54,600 price level. That zone represents the true institutional accumulation area, according to the analysis.
Smart money is not blindly entering at current prices. Experienced participants are holding cash and placing limit orders near that base instead.
Collapsed momentum and Binary CDD at zero together point to an imminent flush scenario. Tactical patience remains the advised posture for market participants.
Chasing the current price runs against the structural evidence pointing lower. Orders near $54,600 reflect the most informed approach given current market conditions.
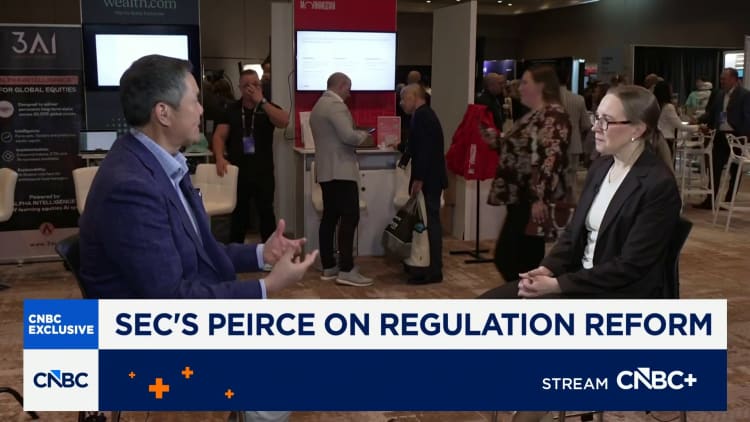

SEC Commissioner Hester Peirce is indicating an openness to work with Wall Street on emerging exchange-traded fund products tied to cryptocurrencies and tokenization.
“We want to work with people on new products,” Peirce said during an exclusive interview this week with “ETF Edge” host Dominic Chu. “It really is a come in and talk to us about what you’re trying to do. We want to work with you toward being able to experiment to see whether the market wants your products.”
Peirce joined CNBC from the VettaFi’s Exchange 2026 conference in Las Vegas.
“I’m here because this is such an important segment of what we regulate,” she said.
When asked about tokenization of financial instruments, Peirce said interest has picked up.
“It’s not the SEC’s job to decide… how the market moves forward,” she said. “But tokenization is one of those areas that since the administration changed and since the attitude toward crypto and blockchain changed, people have come to us and they’ve said, ‘We really think tokenization has potential here.’”
Peirce also alluded to the regulation priorities as retail investor accessibility to new ETFs improves.
“We want to do it [work with issuers] in a way that respects investor protection,” Peirce said. “It’s not our job to say which products are good or bad. It is our job to work with sponsors to make sure that they’re disclosing what those products are, what the risks are [and] what they’re intended to be used for.”
Crypto World
Dogecoin Price Prediction: Why Whales Prefer AlphaPepe 100x Q2 Debut Over DOGE Stagnation
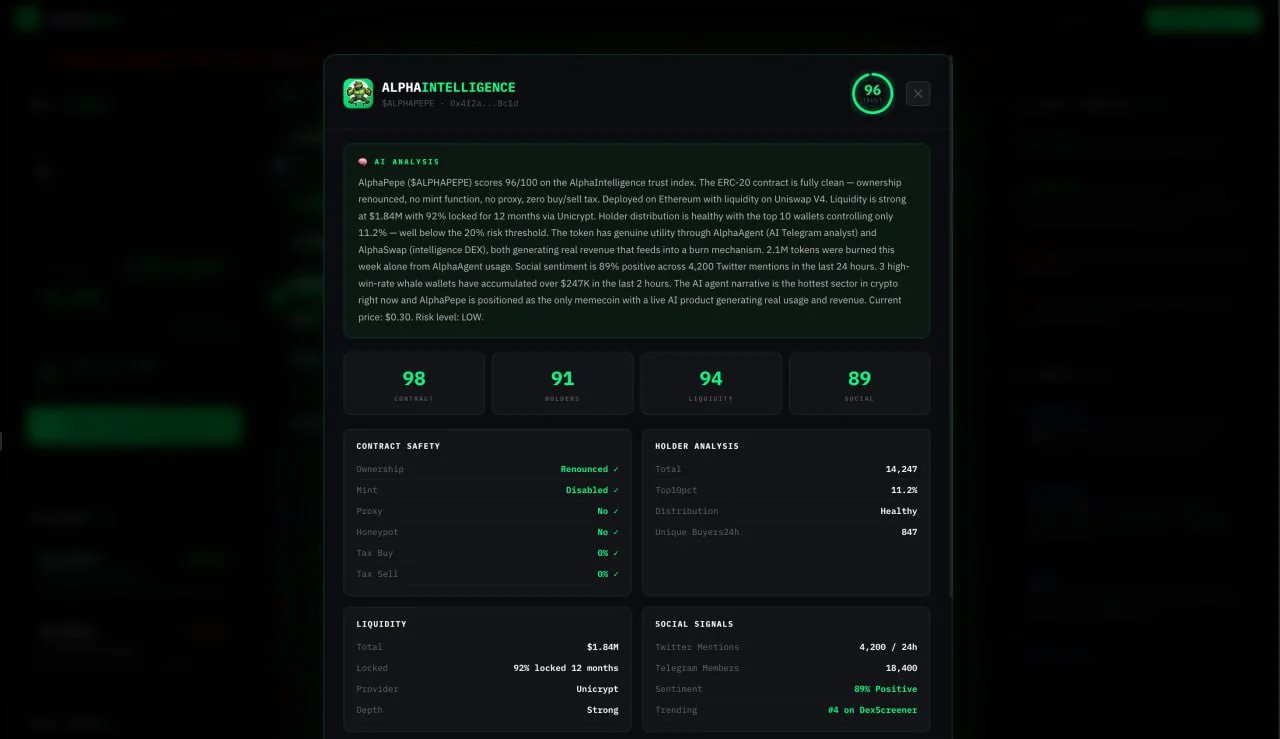
If you have been holding Dogecoin waiting for a breakout, the last few months have probably felt heavy. The market is sitting in extreme fear. Portfolios are red. And every time it looks like a bounce is coming, the sellers show up and push it right back down. That kind of environment breaks most people. But it is also exactly where the smartest wallets in crypto quietly load into the projects that create millionaires during the next wave.
DOGE trades at $0.10. The dogecoin price prediction for the rest of 2026 targets $0.13 on the high end. That is 30% growth over months. Meanwhile AlphaPepe sits at $0.00790 with a Q2 exchange listing approaching and the kind of presale setup that early SHIB and PEPE holders would recognize instantly.
Dogecoin Price Prediction Backdrop: DOGE Sits 86% Below Its All Time High With Volume Fading
DOGE peaked at $0.73 in May 2021. It now trades at $0.10, an 86% decline. Trading volume dropped sharply this week. The 200 day moving average has been falling since February 2026. Analysts project a range between $0.094 and $0.13 for the year.
30% over the rest of the year. Your savings account nearly matches that. The dogecoin price prediction is not where wealth gets built anymore. It is where capital goes to sit still.
Dogecoin Price Prediction or AlphaPepe: Which Entry Turns $10,000 Into Real Money
Can You Turn $10,000 Into $1,000,000 With AlphaPepe? The Math Says Yes and the Dogecoin Price Prediction Says Wait
A $10,000 entry at $0.00790 becomes over $1,000,000 if AlphaPepe reaches $0.79, a market cap under $800 million. Shiba Inu hit $41 billion. PEPE hit $7 billion in weeks. An $800 million valuation would barely register on the top 100. That is the kind of math the dogecoin price prediction will never deliver from $0.10.
The lead smart contract architect is the same anonymous developer who built ShibaSwap and contributed to Shibarium’s Layer 2 that processed over 1.5 billion transactions. That engineer designed the burn mechanism that destroyed hundreds of billions of SHIB. Now they are building AlphaPepe’s DEX, staking system, and burn engine from day one.
AlphaSwap scans every contract for safety before you click buy and shows whale activity on the same screen. Every swap burns ALPE permanently while paying stakers real yield.
The BlockSAFU audit came back with a perfect score. USDT rewards are distributed to holders with full on-chain proof. Staking at 85% APR compounds while the listing approaches. The presale price goes up every few days and it never comes back down.
Remember the person who put $8,000 into Shiba Inu before the Binance listing and watched it become $5.7 million according to CNN. Every early holder says the same thing. They did not buy enough. That exact pattern is forming inside AlphaPepe right now and the wallets entering carry the same profile as the addresses that accumulated SHIB before anyone was paying attention.
Dogecoin Price Prediction: Volume Down and the Forecast Barely Beats Inflation
DOGE sits at $0.10 stuck between a falling 200 day moving average and weak support at $0.094. Active addresses spiked 176% recently but the price barely moved, which means the activity is distribution not accumulation.
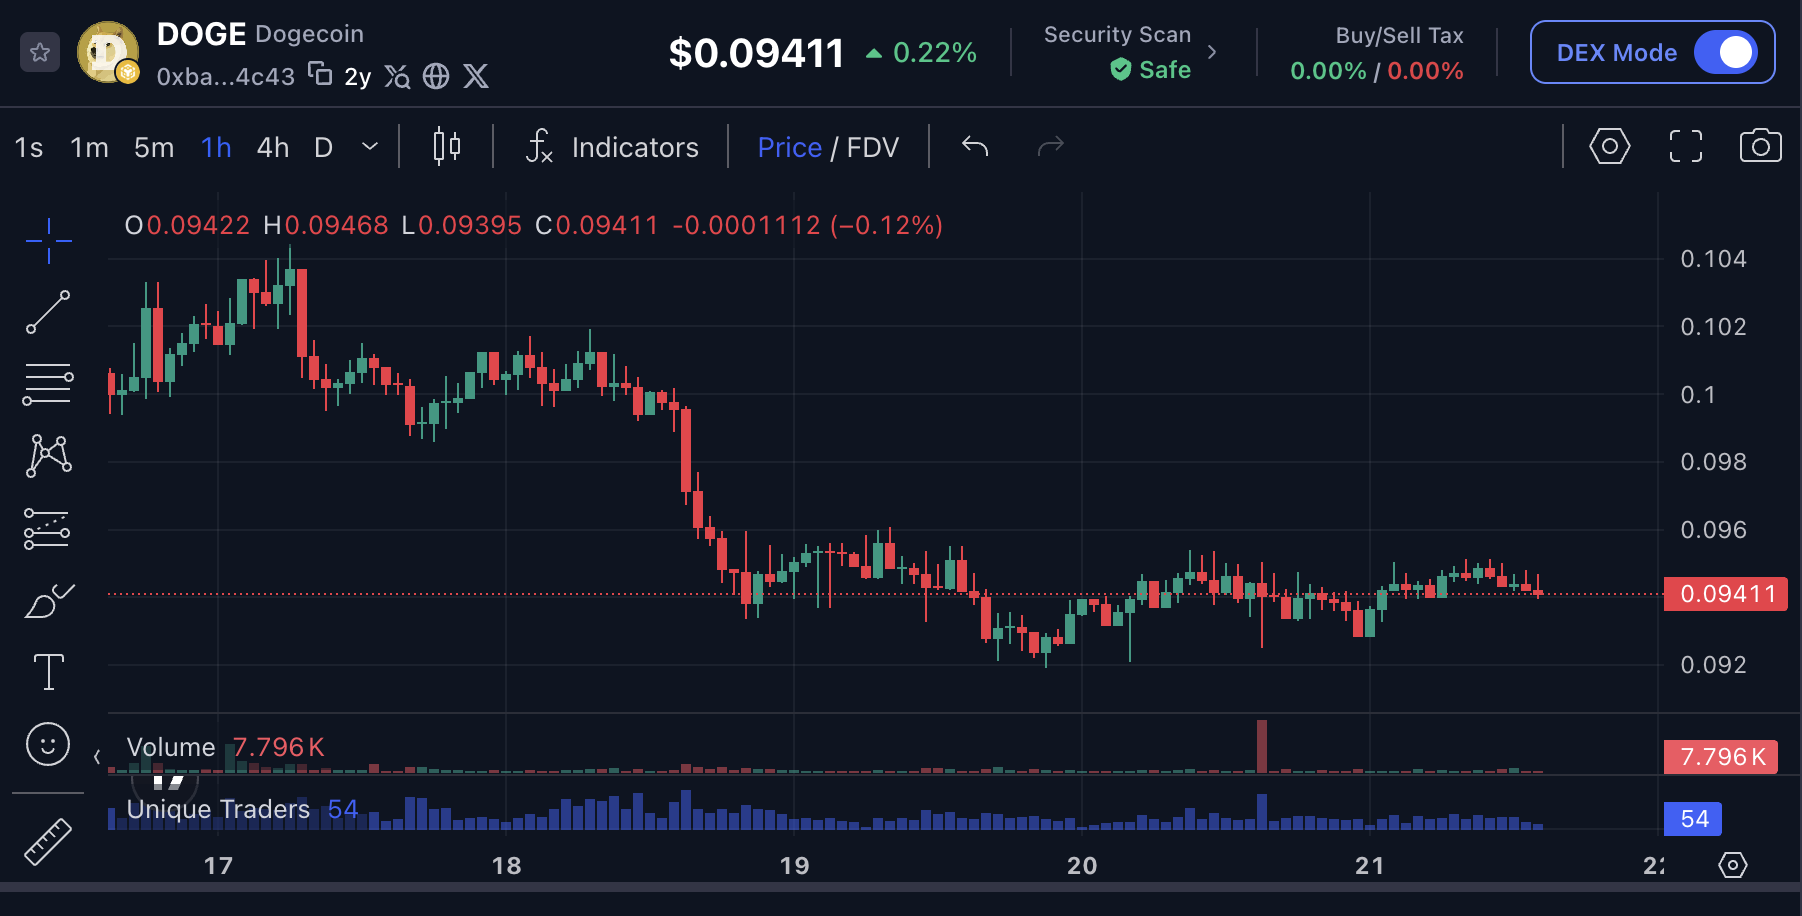
The dogecoin price prediction does not even reach $0.15 until late summer in the most bullish scenario. You will not build meaningful wealth from a return that barely beats inflation. That is the honest truth about the dogecoin price prediction right now.
The Dogecoin Price Prediction Will Not Get You There but This Presale Can
The market is scared. Portfolios are red. Most people will do nothing because fear makes you freeze. But the wallets that built real wealth in every cycle did it by moving when everyone else was afraid.
Every cycle produces one breakout presale. 2020 had SHIB. 2023 had PEPE. 2026 has not had its breakout yet. AlphaPepe at $0.00790 with a Shibarium engineer, an intelligence DEX, and a Q2 listing is the setup those wallets recognize. Stages are closing faster than projected and over 100 new holders join daily.
Now is the time to enter this presale at $0.00790 instead of watching the dogecoin price prediction crawl toward 30%. The Q2 listing is approaching and the presale closes permanently when it arrives. Visit the AlphaPepe official website and stop waiting for a dogecoin price prediction that was never going to turn $10,000 into $1,000,000.
Click To Visit AlphaPepe Website To Enter The Presale
FAQs
Why are whales choosing AlphaPepe over Dogecoin?
AlphaPepe looks far more explosive, with an early-entry upside that DOGE simply cannot match now.
Can AlphaPepe outperform Dogecoin in 2026?
Yes, many traders believe AlphaPepe has breakout potential that could massively outpace DOGE.
Is AlphaPepe legit?
AlphaPepe looks credible to many buyers because it already shows utility, active community traction, and tokens are delivered instantly upon purchase.
Disclaimer: This is a Press Release provided by a third party who is responsible for the content. Please conduct your own research before taking any action based on the content.


Ripple has issued a warning regarding the rise of scam accounts impersonating the company on Telegram. The company clarified that it does not have an official Telegram channel, urging users to stay vigilant against potential fraud.
Summary
- Ripple confirms it has no official Telegram channel for support.
- Scammers use Ripple branding and CEO photos to deceive users.
- XRP Ledger grows, with over 7.7 million holders amid rising scams.
RippleX, a division of Ripple, recently warned the public about an increase in impersonation accounts on social media platforms like Telegram. Fraudsters have been creating accounts pretending to be Ripple recruiters, customer support representatives, or other employees. These scammers often use the company’s branding and images, including pictures of Ripple CEO Brad Garlinghouse, to deceive potential victims.
Ripple emphasized that it does not conduct business through unofficial channels such as Telegram. The company assured its community that it will never contact users directly to offer support, request personal information, or ask for payments.
“Any account claiming to be an official Ripple Telegram is not legitimate,” Ripple stated in a tweet.
How Scammers Operate
Fraudsters have been using various methods to gain trust and trick individuals into sending money. Scammers frequently post fake cryptocurrency giveaways that appear to be associated with Ripple. These fraudulent offers may use genuine videos from Ripple’s media interviews or public events, only to link victims to fake websites or crypto wallet addresses.
Ripple advised the XRP community to remain cautious when approached through unofficial communication channels. The company recommended that users verify any offers or communications by checking through official Ripple platforms.
Despite the rise in scams, Ripple’s XRP Ledger continues to grow, with an increasing number of wallets holding XRP. According to recent reports, the XRP Ledger now has over 7.7 million holders, with a significant rise in wallet addresses. As adoption of XRP grows, the company’s efforts to combat fraud are becoming more important to ensure the safety of its users.

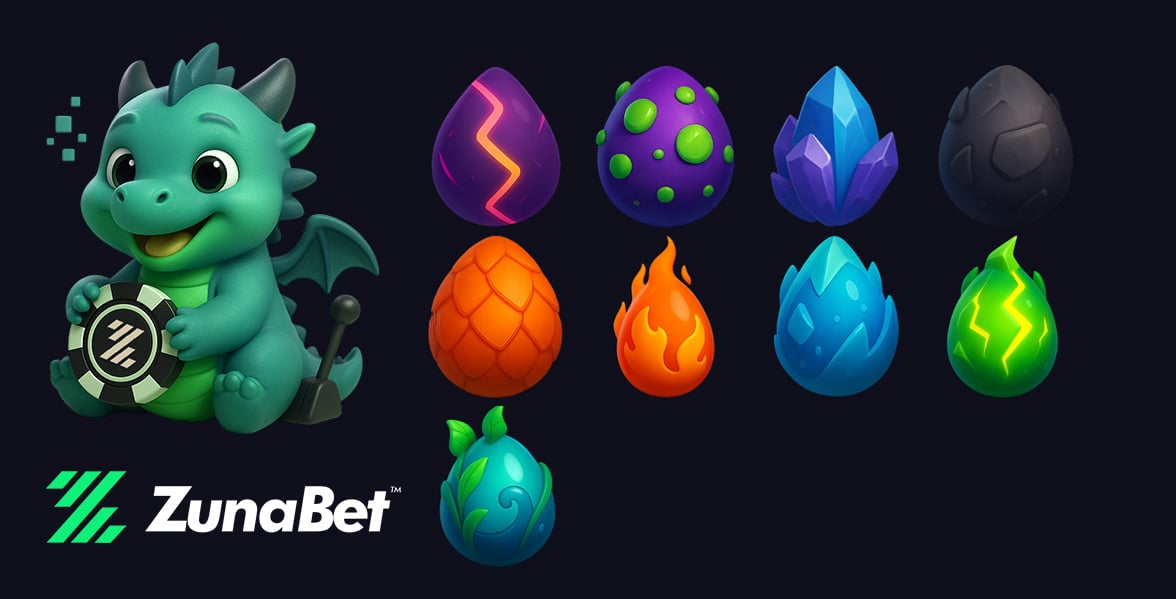
The online gambling industry has settled into a pattern over the past few years. A handful of large operators control most of the market, players pick from similar-looking products, and the biggest innovations tend to be minor updates to existing features. But every now and then a new platform arrives that forces a different kind of conversation. ZunaBet, which launched in 2026, is doing exactly that. Comparing it to a giant like FanDuel reveals just how much distance has opened up between what traditional operators offer and what a new generation of crypto-focused platforms are putting together.
FanDuel: The Household Name
FanDuel needs little introduction. It began as a daily fantasy sports company in 2009 and became one of the dominant forces in US sports betting after federal law changed in 2018. Today it operates under Flutter Entertainment, one of the world’s largest gambling groups, and holds licenses across numerous US states.
Sports betting is the engine of FanDuel’s business. The platform covers every major American sport along with international leagues, offering competitive lines and a polished mobile app that consistently ranks among the best available. FanDuel also runs an online casino product in jurisdictions where it is permitted, providing slots, table games, and some live dealer content. The casino side is functional but clearly plays a supporting role to the sportsbook.
Payments run entirely through traditional channels. Bank transfers, debit cards, PayPal, Venmo, and similar options make up the deposit and withdrawal methods. Processing times vary — deposits are usually quick, but withdrawals can take anywhere from same-day to several business days depending on the method chosen.
FanDuel’s promotional strategy leans heavily on sportsbook offers. New users typically receive some form of bonus bet or protected first wager. Casino promotions exist but tend to be smaller in scope. The loyalty program ties into Flutter’s wider rewards ecosystem, converting wagering activity into redeemable points. It functions as expected without doing anything to differentiate itself from the rewards programs at DraftKings, BetMGM, or Caesars.
FanDuel is a polished, heavily regulated product that delivers a reliable sports betting experience for the US market. What it is not is a platform that feels like it is pushing the industry forward.
ZunaBet: Purpose-Built for What Comes Next
ZunaBet entered the market in 2026 under the ownership of Strathvale Group Ltd. It is licensed in Anjouan and was created by a team carrying more than 20 years of gambling industry experience. The platform was not adapted from an existing product or pivoted from another business model. It was designed from a blank page as a crypto-native casino and sportsbook.
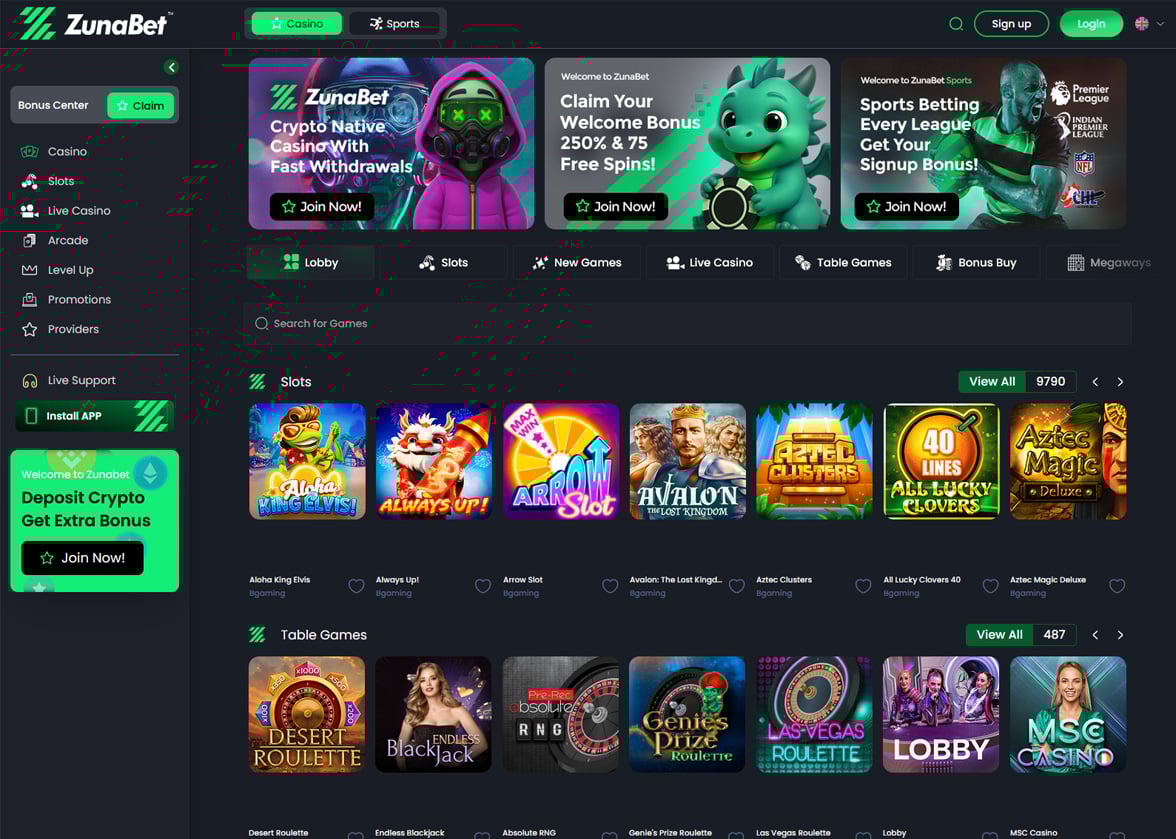
The casino library is staggering in its scope. ZunaBet carries more than 11,000 games sourced from 63 providers. Pragmatic Play, Evolution, Hacksaw Gaming, Yggdrasil, and BGaming headline the list, with dozens of additional studios filling out a catalog that covers everything from slots to RNG table games to live dealer rooms. To put the scale in perspective, FanDuel’s casino product — in the states where it operates one — offers a fraction of that number. ZunaBet’s game selection puts it in the top tier of crypto casinos globally.
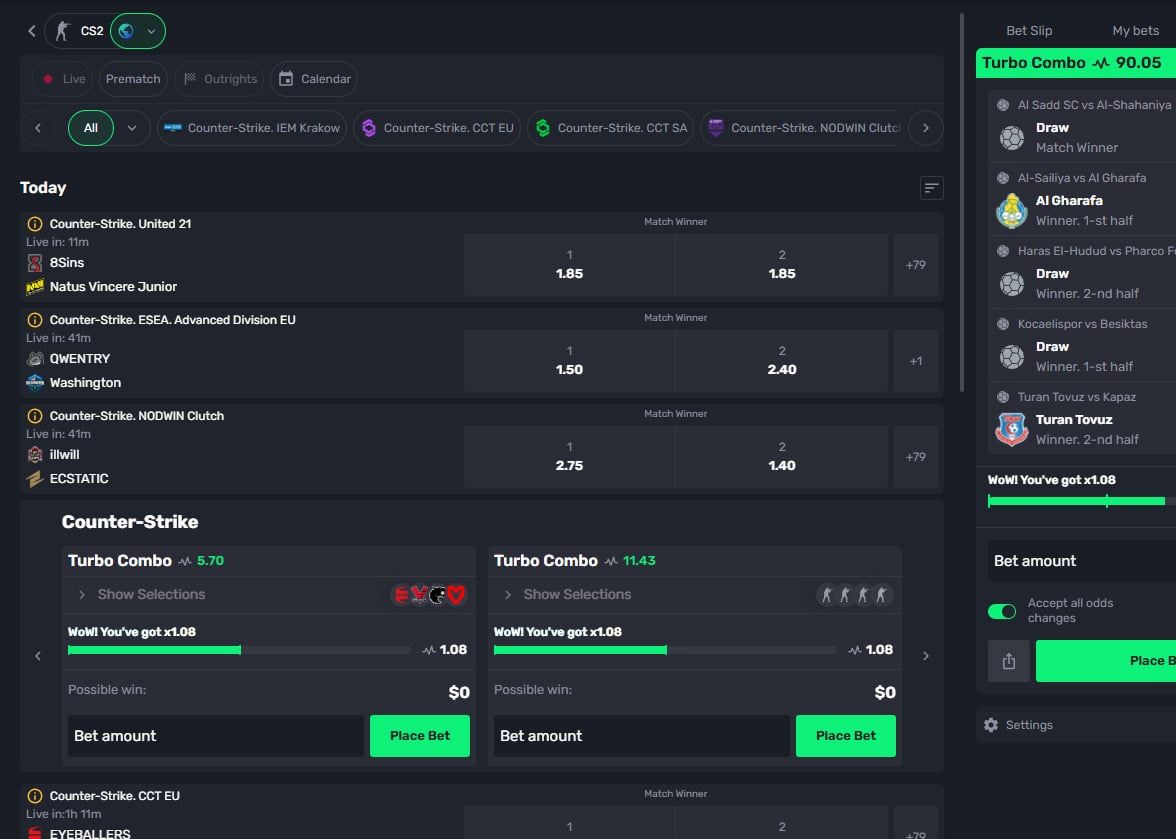
The sportsbook stands on its own as a complete betting product. Coverage includes football, basketball, tennis, NHL, combat sports, and virtual sports. The esports section is particularly robust, with active markets for CS2, Dota 2, League of Legends, and Valorant. FanDuel has deeper integration with US sports leagues and markets, but ZunaBet counters with broader global coverage and a level of esports depth that most traditional operators have not yet matched.
On the payment side, the two platforms could not be further apart. FanDuel is locked into fiat currency and traditional banking rails. ZunaBet supports more than 20 cryptocurrencies — BTC, ETH, USDT on multiple chains, SOL, DOGE, ADA, XRP, and others. No processing fees. Fast withdrawals. No need for players to involve a bank or payment processor at any stage. For anyone who holds crypto and has ever waited days for a fiat withdrawal to clear, the difference in experience is immediately obvious.
New players at ZunaBet get a welcome package totaling up to $5,000 in matched deposits plus 75 free spins. That breaks down to a 100% match up to $2,000 with 25 spins on the first deposit, 50% up to $1,500 with 25 spins on the second, and 100% up to $1,500 with 25 spins on the third. Measured against FanDuel’s typical introductory offers, particularly on the casino side, it is a considerably more generous starting point.
The platform itself is built on HTML5 with a clean dark-themed interface that loads quickly and scales across devices. Dedicated apps cover iOS, Android, Windows, and MacOS. Support is available via live chat at any hour.
Two Completely Different Loyalty Philosophies
FanDuel rewards players through its integrated points program. Wagering earns points, points can be exchanged for bonus bets or site credit, and tiered status provides modest upgrades to the overall package. It is a system designed primarily for sportsbook users and mirrors what every other major US operator does. There is nothing wrong with it, but there is also nothing about it that makes a player feel particularly valued or engaged beyond the transactional basics.
ZunaBet approached loyalty as an opportunity to do something players would actually care about. The program revolves around dragon evolution, featuring a mascot named Zuno and six progression tiers — Squire, Warden, Champion, Divine, Knight, and Ultimate. Rakeback begins at 1% for new players and increases all the way to 20% at the highest level. Additional unlocks include free spins scaling up to 1,000, VIP club membership, and double wheel spins.
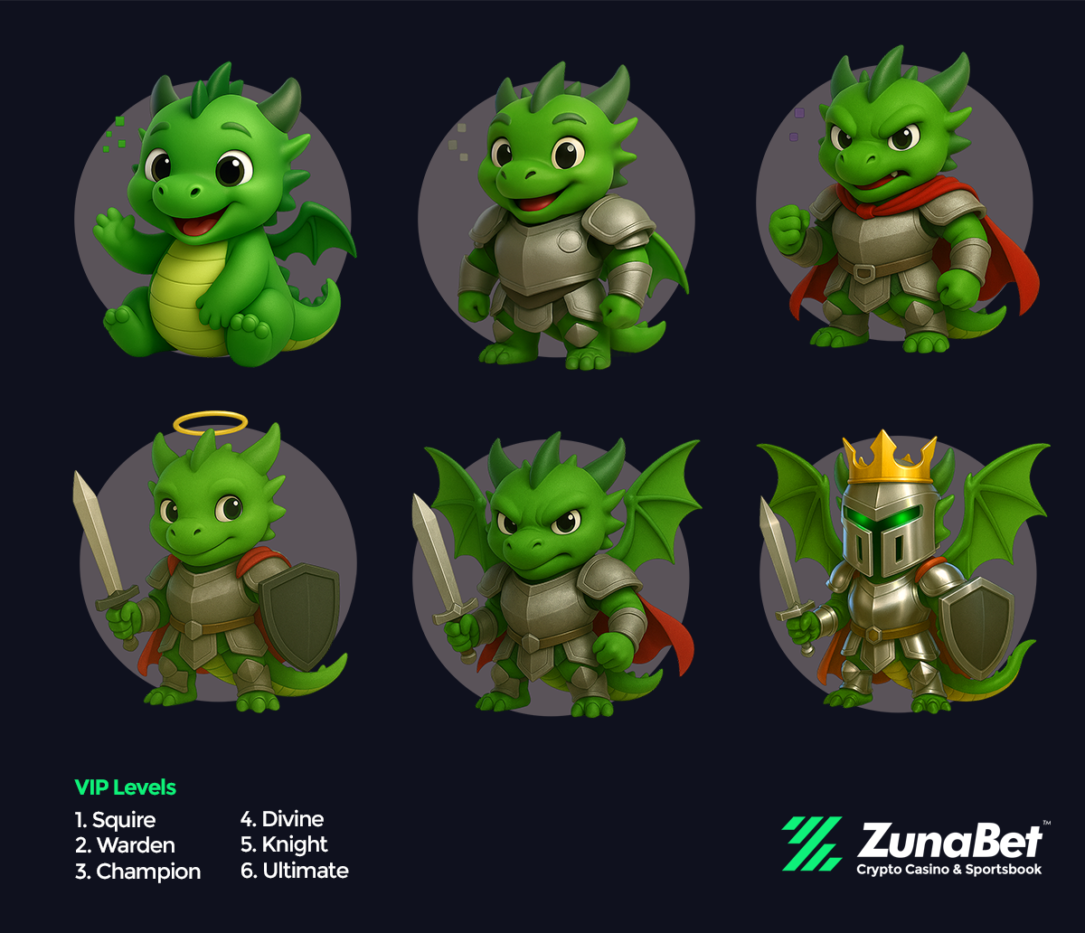
The structure pulls from game design rather than traditional casino reward logic. Progression is visible, milestones are clearly defined, and each tier feels like a genuine achievement rather than just an arbitrary label attached to a spending threshold. For players who have spent time in gaming environments where leveling up and unlocking rewards is part of the core experience, this kind of system feels natural and motivating. It makes the loyalty program part of the entertainment rather than a background process most players forget about.
The Fiat vs Crypto Divide
This comparison highlights something bigger than just two platforms. It exposes the growing divide between how traditional gambling operators handle money and what crypto-native players actually want.
FanDuel, along with DraftKings, Caesars, BetMGM, and other mainstream brands, was built on top of legacy payment systems. Credit card processors, bank transfers, e-wallets — all of these involve intermediaries that add time, cost, and complexity to every transaction. A player who wins on a Sunday night might not see those funds in their bank account until Wednesday. That has been the accepted reality for years, but it is not a reality that crypto users are willing to accept when alternatives exist.
ZunaBet eliminates that entire layer. Crypto deposits confirm in minutes. Withdrawals process without sitting in a queue. There are no conversion fees, no processing charges from the platform, and no third-party payment company sitting between the player and their money. The system works the way crypto is supposed to work — fast, direct, and without unnecessary intermediaries.
This is not just a convenience difference. It reflects a fundamentally different philosophy about how a gambling platform should relate to its players’ money. FanDuel operates within a system where delays and fees are built into the infrastructure. ZunaBet operates in a system where they have been engineered out of it entirely.

What This Comparison Actually Tells Us
FanDuel is a dominant force in legal US sports betting and that is unlikely to change in the near term. It has the brand, the licenses, the partnerships, and the user base to maintain that position. For players who want a regulated US sportsbook with a familiar interface and mainstream payment methods, FanDuel delivers exactly that.
But the market does not stand still. The number of players holding and using cryptocurrency continues to grow. Expectations around transaction speed and cost are shifting. A new generation of gamblers is arriving with preferences shaped more by gaming culture than by traditional casino culture. These players want bigger game libraries, faster payments, more engaging reward systems, and platforms that feel built for how they live now rather than how the industry operated five years ago.
ZunaBet was clearly designed with these players in mind. Over 11,000 games, 20+ cryptocurrencies, no processing fees, a $5,000 welcome package, a full sportsbook with serious esports coverage, apps on every major platform, and a loyalty program that borrows from gaming rather than copying from other casinos. It is a product that reads like a direct response to every limitation that traditional operators have been slow to address.
ZunaBet is still in its early days. FanDuel has years of operational proof behind it. But if the question is whether the market is shifting, the answer is visible in what ZunaBet has built. The future of online gambling is not going to look like a slightly updated version of the past. It is going to look a lot more like what ZunaBet is already offering.

Firefox Announces Built-In VPN and Other New Features – and Introduces Its New Mascot

Erica Banks Keeps It Real About Tina Knowles’ Cooking Skills

‘Gripping’ BBC murder mystery soars up Netflix top 10 after being quietly added


-

 Tech6 days ago
Your Legally Registered ‘Motorcycle’ Might Not Count Under Proposed US Law
-

 Politics22 hours ago
Jenni Murray, Long-Serving Woman’s Hour Presenter, Dies Aged 75
-
 Tech4 days ago
Are Split Spacebars the Next Big Gaming Keyboard Trend?
-

 Fashion22 hours ago
Weekend Open Thread: Adidas – Corporette.com
-

 Business6 days ago
Search for Savannah Guthrie’s Mother Enters Seventh Week with No Arrests
-

 News Videos3 days ago
RBA board divided on rate cut, unusually buoyant share market | Finance Report | ABC NEWS
-
Crypto World7 days ago
Coinbase and Bybit in Investment Talks: Could Bybit Finally Enter the US Crypto Market?
-
 Crypto World17 hours ago
NIO (NIO) Stock Plunges 6.5% as Shelf Registration Sparks Dilution Worries
-

 Business5 days ago
Australian shares drop as Iran war enters third week
-

 Crypto World5 days ago
Crypto Lender BlockFills Enters Chapter 11 with Up to $500M in Liabilities
-

 Politics3 days ago
The House | The new register to protect children from their abusers shows Parliament at its best
-

 Fashion5 days ago
25 Celebrities with Curly Hair That Are Naturally Beautiful
-

 Tech1 day ago
inKONBINI Lets You Spend Summer Days Behind the Register
-

 Crypto World3 days ago
Canada’s FINTRAC revokes registrations of 23 crypto MSBs in AML crackdown
-
 Politics4 days ago
Real-time pollution monitoring calls after boy nearly dies
-

 Crypto World7 days ago
Crypto Losses Drop 87% in February, But Hackers Are Now Targeting People, Not Code
-
 NewsBeat3 days ago
Residents in North Lanarkshire reminded to register to vote in Scottish Parliament Election
-

 Business5 days ago
Meta planning major layoffs as AI spending and automation reshape workforce
-

 News Videos3 days ago
PARLIAMENT OF MALAWI – PAC MEETING WITH REGISTRAR OF FINANCIAL ON AMARYLLIS HOTEL – INQUIRY LIVE
-

 Politics6 days ago
9 Stylish Leather Jackets Perfect For Spring 2026
You must be logged in to post a comment Login