
Crypto World
Polymarket’s 5-cent signal was the only thing that got the Netanyahu rumors right
The rumor followed a familiar wartime script. Iran’s Islamic Revolutionary Guard Corps claimed it had struck Benjamin Netanyahu’s office. Then came the forged screenshots — fake posts from the Israeli prime minister’s official account announcing he was dead. Then came the AI furore over a low-resolution freeze-frame from a press conference that, at the right angle, appeared to show Netanyahu’s right hand sporting six fingers, leading contrarian commentators to take victory laps.
Conservative influencer Candace Owens amplified the claims loudly on X, demanding to know where Netanyahu was and why his office was “releasing and deleting fake AI videos.” Iran’s Tasnim News Agency — run by the Islamic Revolutionary Guard Corps — published an article titled “New Video of Netanyahu Proves Fake,” cataloguing alleged clear signs that a subsequent coffee shop clip, posted by Netanyahu’s own account to debunk the rumors, was itself generated by artificial intelligence. The conspiracy had become self-sealing; every refutation was recast as fresh evidence.
But while the fact-checkers scrambled and the podcasters speculated, one data source offered a clean, immediate signal. On Polymarket, the world’s largest crypto prediction market, the contract for “Netanyahu out by March 31” was trading at around 4 to 5 cents, implying a roughly 4 to 5% probability of him leaving office before the end of the month. The market didn’t move. For anyone paying attention to that number, the entire conspiracy theory collapsed in a single glance.

A record-breaking backdrop
To understand why the Netanyahu conspiracy took hold when it did, you need to understand the information environment it emerged from.
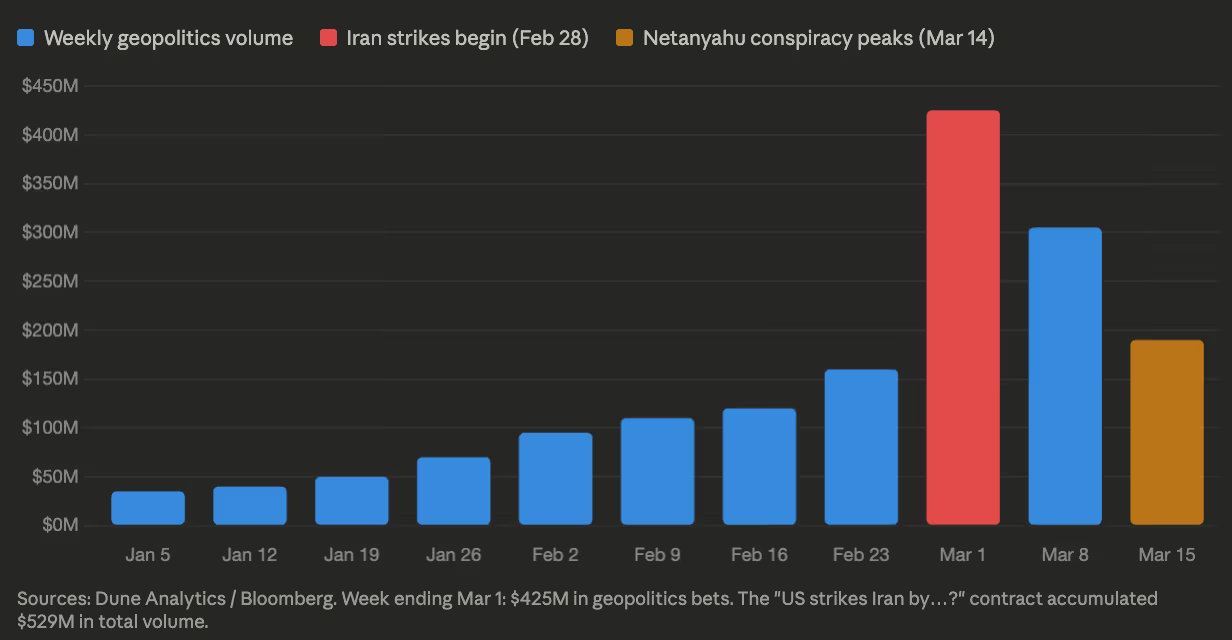
Since the U.S. and Israel launched strikes on Iran on Feb. 28, Polymarket has been transformed into something closer to a real-time geopolitical intelligence terminal. In the week ending March 1, bettors placed $425 million in geopolitics wagers on the platform alone — up from $163 million the prior week — with total platform wagering hitting a record $2.4 billion. The “US strikes Iran by…?” contract accumulated $529 million in total volume, making it one of the largest single markets Polymarket has ever hosted and the fourth-largest in its entire “Politics” category.
It is a remarkable trajectory for a platform that processed $73 million in total trading volume in 2023 and was pushed offshore by a CFTC settlement a year later. By 2025, Polymarket had processed approximately $22 billion in notional trading volume across the year — a figure that underscores how quickly the platform has moved from crypto curiosity to mainstream financial infrastructure.
This is no longer a crypto curiosity. In October 2025, the Intercontinental Exchange, parent company of the New York Stock Exchange, invested $2 billion into Polymarket at a $9 billion valuation, and launched a “Polymarket Signals and Sentiment” tool that feeds real-time prediction market data directly to Wall Street trading desks. When the Iran war began, equity and oil futures markets were closed for the weekend. Polymarket was not.
The market as instant truth machine
Prediction markets don’t have death contracts in the conventional sense. What Polymarket offers instead are “politician out by X date” markets, which resolve “Yes” if a leader resigns, is removed, or steps down. They don’t directly price the probability of death. But in a context where the conspiracy theory is that Netanyahu has been killed and the government is conducting a cover-up, these contracts function as a powerful proxy.
The logic is simple. A leader who has died or been incapacitated cannot indefinitely run a country from office. Eventually, a resignation, a removal or a credible leak would surface. And if any of that happened, the payout on a “Yes” share at 5 cents would be enormous: a $1 payout on a 5-cent share is a 20-to-1 return.
One trader was willing to make that bet at scale. A single Polymarket account placed $151,000 on Netanyahu being out before March 31, accumulating nearly 3.8 million shares at 4.7 cents each. If correct, the position would pay out $3.8 million. It is currently underwater by roughly $26,000.
That number is the ceiling of rational conviction in the conspiracy. At the height of the online hysteria, the most aggressive speculator on record was willing to stake $150,000 on the theory — implying he knew the odds were long. The market as a whole put the probability at around 5%. Social media said it was certain. The money said otherwise.
“Whether a politician is in or out of office is a very economically meaningful outcome for a lot of people,” said Aaron Brogan, a managing attorney at Brogan Law who has advised on prediction market regulation. “These are exactly the kinds of markets that event contract rules were designed to accommodate.”
Why the odds are hard to fake
The 2024 US election cycle offered a masterclass in prediction market efficiency — and the limits of efforts to dismiss its signals. When Polymarket showed Donald Trump trading at a substantial premium over Kamala Harris, critics cried manipulation. A French trader, they alleged, had artificially pumped Trump’s odds using multiple accounts for political purposes.
The experts weren’t buying it. As Flip Pidot, co-founder of American Civics Exchange, told CoinDesk at the time: a true manipulator trying to move the price would simply pile in blindly and let themselves get filled at worsening prices. The French trader did the opposite — splitting orders strategically across accounts to minimize slippage. That is what profit-seeking looks like, not propaganda.
The deeper reason manipulation struggles to stick is expected value arbitrage. If a price is artificially depressed or inflated, profit-hungry traders pile in to exploit the gap until it closes. Cross-market arbitrage reinforces this: Polymarket prices in real time against Kalshi, Betfair, and others. If odds drift meaningfully out of line across platforms, traders immediately sell the higher price and buy the lower one, synchronizing markets toward a consensus.
Harry Crane, a statistics professor at Rutgers University who studies prediction markets, sees the Netanyahu episode as a near-perfect illustration of this dynamic. “These markets are an antidote to propaganda precisely because their resolution rules anchor outcomes to verifiable sources rather than narrative,” he told CoinDesk. “I understand why governments want to limit them — not because of concerns over leaking classified information, but because verifiable price signals are harder to control.”
That framing maps directly onto the Netanyahu conspiracy. The people claiming he was dead were doing structurally the same thing as those who cried Polymarket was rigged in 2024: attacking the signal rather than engaging with it.
What the market is actually pricing — and what it isn’t
Crane is careful about the limits of the signal, and his caveat is worth sitting with.
“The market is only pricing the probability that Netanyahu is verifiably out of office under these rules,” he said. The resolution criteria state that the contract resolves “Yes” if Netanyahu announces his resignation or is otherwise removed from office, confirmed by official sources or a consensus of credible reporting. If a government concealed a leader’s death so completely that no credible source ever confirmed it, the market could resolve “No” — faithfully, correctly under its own rules, and yet without capturing the underlying reality.
That dynamic was playing out in real time. Domer — a well-known prediction market trader who goes by ImJustKen online — was publicly holding a No position on Netanyahu leaving office before March 31. Not because he was certain Netanyahu was alive, but because he didn’t believe a departure would ever be confirmed under the market’s resolution criteria, even if it occurred. He was pricing the verification gap, not the conspiracy itself.
But that caveat reveals something important about the conspiracy itself. The Netanyahu death rumor only holds together if you believe in a cover-up so total — encompassing Israeli officials, international media, independent fact-checkers, and Netanyahu’s own social media accounts simultaneously — that no verifiable evidence would ever surface. At that point, the conspiracy has become unfalsifiable by design. An unfalsifiable claim is one no rational actor should stake capital on.
This is the key distinction from traditional fact-checking. A fact-checker requires institutional credibility, research time, and editorial process — all of which conspiracy theories are engineered to preemptively undermine. A Polymarket price requires none of that. It requires only that someone, somewhere, believes the opposite enough to put real money on it. When no one does, that is its own kind of proof.
The contrast case: Khamenei
The clearest evidence that these markets work as a truth signal — and not merely as a null result — is what happened with the Khamenei contract.
When Iranian Supreme Leader Ali Khamenei was killed in the February 28 strikes, the “Khamenei out as Supreme Leader by March 31” contract on Polymarket behaved exactly as you would expect from an efficient market. It had hovered between 25% and 50% through January and February as tensions built, pricing genuine uncertainty about an escalating conflict. Then, when Iranian state TV confirmed his death, it spiked vertically to 100%. The contract drew $45 million in volume. The top trader made $757,000 on a yes bet. Four others cleared six figures.
The Netanyahu market did not do this. It stubbornly remained below 5 cents throughout the conspiracy cycle. The crowd that correctly priced Khamenei’s death — and got paid for it — looked at the Netanyahu claims and declined to move.

The regulatory storm gathering overhead
The informational value of these markets is being stress-tested at exactly the moment when political pressure against them is reaching its peak.
When Khamenei was killed, Kalshi — Polymarket’s CFTC-regulated rival — invoked a “death carveout” buried in its contract terms, settling its Khamenei positions at the last traded price before his death: roughly 39.5 cents rather than the full dollar. Polymarket, which carries no such carveout, paid out in full. A $54 million class action lawsuit against Kalshi followed.
The inconsistency in Kalshi’s approach has been pointed out sharply. In late 2024, Kalshi had run a market on whether a 100-year-old Jimmy Carter would attend Trump’s inauguration. When Carter died before it took place, Kalshi settled that contract to “No” — resolving a market directly via death, without invoking any carveout. As Crane has noted, the application of its death carveout appears to have been selective: they settle on death, just not when it’s expensive.
Kalshi disputes the characterization. “Our rules were clear from the beginning, we never changed them, and we settled based on the rules,” a spokesperson said. The company added that it reimbursed all fees and net losses out of pocket following the Khamenei settlement — “to the tune of millions of dollars” — ensuring no user lost money on the market. “Kalshi is a peer-to-peer exchange and does not profit from user losses. We have no incentive not to pay out our users, but we need to follow the rules of the exchange and the rule of law.”
On the legislative push, the company struck a conciliatory tone. “Kalshi already bans insider trading and markets directly tied to death and war,” a spokesperson said. “As a US-based exchange, we support regulators and policymakers from both sides of the aisle in their efforts to keep these markets safe and responsible in America.”
Kalshi declined to comment on record about the consistency of the death carveout as applied to the Khamenei contract versus the Carter market, or on the current status of the class action lawsuit.
Six Democratic senators, led by Adam Schiff, have written to the CFTC demanding a categorical ban on contracts that “resolve upon or closely correlate to an individual’s death.” Separately, senators Merkley and Klobuchar have introduced the End Prediction Market Corruption Act, which would bar the president, vice president, members of Congress, and their immediate families from trading event contracts, and impose fines and profit clawbacks for violations — citing the well-timed wagers on US strikes and Iranian leadership changes that netted some traders hundreds of thousands of dollars.
Blockchain analytics firm Bubblemaps identified six newly created wallets that collectively netted $1.2 million betting on the timing of US strikes on Iran, with accounts funded within 24 hours of the attack. One trader turned roughly $60,000 into nearly $500,000.
Brogan is skeptical that the legislative push has the momentum to land. “This is largely Democratic senators using the legislative process to generate political capital,” he said. “The conditions under which that legislation actually passes are where something really calamitous happens — some kind of market collapse or scandal that forces politicians to make an example of the industry. Without that, I don’t think there’s sufficient political capital to move it.”
He also draws a clear distinction between Polymarket’s legal exposure and Kalshi’s. “The restrictions Kalshi faces are not directly applicable to Polymarket,” Brogan said. Polymarket is not a CFTC-regulated US exchange — a status that stems from a 2021 settlement that pushed it offshore and barred US users from accessing it directly. That remains its largest single legal exposure, Brogan noted, though he pointed out that the Trump administration has shown little appetite for pursuing the kind of action the Biden administration explored against Polymarket CEO Shayne Coplan in early 2025.
Crane, for his part, is unambiguous about what would be lost if the legislative push succeeded. “These markets have genuine informational value and can counter propaganda,” he said. “That’s the case study here — a market involving war and the fate of a political leader doing exactly what its critics say it shouldn’t exist to do.”
There is also a state-level front opening up. Arizona recently charged Kalshi with operating an illegal gambling operation — part of a broader conflict between states that regulate and tax traditional gambling markets and federally-overseen prediction markets that sit outside their control. “The question that ultimately matters is whether federal law will preempt state law on this,” Brogan said. “There are courts hearing that question right now.”
What the crowd gets right — and what it can’t fix
None of this is to say prediction markets are infallible. Crane notes that nearly 25% of Polymarket’s historical volume has been attributed to wash trading — artificial activity generated by users trying to position themselves for a potential token airdrop — a figure that Columbia University researchers found peaked at around 60% in December 2024 before falling sharply. Wash trading inflates headline volume without necessarily biasing prices, but it is a legitimate caveat to the “wisdom of crowds” narrative.
The more fundamental limitation is what Crane identified in his answer to the manipulation question: a sufficiently coordinated disinformation campaign could, in theory, move a market — especially a smaller one. The Netanyahu “out by March 31” contract had enough liquidity to make that expensive, but not impossible.
What prediction markets cannot do is replace the underlying information infrastructure they depend on. They resolve against credible sources. If those sources are corrupted or silent — as Iranian state media clearly was throughout this episode — the market’s signal is only as good as the resolution criteria it is anchored to.
But in the Netanyahu case, that is precisely where the conspiracy fell apart. The rumor required a cover-up so comprehensive that no Israeli official, no international journalist, no independent fact-checker, and no market trader with real money on the line would ever find confirmation. The market priced that scenario at 5 cents. It was right.
When Candace Owens was demanding to know where Bibi was, Polymarket already had an answer. It just costs a few pennies to read it.


A group of Bitcoiners has launched a new open-source AI tool that generates evidence-based responses to misconceptions about Bitcoin’s environmental impact, energy use and its role in the financial system.
Nordic-based Bitcoin education platform Bitcoin Beyond 66 said it built “The Bitcoin Evidence Base” at a time when there is a “growing body of peer-reviewed research” showing the environmental benefits of Bitcoin mining, but “outdated data, methodologically weak studies, or plain lack of knowledge” continue to negatively shape public perception.
The database seeks to offer users quick access to relevant, evidence-based information about Bitcoin mining and related topics so they can share it with social media posters who have knowingly or unknowingly spread incorrect information about Bitcoin.
“The problem is that most people don’t have time to read 22+ peer-reviewed papers, Cambridge reports and ERCOT data. When someone posts criticism on social media, you need a credible response — fast.”

Display of The Bitcoin Evidence Base. Source: Bitcoin Beyond 66
The environmental impact of Bitcoin mining has been heavily debated for over a decade, drawing criticisms from some members of the United Nations and governments over concerns that it contributes to global warming.
However, Bitcoin environmentalists such as Daniel Batten argue that Bitcoin mining now uses a much larger share of lower-carbon and renewable energy sources, making many of the old narratives outdated.
The Bitcoin Evidence Base works by generating evidence-based responses to Bitcoin-related criticisms submitted by users via text or links.
Cointelegraph found that The Bitcoin Evidence Base routinely cites an April 2025 University of Cambridge study that found more than 52% of Bitcoin is now mined using renewable energy sources.
The database also points out that Bitcoin’s renewable energy mix is higher than that of the banking sector and that more than 22 peer-reviewed studies have documented the environmental benefits of Bitcoin.
There’s an art to addressing Bitcoin FUD
BB66 said the AI-powered database implements Batten’s Bitcoin “communication playbook” to counter Bitcoin misinformation with “evidence and empathy.”
This strategy includes acknowledging what was true about the criticisms before addressing the misconceptions in a way that aims to educate the person and the broader public rather than seeking to win a debate.
Related: Repeated Bitcoin profit taking near $77K suggests rally is losing steam
“If you’re trying to ‘own’ someone, you’ll trigger their defenses and accomplish nothing,” the Nordic-based Bitcoin group said.
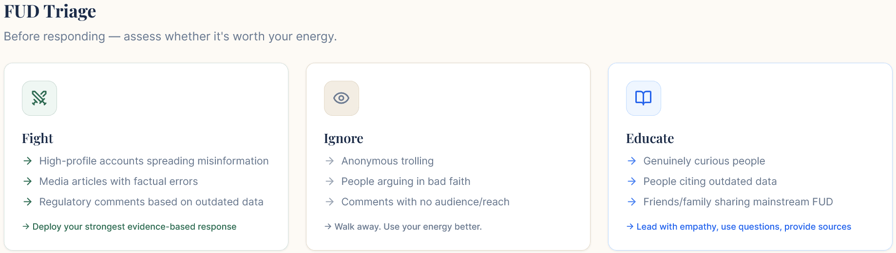
Bitcoin Beyond 66’s tips for Bitcoiners seeking to counter FUD. Source: Bitcoin Beyond 66
The database offers users three tones to use in response to criticism: direct, balanced and soft.
Users can help build the database by sharing papers and website links with BB66 for review before inclusion.
Magazine: Adam Back says current demand is ‘almost’ enough to send Bitcoin to $1M
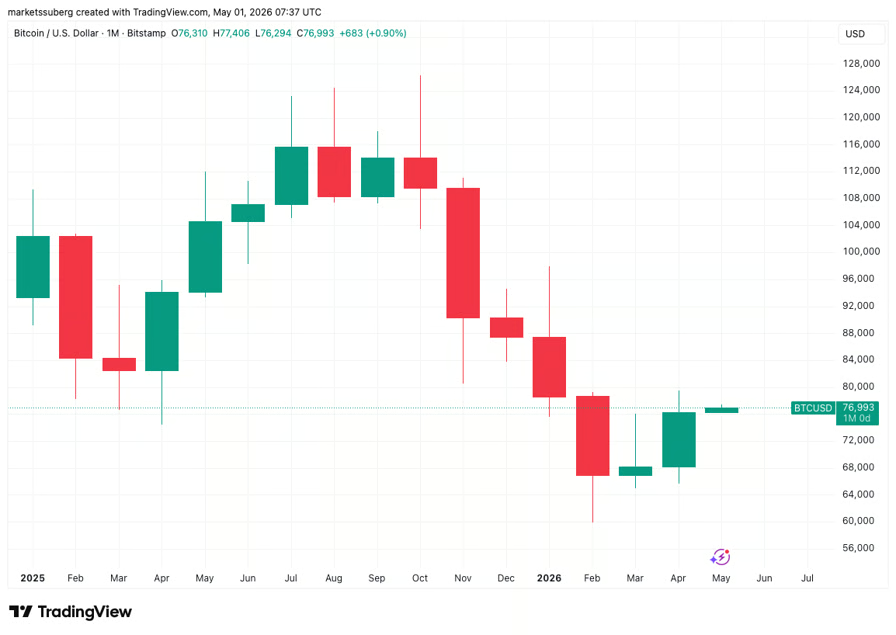
Bitcoin (BTC) eyed $77,500 on Friday after US stocks posted fresh record highs on strong tech earnings.
Key points:
- Bitcoin continues a rebound after the monthly close as stocks hit record highs.
- Strong tech earnings propel the S&P 500 over 7,200 points for the first time in history.
- PCE inflation data nears its highest levels in three years, prompting speculation about next month’s numbers.
Bitcoin creeps higher while S&P 500 makes history
Data from TradingView showed near 12% April BTC price gains as risk assets ignored rising US inflation signs.
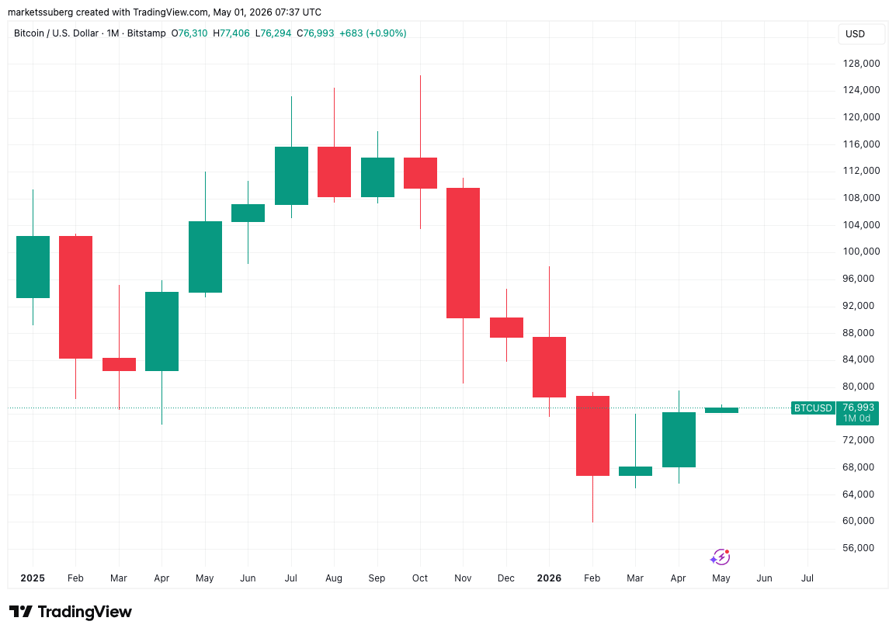
BTC/USD one-month chart. Source: Cointelegraph/TradingView
The S&P 500 reached nearly 7,220 points before closing ten points lower, propelled by stronger-than-expected earnings from Google and Apple.
Reacting on X, trading resource The Kobeissi Letter noted that the S&P had added over $8 trillion in market cap since hitting local lows at the end of March.
“A year ago it was at 5,600. 5 years ago it was at 4,200. 10 years ago it was at 2,100,” Charlie Bilello, chief market strategist at wealth manager Creative Planning, added.
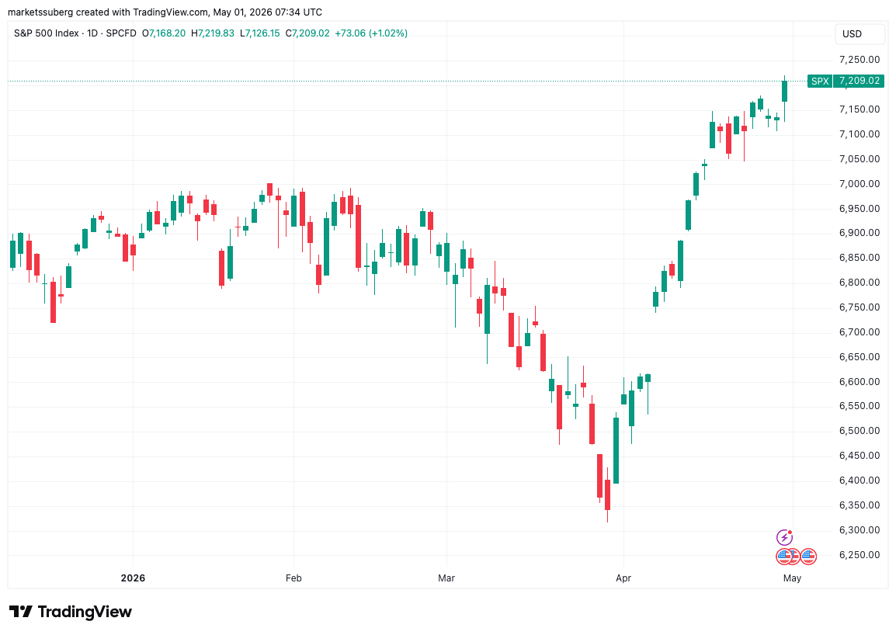
S&P 500 one-day chart. Source: Cointelegraph/TradingView
While Bitcoin’s gains were less pronounced, markets en masse appeared uninterested in US inflation warnings.
The March print of the Personal Consumption Expenditures (PCE) came in at 3.5%, per data from the US Bureau of Economic Analysis (BEA), marking its highest since August 2023.
Known as the Federal Reserve’s “preferred” inflation gauge, PCE had previously conformed to market estimates.
“In the first month of the Iran War, US inflation hit a 3-year high,” Kobeissi commented.
“April’s data will be interesting.”
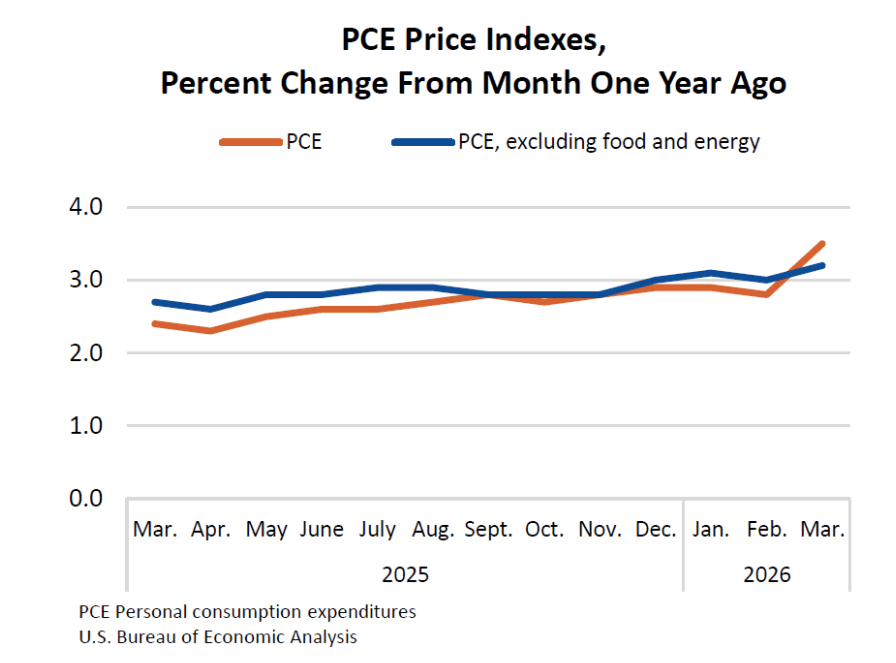
US PCE Indexes. Source: BEA
BTC price still struggling with support reclaim
Bitcoin thus closed out April’s monthly candle with mixed messages.
Related: Bitcoin Coinbase Premium threatens bear flag repeat with BTC price at $76K
At 11.9%, BTC/USD saw its highest monthly gains in a year, CoinGlass data confirmed, but the monthly candle fell short of reclaiming key support lines.
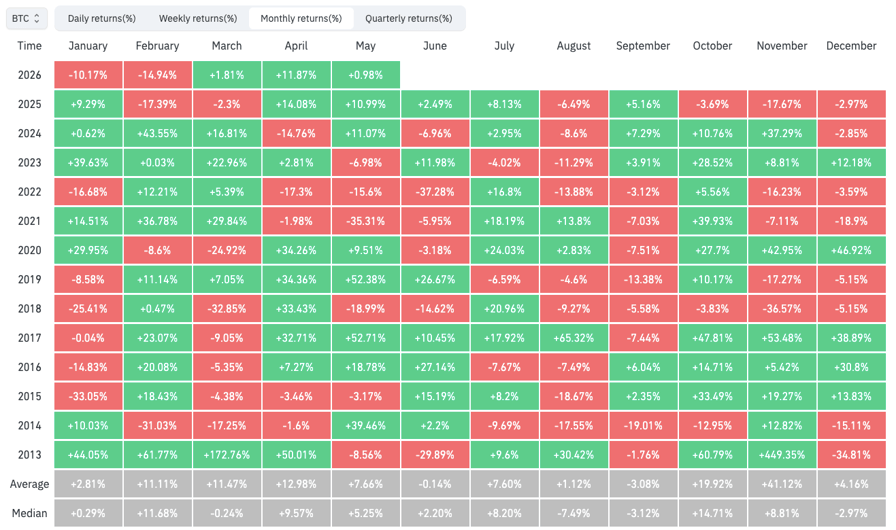
BTC/USD monthly returns (screenshot). Source: CoinGlass
As Cointelegraph reported, these included the 21-week exponential moving average (EMA), with only a single weekly close above it since last October.
“The Bitcoin pullback continues and this is looking more and more like an EMA rejection, especially if BTC isn’t able to Weekly Close above the EMA by end of week,” trader and analyst Rekt Capital warned X followers on Wednesday.
He added that a retest of the mid-$60,000 zone on weekly time frames was “technically necessary to achieve full breakout confirmation.”
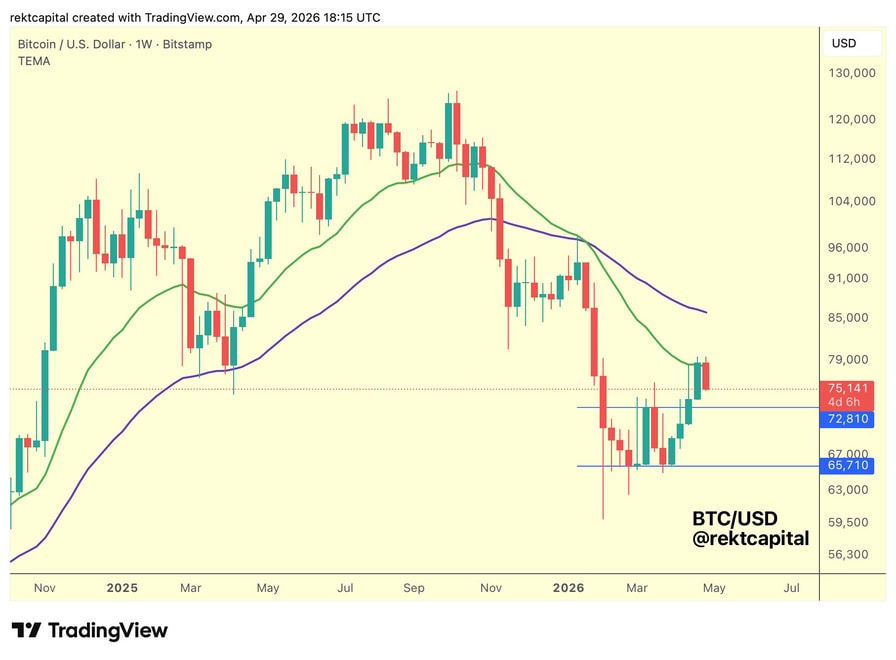
BTC/USD one-week chart. Source: Rekt Capital/X

Key Takeaways
- On April 30, NuScale Power (SMR) stock climbed more than 10% following Amazon’s announcement of three agreements supporting small modular reactor initiatives, featuring a $500 million stake in competitor X-energy.
- Despite not being directly involved in Amazon’s partnerships, NuScale benefited from the positive sentiment spreading across the entire SMR industry.
- Short sellers covering their positions intensified the upward movement as the share price accelerated.
- NuScale holds the distinction of being the sole American firm with Nuclear Regulatory Commission-certified SMR technology.
- With a market capitalization hovering around $3.88 billion, the stock had declined more than 20% year-to-date prior to this rally.
Shares of NuScale Power (SMR) climbed more than 10% on April 30, 2026, propelled by widespread optimism throughout the nuclear energy industry after Amazon revealed three strategic partnerships supporting small modular reactor development — highlighted by a $500 million commitment to competitor X-energy.
NuScale Power Corporation, SMR
Amazon’s announcement didn’t include NuScale among its chosen partners. Yet the stock rallied regardless.
This reaction reveals much about investor sentiment within the SMR market. When a technology giant commits hundreds of millions toward clean energy infrastructure, every company in that ecosystem benefits. Market participants rushed into nuclear-related equities en masse.
A short squeeze magnified the gains. NuScale has attracted significant short interest, and as share prices rose, pessimistic traders scrambled to exit their bearish bets. This forced buying created additional upward momentum.
NuScale’s Current Position
Trading at approximately $3.88 billion in market capitalization, NuScale occupies a compelling position. Competitor Oklo — another dedicated SMR developer — commands a valuation nearly triple that size. Before Wednesday’s surge, NuScale shares had declined more than 20% since the year began.
What distinguishes NuScale from competitors: it stands alone as the only American enterprise possessing Nuclear Regulatory Commission certification for its SMR technology. Securing this regulatory approval required years of effort and cannot be quickly duplicated. In an industry still establishing credibility, this achievement carries significant weight.
However, Bank of America research suggests substantial SMR deployment won’t materialize until 2030 or later, potentially extending to 2035. While the underlying technology exists, commercial markets remain undeveloped.
Long-Term Outlook and Challenges
NuScale’s business model emphasizes utility-scale installations. This differentiates the company from Oklo, which pursues smaller, customized deployments — such as dedicated power systems for individual data center facilities. Both approaches have merit. Neither has achieved large-scale validation.
Bank of America estimates the broader nuclear sector opportunity could reach approximately $10 trillion over three decades. Within that landscape, research indicates the SMR segment specifically may represent $1.5 trillion. Even capturing a modest portion would generate substantial returns relative to NuScale’s present valuation.
One market observer noted: a 2,000% appreciation from current levels would still leave NuScale’s market cap below $100 billion.
Yet such extraordinary gains would demand perfect execution across multiple fronts — sustained expansion in AI data center requirements, nuclear energy capturing meaningful market share of that demand, SMR technology achieving real-world commercial success, and NuScale’s utility-focused design emerging as an industry standard. This represents a considerable series of contingencies.
Daily trading activity for SMR averages approximately 27 million shares, demonstrating intense market attention on this equity. Technical indicators entering the week suggested bearish momentum, making Wednesday’s spike particularly noteworthy.
Despite the recent pop, NuScale’s year-to-date performance remained negative, with shares still down roughly 20% through April’s closing session.

Crypto World
Strategy (MSTR) Stock Climbs 5% Following Major Institutional Investments and Stable Bitcoin Holdings

Key Highlights
- Canadian pension giant Alberta Investment Management Corporation (AIMCo), overseeing $142B in assets, acquired 1.38M MSTR shares valued at approximately $219M
- AIMCo’s purchase represents its inaugural investment in a Bitcoin-focused treasury corporation
- Weekly Bitcoin acquisitions by Strategy plummeted 91%, declining from 34,164 BTC to just 3,273 BTC due to changes in capital sourcing
- MSTR finished April with a 33% gain, marking its first monthly advance after eight consecutive months of declines totaling 75%
- Strategy’s Bitcoin reserves reached 818,334 BTC, maintaining a narrow lead over BlackRock’s 810,077 BTC holdings
Strategy (MSTR) secured a significant institutional investor this week when AIMCo, a fund managing approximately $142 billion in assets, acquired 1.38 million shares of MSTR valued at roughly $219 million. The transaction represents the Canadian pension manager’s initial foray into Bitcoin treasury corporations.
In Thursday’s premarket trading, MSTR climbed 1.03% to reach $159.82 following the announcement. This uptick came after the stock experienced a 4.54% decline in the previous session, settling at $158.19 on Wednesday.
AIMCo joins a growing roster of institutional investors expanding their MSTR positions. Capital Group recently increased its holdings by 4.32 million shares through its American Funds Fundamental Investors vehicle, elevating its total position to 10.33 million shares with a current valuation of approximately $1.63 billion.
Vanguard made its own strategic addition during April, acquiring over 1.2 million shares valued at $195 million at the time of purchase. The investment giant now controls slightly more than 2 million shares through its VOE ETF, presently worth around $323 million.
Significant Slowdown in Bitcoin Accumulation
Strategy’s most recent Bitcoin acquisition showed a dramatic decrease compared to the preceding week. The company secured 3,273 BTC for $255 million, a stark contrast to the 34,164 BTC purchased for $2.54 billion the week before — representing a 91% reduction in acquisition volume.
The deceleration stemmed from Strategy’s funding approach. Instead of utilizing its preferred STRC stock, the company relied on common stock sales this time, which constrained the amount of capital available for deployment.
Despite the reduced acquisition pace, market sentiment suggests Strategy will maintain its accumulation strategy. Polymarket data indicates only a 10% likelihood that the company will liquidate any Bitcoin holdings before 2026 concludes.
Strategy’s cumulative Bitcoin position now totals 818,334 BTC, obtained through investments exceeding $61.8 billion. This positions the company marginally ahead of BlackRock, whose Bitcoin holdings stand at 810,077 BTC.
MSTR’s Turnaround and STRC Dividend Stability
April marked a significant reversal for MSTR. The stock concluded the month at $165, representing a 33% increase — the first monthly gain following eight consecutive months of losses. Between August 2025 and March 2026, the stock had experienced a cumulative 75% decline.
Bitcoin demonstrated similar strength during April, advancing 12% to deliver its strongest monthly performance since April 2025.
Regarding the preferred shares, Strategy maintained the STRC dividend rate at 11.5% for May, the third straight month at this level. STRC’s volume weighted average price for April registered at $99.76, sufficiently close to its $100 par value to justify keeping the rate unchanged.
STRC currently trades at $99.75 and has remained below par value since April 15.
Strategy is evaluating the possibility of transitioning to semi-monthly dividend distributions for STRC as a measure to minimize price fluctuations.
TipRanks analysts maintain a Strong Buy consensus rating on MSTR, with a mean price target of $283.33.

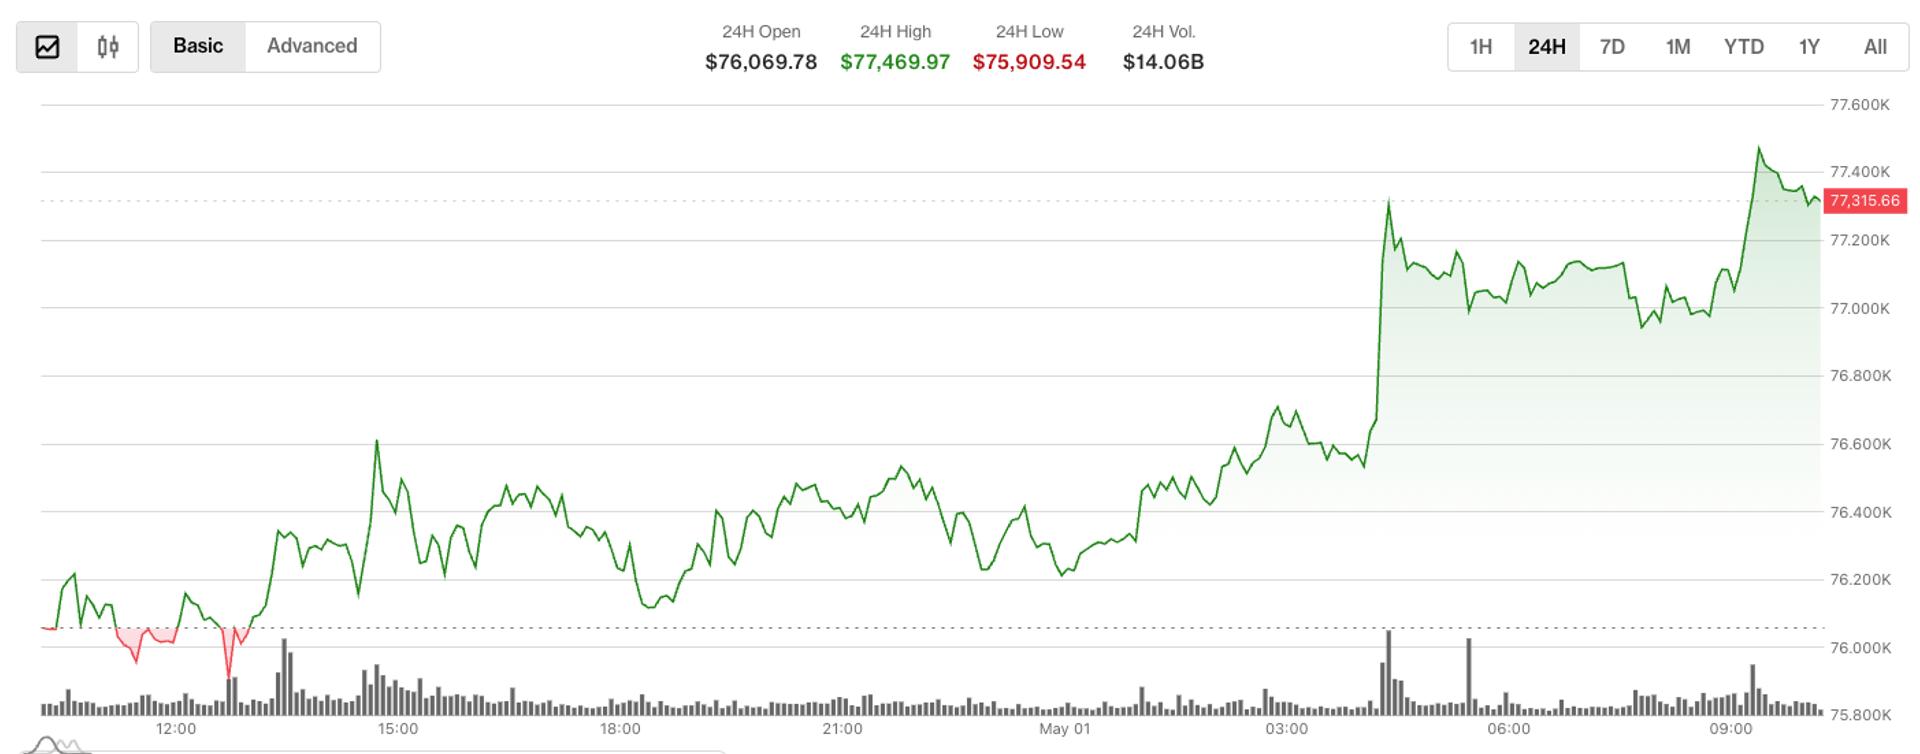
Bitcoin rose more than 1.2% during the European morning to reach just shy of $77,500 for a lift of about 1.7% in the last 24 hours.
The broader digital asset market, as measured by the CoinDesk 20 Index (CD20), also ticked higher, up around 0.95%.
Bitcoin’s gains came on above-average volume, with 24-hour activity running 15% above its seven-day average, indicating steady participation, according to CoinDesk Research’s technical analysis data model.
Derivatives markets may tell a more cautious story. Open interest in the June 26 $76,000 put option surged 22.5%, pointing to increased demand for downside protection near current price levels. The spike suggests institutional participants are positioning defensively, either locking in gains or preparing for potential declines.
Furthermore, bitcoin worth over $770 million has been sent to exchanges in the last week, analyst Ali Martinez post on X, citing data from Santiment. This action is generally regarded as a pre-sale step, pointing to the possibility of considerable selling pressure in the near future.
Bitcoin’s tight correlation with the CD20 — showing only a 0.15% deviation — suggests macro forces, rather than crypto-specific catalysts, continue to drive price action. The index, which captures a large share of the digital asset market value, reinforces that BTC is trading as part of a broader risk complex rather than independently.
Technical levels at $76,200 and $77,000 remain critical as traders balance constructive price trends against defensive derivatives positioning.

TLDR:
- Broad altseason is considered an artefact of the past as too many coins chase shrinking speculative capital pools.
- Long-tail tokens have shifted from high risk, high reward to near-instant value destruction within seconds of holding.
- Bitcoin and Ethereum have underperformed historical recovery expectations, weakening the buy-the-dip anchor strategy.
- Institutional money is flowing into AI while retail traders favour stocks, pulling key demand drivers away from crypto markets.
The crypto market this cycle has delivered a stark reality check for traders who expected history to repeat. The familiar pattern of broad altcoin rallies lifting entire portfolios has failed to materialise in any meaningful way.
Prominent analyst CryptoCred laid out a detailed breakdown of what has changed and why. The post, shared on X, points to structural shifts rather than temporary setbacks. Traders are now confronting a market that demands far more than simple participation.
Altseason Is Gone and the Speculative Landscape Has Turned Dangerous
The crypto market no longer operates on the broad wealth-effect cycle that defined earlier bull runs. Too many coins now compete for a pool of speculative capital that has not grown proportionally.
That supply-demand imbalance makes a rising tide scenario nearly impossible to replicate. The analyst stated plainly that “broad brush alt season is an artefact of the past.”
The long-tail speculative end of the market has become structurally more hostile. What once offered high risk with equally high reward has shifted toward near-certain loss for holders.
The current environment is one where a token can be taken to zero within seconds. That speed of destruction removes any practical window for risk management.
Centralised exchanges, once the engine of retail speculation, have lost their grip on this activity. Excess speculation has migrated into bundled token environments operating in maximum player-versus-player conditions.
This shift means the mechanisms that once drove altcoin momentum are no longer functioning in the same venues. Retail traders chasing that old playbook are entering a fundamentally different game.
Correlation across the crypto market has also tightened to a degree that eliminates sector-based strategy. Assets that once moved independently now collapse together during drawdowns.
This convergence has been described as “a tightly correlated mush,” particularly on the downside. That removes one of the few tools traders historically used to manage portfolio risk across different crypto segments.
Blue Chips Have Disappointed and Strategy Must Now Evolve
Even the historically reliable anchors of the crypto market have underperformed this cycle. Bitcoin and Ethereum, long considered safe entries during deep drawdowns, have not produced the explosive recoveries traders expected.
The assumption that all-time highs are guaranteed and predictable has weakened considerably. That shift challenges one of the most widely held beliefs in long-term crypto investing.
CryptoCred noted the cycle was “extremely concentrated versus broad brush wealth effect.” Something also visibly broke in market structure after October 2024, which was flagged directly in the analysis.
These two factors together mark a clean departure from previous cycle behaviour. Traders relying on past templates are now working with an outdated map.
Institutional capital has largely moved toward artificial intelligence, not crypto. Retail speculative energy has followed single-name stocks and zero-day equity options instead.
That dual departure strips away two demand drivers that historically supported altcoin momentum. The competition for speculative attention is now broader and more intense than any previous cycle.
Both timing and selection now carry equal weight for any trader operating in this environment. Participation alone no longer generates an edge the way it did when the asset class was earlier and less crowded.
CryptoCred closed with a candid remark: “Hopefully I’m an idiot doomposting the bottom GM.” Whether this cycle marks a floor or a permanent structural shift in the crypto market remains the central question.

Bitcoin’s April advance appears increasingly fragile from a sector-wide perspective, as a sharp rally driven by futures trading contrasts with cooling spot demand. CryptoQuant’s latest on-chain analysis shows a roughly 20% rise for Bitcoin in April, climbing from around $66,000 to a peak near $79,000, a move the firm attributes largely to growth in perpetual futures activity. At the same time, on-chain data indicate the market’s marginal buyer was more speculative than fundamental, a dynamic that raises questions about sustainability beyond the current cycle.
As of this writing, Bitcoin was hovering around $77,000, up about 2% on the prior 24 hours. CryptoQuant noted that the April price surge diverged from underlying spot demand, signaling that the momentum may not be supported by long-term buyers or real user adoption. In its assessment, the firm described the divergence between rising prices and contracting spot demand as one of the clearest on-chain signals that current gains are driven by speculative activity rather than a structural shift in demand fundamentals.
Key takeaways
- April’s roughly 20% Bitcoin rally was led by perpetual futures demand, with spot buying cooling during the move.
- The price surge coincided with a backdrop of contracting spot demand, signaling a speculative-driven rally rather than a broad-based fundamentals-led move.
- CryptoQuant warned that the divergence between price and on-chain demand has historically preceded further downside in Bitcoin’s price within bear-market regimes.
- CryptoQuant’s Bull Score Index slid to 40 in April, suggesting growing bearish sentiment despite the price uptick.
Futures-led momentum and the spot-demand paradox
The CryptoQuant report emphasizes a notable shift in market mechanics during April. While Bitcoin advanced toward the high 70s, on-chain activity that would indicate sustained interest from real-world buyers—such as steady spot purchases or rising exchange balances held by long-term holders—remained muted. The firm framed this as a classic indicator of speculative leverage: price gains propelled by futures demand, not by a broadened base of physical demand or treasury accumulation.
Such dynamics are not isolated incidents. The data point to a broader pattern in which a futures-dominated rally can inflate prices temporarily while underlying demand remains fragile. This distinction matters for traders and holders who weigh whether a rally represents a durable shift in the market’s risk-reward or a tactical move that could reverse under tightening liquidity or shifting sentiment.
Comparative context: past cycles and risk signals
CryptoQuant highlighted a historical resonance with the early phase of the 2022 bear market, when futures-driven strength outpaced the spot market before a sustained price decline took hold. In that frame, a rally built on speculative demand without corresponding fundamentals can intensify downside pressure once speculative incentives swing the other way or market liquidity tightens.
That risk assessment sits alongside other macro and market signals. Bitcoin’s current trajectory—price resilience paired with weakening on-chain fundamentals—creates a mixed backdrop for market participants. CryptoQuant stressed that the pattern observed in April remains a reminder of the bear-market regime’s potential to reassert itself, even as short-term momentum persists.
Dueling narratives on the drivers of the rally
The April move has drawn attention to differing interpretations of what’s fueling Bitcoin’s resilience. On one side, CryptoQuant’s analysis underscores the preponderance of futures-driven activity, warning that the rally may not reflect a durable shift in demand fundamentals. On the other side, commentary from market participants has highlighted substantial demand from other quarters. For instance, Bitwise’s chief investment officer Matt Hougan argued that bitcoin-related strategic purchases, including actions by an entity described as Strategy, have been a central driver of the recent rally. He pointed to strong ETF demand and renewed interest from long-term holders as reinforcing factors, while singling out Strategy as a particularly significant contributor to the rally’s momentum.
Both perspectives point to a broader theme: multiple drivers of price action can coexist, and disentangling them is essential for assessing whether the rally will endure. If futures-driven demand remains the dominant force, the market could face heightened volatility and potential downside if those funds retreat or if spot buyers do not step in to take their place.
Market sentiment and what to watch next
CryptoQuant’s Bulls Score, an index that combines market and network signals to gauge sentiment, dipped from 50 to 40 in April. The decline suggests a softening near-term outlook despite price gains, aligning with the idea that the market may be approaching a more cautious phase. The combination of price strength with weakening sentiment and spot demand has prompted observers to wonder whether the rally can translate into a more durable uptrend or if it will unwind as speculative liquidity tightens.
For investors, several questions loom: Will spot buyers eventually re-enter with conviction, supported by macro catalysts or institutional inflows? Or will futures-driven momentum fade, leaving prices to correct as speculative positions unwind? The answer may hinge on how other demand channels—such as ETFs, long-term Treasury-like holdings, and emerging institutional interest—respond in the coming weeks and months.
Closing perspective
As Bitcoin navigates a marketplace characterized by mixed signals, the split between price momentum and fundamental demand remains a critical watchpoint. The April episode reinforces a broader lesson for investors and builders: price action can diverge from on-chain health for extended periods, but sustained upside typically requires a genuine uptick in durable demand. Readers should monitor how spot demand evolves, how institutional and ETF-driven flows develop, and whether sentiment indices indicate a meaningful shift toward risk appetite or a cautiousism that could cap near-term gains.
EUR/USD started a fresh increase above 1.1700 and 1.1720. USD/CHF declined further and is now struggling below 0.7835.
Important Takeaways for EUR/USD and USD/CHF Analysis Today
· The Euro started a decent increase from 1.1650 against the US Dollar.
· There was a break above a bearish trend line with resistance at 1.1685 on the hourly chart of EUR/USD at FXOpen.
· USD/CHF declined below the 0.7865 and 0.7850 support levels.
· There was a break below a bullish trend line with support at 0.7910 on the hourly chart at FXOpen.
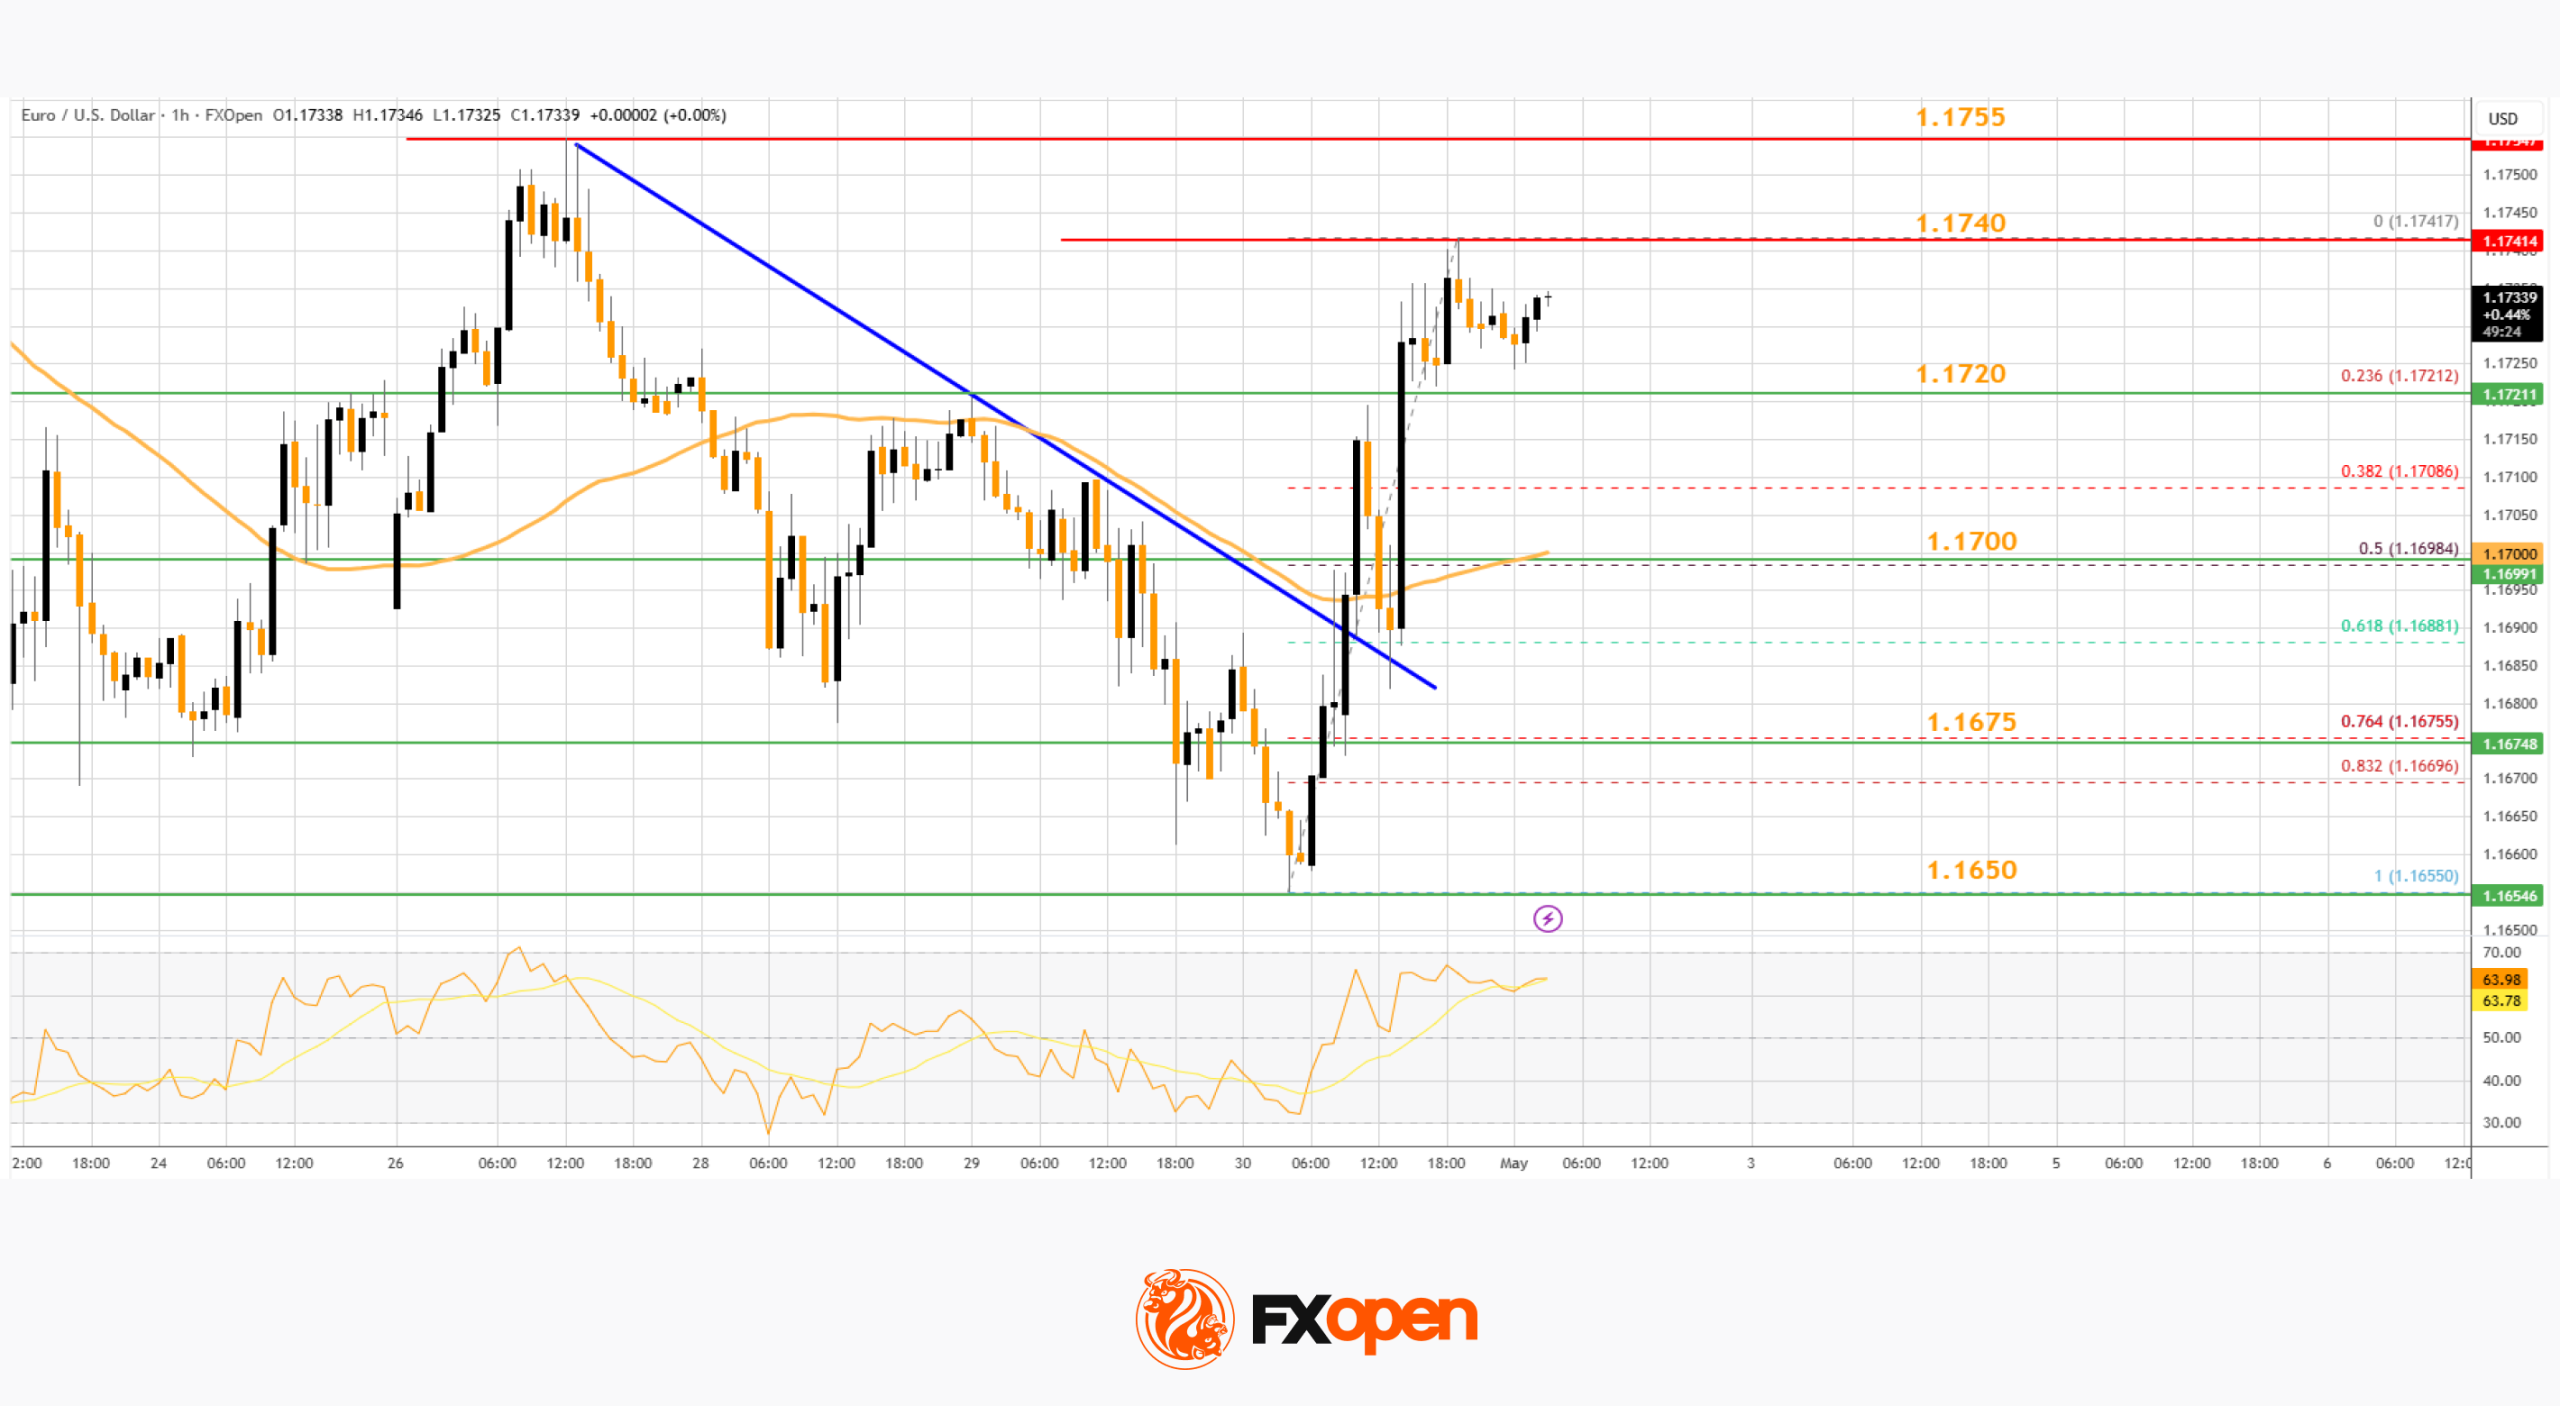
EUR/USD Technical Analysis

On the hourly chart of EUR/USD at FXOpen, the pair started a fresh increase from the 1.1650 zone. The Euro cleared the 1.1700 barrier to move into a bullish zone against the US Dollar.
There was a break above a bearish trend line with resistance at 1.1685. The bulls pushed the pair above the 50-hour simple moving average and 1.1720. Finally, the pair cleared 1.1735. A high was formed near 1.1740 and the pair is now consolidating gains.
An Immediate bid zone on the downside is near the 23.6% Fib retracement level of the upward wave from the 1.1655 swing low to the 1.1740 high at 1.1720.
The next area of interest could be near 1.1700, the 50% Fib retracement level, and the 50-hour simple moving average. A downside break below 1.1700 might send the pair toward 1.1675. Any more losses might send the pair into a bearish zone toward 1.1650.
If there is a fresh increase, an immediate hurdle on the EUR/USD chart is 1.1750. The first major pivot level for the bulls could be 1.1755. An upside break above 1.1755 might send the pair to 1.1800. The next selling zone could be 1.1850. Any more gains might open the doors for a move toward 1.1920.
USD/CHF Technical Analysis
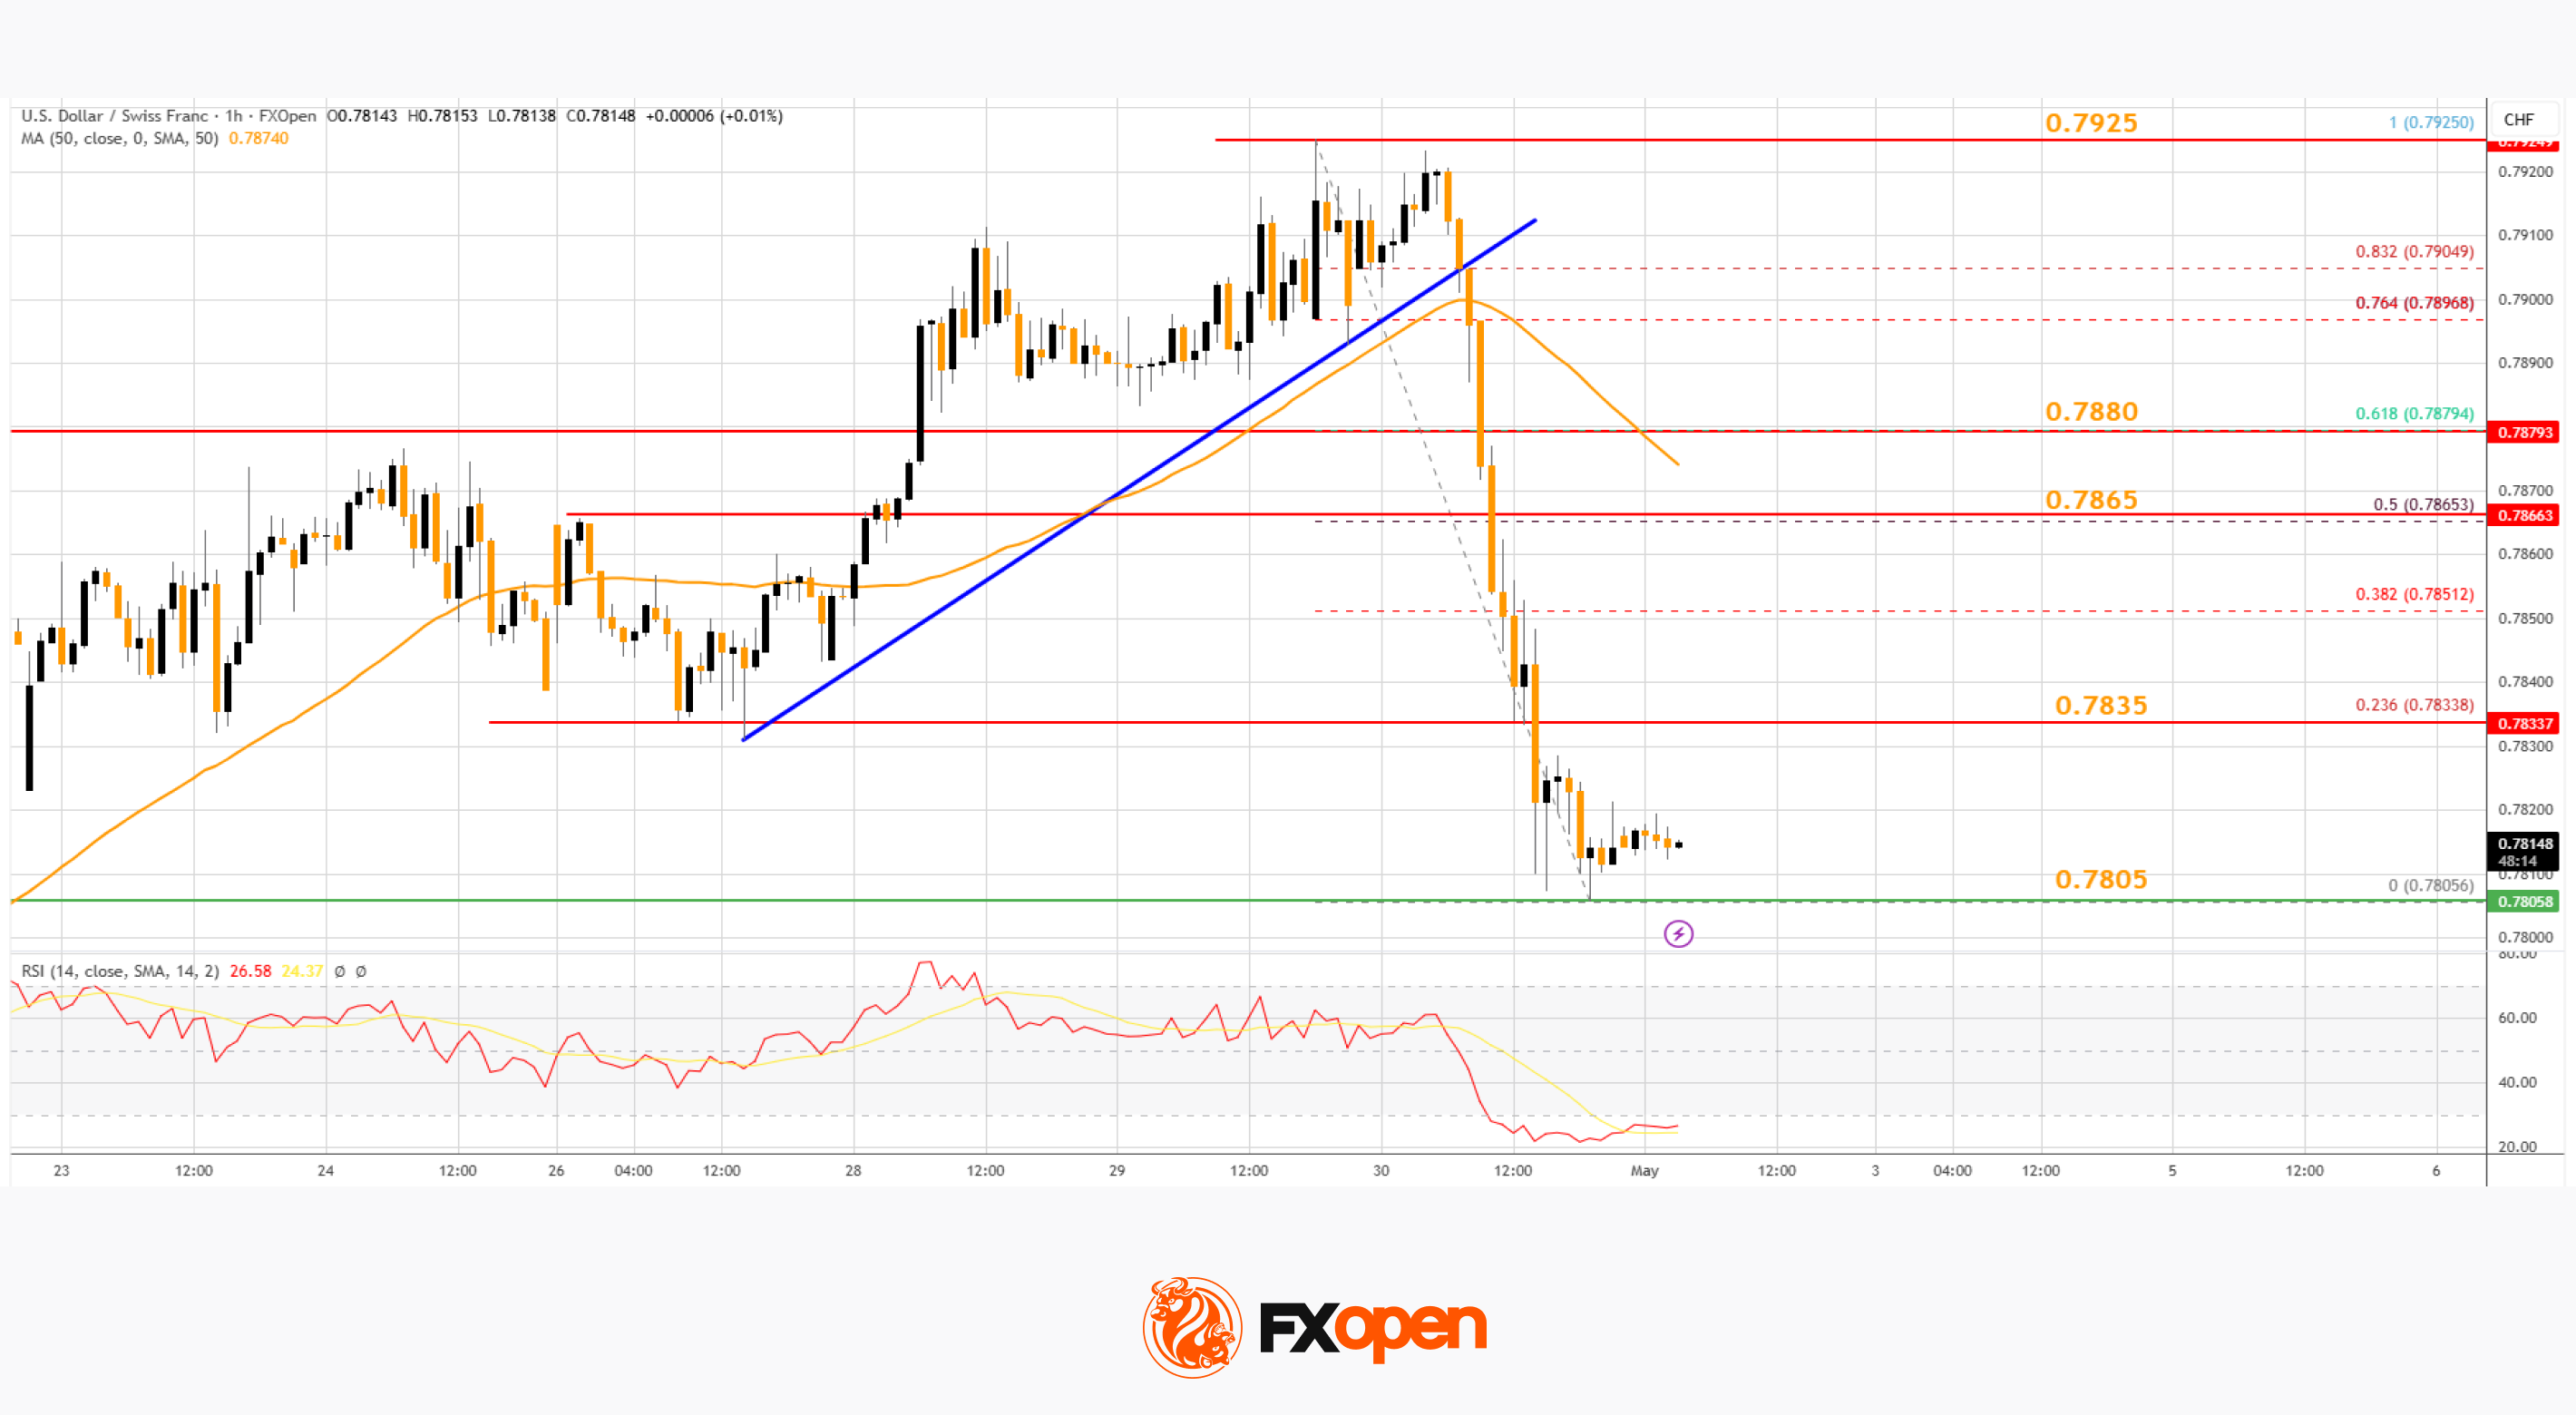
On the hourly chart of USD/CHF at FXOpen, the pair started a fresh decline from well above 0.7900. The US Dollar dropped below 0.7880 to move into a negative zone against the Swiss Franc.
There was a break below a bullish trend line with support at 0.7910. The bears pushed the pair below the 50-hour simple moving average and 0.7850. Finally, the bulls appeared near 0.7800. A low was formed near 0.7805, and the pair is now consolidating losses.
On the upside, the pair could face bears near the 23.6% Fib retracement level of the downward move from the 0.7925 swing high to the 0.7805 low at 0.7835.
The first major resistance sits near the 50% Fib retracement level at 0.7865. The main barrier for an upside break could be near the 50-hour simple moving average at 0.7880. A daily close above 0.7880 could start a fresh increase. In the stated case, the pair could rise toward 0.7925. The next stop for the bulls might be 0.7965.
On the downside, immediate support on the USD/CHF chart is 0.7805. The first major breakdown zone could be 0.7780. A close below 0.7780 might send the pair to 0.7750. Any more losses may possibly open the doors for a move toward 0.7700 in the coming days.
Trade over 50 forex markets 24 hours a day with FXOpen. Take advantage of low commissions, deep liquidity, and spreads from 0.0 pips (additional fees may apply). Open your FXOpen account now or learn more about trading forex with FXOpen.
This article represents the opinion of the Companies operating under the FXOpen brand only. It is not to be construed as an offer, solicitation, or recommendation with respect to products and services provided by the Companies operating under the FXOpen brand, nor is it to be considered financial advice.


Riot Platforms reported first-quarter 2026 revenue of $167.2 million. This compares with $161.4 million in the same quarter last year.
Summary
- Riot generated $167.2 million in Q1 revenue as data center income reached $33.2 million.
- AMD doubled its contracted Riot data center capacity to 50 megawatts after exercising an option.
- Riot sold 3,778 BTC in Q1 and later transferred another 500 BTC to NYDIG.
The company produced 1,473 Bitcoin during the quarter. That was lower than 1,530 Bitcoin produced in the first quarter of 2025.
Riot recorded its first quarter of data center revenue at $33.2 million. The amount included $0.9 million in operating lease revenue and $32.2 million from tenant fit-out services.
CEO Jason Les said the quarter marked a shift for Riot into a revenue-generating data center operator. He said, “The first quarter of 2026 marks a definitive inflection point for Riot.”
AMD doubles contracted capacity
Riot said AMD exercised an option for another 25 megawatts of capacity. This brings AMD’s total contracted capacity with Riot to 50 megawatts of critical IT capacity.
Les said AMD’s expansion “validates” Riot’s ability to deliver capacity for large tenants. The company said it now plans to use its approved power portfolio to grow the data center business.
Bitcoin sales continue amid mining pressure
Riot’s Bitcoin mining revenue fell to $111.9 million from $142.9 million a year earlier. The company linked the drop to lower average Bitcoin prices and a higher global network hash rate.
The average cost to mine Bitcoin, excluding depreciation, rose to $44,629. Riot said this was partly due to a 24% increase in the average global network hash rate.
Riot also disclosed that it sold 3,778 Bitcoin in Q1 2026. The sales generated $289.5 million in proceeds.
On-chain data cited by Lookonchain showed Riot later sent another 500 BTC to an NYDIG deposit address. The transfer was worth about $39 million at the time of reporting.
Riot stock rises after results
Riot ended the quarter with 15,679 Bitcoin. Of this amount, 5,802 Bitcoin were held as collateral. The total Bitcoin holdings were valued at about $1.1 billion based on a March 31 Bitcoin price of $68,222.
The company also held $282.5 million in cash, including $76.9 million in restricted cash. Riot shares closed at $17.24 on Thursday after gaining 7.9% during the session.

Key Takeaways
- Q3 revenue reached $5.95B, representing a year-over-year increase of 251% and exceeding analyst projections of $4.73B.
- Earnings per share (adjusted) landed at $23.41, crushing Wall Street’s $14.66 forecast by $8.75.
- Shares initially jumped following the announcement but retreated approximately 5% during Friday’s premarket session.
- Revenue from datacenter operations climbed 233% sequentially, propelled by a 137% increase in pricing throughout all business units.
- Fourth-quarter revenue guidance of $7.75B–$8.25B significantly surpassed the Street’s $6.65B expectation.
SanDisk delivered what many consider one of its most impressive quarterly performances on Thursday, handily surpassing both revenue and profit expectations set by Wall Street analysts. Yet shares experienced a roughly 5% decline in Friday’s premarket trading, despite management presenting an optimistic outlook for the quarters ahead.
Third-quarter revenue totaled $5.95 billion, marking a dramatic 251% climb compared to the same period last year. This figure easily eclipsed the analyst consensus estimate of $4.73 billion. On the earnings front, adjusted EPS registered at $23.41, demolishing the Street’s $14.66 projection by nearly $9 per share.
Prior to the pullback, the stock had reached approximately $1,096.51, hovering close to its 52-week peak of $1,115.
The datacenter division emerged as the undisputed growth driver. Datacenter revenue skyrocketed 233% on a sequential basis, buoyed by pricing increases of 137% spanning all product categories. While consumer and client segments experienced declines, the datacenter business more than compensated for these shortfalls.
CEO David Goeckeler characterized the quarter as representing “a fundamental inflection point” for the organization. He emphasized the company’s strategic pivot toward premium end markets, with datacenter operations spearheading this transformation.
Long-Term Agreements Strengthen Revenue Foundation
SanDisk executed five multi-year agreements during Q3 and early Q4. Three contracts were finalized within the third quarter, while two additional deals closed in the fourth quarter. The three Q3 agreements alone are projected to deliver a minimum of $42 billion in contracted revenue, recognized on a quarterly basis.
The company also secured downside protection. SanDisk has locked in $11 billion in guaranteed payments should customers withdraw from their capacity obligations — providing crucial insurance against potential market downturns.
Pricing strength has extended across the entire product portfolio. AI-driven supply constraints in the NAND memory sector have enabled SanDisk to implement higher pricing, and the forthcoming introduction of BiCS8-based QLC enterprise SSDs is anticipated to sustain this favorable trend.
Analyst Community Responds
Wall Street analysts moved quickly to revise their price objectives upward.
BofA Securities elevated its price target to $1,550 from $1,080, reaffirming its Buy rating. The firm highlighted valuation opportunities, underappreciated joint venture holdings, and anticipated enterprise SSD market share expansion through 2026.
Raymond James increased its target to $1,470 from $725, describing the datacenter inflection as “clear” and commending the company’s strengthening customer partnerships.
Mizuho boosted its target to $1,220 from $1,000 while maintaining an Outperform rating.
Notwithstanding the positive sentiment, InvestingPro noted the stock appears overvalued when measured against its Fair Value calculation — although analysts are projecting full-year earnings of $44.72 per share.
For the fourth quarter, SanDisk provided revenue guidance ranging from $7.75B to $8.25B, with non-GAAP diluted EPS anticipated between $30.00 and $33.00. This outlook implies approximately 35% sequential revenue expansion. Fourth-quarter gross margins are projected to reach around 80%, exceeding the 74% consensus and representing a year-over-year improvement of roughly 5,400 basis points.

Financial Wingman’s Rule of 30: Become a Millionaire
How authoritarian regimes use education as a political tool

Manus Serves as a Warning as China Halts Meta Agreement
Manchester United reach agreement with Casemiro over contract clause amid transfer speculation

US brings back mandatory military draft registration

Steven Gerrard disagrees with Gary Neville over ‘shock’ Chelsea and Arsenal claim | Football


-
 Tech4 days ago
Register Renaming | Hackaday
-

 Fashion7 days ago
Weekend Open Thread – Corporette.com
-
Crypto World6 days ago
Hyperliquid $HYPE Rally Builds Momentum as AI Sector Enters Prove-It Phase
-

 Politics4 days ago
Drax board avoid their own AGM, accused of greenwashing & environmental racism
-

 Tech4 days ago
Images of Samsung’s rumored smart glasses have leaked
-
 Sports5 days ago
IPL 2026: Ruturaj Gaikwad registers slowest fifty of the season, enters all-time unwanted list | Cricket News
-

 Tech4 days ago
Why Blue Badges Disappeared From Toyota Hybrids
-

 NewsBeat5 days ago
LK Bennett closes all stores after entering administration
-

 Fashion2 days ago
Kylie Jenner’s KHY Enters a New Era with ‘Born in LA’
-

 Crypto World7 days ago
Michael Saylor says BTC winter is over. Market analyst disagrees, says bitcoin was in a pullback
-
 Entertainment6 days ago
Mariah Carey Slams Deposition Claims In Brother’s Lawsuit
-

 Business2 days ago
Most Commercial Energy Audits Miss the Real Losses
-

 Business4 days ago
(VIDEO) Charlize Theron Climbs Times Square Billboard to Promote New Netflix Thriller ‘Apex’
-

 Business7 days ago
Jeanine Pirro announces closure of Federal Reserve building cost probe
-

 Tech5 days ago
Microsoft to roll out Entra passkeys on Windows in late April
-

 Crypto World3 days ago
CFTC’s AI will review U.S. crypto registration applications, chairman tells CoinDesk
-
 Crypto World7 days ago
Nvidia (NVDA) Stock Jumps 5% as Intel Earnings Ignite Semiconductor Rally
-

 Tech5 days ago
OpenAI’s Sam Altman apologizes for not reporting ChatGPT account of Tumbler Ridge suspect to police
-

 Business2 days ago
Barclay Brothers Avoid Bankruptcy: HSBC Drops High Court Petitions After IVA Deal
-

 Tech7 days ago
Apple’s Next CEO Has a Different Battle Ahead
You must be logged in to post a comment Login