
Crypto World
Gate 2026 Q1 Spot Listing Key Stats: 35.7% of Exclusive Listings Gained 100%+ in One Week
In the first quarter of 2026, against the backdrop of overall pressure in the crypto market and a more cautious risk appetite among capital, high quality early stage assets remained one of the most attractive structural opportunities in the market.
Gate listed a total of 37 new spot assets in Q1, covering 77.1% of the newly added projects across major exchanges during the same period, of which 27 were first listings, accounting for 73% of Gate’s new listings for the quarter; additionally, 14 were exclusive listings, representing 37.8%.
Amid heightened market volatility, Gate maintained a steady listing pace, strong capability in onboarding high quality projects, and a consistent ability to deliver positive return opportunities.
Overall Overview
From the perspective of total sample size, in the first quarter of 2026, using seven major platforms including Gate as the sample, a total of 48 new projects were listed across leading exchanges.
Among them, Gate listed 37 projects during the quarter, corresponding to a coverage rate of 77.1%, meaning that among the newly added high quality supply competed for by major platforms in Q1, Gate covered more than three quarters of the projects.
For general users, the importance of coverage is self evident. It directly determines whether users can access a sufficiently complete set of core new market listings on a single platform. If a platform has relatively low coverage, even if a few projects perform well, it can still leave users with the impression that important projects are not fully represented.
A coverage rate of 77.1% indicates that at least during Q1, Gate remained closely aligned with the mainstream pipeline of new project supply, allowing users to access most of the new assets worth paying attention to on the platform.
However, what truly defines Gate’s competitiveness is not only the breadth of coverage, but also the structure of that coverage.
Among the 37 new assets listed by Gate in Q1, 27 were first listings, accounting for 73%, while 14 were exclusive listings, representing 37.8%. If calculated based on the overall sample of major exchanges, Gate’s first listing coverage reached 56.3%. In other words, among the 48 new projects listed across major exchanges in Q1, more than half were first listed on Gate.
A high proportion of first listings indicates that Gate has strong attractiveness at the critical stage when projects transition from primary market narratives into secondary market trading. Projects choosing Gate as one of their initial public trading venues essentially reflects recognition of Gate’s user base, liquidity absorption capacity, initial price discovery efficiency, and market distribution capability. A platform that consistently secures first listings is often in a relatively proactive position in competition for project resources.
A meaningful share of exclusive listings reflects another layer of capability with substantial value. First listings demonstrate a platform’s ability to participate in mainstream high quality supply, while exclusive listings indicate whether the platform possesses independent judgment and differentiated sourcing capabilities.
Especially in a weak market environment, the selection difficulty for exclusive projects is higher, as exclusivity implies a lack of sufficient external validation from other platforms, requiring the platform to bear the responsibility of early judgment. If selection proves inaccurate, post listing performance will quickly reflect the issue; if exclusive projects perform well after listing, it not only indicates access to resources but also strong forward looking evaluation capability.
From this overall overview, Gate’s core foundation in Q1 can be summarized in three key characteristics.
(1) Broad coverage, indicating continuous participation in top tier new supply;
(2) High proportion of first listings, indicating strong capability to capture high quality projects at their entry into the market;
(3) A meaningful share of exclusive listings, showing that the platform is not merely following the market, but actively identifying and positioning differentiated assets in advance.
Taken together, these three factors form the foundation of Gate’s spot listing system in Q1. Only when coverage, first listings, and exclusivity all hold simultaneously can a platform’s listing framework be considered complete.
Post Listing Performance: Consistent Positive Return Coverage Across Short Term and 7 Day Windows
The quality of a platform’s listing performance cannot be evaluated solely by whether it secures projects, but also by whether those projects demonstrate stable performance after listing. A key characteristic of Gate in Q1 is that newly listed projects exhibited relatively consistent time series behavior across multiple holding periods, with overall positive return coverage remaining relatively stable.
Figure 1: Share of Gate New Listings With Price Increases Across Timeframes (5m–7d)
From the perspective of the share of price increases, among newly listed projects in Q1, 58.3% rose within the first 5 minutes after listing, 54.1% maintained gains at the 1 hour interval, 56.8% still recorded positive returns after 24 hours, 54.1% were up after 3 days, and 50.0% remained in an upward trend after 7 days. The data shows that the positive return coverage of Gate’s listed projects remained relatively stable across multiple holding periods.
Many new projects are driven by early speculative capital, short term sentiment, and traffic momentum at the opening stage, often leading to rapid initial price surges. However, if the project lacks fundamental support or if the platform’s liquidity absorption is insufficient, such gains tend to fade quickly, resulting in significantly weaker performance after 24 hours.
This is not the case for Gate’s Q1 sample. Across 5 minutes, 1 hour, 24 hours, and 3 days, the share of projects with price increases consistently remains above 50%, indicating that most listed projects did not exhibit a typical pattern of opening high and trending downward during the core price discovery window.
The 24 hour and 3 day intervals are particularly meaningful as reference points. Most participants in new listings are not ultra short term traders, and many operate on intraday, overnight, or short cycle holding strategies.
For these users, the fact that 56.8% of projects are up after 24 hours and 54.1% are up after 3 days reflects a more realistic trading experience. It indicates that positive return opportunities for Gate’s new listings are not limited to the initial opening phase, but show a degree of continuity during the key post listing holding window.
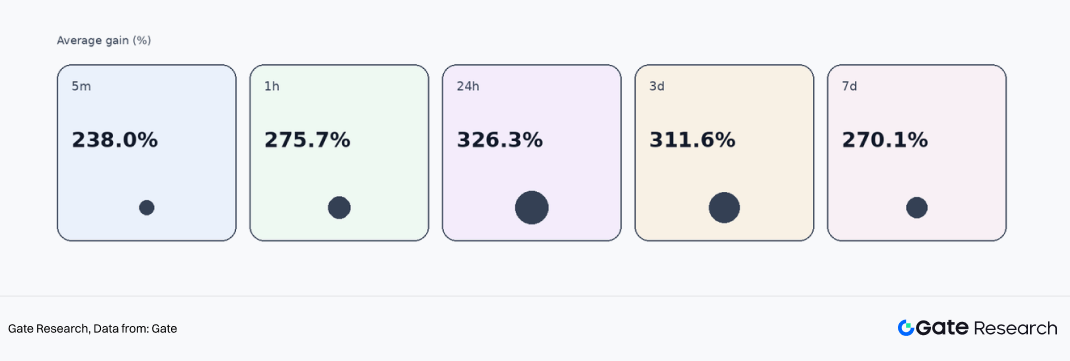
Further examining the average gains of projects that recorded price increases provides a clearer view of return elasticity. In Q1, the average gains for rising projects across the 5 minute, 1 hour, 24 hour, 3 day, and 7 day intervals were 238.0%, 275.7%, 326.3%, 311.6%, and 270.1%, respectively.
This indicates that once high quality new listings on Gate establish early positive momentum, the potential for price expansion remains substantial. Notably, during the 24 hour and 3 day windows, average gains remain around 300%, suggesting that the wealth effect of high quality projects has not disappeared in a weak market, but is instead more concentrated in a subset of carefully selected assets.
Figure 2: Average Gains of Rising Gate New Listings Across Timeframes (5m–7d)
Of course, looking at average gains alone does not provide a complete picture, as averages are easily influenced by extreme outliers, which can obscure the typical performance of most projects. Therefore, the median is particularly important in this context.
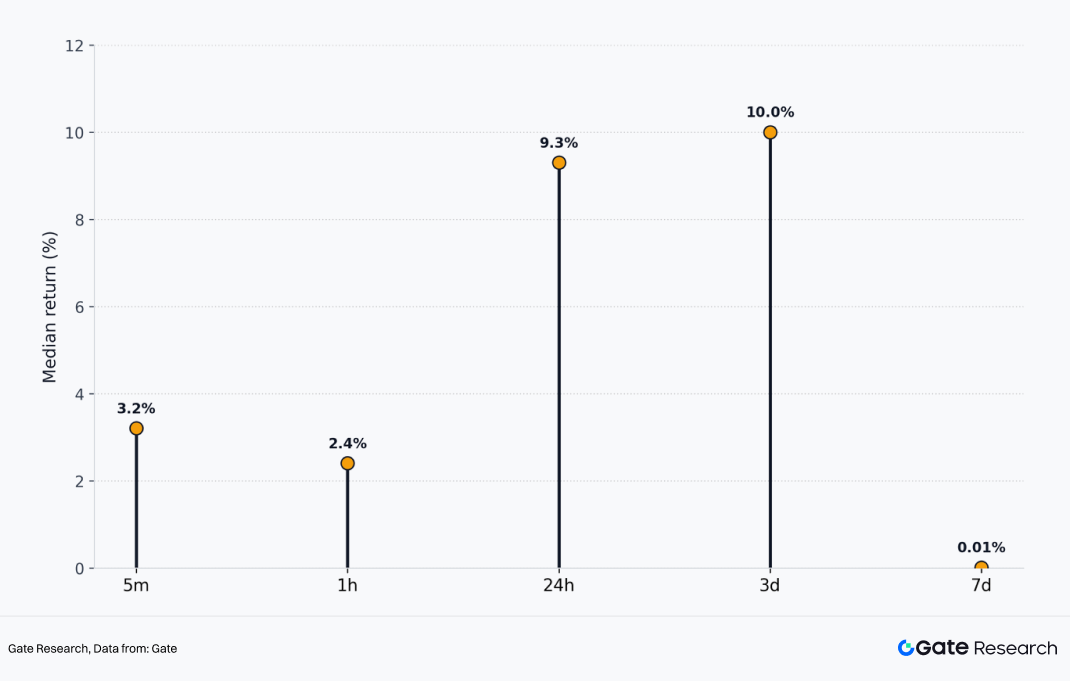
The median gains of newly listed projects in Q1 were +3.2% at 5 minutes, +2.4% at 1 hour, +9.3% at 24 hours, +10.0% at 3 days, and +0.01% at 7 days. Even when excluding the impact of extreme high multiple projects, the typical project performance within the sample still shows clearly positive returns at the 24 hour and 3 day stages.
This indicates that the overall performance of Gate’s spot listings during the quarter was not driven solely by a small number of outliers lifting the average, but rather that most projects maintained a certain level of positive return potential during the core post listing observation window.
Figure 3: Median Price Increase of Gate New Listings Across Timeframes (5m–7d)
For general users, what truly determines the participation experience is not whether there are one or two projects with extremely high returns, but whether the overall quality of new listings on the platform is consistent and whether it demonstrates a certain level of repeatability.
Based on the median data, Gate provided a clear answer in Q1, at least within the 24 hour to 3 day window: its spot listings exhibited strong consistency and a certain level of positive expected returns.
At the same time, the near flat median at 7 days also reflects another fact. The advantage of new listings is primarily concentrated in the early stage of post listing price discovery rather than extending indefinitely.
After 7 days, the market enters a more advanced phase of differentiation and elimination, where disparities between projects expand rapidly. Therefore, for users, not all new listings are suitable for long term holding; instead, within the first 24 hours to 3 day window after listing, the market presents a clearer and more stable density of return opportunities.
First Listings and Non-First Listings: A Dual Track Structure
When discussing a platform’s listing capability, many tend to focus entirely on first listings. While first listings are important, a platform with a truly mature listing system demonstrates its strength not only through first listings, but through the ability of different types of projects to form their own clear return logic. Based on Q1 data, this characteristic is particularly evident for Gate.
First Listings: Dominant in Quantity with Stronger Return Elasticity
In Q1, Gate recorded 27 first listings, accounting for 73% of all new listings. First listings formed the core of Gate’s listing structure in Q1, meaning that in most cases, the platform directly participated in the initial stage when projects entered the secondary market.
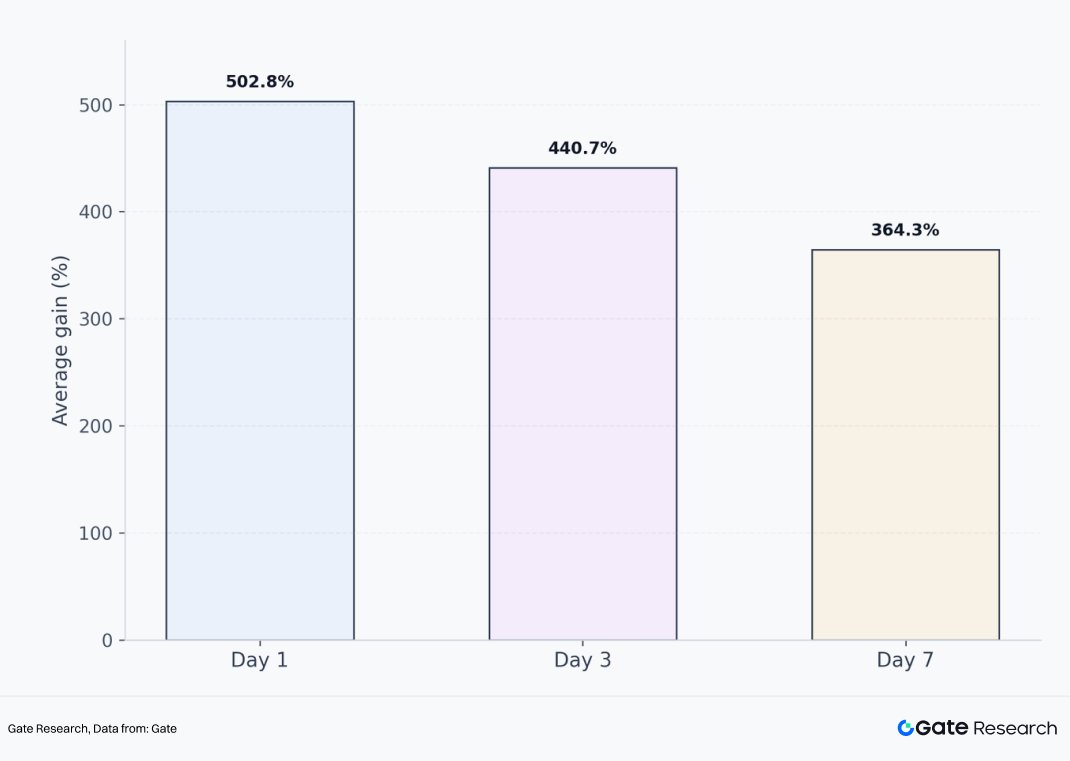
In terms of performance, the most notable characteristic of first listings is their strong return elasticity. Data shows that nearly 46% of first listed projects remained in an upward trend after 7 days; among the projects that increased in price, the average gains reached 502.8%, 440.7%, and 364.3% on the first day, 3 day, and 7 day intervals, respectively.
This indicates that the core advantage of Gate’s first listings lies not only in early access, but in their ability to build market momentum starting from Gate, often resulting in stronger price expansion potential.
Figure 4: Average Returns of Rising Gate Listings Across Holding Periods (1d, 3d, 7d)
From the perspective of extreme return distribution, this high elasticity is further validated. Among first listings in Q1, 7.4% of projects recorded gains exceeding 500% and even 1,000% within 24 hours. This indicates that within Gate’s listing system, the first listing segment serves as an entry point for high payoff opportunities.
Not every project is guaranteed to surge, but once a selected first listing aligns with market attention, narrative strength, and traffic momentum, the resulting price response is often more pronounced.
The underlying logic is straightforward. First listings occur at the earliest stage of public trading, where price discovery is still incomplete, market understanding is rapidly forming, and capital can concentrate more easily within a short period.
For platforms, the ability to secure high quality projects at this stage determines their capacity to provide users with high payoff, high attention early trading opportunities. For users, first listings offer the potential for earlier participation and higher return elasticity, but also come with greater volatility and faster divergence.
Non-First Listings: Smaller in Number but More Stable in Trend
Compared with first listings, Gate recorded 10 non-first listings in Q1, representing a significantly smaller share. However, in terms of performance, these projects demonstrate more stable median returns.
Figure 5: Win Rate and Median Price Increase of Gate Non-Initial Listings Across Timeframes (5m–7d)
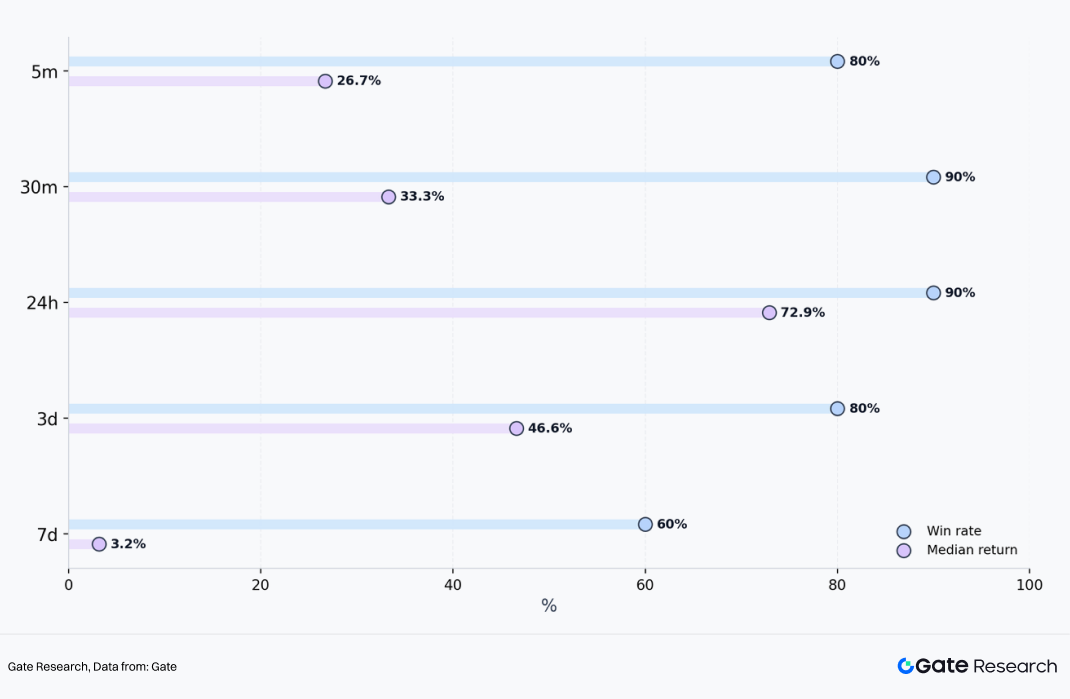
Data shows that non-first listings recorded price increase shares of 80%, 90%, 90%, 80%, and 60% across the 5 minute, 30 minute, 24 hour, 3 day, and 7 day intervals, respectively; the corresponding median gains were +26.7%, +33.3%, +72.9%, +46.6%, and +3.2%. In addition, 40% of non-first listing projects achieved gains exceeding 100% within 24 hours.
The data indicates that although non-first listings do not possess the same initial pricing advantage as first listings, they demonstrate higher success rates of price increases under Gate’s screening mechanism.
This is because non-first listing projects have typically undergone initial market validation, allowing the platform to conduct a second layer of selection based on more comprehensive factors such as price performance, community attention, narrative diffusion, and market absorption conditions, thereby offering greater certainty compared to first listings.
Overall, Gate’s listing structure does not rely solely on first listings to demonstrate its advantage, but instead forms two complementary pathways: first listings provide higher elasticity and stronger wealth effects, while non-first listings deliver more stable median returns.
The former is more aligned with an aggressive approach, while the latter is more aligned with a stable strategy, together enabling the platform to serve different user preferences. From the platform perspective, this dual track structure is more mature than relying solely on first listings.
It shows that Gate is not mechanically pursuing a higher number of first listings, but is also able to continuously provide effective opportunities through the timing and secondary selection of non-first listing projects.
Exclusive Listings: The Segment That Best Reflects Gate’s Proactive Judgment Capability
If first listings reflect a platform’s ability to participate in mainstream high quality supply, exclusive listings reflect a more proactive capability in project selection, resource acquisition, and forward looking judgment. Exclusive listings directly reveal a platform’s project evaluation standards, risk control capability, and execution efficiency.
In Q1, Gate exclusively listed 14 projects, accounting for 37.8% of all new listings. This proportion itself indicates that Gate was not merely passively following the mainstream market listing cycle during the quarter, but instead maintained a differentiated project pipeline to a significant extent. More importantly, these exclusive projects did not underperform after listing; on the contrary, they demonstrated strong competitiveness across multiple key time windows.
Figure 6: Win Rate and Median Price Increase of Gate Exclusive Listings Across Timeframes (24h–7d)
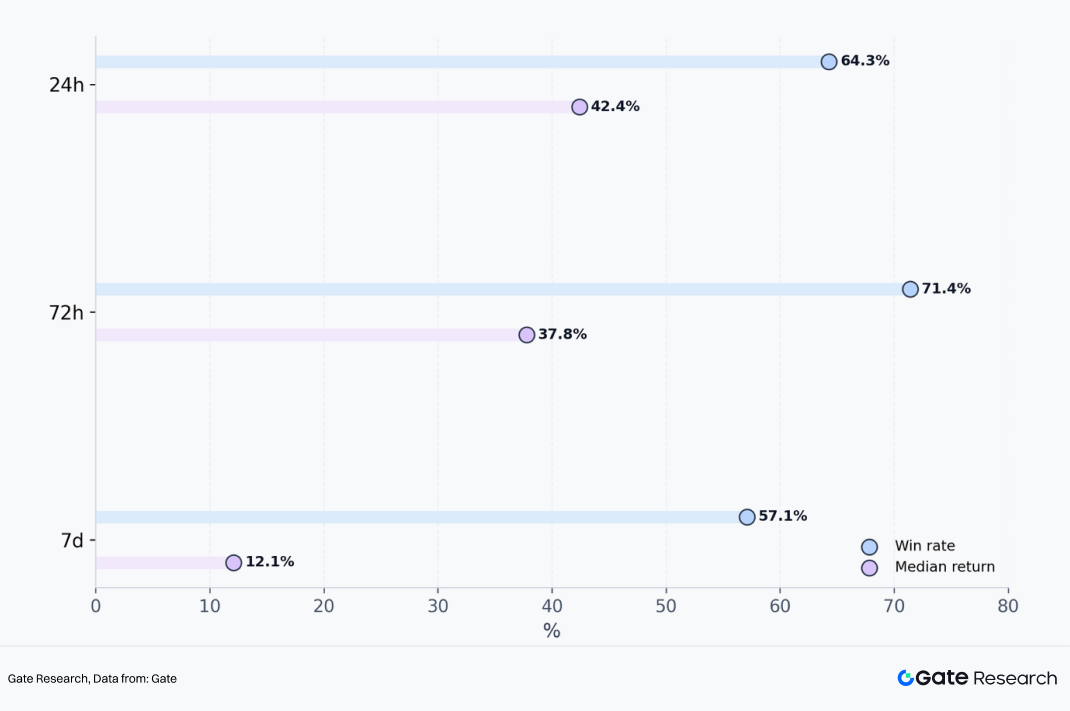
From the perspective of success rate, exclusive listings recorded price increase rates of 64.3%, 71.4%, and 57.1% across the 24 hour, 72 hour, and 7 day intervals, respectively, with the 72 hour window showing the strongest performance. This means that during the period from day 2 to day 3 after listing, Gate’s exclusive projects did not weaken rapidly as initial listing momentum faded, but instead demonstrated clearer capital absorption and upward price momentum.
From the perspective of median returns, exclusive listings achieved +42.4%, +37.8%, and +12.1% across the 24 hour, 72 hour, and 7 day intervals, respectively. This indicates that exclusive projects not only have a relatively high share of price increases, but also deliver median returns that are significantly higher than the overall sample. This suggests that the strong performance of exclusive listings is not driven by a small number of extreme cases, but rather that most projects provide solid return quality within the core observation windows.
Further examining the distribution of extreme returns makes the characteristics of exclusive listings even clearer. From 30 minutes after listing up to 30 days, more than 20% of exclusive projects consistently achieved gains exceeding 100%; during the 3 to 7 day window, the share of projects with gains above 100% reached as high as 35.7%, significantly higher than the 15.4% observed among all first listings; even when extended to a 30 day horizon, 12.5% of exclusive projects still recorded gains exceeding 500% and even 1,000%.
Taken together, these data points indicate that Gate’s exclusive listings do not rely solely on initial scarcity driven momentum at the opening stage, but are able to sustain price discovery and attract consistent buying support across multiple post listing time windows, with a relatively high probability of delivering more pronounced return trajectories.
Case Review
Based on Q1 cases, Gate’s project selection broadly followed three pathways: one category consists of high attention projects where Gate completed early first listings or priority onboarding, followed by validation from other platforms; another category includes exclusive listings on Gate that delivered strong subsequent performance, reflecting the platform’s independent selection capability; the third category consists of narrative driven projects with strong community traction and topic diffusion, demonstrating the platform’s sensitivity to sentiment driven sectors.
Solana Mobile (SKR): Early First Listing Execution on High Attention Projects
Solana Mobile belongs to the DePIN sector, achieving an ATH increase of 2,459% after TGE and a 30 day gain of 715%. As a combination of Solana’s official hardware phone and Web3 applications, Solana Mobile benefits from inherent brand endorsement, a strong community foundation, and significant dissemination advantages. Gate conducted a simultaneous first listing with two other CEXs and went live one day ahead of B*** Alpha to capture market share, indicating that Gate maintained strong responsiveness to globally high attention projects in Q1.
From the SKR listing, it can be seen that Gate is able to enter the key early window for projects with high traffic, strong narratives, and elevated expectations, allowing users to participate before broader market coverage occurs. This capability reflects Gate’s competitive position in accessing mainstream high quality project supply.
CodexField (CODEX): A Representative High Return Exclusive Listing
CodexField belongs to the content creation sector and is one of the most representative exclusive listings on Gate in Q1. It recorded an ATH increase of 4,900% and maintained a gain of 2,566% as of March 25, while B***, B***, and B*** had not yet listed the project.
If exclusive listings best reflect a platform’s proactive selection capability, then CodexField serves as a clear demonstration of Gate’s strength in this area. The project received institutional investment from Gate Labs prior to listing, and Gate provided the initial secondary market pricing venue, ultimately generating a strong wealth effect.
For projects that are not yet widely covered but possess strong growth potential and market imagination, Gate has the ability to establish early positioning and, through its platform liquidity and user base, convert these opportunities into verifiable market outcomes.
Lobster: An Early Positioning Case in AI plus Meme Narratives
The combination of AI and Meme was a high attention yet highly differentiated direction in Q1. Many projects had strong narratives but lacked sustainability, while others demonstrated strong dissemination capability without translating into trading results. Lobster belongs to the AI plus Meme category and was first listed on Gate, achieving an ATH increase of 286% and a 7 day gain of 164%; B*** Alpha followed with a listing the next day after observing Gate’s market signal. This case highlights Gate’s early positioning capability in highly viral narratives, as well as its ability to lead early price discovery.
Overall, these cases show that Gate’s spot listing performance in Q1 was not driven by a single type of project, but rather by a combination of multiple sectors, styles, and narratives. The platform is capable of onboarding high attention mainstream projects while also identifying exclusive growth oriented projects; it covers both technology and product driven projects, as well as community culture and sentiment driven assets. This diversity itself reflects the maturity of Gate’s listing system.
Conclusion
Overall, Gate’s spot listing performance in the first quarter of 2026 can be summarized in one sentence: in a market phase characterized by overall pressure, reduced opportunity density, and intensified project divergence, Gate continued to maintain a relatively high quality pipeline of new listings and convincing post listing performance.
During a period where strong outcomes are not easy to achieve, Gate’s overall sample maintained a relatively high share of price increases across multiple time windows, with median returns at 24 hours and 3 days remaining positive. New listings demonstrated a certain breadth of performance, where first listings provided stronger return elasticity, non-first listings delivered higher success rates, and exclusive listings reflected greater scarcity and stronger mid term performance. The platform’s listing capability is not driven by isolated strengths, but by a systematic and integrated framework.
For users, Gate provides a more complete and structured early stage participation framework. Users seeking higher return elasticity can focus on first listings for higher payoff opportunities; users preferring more stable pathways can look to the higher success rate characteristics of non first listings; users aiming to access differentiated assets before broad market coverage can pay closer attention to Gate’s exclusive listing segment. For project teams, Q1 data also demonstrates that Gate possesses strong capabilities in initial trading support, liquidity organization, and price discovery.
From a longer term perspective, the core competition in spot listing capability among exchanges ultimately lies in whether they can consistently maintain strong project sourcing, selection, and outcome realization across different market cycles. Gate’s Q1 data clearly demonstrates this point: even in a weak market, Gate is able to list accurately, select with stability, and deliver tangible results.
Gate Research is a comprehensive blockchain and cryptocurrency research platform that provides deep content for readers, including technical analysis, market insights, industry research, trend forecasting, and macroeconomic policy analysis.
Disclaimer: Investing in cryptocurrency markets involves high risk. Users are advised to conduct their own research and fully understand the nature of the assets and products before making any investment decisions. Gate is not responsible for any losses or damages arising from such decisions.
The post Gate 2026 Q1 Spot Listing Key Stats: 35.7% of Exclusive Listings Gained 100%+ in One Week appeared first on BeInCrypto.


The White House no longer has a dedicated crypto policy lead, just days after President Donald Trump gave Vice President JD Vance a new enforcement mandate as “Fraud Czar.”
Trump announced the Vance appointment on Truth Social, directing the vice president to target what he called unprecedented taxpayer fraud in blue states. The move follows David Sacks’ quiet departure from the crypto czar position on March 26.
Sacks Out, No Replacement Coming
Sacks confirmed that he had used up his 130-day limit as a special government employee. The departure was not a resignation or termination. Federal law caps special government employee service at 130 days within a 12-month period.
The White House confirmed it will not appoint a replacement. Sacks transitioned to co-chair of the President’s Council of Advisors on Science and Technology (PCAST), an advisory body that produces recommendations but lacks operational policy authority.
He joins Mark Zuckerberg, Jensen Huang, and Marc Andreessen on the council.
His exit leaves the CLARITY Act stalled in the Senate and the broader crypto market structure bill unfinished.
Senator Bernie Moreno has warned that if the bill does not reach the Senate floor by May, it risks going dark until after the midterm elections.
Vance Turns to Fraud
Meanwhile, Trump’s “Fraud Czar” designation gives Vance a mandate focused on government spending enforcement.
Trump named California, Illinois, New York, Minnesota, and Maine as primary targets, claiming recovered funds could balance the federal budget.
Federal raids have already begun in Los Angeles, with arrests tied to $50 million in healthcare fraud.
The two czar roles are unrelated in scope. However, the contrast is notable.
The administration is deploying enforcement resources toward fiscal fraud while leaving the crypto policy seat empty at a critical legislative moment.
The post Trump’s Crypto Czar Role Sits Empty as White House Names Fraud Czar appeared first on BeInCrypto.
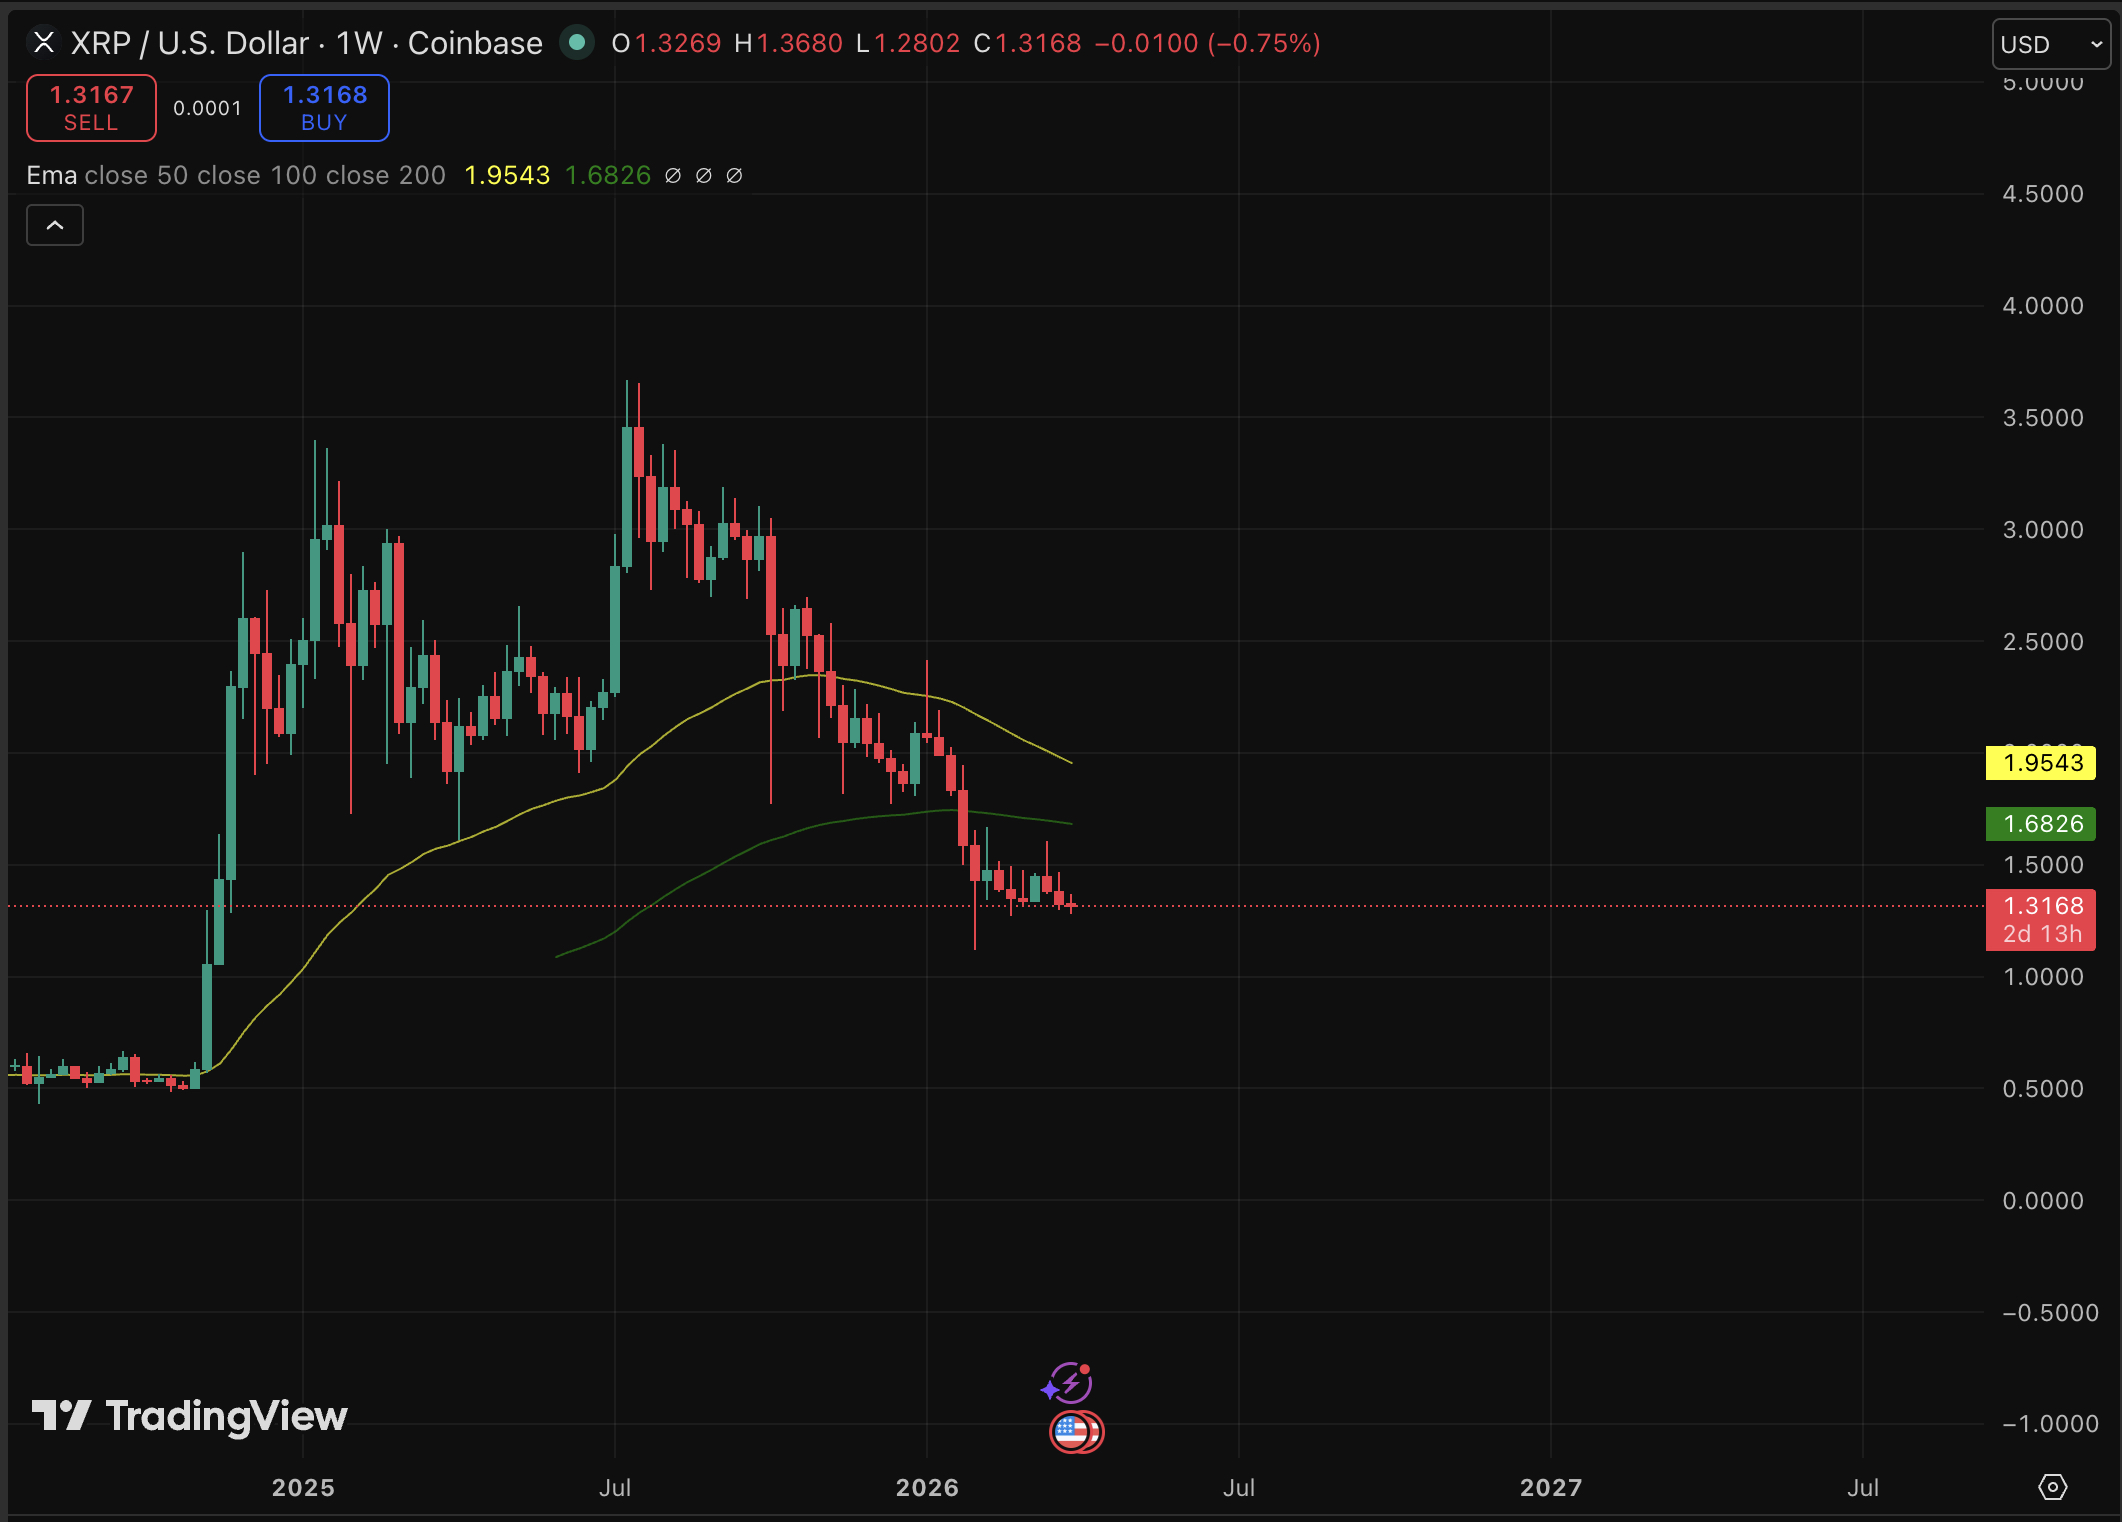
XRP is trading at $1.31, up by 0.9% in the last 24 hours, but price prediction still remains bearish for Ripple coin. Down nearly 30% year-to-date from a $1.88 open, the token is fighting to hold key support while the broader market registers extreme fear. What most traders haven’t priced in yet: a significant engineering overhaul quietly underway inside the XRP Ledger’s core repository.
Denis Angell, an XRPL core developer, outlined six active workstreams on April 2 that are reshaping the ledger’s foundational infrastructure, telemetry, nomenclature, type safety, refactoring, logging, and documentation.
“I’ve never been more excited for the XRP Ledger core development than I am now,” Angell posted, describing the effort as tedious but critical.
The work targets backend reliability and developer experience rather than user-facing features, a distinction that matters for long-term network competitiveness.
Whether these upgrades translate into price recovery depends entirely on market timing.
Discover: The best crypto to diversify your portfolio with
XRP Price Prediction: $1.40 Before the Next Wave of Selling?
XRP’s current level of $1.31 places it uncomfortably below both major moving averages. The 50-day SMA sits at $1.40–$1.42, acting as immediate overhead resistance. The 200-day SMA at $2.04–$2.07 represents a full recovery target that feels distant given current momentum.

Support is clustered at $1.27–$1.29. That zone is thin. A clean break below it opens a more significant leg down with limited structural floors until the $1.10 range. The Fear and Greed Index reading Fear confirms capitulation sentiment, which historically precedes either a sharp reversal or a final flush.
Analyst consensus points to $2.04 as a potential recovery level by September 2026, achievable, but requiring sustained buying pressure that simply isn’t visible in current volume data.
Discover: The best pre-launch token sales
Bitcoin Hyper Targets Early-Mover Upside as XRP Tests Critical Support
XRP’s -29.6% year-to-date performance raises a legitimate question: at a $1.31 price point and a multi-billion-dollar market cap, how much asymmetric upside actually remains? For traders comfortable with the risk profile of early-stage assets, the calculus looks different at the infrastructure layer.
Bitcoin Hyper ($HYPER) is positioning itself as a genuinely novel infrastructure play, the first Bitcoin Layer 2 integrating the Solana Virtual Machine, delivering sub-second finality and low-cost smart contract execution while anchored to Bitcoin’s security model.
The presale has raised $32 million at a current price of just $0.013678, with healthy staking rewards available for early participants. The Decentralized Canonical Bridge enables native BTC transfers into the ecosystem, addressing Bitcoin’s longstanding programmability gap without sacrificing its trust layer.
More detail on Bitcoin Hyper is available here.
The post XRP Price Prediction: Can These 6 Ongoing Developments Save Ripple appeared first on Cryptonews.

TLDR
- Riot Platforms sold 3,778 Bitcoin for more than $250 million during the first quarter of 2025.
- The company reduced its total Bitcoin holdings to 15,680 BTC after the sale.
- Riot Platforms achieved an average selling price of over $76,000 per Bitcoin.
- The firm has now sold Bitcoin in consecutive quarters after raising nearly $200 million late last year.
- CEO Jason Les said earlier that sales were intended to fund ongoing growth and operations.
Riot Platforms sold more than $250 million in Bitcoin during the first quarter of 2025. The company confirmed it sold 3,778 BTC at an average price above $76,000. As a result, the firm reduced its total holdings to 15,680 BTC by the end of March.
Riot Platforms Cuts Bitcoin Holdings as Sales Extend Into Second Quarter
Riot Platforms reported that it sold 3,778 Bitcoin during the first quarter of 2025. The company achieved an average sale price above $76,000 per coin. Consequently, it reduced its Bitcoin reserves to 15,680 BTC at quarter’s end. The remaining holdings now carry a market value near $1.04 billion. Bitcoin traded at $66,844 at the time of valuation.
The Colorado-based miner has now sold Bitcoin in consecutive quarters. During November and December, it generated nearly $200 million from Bitcoin sales. The company has not yet disclosed detailed allocation plans for the recent proceeds. A company representative did not respond to a request for comment. However, earlier in 2025, CEO Jason Les addressed the purpose of prior sales.
Les stated that earlier Bitcoin sales aimed to “fund ongoing growth and operations.” He connected those operations to expanding infrastructure and computing capacity. The company outlined these objectives in its latest strategic business update. Riot Platforms has focused on increasing its data center capabilities. It also continues to adjust its capital structure through asset sales.
Riot Platforms Shifts Strategy Toward Data Center Development
Riot Platforms confirmed that it intends to expand beyond traditional Bitcoin mining. The firm stated that it plans to unlock its nearly two-gigawatt power portfolio. It aims to deploy that capacity for high-demand data center infrastructure. Les said, “2025 marked a watershed year for Riot.” He added that the company has transformed its future trajectory.
The company explained that it previously used most of its power portfolio for Bitcoin mining. Now, it seeks to reallocate that capacity toward data center development. Riot Platforms stated that its long-term goal is “to fully utilize our power portfolio for data center development.” This shift aligns with ongoing operational restructuring. The firm continues to balance mining output with infrastructure planning.
An activist investor, Starboard Value, urged the company to accelerate its transition strategy. Starboard Value stated that the opportunity could add as much as $21 billion to Riot’s valuation. The investor called for a “renewed sense of urgency” in pursuing this plan. Meanwhile, shares of RIOT closed up 2.47% on Thursday. The stock recently traded at $12.86.
Over the past six months, RIOT shares have fallen more than 33%. During the same period, Bitcoin has declined 47% from its all-time high of $126,080. The company continues to report updates through formal filings and public statements. Riot Platforms has not announced further Bitcoin sales beyond the first quarter.


Stephanie Cutter will join the prediction markets company as a policy adviser, having previously worked in Democratic lawmakers’ campaigns.
Predictions market platform Kalshi announced that a former staffer of US President Barack Obama had joined the company as a policy adviser.
In a Thursday notice, Kalshi said Stephanie Cutter would join the prediction markets company from Precision Strategies, a communications firm she co-founded in 2013. Kalshi said the addition of Cutter came as the company planned to “deepen its relationships in DC and across the country.”

According to Kalshi co-founder and CEO Tarek Mansour, Cutter’s experience allowed her to “get [the] message to the right people,” highlighting her background in government and politics. The predictions market already has staff with ties to the US government, including the appointment of the president’s son, Donald Trump Jr., as a strategic adviser in January 2025, the week before his father took office.
In the last year, Kalshi has come under scrutiny from many US state-level authorities, who have filed lawsuits against the platform and other companies offering event contracts on prediction markets for sports, alleging that they constituted illegal bets.
Under Trump nominee Michael Selig, the US Commodity Futures Trading Commission (CFTC) has claimed that the agency has the “exclusive jurisdiction” to oversee such markets, filing lawsuits against state gaming regulators.
Related: Polymarket expands into equities and commodities with Pyth price feeds
Lawsuits and proposed legislation
Many Democrats in US Congress have also called for scrutiny into prediction markets after what they called “suspicious trades” related to the country’s invasion of Iran. Although Kalshi and Polymarket announced plans in March to implement guardrails to prevent accounts from using insider information, some lawmakers introduced legislation that could ban politicians from engaging in such bets on prediction markets.
As of Friday, none of the bills proposed in Congress had been signed into law, and it was unclear what the outcome would be for many of the state-level lawsuits.
Magazine: Solana exec trolls crypto gamers, Pixel tackles play-to-earn issues: Web3 Gamer
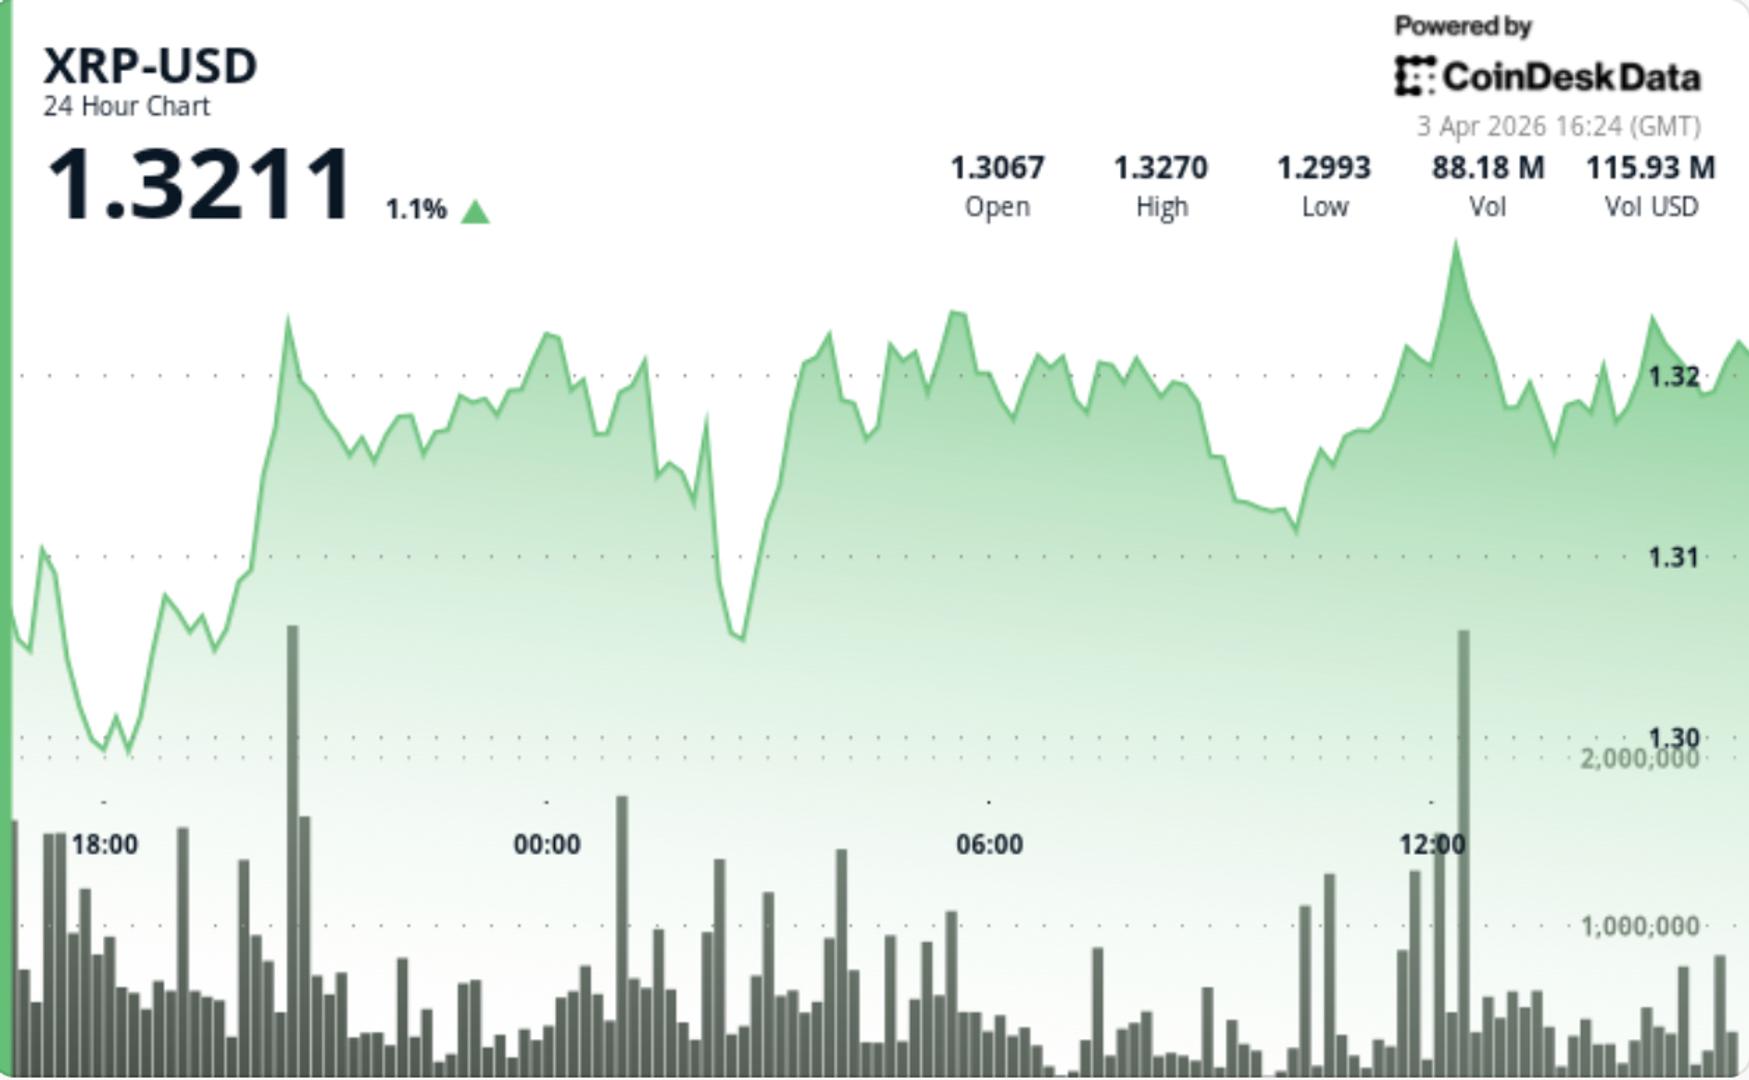

XRP is grinding higher, but not breaking out. The token is sitting around $1.33 after a modest move up, with higher volume coming in — yet price still isn’t escaping its range. That usually means positioning is building, not conviction.
News Background
- XRP rose just over 1% to $1.33 with volume about 23% above its weekly average
- Price moved almost in lockstep with the broader crypto market, showing little independent strength
- No major XRP-specific catalyst drove the session
Price Action Summary
- XRP traded in a tight range, holding above $1.30 while struggling near $1.33
- Buyers stepped in on dips, creating higher lows
- Breakout attempts toward $1.33-$1.34 were repeatedly sold into
- Late-session price action stabilized without follow-through
Technical Analysis
- The key theme is correlation — XRP is moving with the market, not leading it
- Higher volume without a breakout suggests traders are positioning, not committing
- Structure is slightly constructive (higher lows), but capped by overhead supply
- This keeps XRP stuck in a compression phase, where range tightens before expansion
What traders should watch
- $1.34-$1.35 is the near-term ceiling — break that and momentum can build
- $1.30 remains the floor holding the structure together
- Until one of those levels breaks, XRP is likely to stay range-bound and reactive to broader crypto moves

Stablecoin monthly transaction volume reached $7.2 trillion in February 2026, overtaking the Automated Clearing House (ACH) network’s $6.8 trillion for the first time.
The ACH is an electronic payment network in the United States that enables transfers directly between bank accounts. It has become the most widely used infrastructure for handling electronic money movement across the country.
Follow us on X to get the latest news as it happens
It’s a symbolically significant milestone showing how massive crypto payment rails have become. The February crossover did not happen in isolation.
Artemis data shows that stablecoin volume climbed further in March, reaching $7.5 trillion. That figure matched ACH over the same period.
Meanwhile, the stablecoin market has continued to grow. DefiLlama data showed that the market capitalization surpassed $316.7 billion, setting a new all-time high.
Notably, a recent report revealed that stablecoins dominated crypto markets in Q1 2026. They made up 75% of total trading volume, the largest share on record.
Overall transaction volume exceeded $28 trillion during the quarter, marking another all-time high. However, according to CEX.IO, automated trading played a major role, with bots responsible for 76% of the volume, the highest proportion seen in the past two years.
“Q1 2026 made the 2022 comparison hard to ignore. Stablecoin dominance rising sharply, capital rotating defensively, USDT and USDC diverging, automation surging, and retail pulling back — these patterns appeared together in mid-2022, and they are reappearing now. If broader bearish conditions persist through the year, stablecoins could see further demand and dominance gains in the coming quarters,” the report read.
The rising volumes reflect more than speculative activity. It also highlights the expanding use of these assets in real-world applications, including business-to-business (B2B) payments, cross-border transactions, and other financial activities.
Subscribe to our YouTube channel to watch leaders and journalists provide expert insights
The post Stablecoins Moved More Money Than the US Financial System’s Backbone appeared first on BeInCrypto.


The International Monetary Fund also warns that the distribution and speed of on-chain transactions bring new challenges and risks that require international coordination.
In a new staff research note published on Thursday, The International Monetary Fund (IMF) argues that tokenization represents a “structural shift in financial architecture,” not just an incremental efficiency gain.
Authored by Tobias Adrian — the IMF’s Financial Counsellor and Director of the Monetary and Capital Markets Department — the report focuses on the tokenization of real-world assets (RWAs) within the regulated financial system, namely banks, finance infrastructure, and asset managers, arguing that’s where “the most consequential transformation occurs.”
Settlement Speed Is a Double-Edged Sword
The IMF’s core thesis is that tokenization doesn’t just make existing finance faster, but represents a shift in how trust, settlement, and risk management work. In TradFi, trust is embedded in regulated intermediaries and time-delayed processes (end-of-day settlement, batch reconciliation). Those frictions, the report notes, actually serve a purpose: they give regulators and institutions time to intervene before a crisis cascades.
Tokenization, which the note defines broadly as “the representation of financial assets and liabilities on programmable digital ledgers,” collapses those frictions, bringing what is generally referred to as the primary benefits of blockchain: near instant settlement, 24/7 liquidity, etc. But, the report notes, that this reduction of barriers introduces new challenges and risks.
“Liquidity demands materialize instantaneously,” the note warns, creating conditions where a smart contract bug or oracle failure could trigger a chain reaction before anyone can respond. The IMF argues:
“When trading, settlement, custody, and compliance are embedded in code, supervision must extend beyond market participants to the design, governance, and resilience of market infrastructures themselves. Failures can
originate in smart contracts, data feeds, or consensus mechanisms, rather than firm balance sheets.”
Who Controls the Money?
A major focus of the report is on the quetion of settlement assets. The IMF identifies three competing models: tokenized commercial bank deposits, regulated stablecoins, and what the report refers to as wholesale central bank digital currencies (wCBDCs), with each carrying different risk profiles.
Cross-Border Gaps and the Fragmentation Risk
The report highlights that a major concern around the tokenization of RWAs in regulated financial markets is jurisdictional: tokenized transactions execute across borders at machine speed, while resolution and crisis management frameworks are still built around nationally domiciled institutions.
“Tokenization challenges crisis management and resolution frameworks that are built around nationally domiciled institutions, territorially bounded infrastructures, and jurisdiction-specific legal authority.“
In its research note, the IMF calls for international coordination and legal frameworks that can govern code itself, not just the institutions that deploy it.
“The key levers of control may lie in governance keys, consensus mechanisms, or smart contract logic operating across borders,” the note reads — a setup where no single regulator has a clear handle.
The report lands as the value of tokenized RWAs continue to surge, driven in part by tokenized funds from TradFi giants like BlackRock, Franklin Templeton, and Janus Henderson.
In 2025, tokenized RWA value tripled over the course of the year as a wave of financial institutions began tokenizing U.S. treasuries, private credit, and other RWAs.
Industry forecasts project the sector could hit $100 billion by end of 2026, with more than half of the world’s 20 largest asset managers expected to have launched RWA tokens by year-end.
Meanwhile, stablecoins have already begun functioning as mainstream financial infrastructure, with the GENIUS Act providing U.S. regulatory clarity in mid-2025.
This article was written with the assistance of AI workflows. All our stories are curated, edited and fact-checked by a human.
A solo Bitcoin miner secured a roughly $210,000 block reward on Thursday, proving that the so-called “mining lottery” is still paying out even if industrial operators dominate the network.
The miner, connected to CKPool’s solo service, found block 943,411 and earned 3.139 BTC in subsidy and transaction fees, according to data from block explorer mempool.space.
Solo mining remains rare. Statistics compiled by Bennet’s tracker show that solo mining pools have found just 20 Bitcoin (BTC) blocks over the last 12 months, paying out a total of 62.96 BTC, roughly one win every 18.7 days on average. The longest “drought” between blocks was 58 days, and the previous solo win came on Feb. 28.
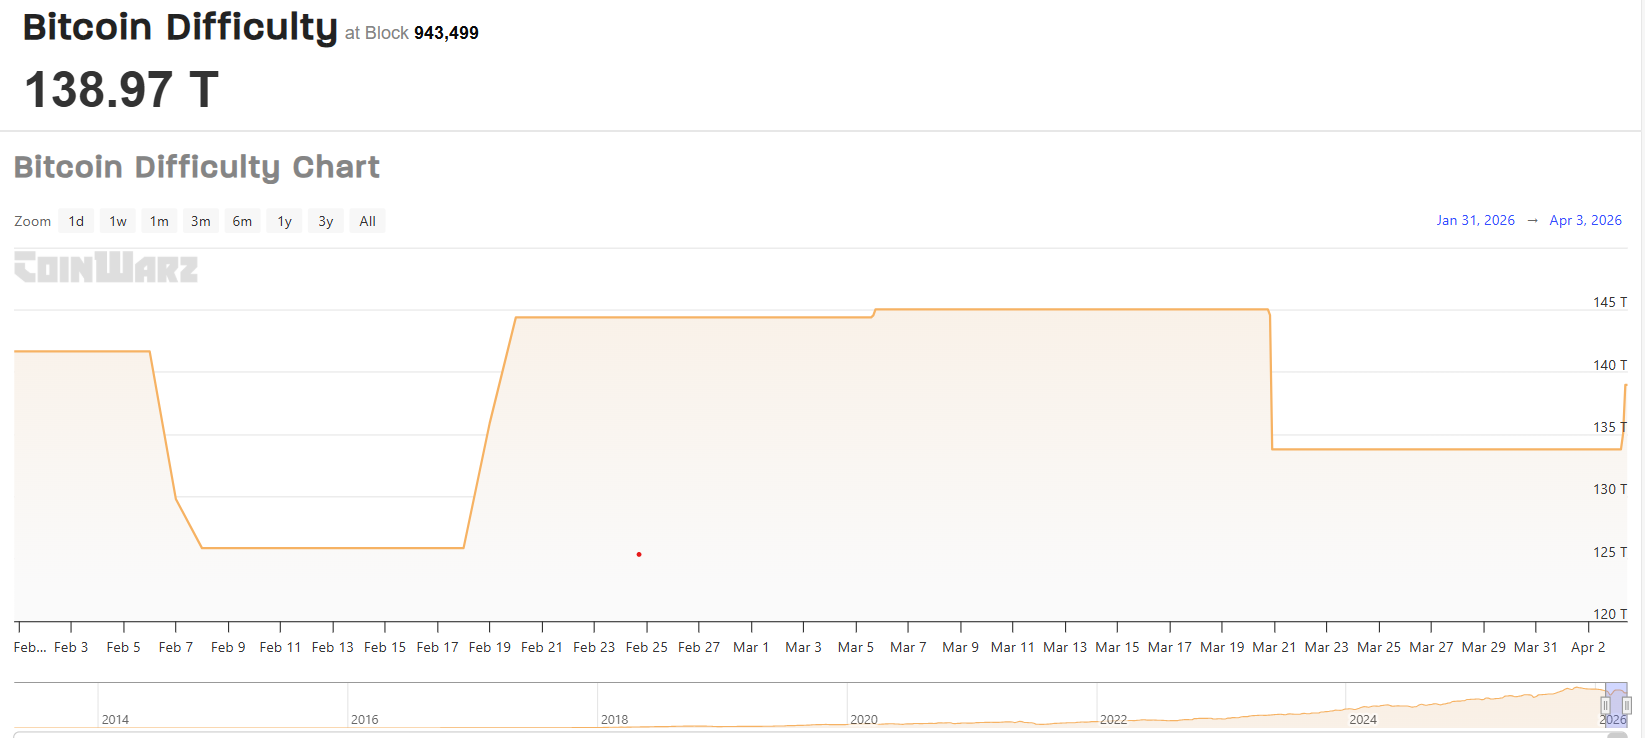
The win comes as Bitcoin mining grows increasingly competitive. Network difficulty, the measure of how hard it is to find a block, recently recorded its steepest adjustment since February, falling about 7.7% before rebounding 3.87% in the past 24 hours, reflecting weaker hashrate and briefly improving miners’ odds.
Bitcoin difficulty relief is fleeting
Even so, current difficulty levels remain near historic highs, meaning the probability of any single solo miner discovering a block is still vanishingly small.
Related: Solo Bitcoin miner bags over $200K block reward using rented hashrate
Public trackers like CoinWarz show Bitcoin’s difficulty has climbed orders of magnitude over the past decade, with only brief downward adjustments when miners switch off unprofitable rigs or redirect machines to other workloads such as artificial intelligence.

As difficulty grinds higher and input costs rise, the economics of mining increasingly favor large, well-capitalized operators over hobbyists.
Major listed Bitcoin miners are responding by reshaping their balance sheets and fleet strategies rather than betting on luck. Riot Platforms sold 3,778 BTC during the first quarter of 2026, according to a Thursday release, adding to a number of crypto miners and firms that have sold Bitcoin recently, including MARA Holdings, Genius Group and Nakamoto Holdings.
Against that institutional backdrop, the CKPool win stands out as a reminder that individuals can still, on rare occasions, beat the odds.
Magazine: Bitcoin may take 7 years to upgrade to post-quantum — BIP-360 co-author
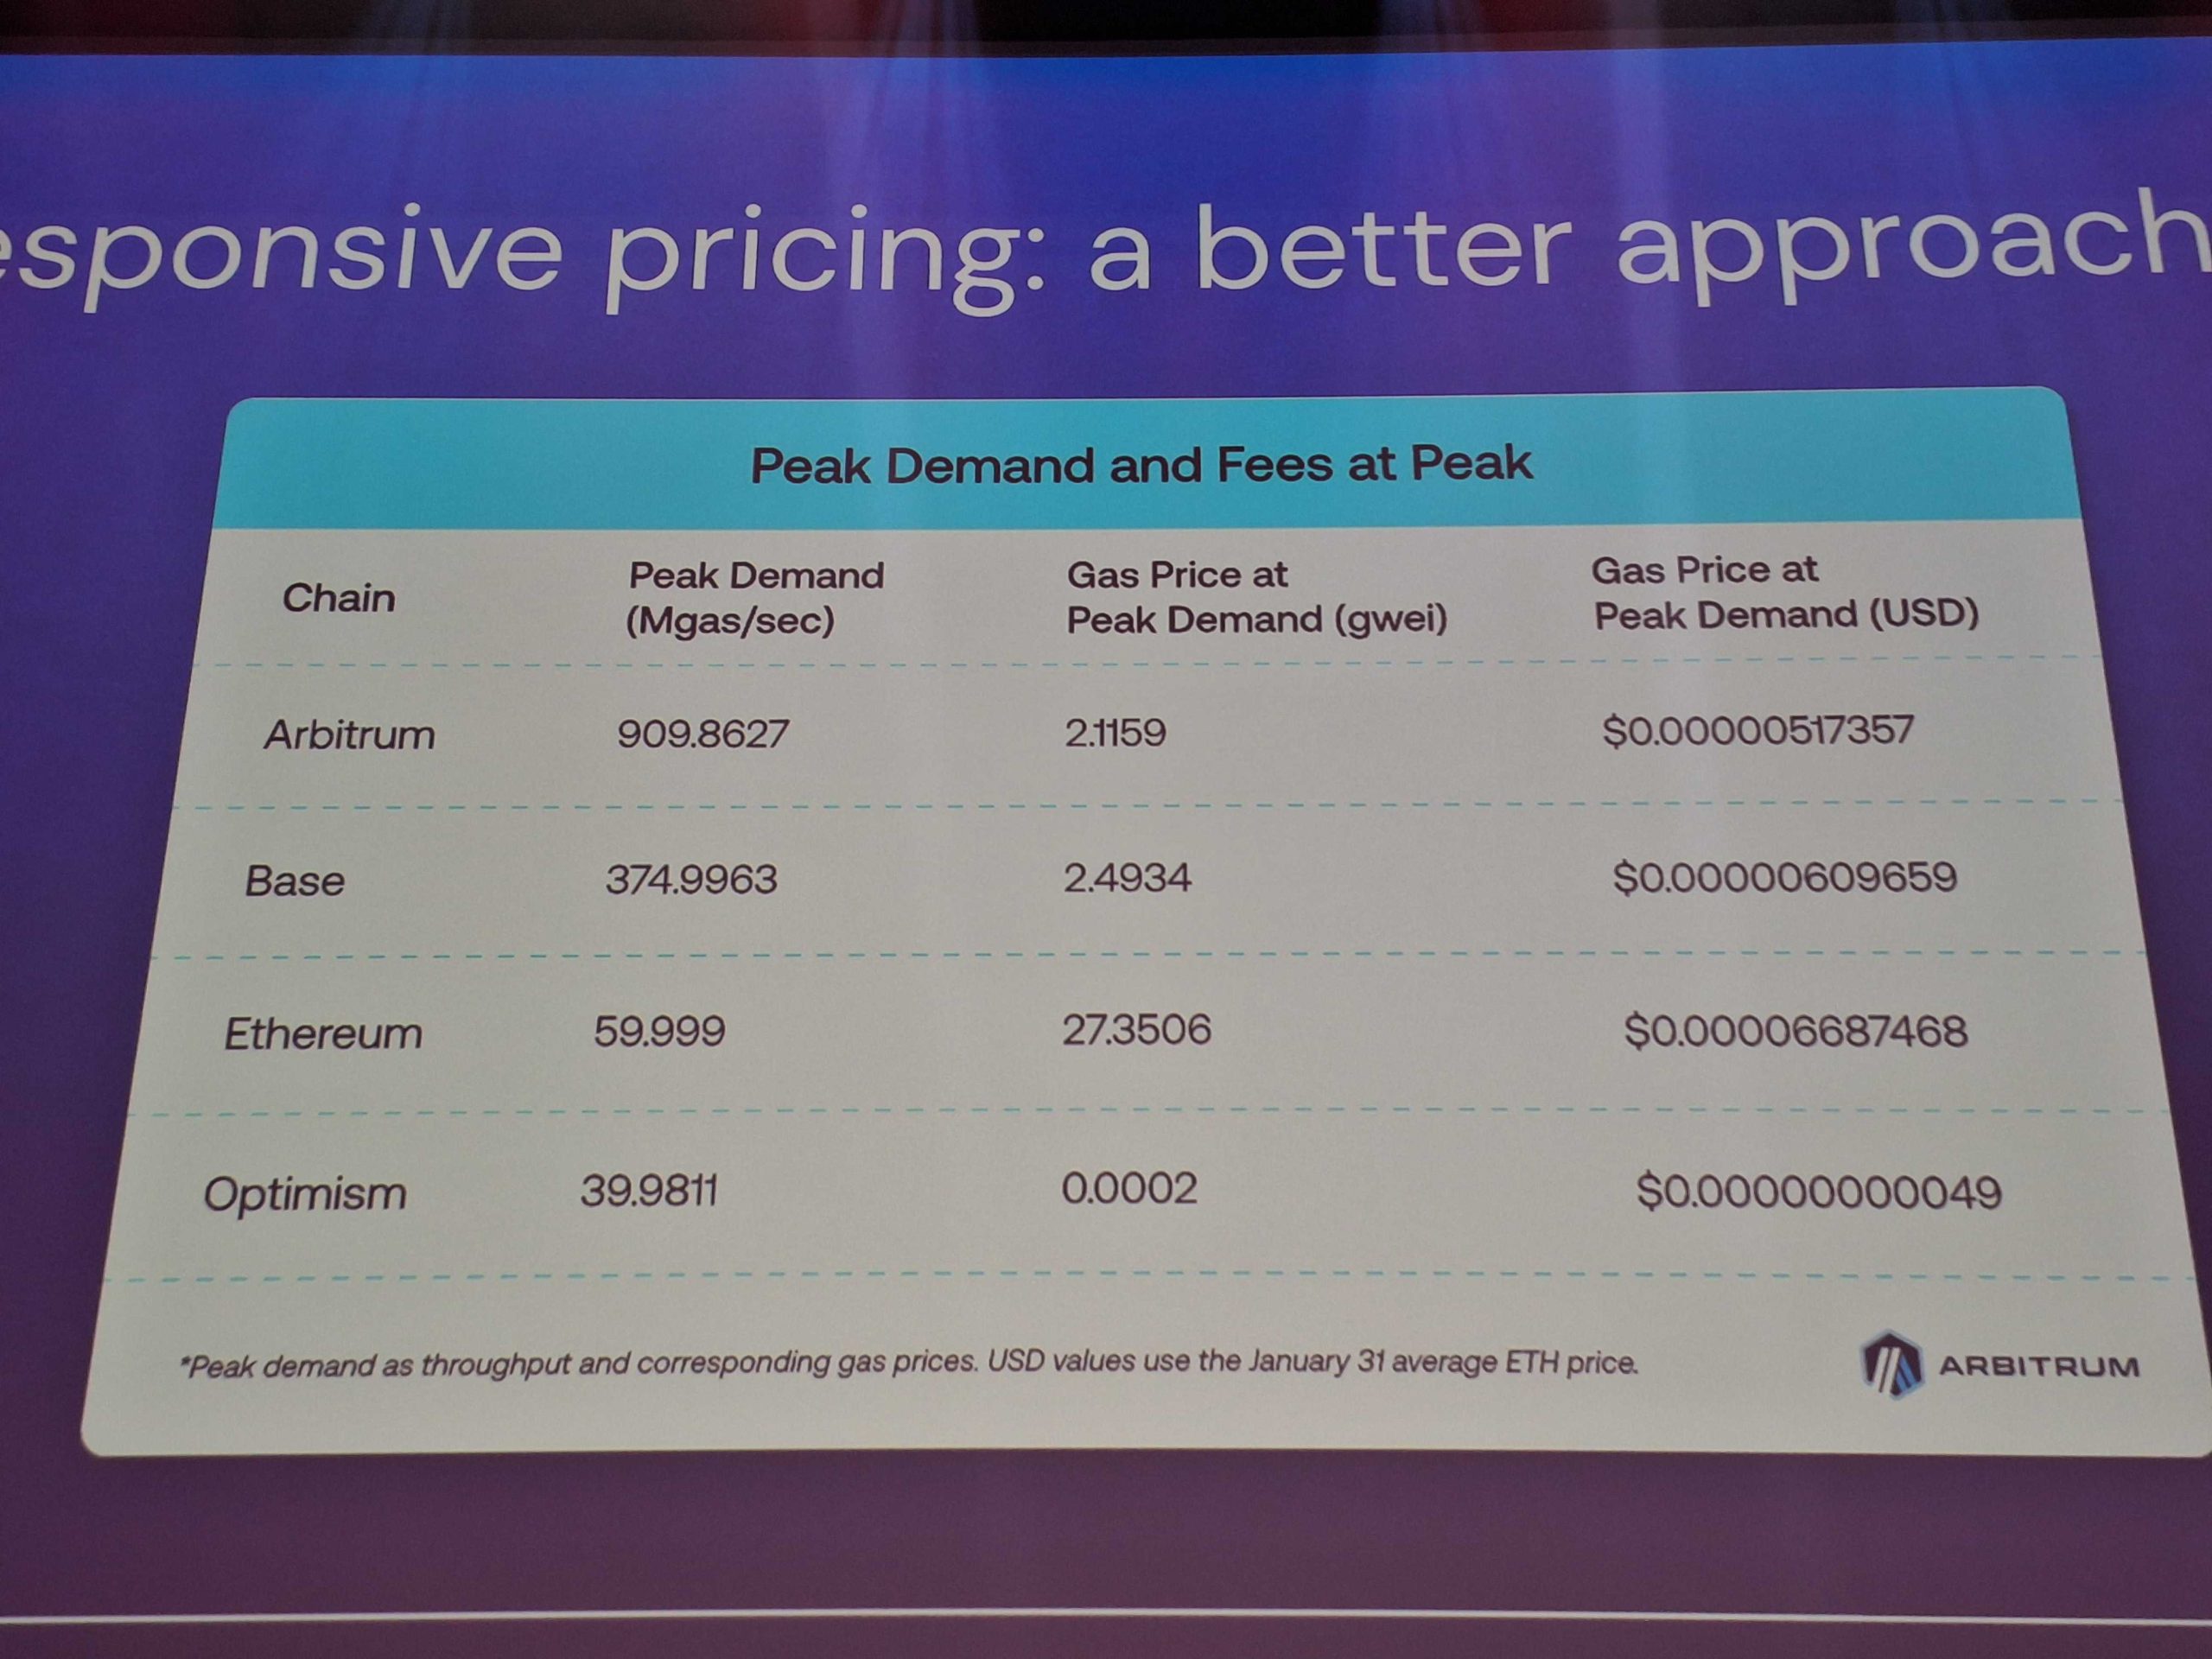
Ethereum layer-2 networks need “responsive pricing” to scale to billions of users and reduce the fee swings that still accompany congestion, Offchain Labs co-founder Edward Felten said during a keynote at EthCC 2026.
Ethereum’s EIP-1559 upgrade launched in August 2021, as part of the London hard fork. It reformed the Ethereum fee market by modifying the gas fee limit and introduced a feature that burns part of the transaction fees, removing them permanently from circulation.
Felten said gas-price swings are still the main mechanism for protecting networks from being overrun during periods of heavy demand, even though that produces the kind of fee volatility mainstream users tend to reject.
“[With responsive pricing], you can see more traffic at lower gas prices without overrunning the infrastructure.”
Volatile gas prices have long been a barrier to mass adoption, particularly for users accustomed to fixed or predictable transaction costs in traditional financial systems.
The issue matters because Ethereum’s scaling story is no longer just about adding more throughput. It is increasingly about whether layer-2 networks can make transaction costs predictable enough for mainstream-style apps while still pricing congestion honestly enough to protect infrastructure under heavy demand. Arbitrum’s dynamic pricing rollout is now one of the first live tests of that tradeoff.

Arbitrum One the first L2 to adopt responsive pricing
Arbitrum One adopted dynamic pricing in January. It described the model as an “Arbitrum platform direction to make fees more predictable under demand by aligning prices with real network bottlenecks.”
Related: Gavin Wood’s biggest hope: Free crypto transactions and Web3 tech worldwide
Felten shared multiple charts showing how Arbitrum gas fees remained lower during peak network volumes than fees on the Base network and other L2s that rely on EIP-1559.

Arbitrum One is the largest L2 with $15.2 billion in TVL, while Coinbase’s Base Chain is second with $10.9 billion, according to data from L2beat. L2s are securing over $39.7 billion in cumulative TVL, up 4.6% over the past year.
While responsive pricing may be more scalable and more transparent about underlying costs, its biggest downside is lower predictability than EIP-1559, according to Julian Kors, a senior developer and founder of execution workspace startup Pulsar Spaces.
The debate is not about one model being better, but whether networks optimise for “predictability and mechanism design purity or for efficiency and real-time cost alignment. EIP-1559 does the first very well. Responsive pricing leans into the second,” he told Cointelegraph.
Related: Ethereum Foundation accelerates 70,000 ETH staking plan after BitMine sale
Responsive pricing is a step forward, but the gas model needs replacing
Jerome de Tychey, president of Ethereum France and EthCC, told Cointelegraph that responsive pricing could improve user experience by making fees more closely reflect actual network demand.
Cyprien Grau, project lead at gasless Ethereum L2 Status Network, agreed, calling the new pricing model a “real improvement in fee accuracy.” However, the model still relies on a “fee market,” meaning that users may still face variable costs and gas spikes during congestion, he told Cointelegraph.
“It doesn’t solve the structural problem: L2 gas fees trend toward zero as scaling on L1 and L2s improves and competition intensifies. Responsive pricing makes the decline smoother, but you’re still building a revenue model on a depreciating asset.”
Grau added that responsive pricing is the “most advanced version of the gas model,” but said the gas model needs replacing. “L2s that scale to billions of users will be the ones where users never think about gas at all, and where networks’ economics don’t depend on charging them for it,” he added.
The fee model debate comes as parts of the Ethereum ecosystem are already rethinking the original rollup-centric scaling thesis. In February, Vitalik Buterin argued that some layer-2 assumptions no longer held and that future scaling should rely more heavily on the mainnet and native rollups.
L2 networks were created to scale Ethereum and offload part of the transaction load from the mainnet. However, Ethereum is now reconsidering its L2-centric approach, as these networks have siphoned significant economic value from the mainnet.
Magazine: Ethereum’s Fusaka fork explained for dummies — What the hell is PeerDAS?


RootData’s project claiming lets teams verify and manage profiles, lifting transparency scores over 30% and driving a 220% jump in heat and visibility across 220+ partners.
Summary
- RootData says more than 20 well‑known projects, including Bitway, Flock, Morph, and Solv, have claimed their profiles in the past week.
- Certified projects that complete information updates see average transparency scores jump over 30%, driving a 220% surge in RootData “heat value” and visibility.
- Over 120 projects have now been certified, gaining direct control over tokenomics, investor and team data, and syndication to more than 220 downstream data partners.
Web3 asset data platform RootData reports that adoption of its project claiming feature is accelerating, with more than 20 recognizable names — including infrastructure and DeFi projects like Bitway, Flock, Morph, and Solv — formally “settling in” over the past seven days. As the company notes in its latest update, projects that complete the claim process and supplement missing fields are seeing their comprehensive transparency scores rise by an average of more than 30%, a shift that in turn pushes their RootData “site heat value” up by roughly 220%. RootData says the move is already “greatly enhancing community trust and market attention,” with the total number of fully certified projects now exceeding 120.
According to RootData’s explainer and posts on X, the project claiming feature allows official teams to “claim your project for free, get verified, and directly manage & update” key datasets on their dedicated pages. That includes token economic models, investor lists, core team members, roadmap and milestones, as well as calendar events such as TGE dates, exchange listings, and governance votes. Once verified, teams can push updates through a one‑click sync system that RootData says distributes changes in real time to more than 220 partner platforms, ranging from exchanges and wallets to research terminals and media dashboards.
RootData’s transparency score, which it describes as measuring the “completeness and timeliness of project information,” is central to this approach. In prior analysis shared via a transparency alert, the platform highlighted that spot tokens with higher average disclosure levels (around 74.7%) tend to show shallower drawdowns and stronger rebounds than lower‑disclosure “Alpha” tokens (around 62.7%), arguing that better information reduces room for teams to exploit asymmetry with retail investors.
That framing has led RootData and commentators on Binance Square to urge teams to treat disclosure quality as a competitive advantage rather than a compliance chore. A recent post amplified by ChainCatcher put it bluntly: projects missing core information on financing, tokenomics or team composition risk being flagged as “black box” listings and deprioritized by sophisticated users and data aggregators.
In contrast, projects that claim profiles and keep them up to date now benefit from higher transparency scores, stronger on‑site heat rankings, and broader syndication across RootData’s data network — an increasingly important distribution channel in a cycle where listing venues, VC desks and retail traders all lean heavily on third‑party dashboards to filter signal from noise.

World Men’s Curling Championship: Scotland meet Canada in semi-final, watch on BBC
BBC Race Across the World fans split over one contestant minutes into first episode

Financial influencer uses ‘money tree’ concept to explain wealth building

Smart energy pays enters the US market, targeting scalable financial infrastructure

Why Israel is blocking foreign journalists from entering

Bitcoin: We’re Entering The Most Dangerous Phase

Crypto Trading LIVE: BTC Live Trading Bitcoin Analysis | 28 MAR #crypto #bitcoin #btc

Michael Saylor on new STRC stock: Creates an on-ramp for bitcoin believers without the volatility

BITCOIN TO $50K?! Oil Surges as the S&P 500 Hits Make-Or-Break Support
-

 NewsBeat7 days ago
The Story hosts event on Durham’s historic registers
-

 NewsBeat24 hours ago
Steven Gerrard disagrees with Gary Neville over ‘shock’ Chelsea and Arsenal claim | Football
-

 Sports7 days ago
Sweet Sixteen Game Thread: Tide vs Michigan
-
Entertainment4 days ago
Fans slam 'heartbreaking' Barbie Dream Fest convention debacle with 'cardboard cutout' experience
-

 Business18 hours ago
No Jackpot Winner and $194 Million Prize Rolls Over
-

 Crypto World2 days ago
Gold Price Prediction: Worst Month in 17 Years fo Save Haven Rock
-
 Entertainment6 days ago
Lana Del Rey Celebrates Her Husband’s 51st Birthday In New Post
-

 Tech5 days ago
The Pixel 10a doesn’t have a camera bump, and it’s great
-
Crypto World3 days ago
Dems press CFTC, ethics board on prediction-market insider trades
-

 Tech5 days ago
Avatar Legends: The Fighting Game comes out in July and it looks pretty slick
-

 Sports3 days ago
Tallest college basketball player ever, standing at 7-foot-9, entering transfer portal
-

 Tech3 days ago
EE TV is using AI to help you find something to watch
-

 Fashion6 days ago
Amazon Sundays: Soft Spring Layers
-

 Business2 days ago
Login and Checkout Issues Spark Merchant Frustration
-

 Fashion7 days ago
When Evening Dressing Gets Colorful for Spring
-

 Tech5 days ago
Elon Musk’s last co-founder reportedly leaves xAI
-

 Tech3 days ago
How to back up your iPhone & iPad to your Mac before something goes wrong
-

 Tech4 days ago
Apple will hide your email address from apps and websites, but not cops
-

 Politics4 days ago
Should Trump Be Scared Strait?
-

 Crypto World4 days ago
U.S. rule change may open trillions in 401(k) funds to crypto
You must be logged in to post a comment Login