
Crypto World
Georgia Trump district votes today


The US politics news today midterm election Georgia Trump test is live: polls opened this morning in the deeply conservative Georgia-14 district that Marjorie Taylor Greene vacated, where Republican Clay Fuller faces Democrat Shawn Harris in a runoff that analysts say could be the clearest early signal yet of whether the Iran war is beginning to hurt Republicans’ electoral standing.
Summary
- Democrat Shawn Harris, a retired Army brigadier general and cattle farmer, led the March 10 primary with 37% in a district Trump won by 37 points in 2024, prompting Trump himself to urge Republicans to “be careful” and post a personal get-out-the-vote message Monday night
- If Harris wins or comes significantly closer than expected, it would signal elevated Democratic enthusiasm heading into November’s midterms, where Republicans hold a razor-thin 218-214 House majority
- The Iran war has become a central issue: Harris has explicitly tied rising gas prices to the conflict, telling voters “they will have to stop at the pump, and that’ll be the last thing they think about before they go and vote”
The US politics news today midterm election Georgia Trump dynamic arrived at its most visible test yet when polls opened this morning in Georgia’s 14th Congressional District, a stretch of northwest Georgia that runs across 10 counties from suburban Atlanta to Tennessee. Bloomberg reported the race as a direct test of Trump’s standing with his own base amid the Iran war, with Harris, a retired Army brigadier general, running against Trump-endorsed district attorney Clay Fuller in the runoff to replace MTG.
The district is the most Republican-leaning congressional seat in Georgia, according to the Cook Political Report. Trump carried it by 37 points in 2024. Harris won the March 10 all-party primary with 37% against 17 candidates — 12 of whom were Republicans — a result that rattled enough people in Washington that Trump posted a personal appeal Monday night: “I am asking all Republicans, America First Patriots, and MAGA Warriors, to please GET OUT AND VOTE for a fantastic Candidate, Clay Fuller.”
Harris has positioned gas prices as his closing argument. “When they go to the polls, they will have to stop at the pump, and that’ll be the last thing they think about before they go and vote,” he told Fox News. “And they’re going to say, ‘You know what, Shawn Harris is the only one that’s talking about bringing down costs.’” National gas prices now average $4.14 per gallon, up from $2.98 before the war began.
Harris has also used his military background to credibly challenge the war. “We will win this war militarily. However, if we don’t watch it and be clear with the American people, based on these gas prices and diesel prices, we could actually lose this war politically,” he said.
Fuller’s counter: “The voters in Georgia-14 support the president in this endeavor.” He has described himself as a “MAGA warrior” and called voters ready to support the district’s continued representation under Trump’s agenda.
What the Margin Will Tell November’s Candidates
Even a Harris loss by a small margin would carry significant information for both parties. As one analyst noted, the key question is “the margin by which he loses, and whether or not it’s narrower compared to 2024” — and whether Harris can demonstrate that Democratic infrastructure built during the special election translates into broader midterm momentum in Georgia.
The stakes for crypto policy are real as well. As crypto.news reported, the Fairshake crypto super PAC has $116 million set aside for the 2026 midterms, targeting congressional races where candidates’ positions on digital asset legislation will shape November’s outcomes. A House that shifts Democratic in November would significantly change the calculus for the CLARITY Act. As crypto.news noted, Democrats may have little incentive to accelerate crypto legislation if they believe they can regain House control — and tonight’s result in Georgia-14 will be the first data point on whether that scenario is becoming more credible.
“What I’m looking at is the improvement compared to 2024,” one Georgia political analyst told MS NOW. “That improvement suggests enthusiasm among Democrats that could be a harbinger going into the November midterm elections.”


Bitcoin traded near the $73,000 zone after the March CPI print came in cooler than some forecasts, easing some inflation fears and setting the stage for a cautious push higher. The Bureau of Labor Statistics showed the consumer price index rose modestly, with energy costs driving the month’s big moves.
Gasoline, in particular, surged by a hefty margin, helping push gasoline prices higher within the energy component. The CPI release also highlighted that energy costs remained elevated, even as the overall inflation picture topped by the energy spike did not portend an immediate shift in policy expectations. Traders recalibrated their bets as futures markets signaled that a near-term rate cut by the Federal Reserve remained unlikely for now.
The day’s momentum reflected a broader market narrative: traders parsed the data for hints on the Federal Reserve’s trajectory while monitoring Bitcoin’s own resistance and support levels in a chart that has shown both resilience and volatility in recent weeks.
Key takeaways
- Bitcoin hovered around $73,000 as the March CPI print came in below market expectations, suggesting a softer near-term inflation path than anticipated.
- The CPI energy component rose notably, with the gasoline index up 21.2% month over month, contributing to a 10.9% year-over-year rise in energy costs for March.
- Despite the energy spike, the overall CPI surprised to the downside relative to expectations, reinforcing a caution stance on aggressive monetary tightening or imminent rate cuts.
- Traders highlighted technical setups near critical zones, with liquidity pockets identified below $71,000 and resistance in the $73,000–$74,000 area, shaping short-term risk and reward for BTC.
- Analysts continued to weigh the broader macro context, including Fed expectations and potential chart-driven catalysts, amid a mixed inflation backdrop.
CPI dynamics and Bitcoin’s path to local highs
Markets absorbed a CPI reading that showed a tepid move versus forecasts. The data pointed to a pause in hotter inflation pressures, even as energy costs remained a focal point for investors. The gas price spike, in particular, was a reminder that energy components can dominate monthly price shifts and influence policy discourse. The official release underscored that “The index for energy rose 10.9 percent in March, led by a 21.2-percent increase in the index for gasoline,” a figure that fed into traders’ cautious posture about near-term inflation trajectories.
In the context of Bitcoin, the price action around $73,000 signals a test of nearby supply zones rather than a breakout run. Market commentary from traders noted a narrowing wedge pattern forming in the BTC/USD space, a setup that could precipitate a decisive move if support or resistance gives way. The sense of pending direction was reinforced by observations of order-book liquidity, with attention focused on levels just below $74,000 and pockets around $71,000 on the downside.
Analysts have previously linked RSI-like signals to potential trend reversals in Bitcoin, citing a pattern that some observers say echoes the late-2022 bear-market bottom. While such indicators are not guarantees, they contribute to the ongoing discourse around whether BTC can extend a move toward fresh local highs or face renewed resistance in the near term.
Near-term technical context and the broader market backdrop
From a technical standpoint, traders have kept a close eye on how BTC responds to key price levels in the coming sessions. A recent analysis from a market analyst known as JDK Analysis described BTC/USD as operating within a narrowing wedge, suggesting that the next substantial move could hinge on a breakout above a prior high or a rejection that tests support. In practical terms, that means watching how BTC behaves near the $73,000–$74,000 zone and whether selling interest tightens below $71,000.
On the liquidity front, observers have pointed to local order-book dynamics as a guiding factor for the short-term path. One trader highlighted that liquidity around critical levels—roughly below $71,000 and above $73,000–$74,000—would likely influence the pattern of any impending breakout or pullback. Such micro-structure considerations matter in a market where macro headlines intermittently drive risk appetite and liquidity conditions.
Intraday commentary also echoed the role of macro policy expectations in shaping BTC moves. Market participants have largely priced in a cautious stance from the Federal Reserve, with rate-cut prospects pushed further into the future by recent data. The CME FedWatch Tool and related market-implied probabilities have reinforced the view that policy normalization remains gradual, supporting a context in which Bitcoin could act as a risk-on or risk-off asset depending on the liquidity environment and broader risk sentiment.
Earlier coverage from Cointelegraph noted that a copycat RSI signal had appeared to mirror the conditions seen at the end of the 2022 bear market, a reminder that momentum indicators can align with longer-term price cycles in unexpectedly telling ways. This backdrop continues to color how traders interpret periodic pullbacks and rallies in BTC as they weigh the odds of a renewed leg higher versus a renewed test of the lower boundary.
This article follows the inflation release in a week that has underscored the complexity of the macro picture: energy costs are pushing CPI moves, policy expectations remain cautious, and bitcoin’s price action continues to respond to a combination of macro data and micro-structure signals. As investors weigh the next steps, attention remains on how BTC negotiates the $74,000 resistance and whether the $71,000 level will provide a firmer foothold for a sustained recovery or a further dip.
This article is intended for informational purposes and reflects data from official sources and market commentary available at the time of publication. Readers should perform their own due diligence before making any investment decisions.
What remains uncertain is how sustained energy-driven volatility will influence both inflation trajectories and the timeline for policy normalization, as well as how Bitcoin’s price will respond to any changes in risk appetite as new data comes in.

Key Highlights
- Erayak Power (RAYA) shares climbed 71% Friday following a strategic transformation announcement targeting the U.S. market.
- The manufacturer is transitioning from China-centric operations to a U.S.-oriented research and development model via Nexora, its North American arm.
- A new lineup of Tri-Fuel Inverter Generators (9kW–13kW) capable of operating on gasoline, propane, and natural gas was introduced.
- The strategic transformation followed comprehensive market research spanning 5,000 miles across five American states and a product presentation at the 2026 National Hardware Show in Las Vegas.
- The company established fresh distribution agreements with North American retail chains and wholesale partners during the trade event.
Erayak Power (RAYA) experienced a 71% surge Friday following its announcement of a fundamental business restructuring focused on the American market through Nexora, its subsidiary, while introducing innovative Tri-Fuel power generators and securing retail distribution agreements at the 2026 National Hardware Show.
Erayak Power Solution Group Inc., RAYA
The significant stock movement followed Erayak’s disclosure of comprehensive operational changes. The enterprise, which historically accessed North American customers mainly through third-party export arrangements, is establishing a direct American footprint.
The transformation revolves around Nexora, Erayak’s North American division. According to the revised business structure, Nexora will manage research and development, customer relations, and market strategy for the United States, while production operations continue through the Ruike Electronics manufacturing plant.
Prior to implementing the new strategy, Erayak executives undertook an extensive 5,000-mile investigation across California, Arizona, Texas, Florida, and New York. This comprehensive tour focused on identifying specific regional power requirements throughout diverse American markets.
The organization presented its latest innovations at the 2026 National Hardware Show in Las Vegas. This platform simultaneously facilitated the establishment of strategic partnerships with premium retailers and industrial distribution networks throughout North America.
Innovative Product Portfolio
Erayak’s 2026 flagship offerings feature Tri-Fuel Inverter Generators spanning 9kW to 13kW capacity. These generators operate on multiple fuel sources—gasoline, propane, or natural gas—and incorporate Auto Transfer Switch capabilities.
These power units integrate with commercial-grade UPS Solar Inverters. According to Erayak, the integrated systems deliver consistent emergency power solutions, including support for AI-edge computing infrastructure and connected home technologies.
The organization identified Texas and Florida as priority markets, referencing persistent electrical grid stability challenges in these regions. The generators incorporate reduced total harmonic distortion technology, which Erayak indicates makes them appropriate for powering delicate electronic equipment.
Erayak characterizes its market penetration strategy as a “Twin-Track” framework. This approach merges Nexora’s direct consumer sales channel with a broadened wholesale distribution infrastructure.
Business Transformation
CEO Lingyi Kong positioned the initiative as an evolution beyond traditional manufacturing. “By establishing Nexora as our North American face, we are moving beyond manufacturing to become a vertically integrated power solutions provider,” Kong said.
Before this strategic announcement, Erayak’s North American operations functioned predominantly through indirect export mechanisms. The current organizational structure represents a significant departure from previous approaches.
The company indicated the Nexora framework aims to enhance operational clarity and deliver greater shareholder value.
RAYA commenced Friday trading with substantial volume following the strategic disclosure. The stock registered a 71% gain by market close, with peak intraday appreciation reaching 87%.
The 2026 National Hardware Show presentation combined with the Nexora strategy announcement emerged as the principal drivers behind Friday’s significant price movement.


MoonPay, WalletConnect, and Ingenico announced a partnership to enable stablecoin payments at physical retail locations globally using MoonPay Virtual Accounts for fiat settlement.
MoonPay announced a partnership with WalletConnect and Ingenico to bring stablecoin payments to physical retail locations at global scale. The integration leverages MoonPay Virtual Accounts to enable fast fiat settlement for in-store transactions powered by stablecoins.
WalletConnect provides wallet connectivity infrastructure, while Ingenico brings point-of-sale terminal capabilities and retail distribution. The partnership targets enabling merchants worldwide to accept stablecoin payments directly at checkout with immediate conversion to fiat currency.
Sources: MoonPay
This article was generated automatically by The Defiant’s AI news system from publicly available sources.
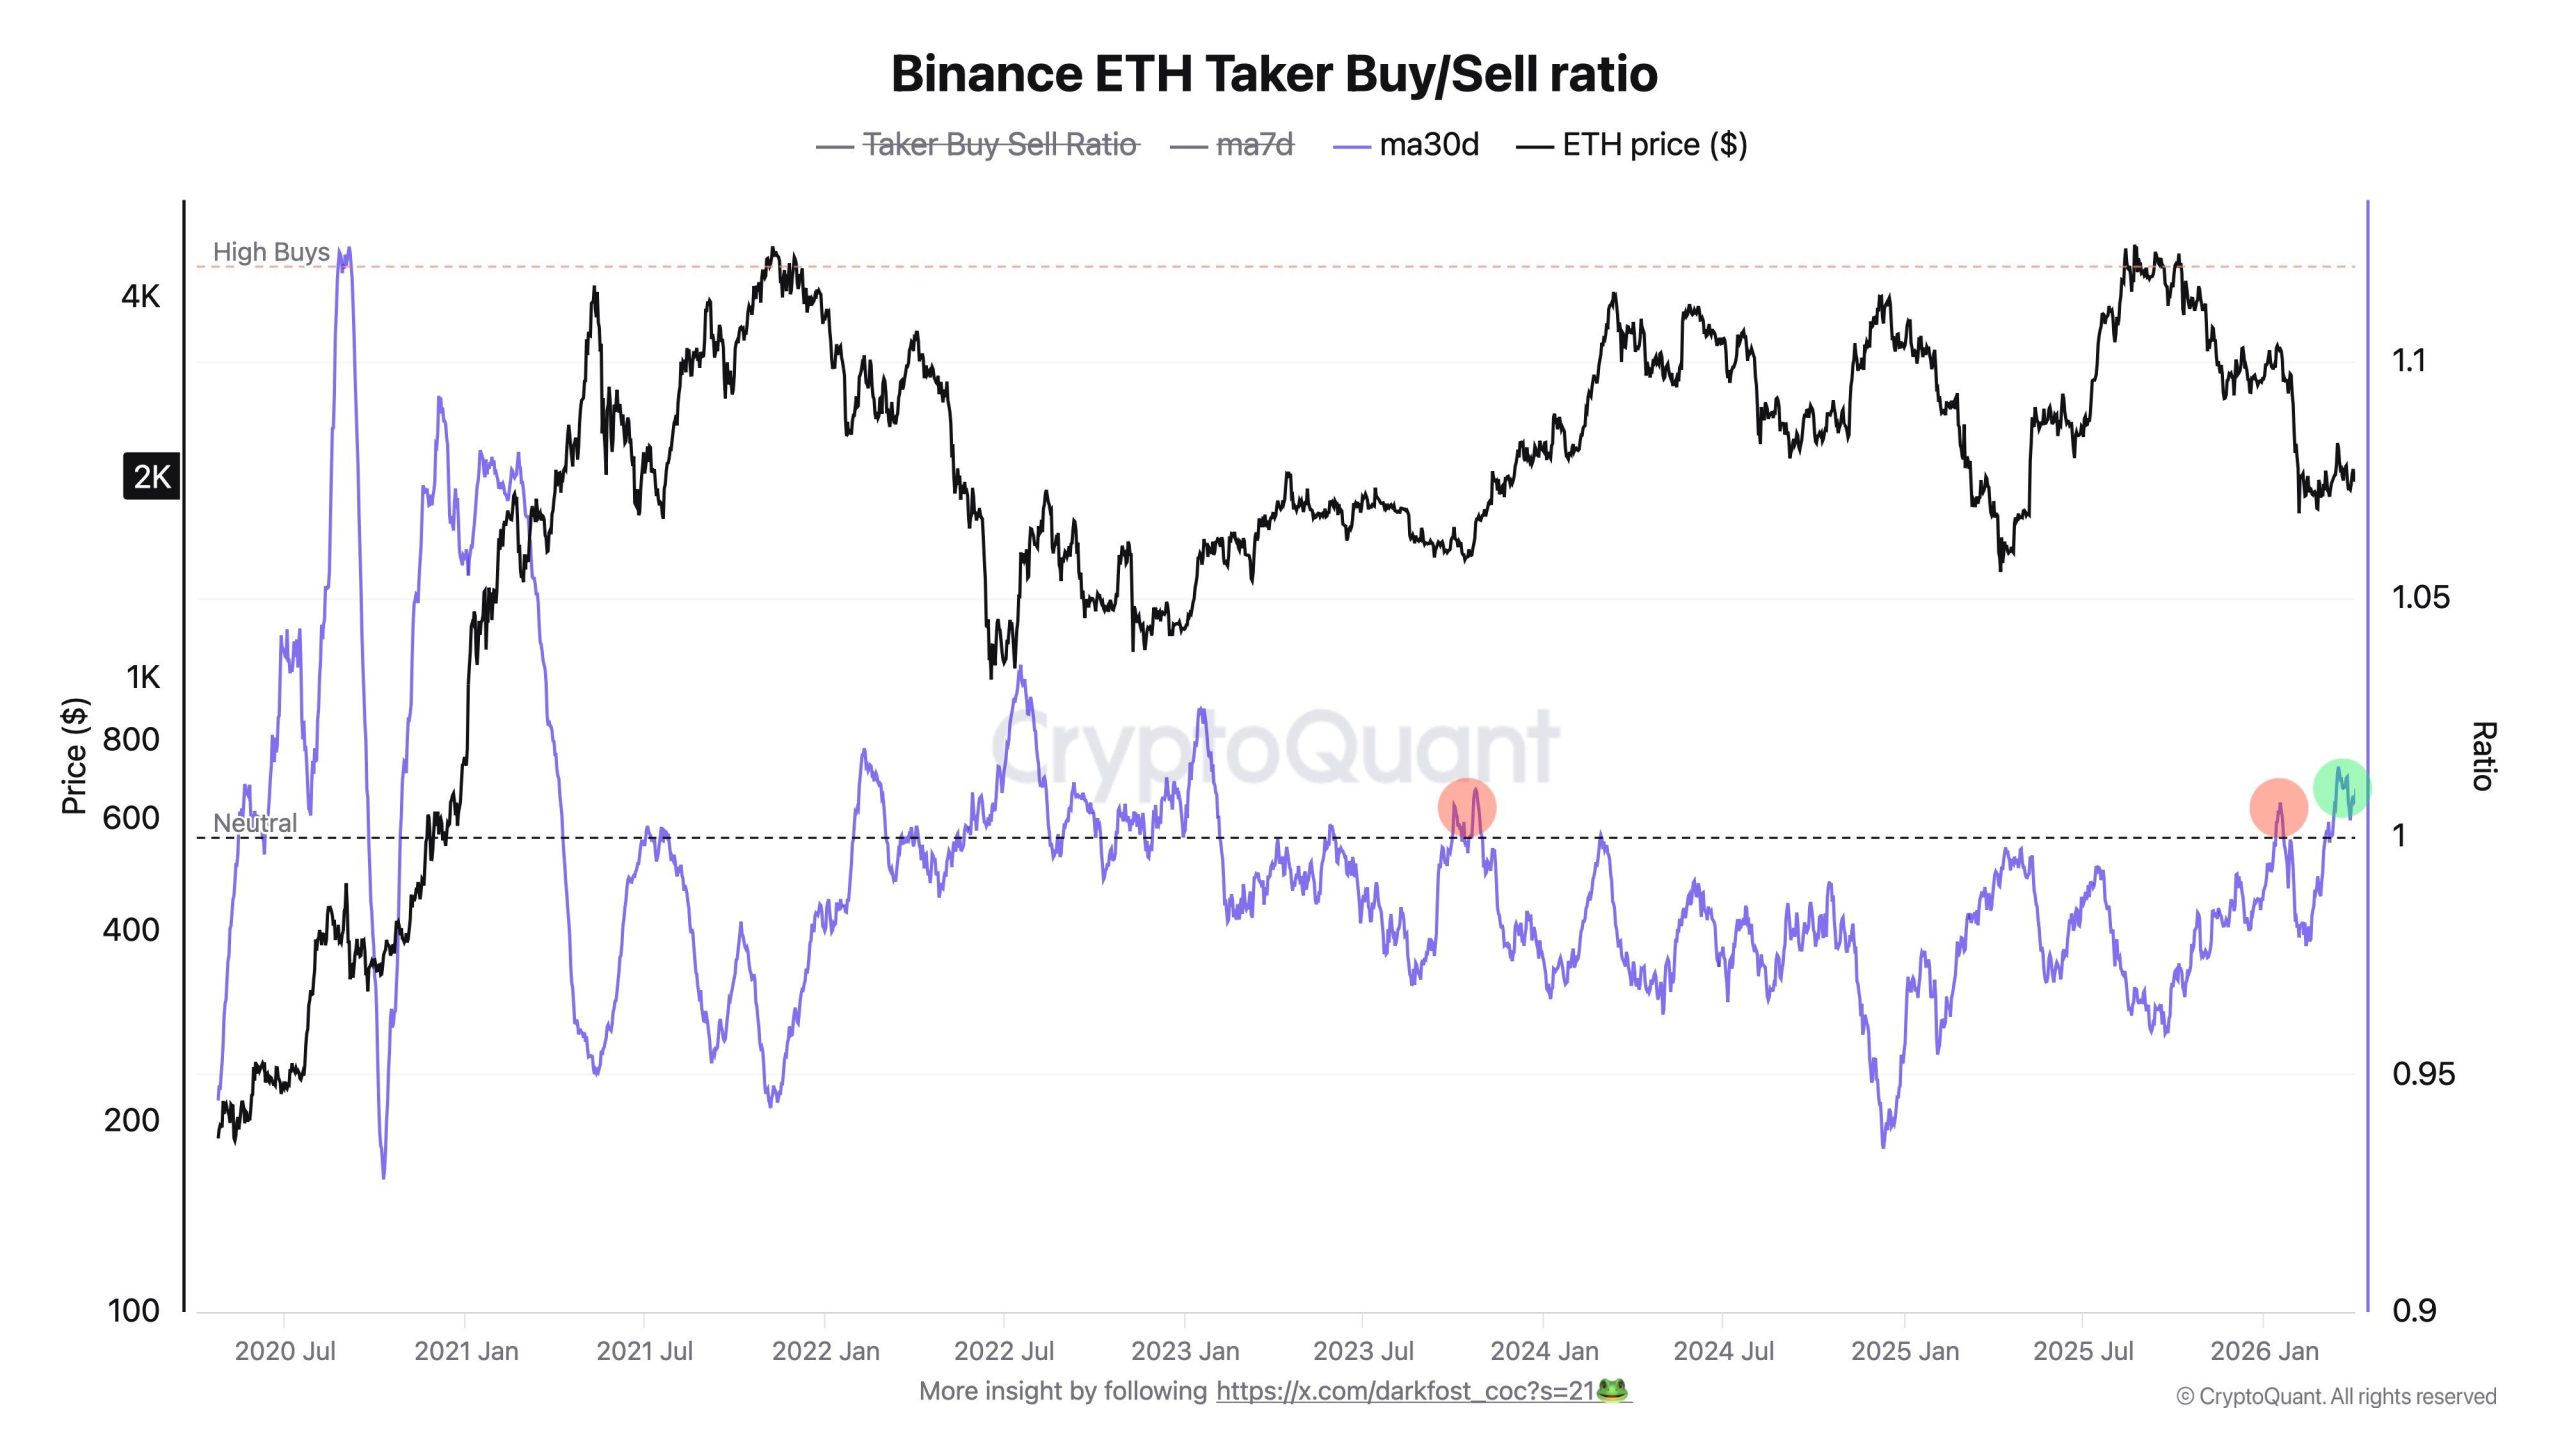
Ethereum’s (ETH) Taker Buy-Sell Ratio on Binance is flashing a signal not seen in nearly three years. The monthly average has climbed to around 1.016 and has held above 1 for several consecutive days.
The shift suggests that market-buy orders are outpacing sells on Binance’s ETH perpetual contracts, a signal CryptoQuant analyst Darkfost flagged as “early stages of a more constructive trend.”
Why Derivatives Data Matters More For ETH
For context, the Taker Buy Sell Ratio tracks the balance between market buy and sell volumes on perpetual contracts. A reading above 1 means aggressive buyers are outpacing sellers.
What stands out now is the monthly average holding above 1 for multiple consecutive days.
“This reflects a progressive return of buyer dominance on perpetual markets, suggesting the early stages of a more constructive trend,” the analyst said. “This therefore marks a constructive development for Ethereum, not seen since 2023.”
Follow us on X to get the latest news as it happens
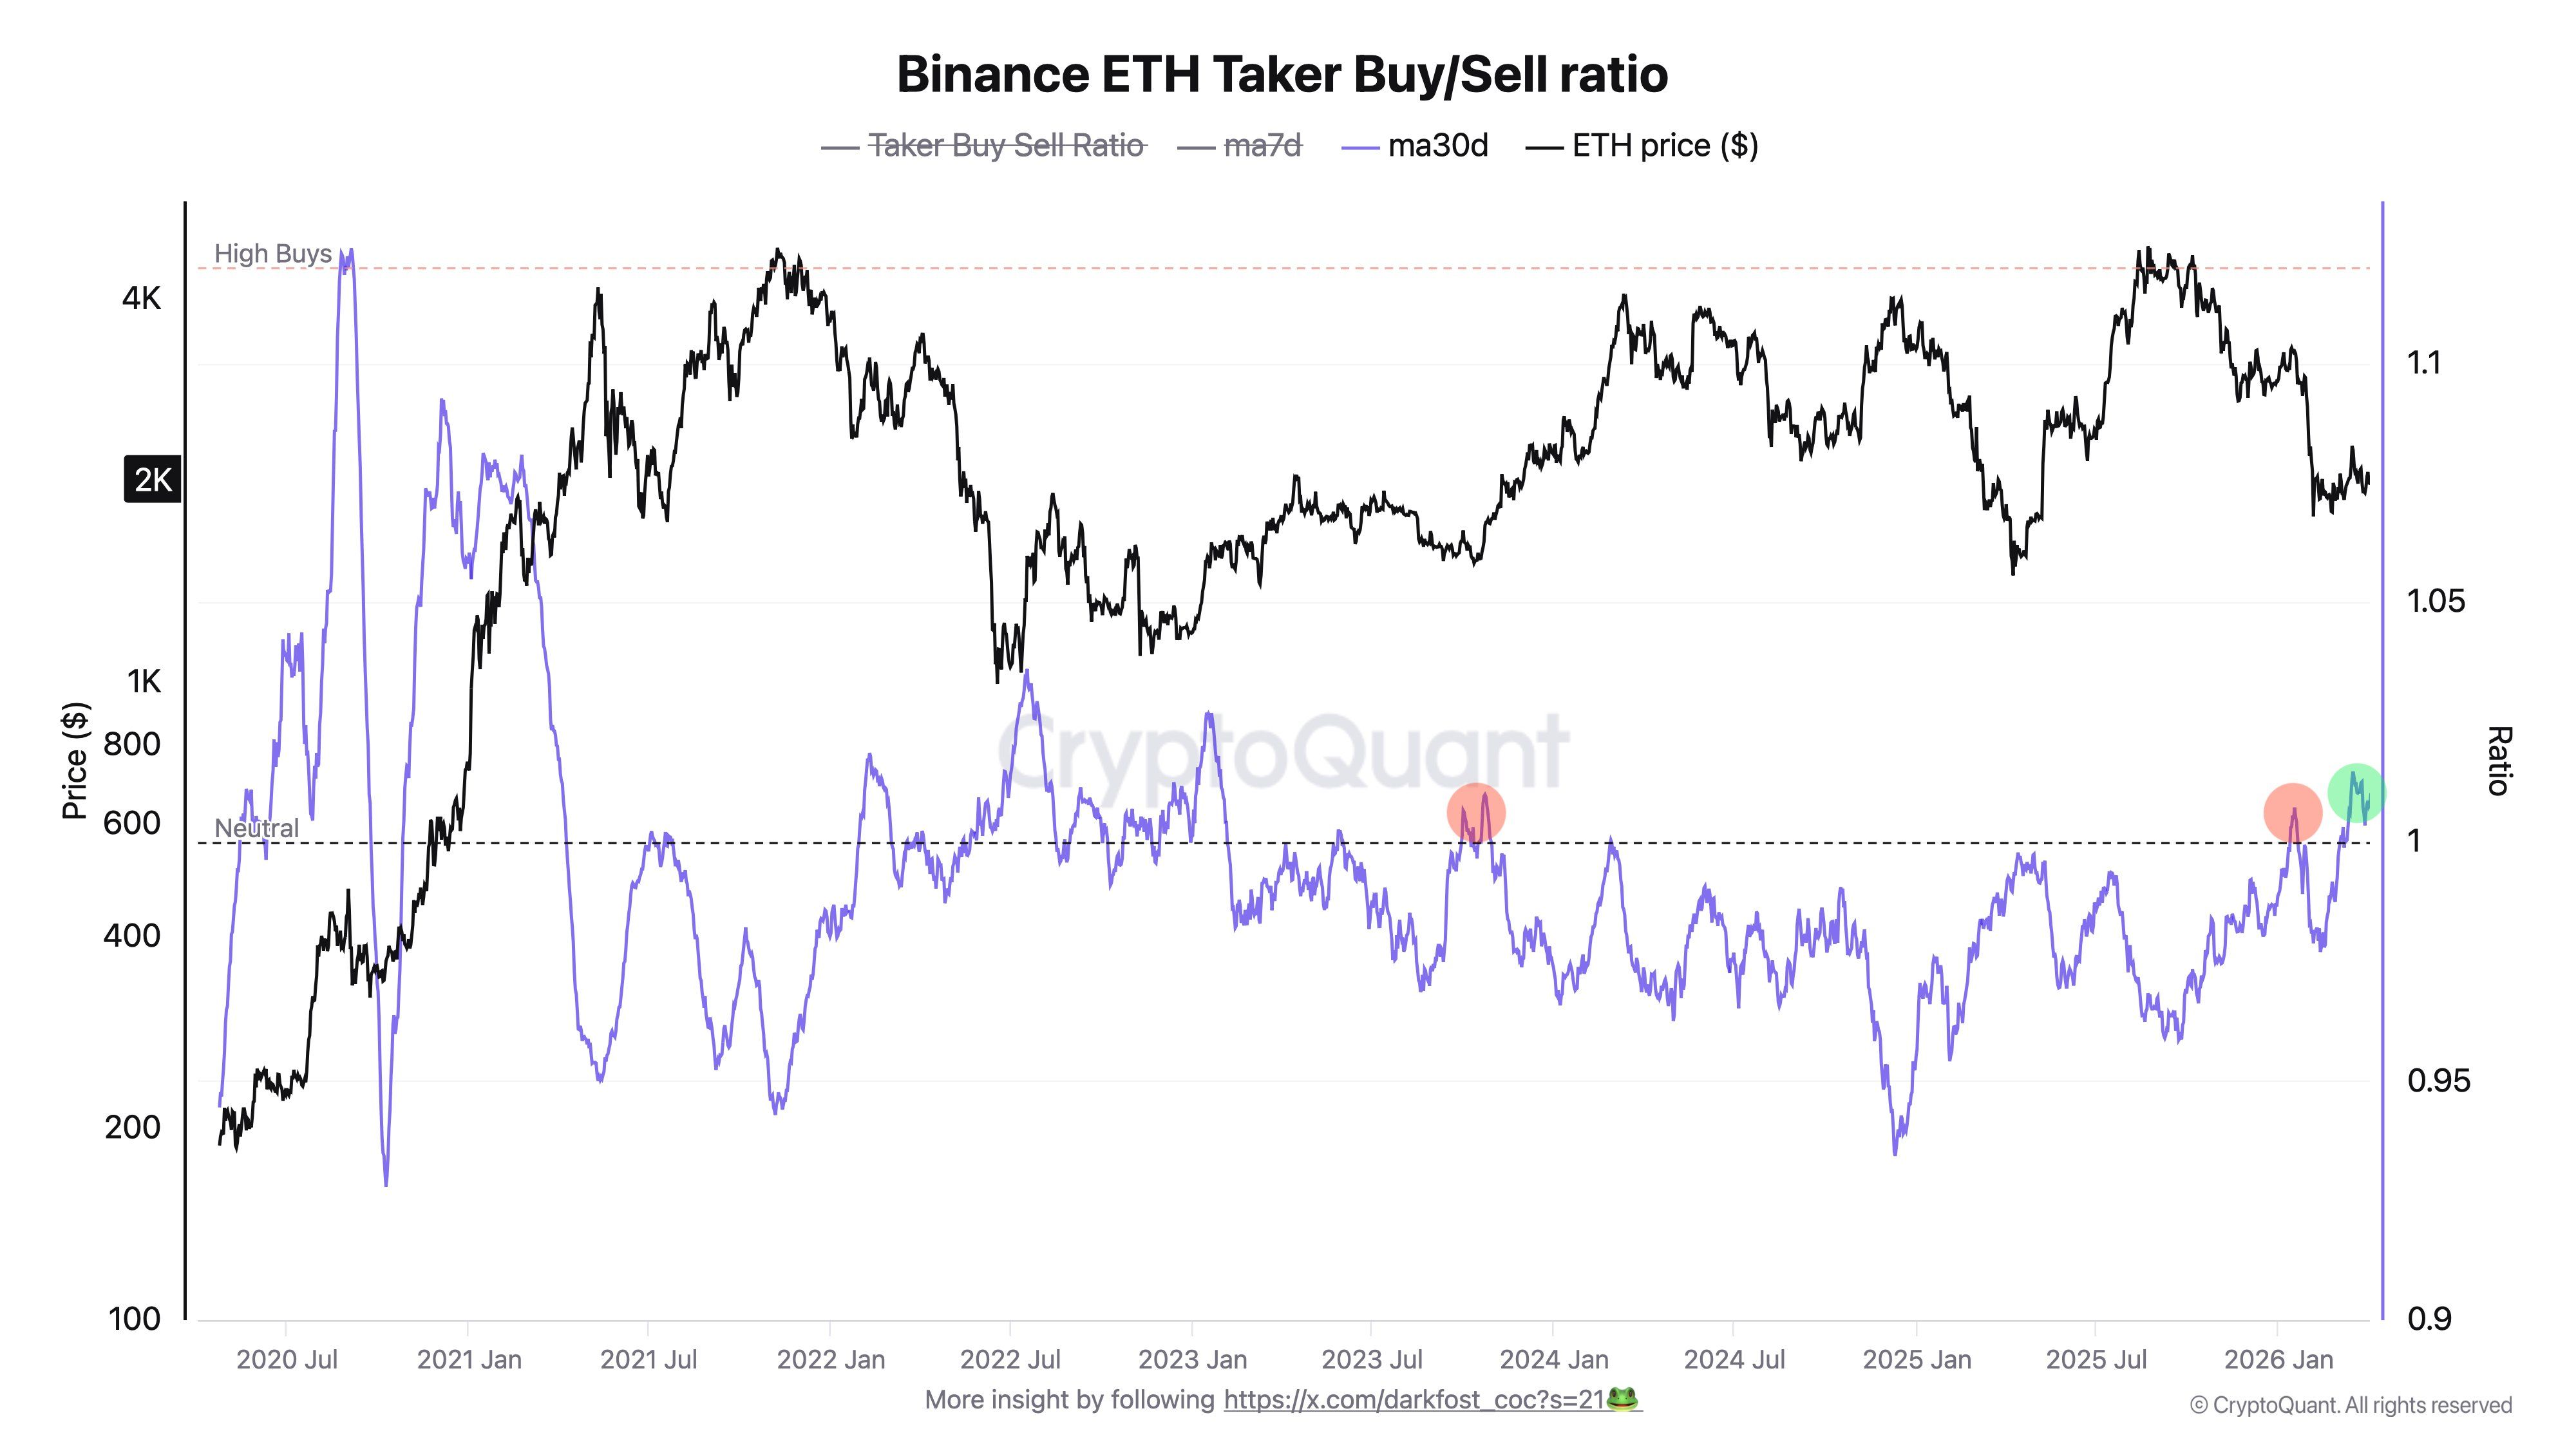
The signal carries added weight because futures activity on Binance now dwarfs spot trading. The exchange’s spot-to-futures volume ratio recently fell to 0.13, meaning roughly $7 in futures changes hands for every $1 in actual ETH buying.
That imbalance makes derivatives positioning the primary driver of short-term price action. Moreover, Binance accounts for approximately 37% of global ETH open interest. According to the analyst, this dominance makes it a key venue for assessing derivatives positioning.
Notably, the ratio’s move above 1 has been incremental rather than sudden. The analyst considers this pattern healthier than a sharp spike, which tends to create overleveraged positioning and trigger cascading liquidations.
The development comes despite ongoing macroeconomic and geopolitical uncertainty, suggesting early-stage structural improvement in ETH sentiment. However, the derivatives-heavy market structure still poses risks. A futures-led rally without matching spot demand could amplify volatility if positions unwind quickly.
Subscribe to our YouTube channel to watch leaders and journalists provide expert insights
The post Ethereum Flashes Bullish Signal Not Seen Since 2022 on Binance Futures appeared first on BeInCrypto.
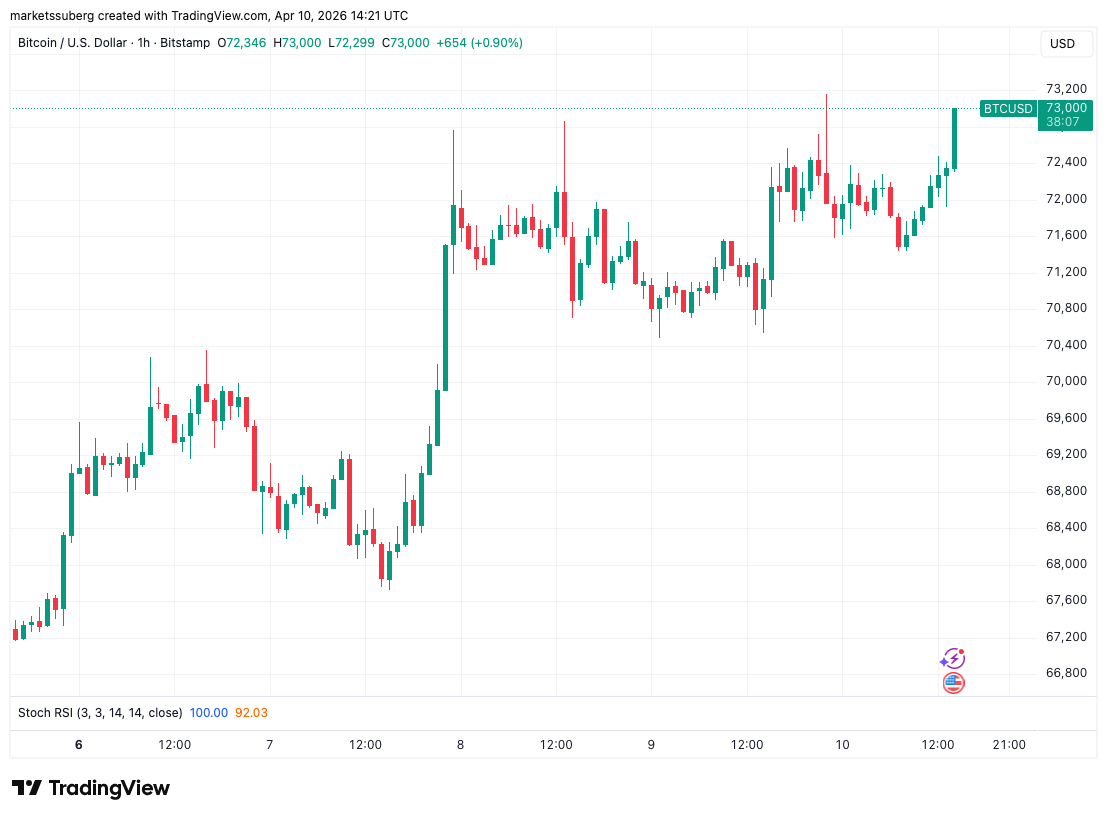
Bitcoin (BTC) tagged $73,000 following Friday’s Wall Street open as crucial US inflation numbers came in below expectations.
Key points:
-
Bitcoin edges higher as US CPI data remains slightly below market expectations.
-
Gasoline prices see a historic surge within the CPI release.
-
Bitcoin traders plan out key resistance levels overhead.
BTC price seeks new local highs after CPI
Data from TradingView showed BTC price eyeing new multi-week highs as markets digested the March print of the Consumer Price Index (CPI).

This was the week’s key macro data release, and the first CPI report to reflect the impact of the US and Israel war in Iran.
Gasoline prices jumped over 21% month-on-month, the Bureau of Labor Statistics (BLS) confirmed, but overall CPI finished 0.1% lower than markets’ expectations.
“Over the last 12 months, the all items index increased 3.3 percent before seasonal adjustment,” an official news release read.
“The index for energy rose 10.9 percent in March, led by a 21.2-percent increase in the index for gasoline which accounted for nearly three quarters of the monthly all items increase.”

Reacting, trading resource The Kobeissi Letter noted that the gas-price CPI jump was the largest monthly gain since 1967. The energy increase, it added in a further post on X, was the largest since 2005.
With the resulting mixed picture of inflationary forces, US stocks were mostly flat at the open, while BTC price action also avoided major moves up or down.

Markets, however, had no hope for the Federal Reserve cutting interest rates — a conclusion already in place on the back of Thursday’s Personal Consumption Expenditures (PCE) index release, per data from CME Group’s FedWatch Tool.
Bitcoin traders draw the next resistance zones
Among Bitcoin market participants, there was modest reason for optimism over the short-term price outlook.
Related: Bitcoin analysis sees $55K BTC price ‘iron bottom’ by December 2026
In their latest X analysis, trader JDK Analysis flagged BTC/USD acting within a narrowing wedge — a topic of debate since February.
“If price makes another attempt at the current key high, the reaction there will be critical!” they wrote in accompanying commentary.

Trader Daan Crypto Trades meanwhile eyed exchange order-book liquidity below $74,000.
$BTC Liquidity levels to watch in close proximity are that ~$71K region below, and $73K-$74K above (local high). pic.twitter.com/BlKsaZXdpb
— Daan Crypto Trades (@DaanCrypto) April 10, 2026
Earlier, Cointelegraph reported on a copycat signal from Bitcoin’s relative strength index (RSI) that began to echo the end of the 2022 bear market.
This article is produced in accordance with Cointelegraph’s Editorial Policy and is intended for informational purposes only. It does not constitute investment advice or recommendations. All investments and trades carry risk; readers are encouraged to conduct independent research before making any decisions. Cointelegraph makes no guarantees regarding the accuracy or completeness of the information presented, including forward-looking statements, and will not be liable for any loss or damage arising from reliance on this content.


Binance offered its staff in the United Arab Emirates the option to temporarily relocate to Hong Kong, Tokyo, Kuala Lumpur and Bangkok amid regional tensions, the company told CoinDesk Friday.
“Given the recent regional tensions, we offered employees the option to temporarily relocate as a precautionary, employee-first measure to provide flexibility and support during a period of uncertainty,” a Binance spokesperson said. “As a remote-first organization, we are well set up to support this kind of flexibility without disruption to our operations.”
The spokesperson also said its operations in the UAE remain unchanged and that many employees have chosen to stay.
“Our operations in the UAE continue as normal — a large number of our team has chosen to remain in the UAE. We remain deeply committed to the UAE as a key hub for Binance and to the broader region,” the spokesperson said. “As a global company, we continue to operate seamlessly and serve our users without interruption.”
The offer of relocation comes after a ceasefire agreement, following roughly six weeks of escalating regional conflict that has disrupted business activity in the UAE. The country has intercepted hundreds of missiles and drones since hostilities began in late February, according to the UAE Ministry of Defense, with additional interceptions reported on April 8.
The Middle East conflict has already disrupted major crypto, business and sports events across the UAE. TOKEN2049 Dubai has been postponed to 2027, while TON Gateway was canceled due to security and travel concerns. Other large events, including Middle East Energy Dubai and the Dubai International Boat Show, have also been delayed, and the Bahrain and Saudi Arabian Formula 1 races, key for crypto sponsorship exposure, are set to be canceled.
In December, Abu Dhabi Global Market (ADGM) said Binance’s global platform would operate under its regulatory framework, marking a significant step in formalizing the exchange’s structure.
Binance, which reportedly has 1,000 staff members or 20% of its total global workforce in the UAE, has also indicated that its worldwide operations are supported from Abu Dhabi, though it has not clearly defined a single global headquarters.


Securitize announced integration with TRON Network to bring tokenized assets to one of the world’s largest blockchains, expanding its multichain presence.
Securitize integrated with TRON Network on April 10, enabling tokenized assets issued by Securitize to be deployed on TRON, one of the world’s largest blockchains. The partnership expands Securitize’s multichain footprint and brings institutional-grade assets to a high-performance network designed for efficient, programmable financial systems.
The integration aligns with growing demand for tokenization infrastructure that bridges traditional finance and blockchain networks. TRON operates as a high-throughput blockchain platform, and this partnership enables Securitize’s tokenized assets—which typically include securities and institutional products—to access TRON’s user base and ecosystem.
Sources: Securitize
This article was generated automatically by The Defiant’s AI news system from publicly available sources.

Bittensor token price has collapsed by 17% in less than 6 hours after one of the network’s most prominent subnet developers publicly torched its relationship with the ecosystem, and the price prediction is getting bearish. The governance bombshell driving this selloff raises a harder question than most traders are asking right now.
On Thursday, Covenant AI, the team behind the Covenant-72B model, widely credited as the largest decentralized LLM pre-training run in history, announced its exit from Bittensor.
— BSCN (@BSCNews) April 10, 2026
 LATEST: BITTENSOR DROPS 16% AS COVENANT AI EXITS THE NETWORK OVER CENTRALIZATION CONCERNS
Covenant AI (@covenant_ai) has exited Bittensor citing concerns over centralized control.
The team said governance is not truly decentralized in practice. It alleged key decisions remain… pic.twitter.com/QlA4AoMWbG
Founder Sam Dare stated that “the promise that drew builders, miners, validators, and investors into this ecosystem is a lie,” accusing co-founder Jacob Steeves of asserting centralized control over Covenant’s subnet after it grew too prominent to ignore.
Steeves has not publicly responded. The statement hit markets like a circuit breaker. TAO had surged 140% over six weeks, with 105% of those gains coming since March 8 alone, largely on the back of Covenant-72B’s success narrative and Grayscale’s filing for a TAO Trust. That entire credibility stack just developed a serious crack.
Discover: The best crypto to diversify your portfolio with
Bittensor Price Prediction: Can TAO Recover?
At current levels near $280, TAO sits in genuinely dangerous technical territory. $300 was the immediate support level, and the price is already trading below it, which means the level has effectively been lost.
On-chain data confirms the severity of the move, with TAO’s 24-hour decline registering among the steepest in the large-cap AI token sector. The April 9 rejection at $360 resistance preceded a bearish MACD crossover, with sellers already positioning before the news dropped.
Social dominance for TAO reached a one-year high in early April, yet retail sentiment shows only 1.5 positive comments per negative comment, suggesting conviction in the prior rally was thinner than price action implied.
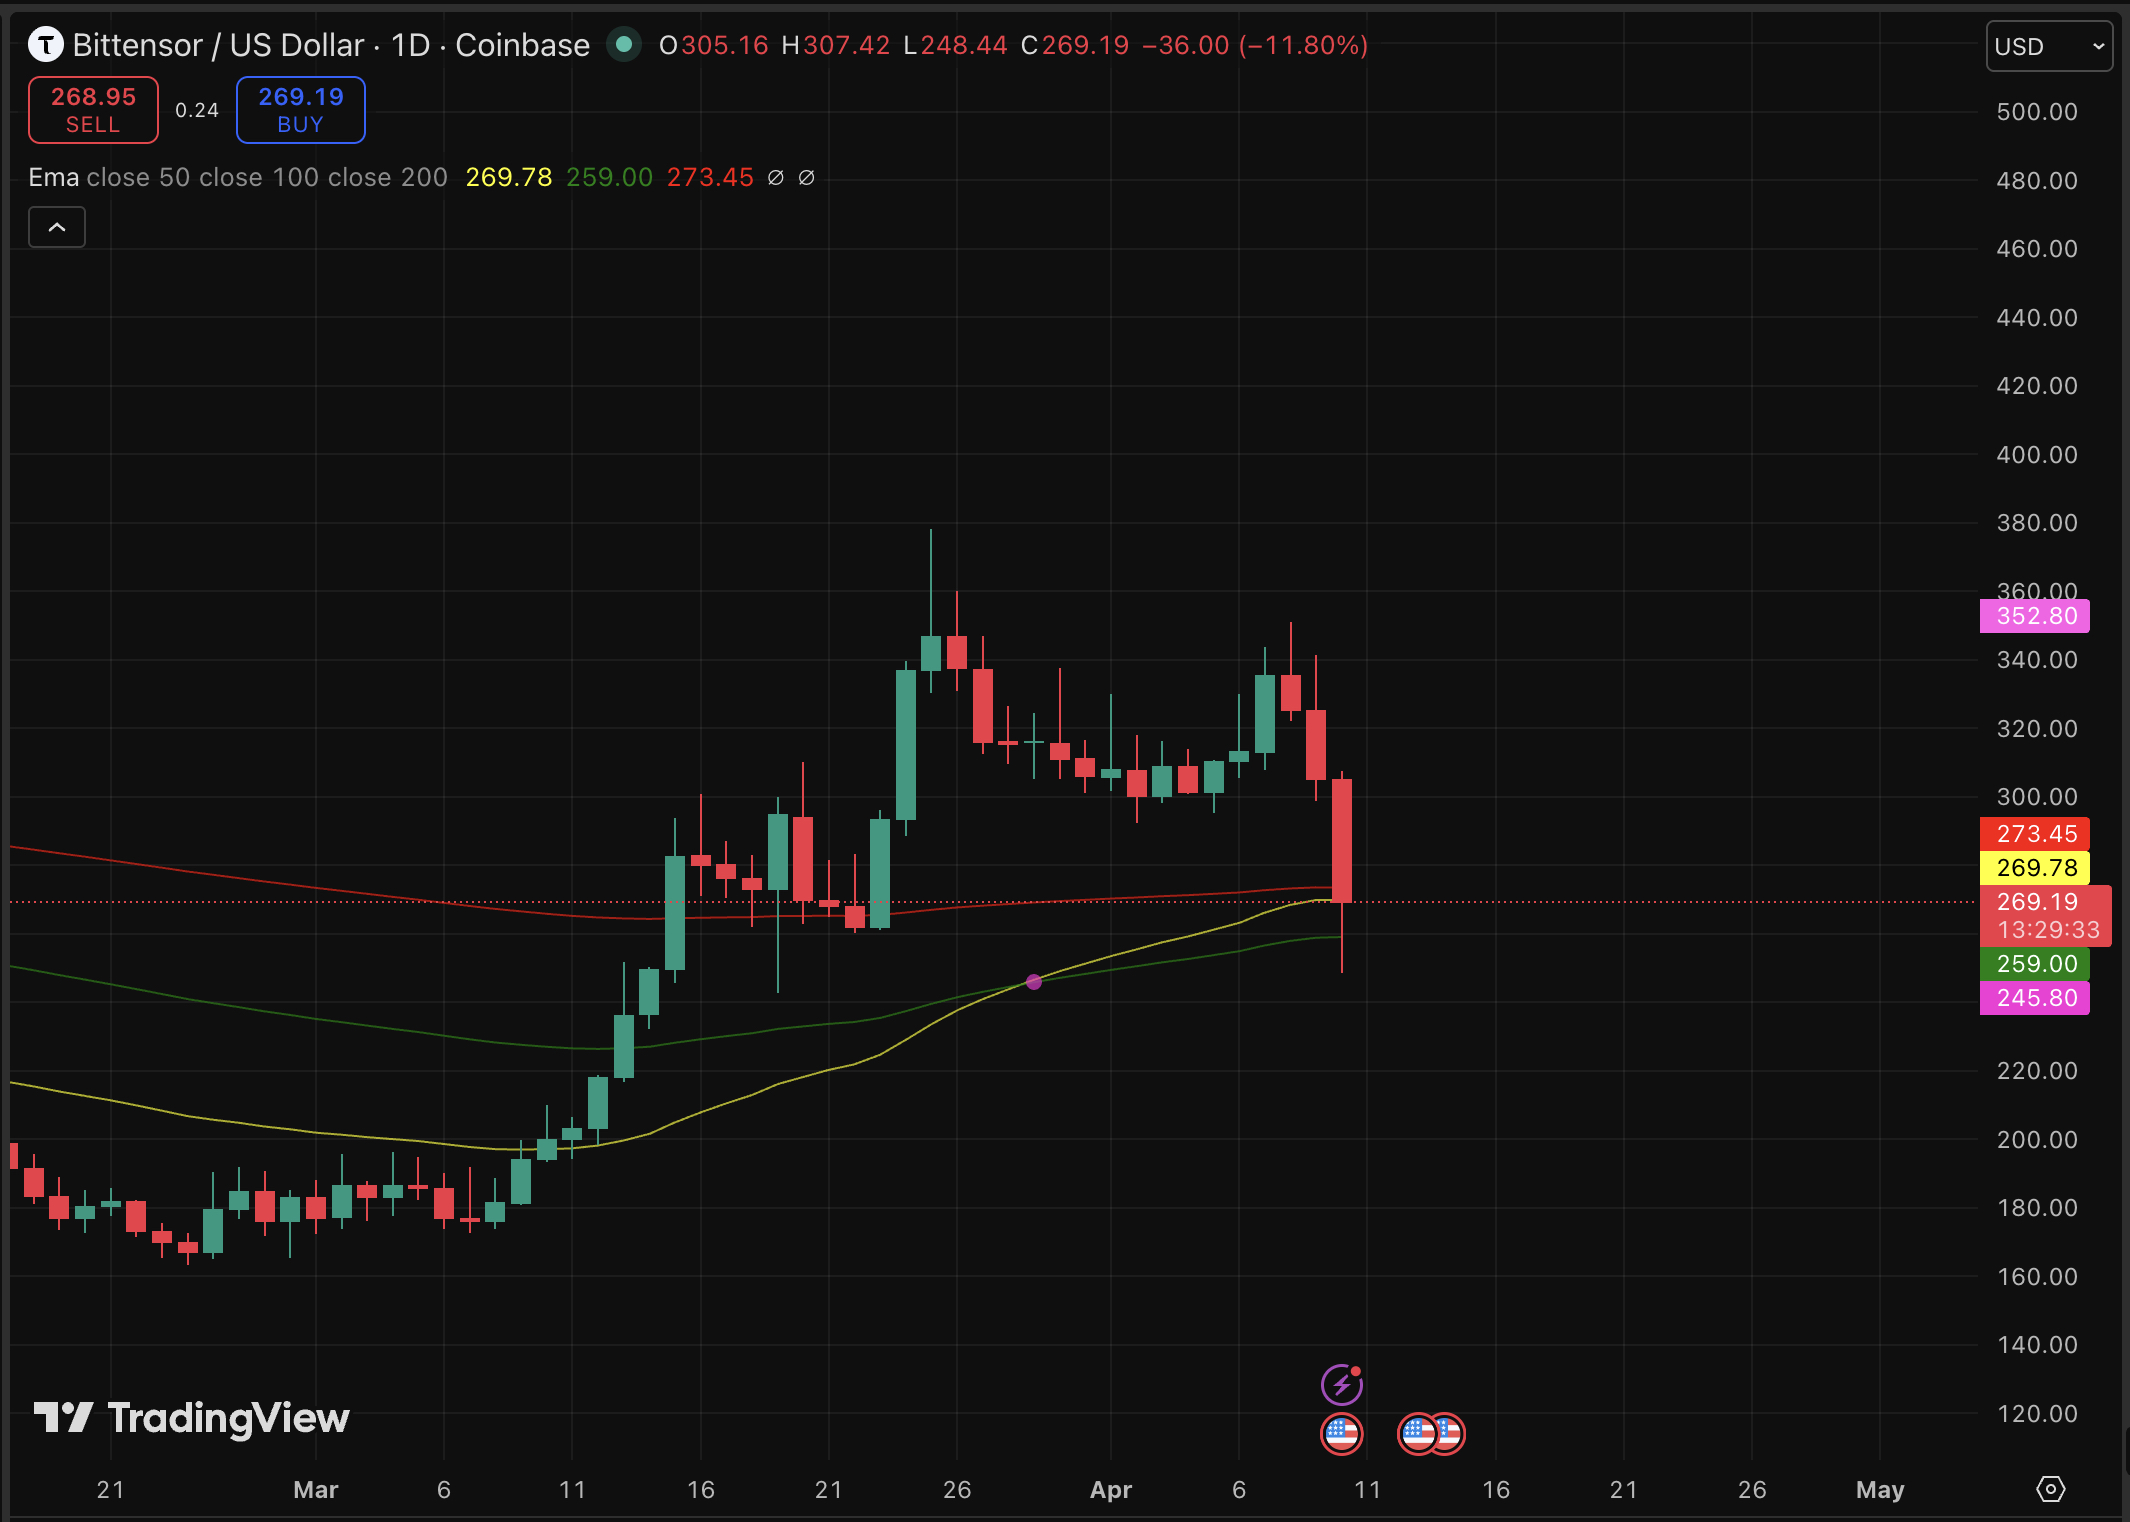
TAO needs to reclaim $300 within 48 hours on a credible response from Steeves or Bittensor’s governance structure for it to stage a recovery toward $320–$330. But continued silence from leadership and further subnet departures can accelerate selling pressure toward $250 or lower.
The parallel to other ecosystem selloffs triggered by major internal exits suggests recoveries can take weeks, not days. Watch the $300 level; this is the line.
Discover: The best pre-launch token sales
Bitcoin Hyper Draws Early Movers as TAO Tries to Recover
Governance risk just repriced TAO’s entire decentralization premium, and that’s the precise vulnerability traders with longer memory have warned about. When a network’s core value proposition gets called a lie by its most successful builder, rotating capital doesn’t wait for confirmation. It moves.
One destination attracting that rotated attention is Bitcoin Hyper ($HYPER), a Bitcoin Layer 2 project positioning itself as the first-ever BTC chain with Solana Virtual Machine (SVM) integration.
The pitch is structural: Bitcoin’s security and liquidity combined with sub-Solana-speed smart contract execution, breaking through BTC’s native limitations of slow transactions, high fees, and zero programmability. No governance triumvirate. No subnet politics.
The presale has raised $32 million at a current price of $0.0136, with staking available for early participants. The project’s Decentralized Canonical Bridge handles BTC transfers natively.
Research Bitcoin Hyper before the next price step triggers.
The post Bittensor Price Prediction: Covenant AI Exits TAO, Forcing 16% Drop appeared first on Cryptonews.


“I am happy to bet $1 billion USD,” Binance founder Changpeng Zhao (CZ) told OKX founder Star Xu, “that: I am officially divorced.”
That escalated quickly.
With one of the largest peer-to-peer bets ever publicly offered, the Binance-OKX feud went nuclear this week.
As if the bet wasn’t interesting enough on its face, according to Xu’s responses, gambling isn’t legal for United Arab Emirates residents, yet polygamy is.
For context, CZ worked at Xu’s crypto exchange, OKCoin, but left under contested circumstances before creating Binance. The two exchanges have been fierce competitors ever since, with periodic public spats over listings and various market practices.
CZ left OKCoin in early 2015 after Xu attempted to renegotiate his equity stake. OKCoin’s 2015 Reddit statement accused CZ of contributing no code, running his own trading bots on company systems, and mounting a campaign of “lies and desperate nonsense” after his departure.
CZ’s memoir characterizes his departure more vaguely, as a clash of vision.
Anyway, what happened that escalated their disagreement to $1 billion?
CZ’s memoir airs years of dirty laundry
When CZ published his book Freedom of Money on April 8, Xu called him a “habitual liar.” Among many accusations, Xu claimed CZ lied about his marital status.
CZ doubled-down, calling Xu’s bet and pushing in $1 billion in chips.
Xu also claimed CZ published falsehoods about his career at OKCoin, his contract dispute with Roger Ver, his alleged manipulation of crypto markets, and whether he was a government informant against Justin Sun.
Fed up, CZ demanded of Xu, “You can apologize now.” He offered “$1 billion USD (or any number you choose),” giving Xu 24 hours to accept.
A refusal, according to CZ’s characterization, would “clearly show who has been mis-representing to the public.”
Xu declined, citing not only the illegality of gambling in his country of residence, but also his professional obligations.
“As the ultimate beneficial owner of a regulated company, publicly offering a $1 billion bet is hardly professional conduct,” he said.
Yi He backs up CZ
Xu demanded details about the largest source of CZ’s personal wealth. “Has your Binance stake been legally separated with your ex-wife or not?”
Yi He, the mother of CZ’s children and obviously implicated in the debate, didn’t stay quiet on social media. In 2014, after meeting CZ at a blockchain event, Yi helped CZ join OKCoin as chief technology officer.
Soon, they were romantically involved.
Yesterday, she promoted a Binance on-chain prediction market asking users to wager on whether Xu would publicly apologize to CZ.
She taunted Xu to engage.
CZ claimed Star Xu got Leon Li arrested
The memoir’s most explosive new allegation concerns Huobi (now HTX) founder Leon Li.
In his book, CZ wrote that Xu (using Star Xu’s real name, Mingxing) reported Li to Chinese police, leading to Li’s November 2020 detention.
Xu called that claim “purely false information.”
The disagreement is yet another example of the CZ versus Xu battle.
Contested details of an OKCoin agreement
This week, Xu resurfaced a 2015 video showing an OKCoin accountant’s QQ account, allegedly accessed in the presence of a notary.
Within that QQ account, a video shows CZ apparently sending two versions of a Bitcoin.com domain agreement. The video shows Version 7 first, then a modified Version 8 with a six-month termination clause absent from Version 7.
CZ had previously attributed the chat records to an unauthorized account intrusion.
“Do you believe such an explanation?” Xu asked rhetorically.
Roger Ver sued OKCoin’s Hong Kong entity for approximately $570,000 over the contract dispute.
In other words, CZ and Xu are essentially arguing this week about that contract via a decade-old QQ video.
Read more: CZ cries FUD as anti-Binance posts flood X
More feuds
Xu had spent months previewing his arguments in public before CZ’s book arrived.
Following the 2025 flash crash, Xu blamed Binance for the de-peg of Ethena’s USDE stablecoin.
“October 10 was caused by irresponsible marketing campaigns by certain companies,” Xu wrote. “No complexity. No accident.”
He also accused Binance of repeatedly launching what he called Ponzi-like schemes and using influencer campaigns to suppress dissent.
CZ said he’d “try not to comment on this topic further” and retweeted rebuttals from allies.
In 2023, CZ pleaded guilty to failing to maintain effective anti-money laundering programs, paid a $50 million criminal fine, and watched the company he founded pay over $4.3 billion in penalties.
After serving a four-month prison sentence, he received a presidential pardon from Donald Trump last year.
Got a tip? Send us an email securely via Protos Leaks. For more informed news, follow us on X, Bluesky, and Google News, or subscribe to our YouTube channel.
Decentralized finance (DeFi) platform World Liberty Financial said Friday it plans to put forward next week a governance proposal that would set a phased unlock schedule for WLFI tokens held by early retail purchasers.
The Trump family-linked DeFi platform said the proposal will be opened for community input before proceeding to a formal vote. According to the project, the vote will not cover a full, immediate unlock, but instead a structured, long-term vesting plan designed to release tokens in stages.
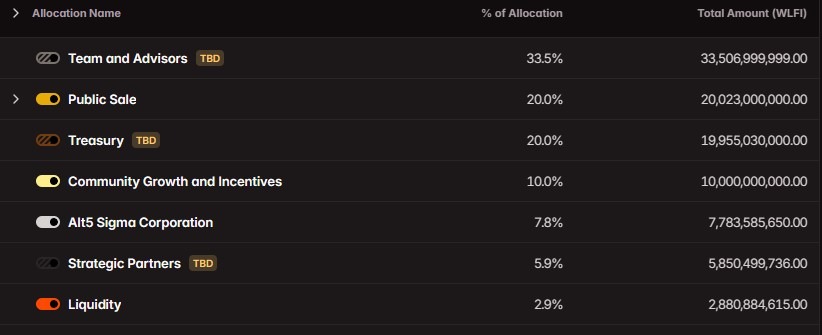
WLFI tokens remain largely locked for early buyers, with transferability tied to governance-approved unlocks. Tokenomist data shows that about 24.67% of WLFI’s 100 billion token supply has been released, while roughly 75.33% remains locked or pending future unlock decisions.
The proposal could determine when early buyers can finally access liquidity in WLFI, whose use is largely limited to governance. It comes as some holders publicly push back against the prolonged lockups and threaten legal action.
The concerns add to earlier governance decisions around token restrictions. On March 16, WLFI token holders approved a proposal introducing a six-month lock-up rule for certain transfers, marking one of the first formal changes to the project’s transferability framework.

Retail buyers challenge prolonged WLFI lockups
World Liberty’s early sale materials said WLFI tokens were non-transferable and could remain locked indefinitely, with any future unlock subject to a governance vote no earlier than 12 months after the token sale and with no guaranteed timeline.
That 12-month threshold has already passed, with WLFI’s public sale beginning around mid-October 2024, placing the current proposal roughly 18 months after the initial sale. The company raised at least $550 million from WLFI token sales across two funding rounds.
Some self-identified WLFI presale buyers have publicly complained that most of their holdings remain locked, even as parts of the broader token supply have become transferable.
At least one self-identified buyer said they had filed legal notices and were pursuing claims in the United States and the Netherlands against World Liberty Financial and its backers. Cointelegraph could not independently verify that any lawsuit had been filed.
Cointelegraph reached out to World Liberty Financial for comments, but had not received a response by publication.
Related: WLFI proposes governance staking system and USD1 usage incentives
Onchain borrowing activity adds to holder concerns
One community member said in an X post that the project’s borrowing activity raised concerns among token holders, questioning how treasury funds were being used. Onchain data shows that World Liberty Financial’s treasury borrowed roughly $75 million in stablecoins from Dolomite using WLFI as collateral.
Magazine: Should users be allowed to bet on war and death in prediction markets?

Tigers outfielder Parker Meadows carted off after collision with teammate

$60,000 Buys a Hidden Punch-Out Prototype That Now Belongs to Everyone
Willie Mullins horse dies at Aintree after catastrophic injury while winning race


![[KLPGA 2026] iM Financial Group Open 2026 / Round 2 (ENG Commentary)](https://wordupnews.com/wp-content/uploads/2026/04/1775832050_maxresdefault-80x80.jpg)

-

 Fashion7 days ago
Weekend Open Thread: Spanx – Corporette.com
-

 Business5 days ago
Three Gulf funds agree to back Paramount’s $81 billion takeover of Warner, WSJ reports
-

 Sports6 days ago
India men’s 4x400m and mixed 4x100m relay teams register big progress | Other Sports News
-

 Business6 days ago
Expert Picks for Every Need
-

 Tech3 days ago
How Long Can You Drive With Expired Registration? What Florida Law Says
-

 Business5 days ago
No Jackpot Winner, Prize to Climb to $231 Million
-

 Fashion4 days ago
Massimo Dutti Offers Inspiration for Your Summer Mood Board
-

 Fashion3 days ago
Let’s Discuss: DEI in 2026
-

 Crypto World2 days ago
Bitcoin recovers as US and Iran Agree a Ceasefire Deal
-

 Business6 days ago
Akebia Therapeutics, Inc. (AKBA) Discusses Pipeline Progress and Strategic Focus on Kidney Disease Treatments at R&D Day – Slideshow
-

 Crypto World1 day ago
Canary Capital Files SEC Registration for PEPE ETF
-

 Politics6 days ago
The UK should not pay a penny in slavery reparations
-

 Tech4 days ago
Samsung just gave up on its own Messages app
-

 Tech4 days ago
Haier is betting big that your next TV purchase will be one of these
-

 Tech7 days ago
Flat tire? Dead battery? Speedy’s serves stranded Seattle riders as a quicker e-bike picker-upper
-

 Fashion7 days ago
Weekly News Update, 4.3.26 – Corporette.com
-
Sports7 days ago
A Kevin O’Connell Theory Can Now Be Retired
-

 NewsBeat7 days ago
Kemi Badenoch talks ‘spring cleaning’ Reform defections
-

 Tech4 days ago
Gamer Restores the Original PlayStation Portal From Two Decades Ago
-

 Tech4 days ago
The Xiaomi 17 Ultra has some impressive add-ons that make snapping photos really fun
You must be logged in to post a comment Login