
Crypto World
Gold Reaches Critical Zone as Decade-Long Bull Run Shows Historical Peak Signals

TLDR:
- Gold’s 427% rally since 2016 enters the same zone where previous decade-long super runs peaked in 1980 and 2011.
- Historical pattern shows gold consolidates for years after peaks while capital rotates into stocks for extended rallies.
- Cryptocurrency now provides institutional alternative for capital rotation that didn’t exist during previous gold cycles.
- Combination of cooling inflation, rising real rates, and Fed tightening typically signals end of gold super runs.
Gold has reached a price level that historically marks the end of major bull runs. The precious metal recently hit a cycle high near $5,600, reflecting a 427% gain since 2016.
Market analysts now compare current conditions to previous decade-long rallies that ended in 1980 and 2011. The pattern suggests a potential rotation of capital into other asset classes.
However, this cycle introduces a new variable with crypto markets now positioned as institutional investments.
Historical Super Runs Follow Consistent Decade Pattern
Gold moves in extended bull markets that typically last nine to ten years. The 1970 to 1980 rally delivered returns of 2,403% before peaking.
Another super run from 2001 to 2011 generated 655% gains. The current 2016 to 2026 cycle has produced 427% returns so far.
These prolonged trends don’t continue indefinitely, according to market data. Instead, gold runs hard for approximately a decade before entering extended consolidation periods.
After reaching peaks, the metal often trades sideways or declines for years. The pattern has repeated across different economic environments and policy regimes.
Bull Theory noted on social media that gold just entered the same zone where every major bull run historically ended. The observation points to technical and fundamental factors aligning with previous market tops.
Yet a new high alone doesn’t confirm a peak has formed. The current position simply indicates the rally is no longer in early stages.
Several factors typically combine to end gold super runs. Inflation cooling and real rates moving higher create headwinds for the metal.
Federal Reserve tightening policies reduce speculative demand. Dollar stabilization removes currency-driven buying pressure. Risk appetite returning to markets pulls capital toward growth assets.
Crypto Emerges as New Rotation Destination
Previous gold peaks in 1980 and 2011 triggered capital flows into equities. After the 1980 top, stocks entered a two-decade bull market.
The 2011 peak preceded another extended equity rally through the 2010s. Gold cooled while stock markets absorbed investment capital seeking returns.
The current cycle presents a different landscape compared to earlier periods. Cryptocurrency markets have matured into institutional asset classes with regulated exchange-traded funds.
Public companies now hold Bitcoin on balance sheets. The investor base has expanded beyond retail traders to include pension funds and corporate treasuries.
This development changes the traditional rotation pattern that followed gold peaks. Capital flowing out of precious metals now has multiple destinations.
Instead of moving solely into stocks, funds can allocate to Bitcoin and digital assets. Crypto represents the risk-on component that didn’t exist in previous cycles.
The potential shift could reshape how bull markets unfold across asset classes. If gold enters a consolidation phase similar to past patterns, both stocks and crypto may benefit.
Bitcoin’s role as a high-beta growth asset positions it to capture speculative capital. The combination of established equities and emerging digital markets creates broader opportunities for portfolio allocation.


Major altcoins plunge, with ETH, SOL, and XRP dropping 5%.
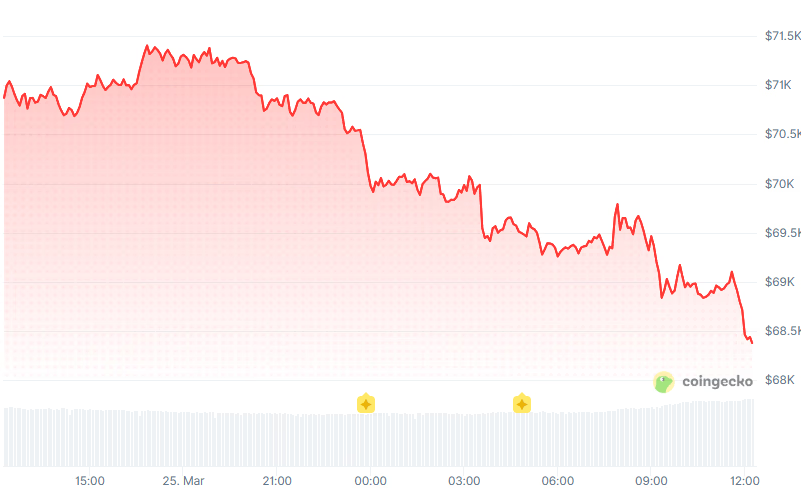
Crypto markets sold off sharply on Thursday as oil surged back above $93 per barrel after U.S.-Iran peace talks stalled, dragging risk assets lower across the board.
Bitcoin (BTC) is trading at around $68,400, down 3.5% over the past 24 hours. ETH and SOL slipped 5% to $2,050 and $87, respectively. Meanwhile, Ripple (XRP) dropped 4.5%.

Total crypto market capitalization decreased 3.2% to $2.43 trillion, according to Coingecko.
ETF Flows
Spot Bitcoin ETFs posted net inflows of $7.8 million on Wednesday, with Fidelity’s FBTC leading the charge with $83 million. However, that was mostly offset by $70 million in outflows from BlackRock’s IBIT, according to SoSoValue.
Ethereum ETFs continued to underperform, recording net outflows of $8 million, led by BlackRock’s ETHA, with $33 million in withdrawals.
Big Movers
All of the Top 100 digital assets posted gains over the last 24 hours.
SIREN and MemeCore (M) are today’s biggest losers, plunging 30% and 13%, respectively.
Around 97,000 leveraged traders were liquidated for $305 million in the past 24 hours, according to CoinGlass. Bitcoin accounted for $93 million, while ETH made up $104 million.
Looking ahead, two catalysts loom on Friday: the PCE inflation report and the expiration of Trump’s five-day window for diplomacy with Iran.
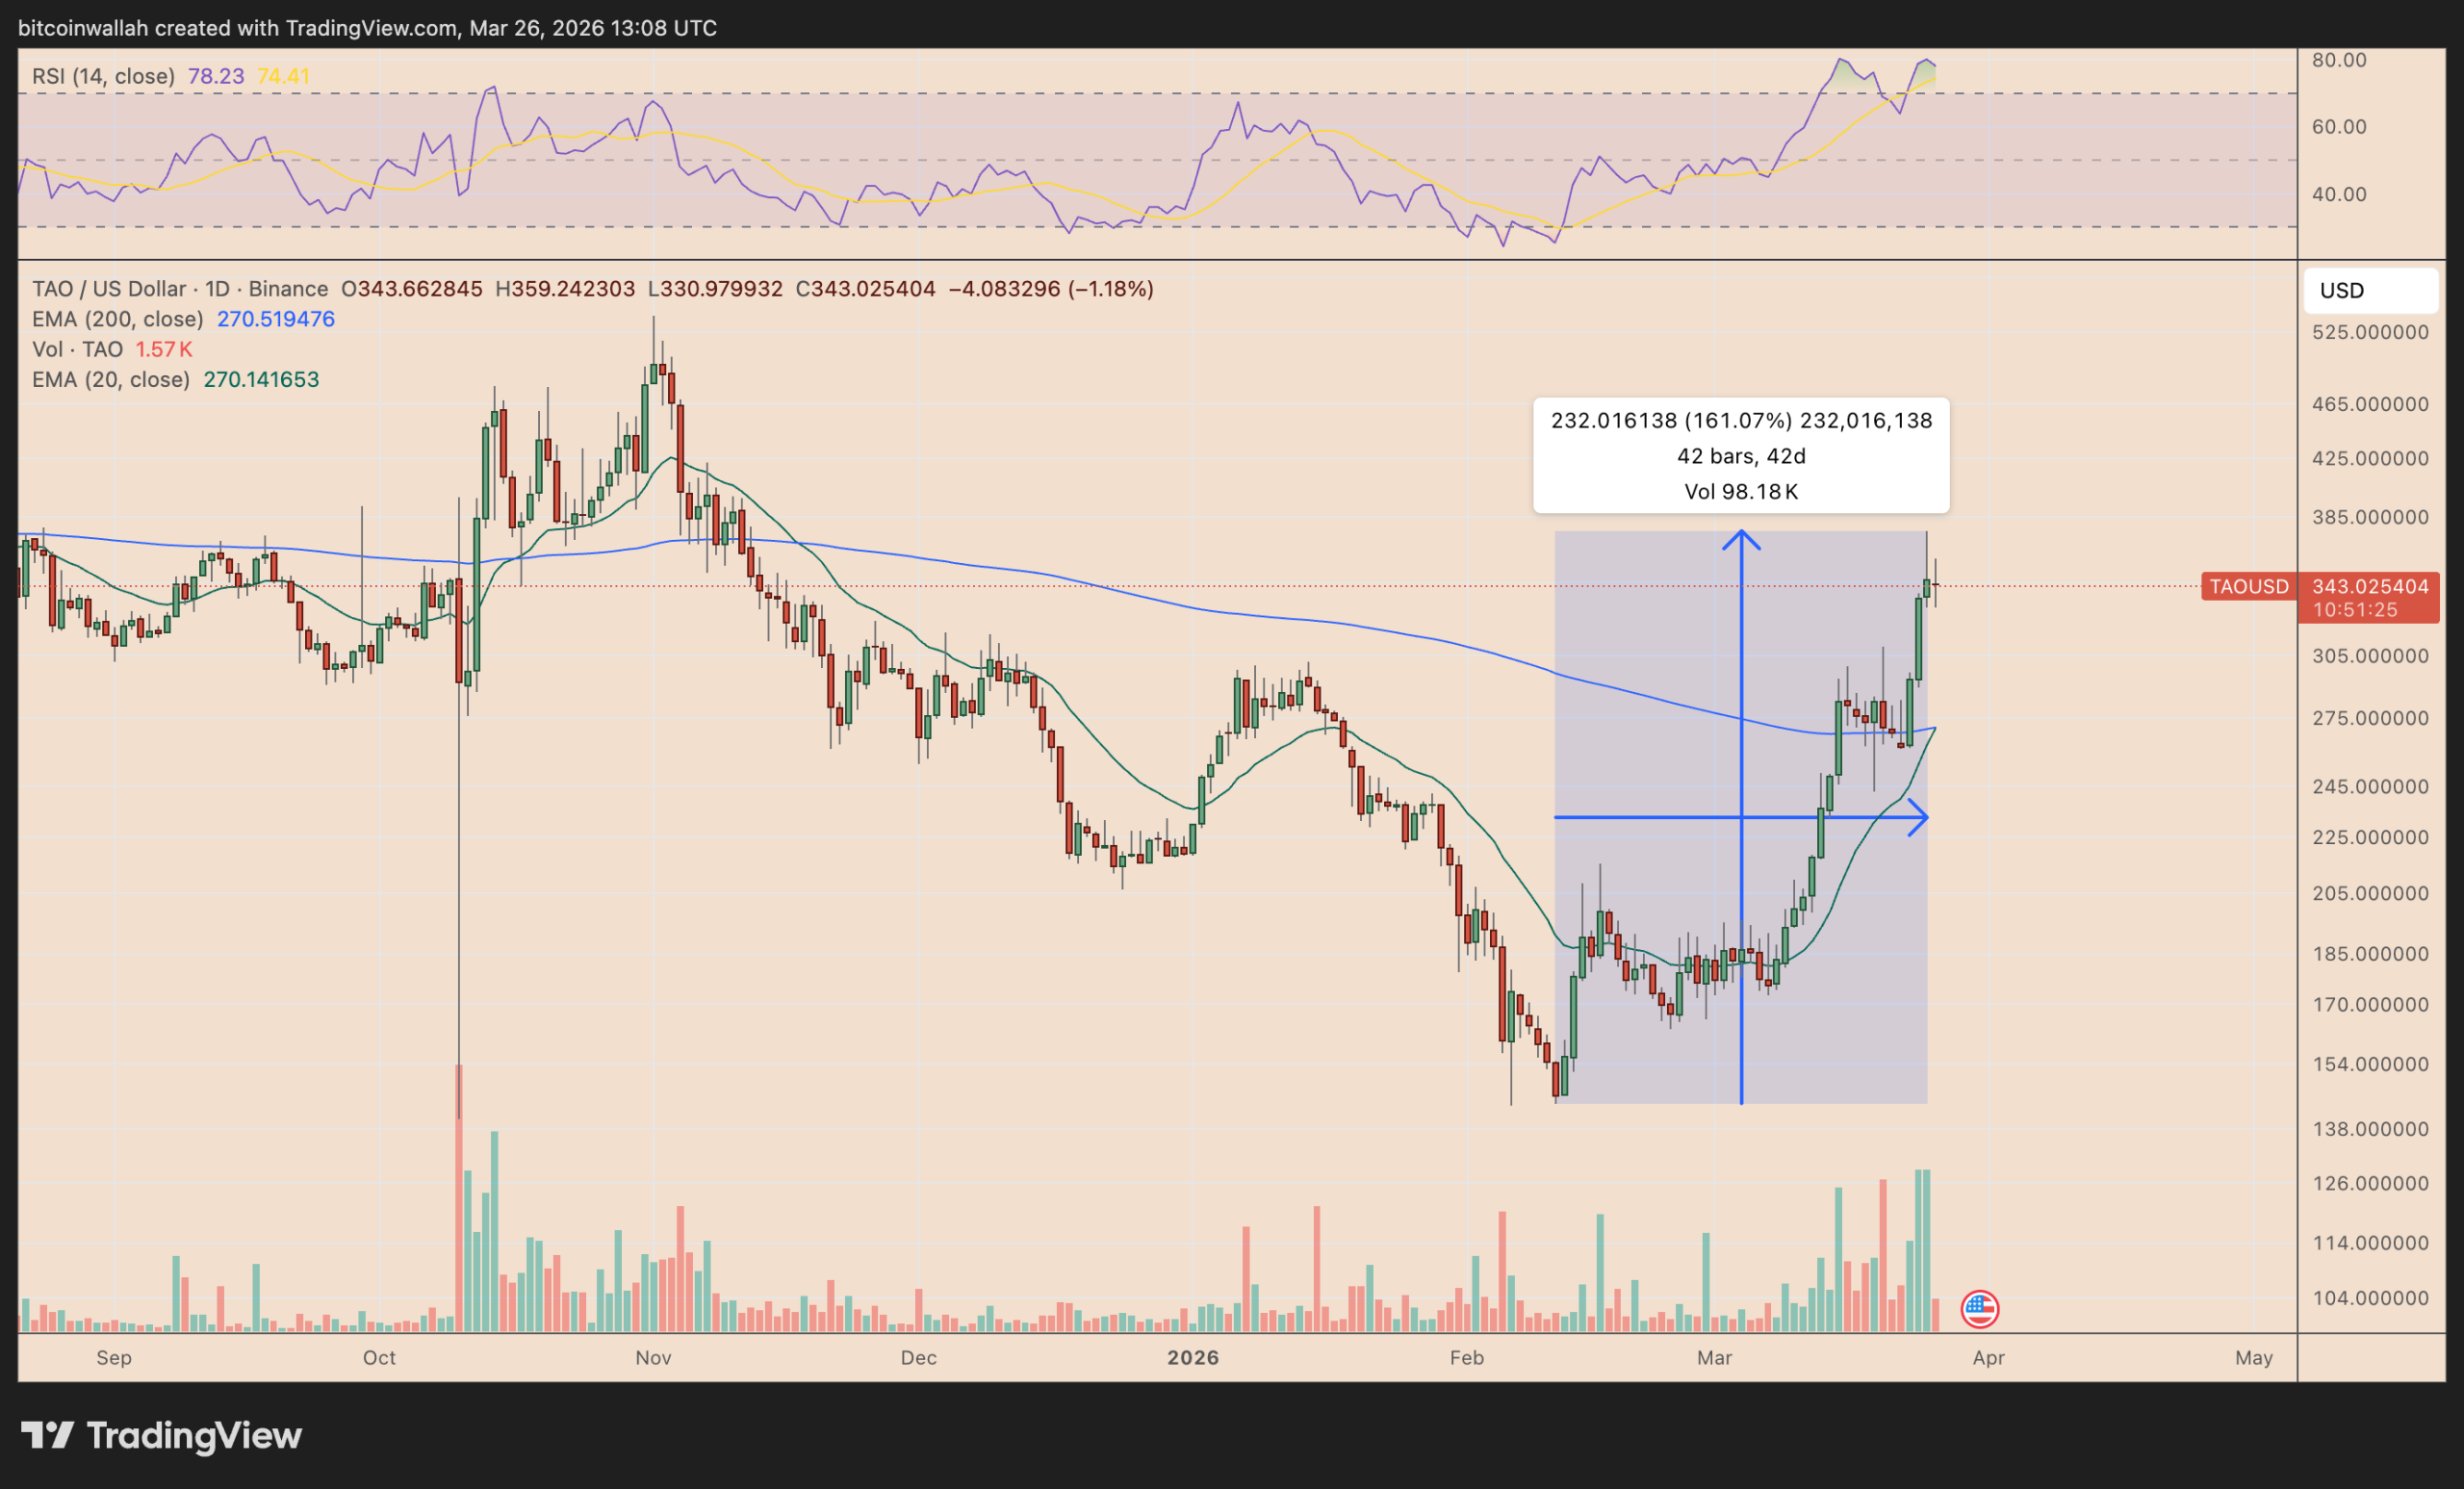
The latest 160% rally in Bittensor (TAO) shows signs of exhaustion as it forms a golden-cross pattern on the chart that previously preceded steep corrections.

Key takeaways:
-
TAO prints a golden cross that has preceded 40% drawdown on average in the past.
-
Social volume for Bittensor is high, but retail euphoria remains muted.
TAO price risks 40% drawdown in the coming weeks
As of Thursday, March 26, TAO’s 20-day exponential moving average (20-day EMA, the green line) was crossing above its 200-day exponential moving average (200-day EMA, the blue wave).
Traders typically view a short-term average moving above a long-term one as a bullish signal. In TAO’s case, however, the pattern has often appeared near local tops, sometimes triggering brief upside follow-through before reversing sharply.

In the last three similar crossovers, TAO dropped by roughly 38.50%, 32.50%, and 45.50% within five-six weeks. That amounts to an average drawdown of about 40%, raising Bittensor’s odds of falling to $200 by early May if the pattern repeats.
TAO’s downside risk is rising further as its relative strength index (RSI) has stayed above the 70 overbought threshold for weeks. The reading suggests the recent rally may have gone too far, too fast, raising the risk of profit-taking or a short-term cooldown.
Broader macro conditions add to the bearish case, as the escalating US–Iran war lifts oil prices, fuels inflation risks, and weakens the case for near-term Federal Reserve easing.
TAO rally still lacks euphoric retail sentiment
TAO’s rally has triggered a sharp increase in online discussion without the kind of euphoric sentiment that typically marks local tops, according to data resource Santiment.
Social volume across X, Reddit, Telegram, and other platforms has climbed to its second-highest level in six months, trailing only the frenzy seen near TAO’s $529 peak in November.

At the same time, sentiment remains relatively subdued, with only 1.5 positive comments for every negative one.
“This is generally a good sign that the rally can continue, with little interference from greedy traders that typically signal forming tops,” Santiment said.
Related: AI and stablecoins are winning despite 2026 crypto market slump
Still, TAO’s golden cross fractal suggests that even rallies driven by improving sentiment can turn into bull traps.
In the last three similar golden-cross setups, TAO still rallied by roughly 15.6%, 5.7%, and 42.6% before reversing lower.

That puts the average post-cross upside at around 21.30%, hinting at a short-term Bittensor price rally toward $420 or higher before exhaustion sets in.
This article does not contain investment advice or recommendations. Every investment and trading move involves risk, and readers should conduct their own research when making a decision. While we strive to provide accurate and timely information, Cointelegraph does not guarantee the accuracy, completeness, or reliability of any information in this article. This article may contain forward-looking statements that are subject to risks and uncertainties. Cointelegraph will not be liable for any loss or damage arising from your reliance on this information.

Key Takeaways
- James Quincey is departing as Coca-Cola CEO on March 31, identifying artificial intelligence’s emergence as a central reason for his exit.
- COO Henrique Braun will assume the CEO position, with Quincey believing he’s the right leader for the company’s future direction.
- Doug McMillon, who recently left Walmart’s CEO role, referenced AI similarly when explaining his December departure.
- Quincey emphasized the company requires “someone with the energy to pursue a completely new transformation of the enterprise.”
- These exits signal a growing pattern of departing executives recognizing AI as a pivotal moment requiring new leadership approaches.
James Quincey has revealed his departure as Coca-Cola’s chief executive at the close of March, identifying artificial intelligence’s accelerating development as a significant influence on his choice. The executive, who assumed leadership in 2017, shared with CNBC’s Squawk Box on Thursday that the moment had arrived to transfer authority to a leader better positioned for the organization’s future.
“My job is also to think who’s the best team to put on the field to get the next wave done,” he said. “And I concluded that, actually, it was time to put someone else on the field for the next wave of growth.”
According to Quincey, the beverage corporation achieved substantial advancement in what he described as a “pre-AI, pre-gen-AI mode,” though a fundamental transformation is now beginning. He expressed his view that the organization requires fresh leadership energy to drive what he characterized as a “completely new transformation of the enterprise.”
Henrique Braun, currently serving as COO, will assume the CEO position effective March 31. Quincey will continue his association with the corporation in the capacity of executive chairman.
This leadership transition isn’t happening in isolation. Walmart‘s former chief executive Doug McMillon offered comparable reasoning in December before his own exit. McMillon concluded his tenure exceeding ten years at the retail giant’s helm, transferring leadership to John Furner on February 1.
“With what’s happening with AI, I could start this next big set of transformations with AI, but I couldn’t finish,” McMillon told CNBC at the time.
McMillon revealed that approximately twelve months prior, he started recognizing the potential of “agentic commerce” alongside the expanded possibilities for AI-integrated retail experiences. This understanding convinced him the moment was appropriate for a leadership change.
Parallel Reasoning From Two Industry Leaders
Quincey and McMillon articulated remarkably similar rationale: the upcoming transformation phase demands a leader capable of executing the vision completely. Neither executive indicated forced departure. Both characterized their decisions as strategic positioning of appropriate leadership for the current business environment.
The retail giant has already integrated artificial intelligence throughout its business operations, spanning logistics optimization to consumer-facing applications. The organization additionally transitioned to Nasdaq listing in December, which McMillon positioned as representing the company’s technological transformation.
Coca-Cola has pursued its own artificial intelligence initiatives, though Quincey maintained discretion regarding detailed future strategies under Braun’s leadership.
Coca-Cola’s Path Forward Under New Leadership
The transition to Braun becomes official on March 31. His promotion from the chief operating officer position follows internal recognition as the logical choice to guide the company’s subsequent growth phase.
Quincey’s leadership extended nearly nine years and featured substantial investment in digital capabilities and data-centric business operations. His transition to executive chairman maintains his involvement with the organization while providing Braun autonomy to establish fresh strategic priorities.
KO shares declined modestly during trading, hovering around $68.32.

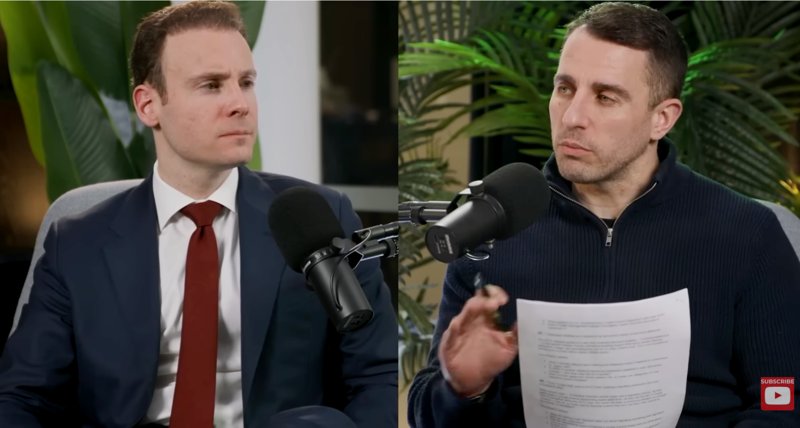
Michael Selig, chair of the US Commodity Futures Trading Commission, said blockchain could play a key role in verifying AI-generated content, contending the technology can help distinguish authentic media from synthetic outputs as concerns over misinformation grow.
During an appearance on The Pomp Podcast on Thursday, Selig was asked by host Anthony Pompliano about the use of AI-generated memes and images in markets, and whether intent matters or such content should be restricted altogether. He told Pompliano:
The private markets have solutions — blockchain technology is a great one. If you can timestamp things and make sure there’s an identifier for each meme or AI generated posts, you can verify if it’s real or generated by AI… Having these technologies here in the US is critical.
He said regulators are focused on maintaining US leadership in crypto, adding that “you can’t have AI without blockchain.”

Regarding how regulators are approaching AI agents, as autonomous trading becomes more prevalent in financial markets and authorities are being pressed to distinguish between automated tools and fully autonomous agents, and how the latter should be regulated, Selig responded:
I’m concerned that we over-regulate and strangle some of the technology here in the US… I’m taking a very much minimum effective dose of regulation approach, where we’re… making sure that we’re regulating the actors… and not the software developers. The software developers are the ones building the tools, but they’re not actually engaging in the financial transactions.
Selig said the CFTC is assessing how AI models are used in markets, emphasizing that enforcement should focus on participants engaging in financial activity.
Related: AI and stablecoins are winning despite 2026 crypto market slump
Blockchain and proof-of-personhood tools emerge for AI verification
A central challenge amid the surge in artificial intelligence use is distinguishing real content from synthetic media. Selig’s comments could be seen to reflect a broader push among policymakers and developers to use blockchain for content verification and provenance.
One approach is proof-of-personhood systems, which aim to confirm that an account belongs to a real, unique human rather than a bot. The most prominent example is Sam Altman’s World, whose World ID protocol allows users to prove their humanity without revealing personal data. The system uses encrypted biometric iris scans stored on the user’s device, though it has drawn criticism over privacy risks and potential coercion.
In March, World launched AgentKit, a toolkit that allows AI agents to prove they are linked to a verified human while interacting with online services. It integrates proof-of-personhood credentials with the x402 micropayments protocol developed by Coinbase and Cloudflare, enabling agents to pay for access while presenting cryptographic proof of human backing.
Ethereum co-founder Vitalik Buterin has proposed using cryptography and blockchain to make online systems more verifiable, including through zero-knowledge proofs and onchain timestamps that could help validate how content is generated and distributed without exposing sensitive data.
The proposals come as US policymakers weigh broader AI regulation. On March 20, the Trump administration released a national framework calling for a unified federal approach, warning that a patchwork of state laws could hinder innovation and competitiveness.
Magazine: Agent wastes 14 hours of scammers’ time, LLMs ‘poisoned’ by Iran: AI Eye
Crypto World
Wall Street wants the tech but not the transparency. DRW’s Don Wilson says open ledgers are a dealbreaker for banks


Wall Street firms may embrace blockchain technology, just not in its current form. The open, distributed ledger visible to all comers runs counter to the way traditional finance works, said Don Wilson, the founder and CEO of DRW, a TradFi trading firm that’s been active in crypto for over a decade.
“There is no world in which institutions are going to say, ‘Oh yeah, just publish all of my trades onchain,’” Wilson said at the Digital Asset Summit in New York on Thursday. “Any money manager would view it as a failure of fiduciary duty to publish to the world every trade that they’re doing.”
Having every trade visible conflicts with how institutions manage risk and protect trading strategies, Wilson said. If an investor with a large stake in a company starts selling the stock, other market participants will be able to detect the pattern and the initial trades will have a “huge price impact” on the investor’s later trades. In other words, the transparency works against the trader.
“The problem is not the technology itself, but how it is implemented,” Wilson said. “I think that it’s a mistake to put stuff on these chains that have complete transparency.”
DRW was founded in 1992 and introduced Cumberland in 2014, one of the first institutional crypto trading desks, just as bitcoin markets began to take shape. That early entry gave the firm a front-row seat to how digital assets evolved from niche markets into infrastructure that banks now study.
Wilson’s current focus reflects that shift. He pointed to efforts to bring traditional assets onchain, and warned against doing so on fully transparent networks.
Ethereum has long been pitched as the blockchain most likely to plug into Wall Street, with developers highlighting its large decentralized finance (DeFi) ecosystem and role in early tokenization efforts.
But, like Bitcoin, all transactions are visible, and large banks have taken a different path. Many have spent years building or backing private, permissioned networks, arguing that financial institutions need tighter control over data, access and compliance. Firms like JPMorgan, the largest U.S. bank by assets, have developed in-house systems, while others have supported platforms designed to limit who can see and validate transactions.
Wilson argued for systems that limit visibility. “Privacy is kind of at the top of the list,” he said, describing the features needed for institutional adoption. He also cited market structure issues like front-running. “That ability for people to reorder transactions … that’s just not suitable for financial markets.”
His comments come as tokenization gains traction across the industry. Banks and asset managers are testing ways to move stocks, bonds and other assets onto blockchain-based systems. Wilson agrees the opportunity is large, especially for major asset classes. But he expects the design to look different from today’s public chains.
“I think it’s obvious that that will not happen,” he said, referring to the idea that institutions will adopt fully transparent systems. “Everybody thinks I’m crazy … so I don’t know. Maybe I’m wrong. We’ll see.”

Brazil’s lawmakers have equipped public security agencies with a new instrument in the fight against organized crime: the ability to repurpose confiscated cryptocurrency to fund policing efforts. Law No. 15.358, approved by the National Congress and published this week, creates a legal framework that treats digital assets as instruments of crime that can be seized, restricted from exchanges, and redirected to support police operations.
The measure extends a police toolkit beyond traditional cash and property, allowing authorities to forfeit crypto assets tied to criminal activity and, with judicial authorization, deploy those assets for police reequipment, training, and special operations. The law signals a coordinated approach to asset recovery that could involve cross-border cooperation with international authorities, reflecting Brazil’s aim to address crypto-enabled crime on a global scale.
Key takeaways
- Crypto assets tied to criminal activity can be treated as crime instruments, enabling forfeiture and prohibiting related transactions on exchanges.
- Confiscated assets can be used provisionally for police equipment, training, and special operations, subject to judicial oversight.
- The law enables Brazil to cooperate with international authorities on investigations and asset recovery, including cases involving digital assets.
- Observers note the potential implications for public finances, given Brazil’s large population and widespread use of crypto among its citizens.
- Parallel policy debates in Brazil include discussions about a national Bitcoin reserve, with proposals that have reemerged in recent years.
What the law changes for enforcement and asset recovery
According to a translation of Law No. 15.358, the forfeiture framework treats any asset used to commit a crime as an instrument of the crime, even if it was not designed exclusively for illicit purposes. The law clarifies that forfeited assets and valuables may be used provisionally by public security agencies to bolster police capabilities, subject to authorization from the judge supervising the sentence’s execution. This creates a clearer path for authorities to liquidate or reallocate crypto assets recovered in criminal cases to fund policing priorities.
The forfeited assets and valuables may be used provisionally by public security agencies for police re-equipment, training, and special operations, subject to authorization from the judge overseeing the execution of the sentence.
Beyond domestic enforcement, the legislation contemplates closer coordination with international partners for investigation and asset recovery. Brazil’s authorities argue that cross-border cooperation will be essential to dismantle crypto-enabled crime networks that span multiple jurisdictions. With a population exceeding 213 million and a growing footprint of crypto activity, observers say the law could have material implications for how the state finances its security apparatus and how offenders face consequences that extend to digital assets.
The move also arrives amid ongoing public-policy debates about crypto and taxation. Reports have indicated that Brazil’s Finance Minister, Dario Durigan, signaled a plan to delay talks on crypto tax reform to avoid deep political divides and would push discussions beyond the presidential election set for October. That stance adds a layer of political uncertainty to Brazil’s broader approach to crypto regulation, even as enforcement authorities pursue aggressive asset-recovery tools.
In parallel, Brazil has faced notable enforcement activity in the crypto space. TRM Labs’ 2026 crypto crime report highlights a sprawling laundering and foreign-exchange evasion network in 2025 that allegedly moved tens of billions of reais via shell companies, OTC brokers, and non-custodial wallets. The case underscores why authorities view robust asset-recovery mechanisms as a potentially meaningful lever in countering sophisticated crypto-enabled crime networks.
Brazil’s evolving regulatory landscape and competing priorities
Brazil’s legal approach to seized crypto sits alongside broader debates about the country’s financial sovereignty and digital assets. A separate line of discussion has concerned whether Brazil should establish a national Bitcoin reserve. A proposal that first surfaced in 2024 reappeared in 2025, with lawmakers revisiting the framework to potentially allocate a portion of the treasury toward purchasing Bitcoin. Earlier reporting suggested options ranging from as little as a few percentage points of treasury reserves to up to one million BTC, though it remained unclear whether the measure would secure sufficient support to advance.
The tension between empowered enforcement tools and broader fiscal policy remains a defining theme. While the confiscation and redeployment of crypto assets to bolster public security represent a practical application of confiscated assets, the BTC-reserve concept embodies a strategic, macro-level bet on crypto as a state asset. Analysts note that even if a reserve remains aspirational, the mere progression of such discussions can influence how Brazil’s financial markets and crypto businesses price risk around policy clarity, taxation, and asset custody frameworks. For now, the law’s immediate impact centers on seizures, forfeiture, and the use of crypto proceeds to support law-enforcement capabilities rather than building a centralized digital-asset stockpile.
As with any regulatory shift, the practical effects will depend on implementation details, judicial oversight, and the tempo of cross-border cooperation. The law provides a framework, but courts, prosecutors, and international partners will shape how aggressively crypto assets are seized, liquidated, or repurposed. Investors and users should watch how authorities operationalize the mechanism in real cases, including which asset classes are most frequently targeted and how proceeds are tracked and accounted for in public security budgets.
For those tracking Brazil’s crypto policy arc, the connected policy threads—tax reform timing, enforcement clarity, and the possibility of a national BTC reserve—will be key to understanding the country’s longer-term stance on digital assets. The mix of aggressive asset-recovery powers and cautious tax policy signals a pragmatic, enforcement-driven approach in the near term, coupled with strategic questions about crypto’s role in national finance.
Readers should keep an eye on forthcoming judicial decisions that interpret and operationalize Law No. 15.358, as well as any administration-level statements clarifying the government’s stance on crypto taxation and asset reserves. The cross-border dimension will also hinge on cooperation agreements with other jurisdictions, which could set precedents for how Latin American countries coordinate on crypto-for-crime investigations in the years ahead.
References to related developments, including Brazil’s Pix payment system expansion and shifts in crypto-tax conversations, offer context for the broader regulatory environment. For example, coverage of Pix expanding to Argentina and discussions around crypto taxation provide a backdrop against which this new forfeiture framework operates. Meanwhile, TRM Labs’ findings illustrate the scale of criminal-funding networks that asset-recovery measures aim to disrupt.
As Brazil moves forward, market participants and citizens alike should watch how the law is applied in concrete cases, the speed of international cooperation, and whether broader fiscal proposals—such as a potential Bitcoin reserve—advance in tandem with enforcement measures. The coming months could reveal how Brazil balances security objectives with the growing integration of crypto into daily life and the national economy.
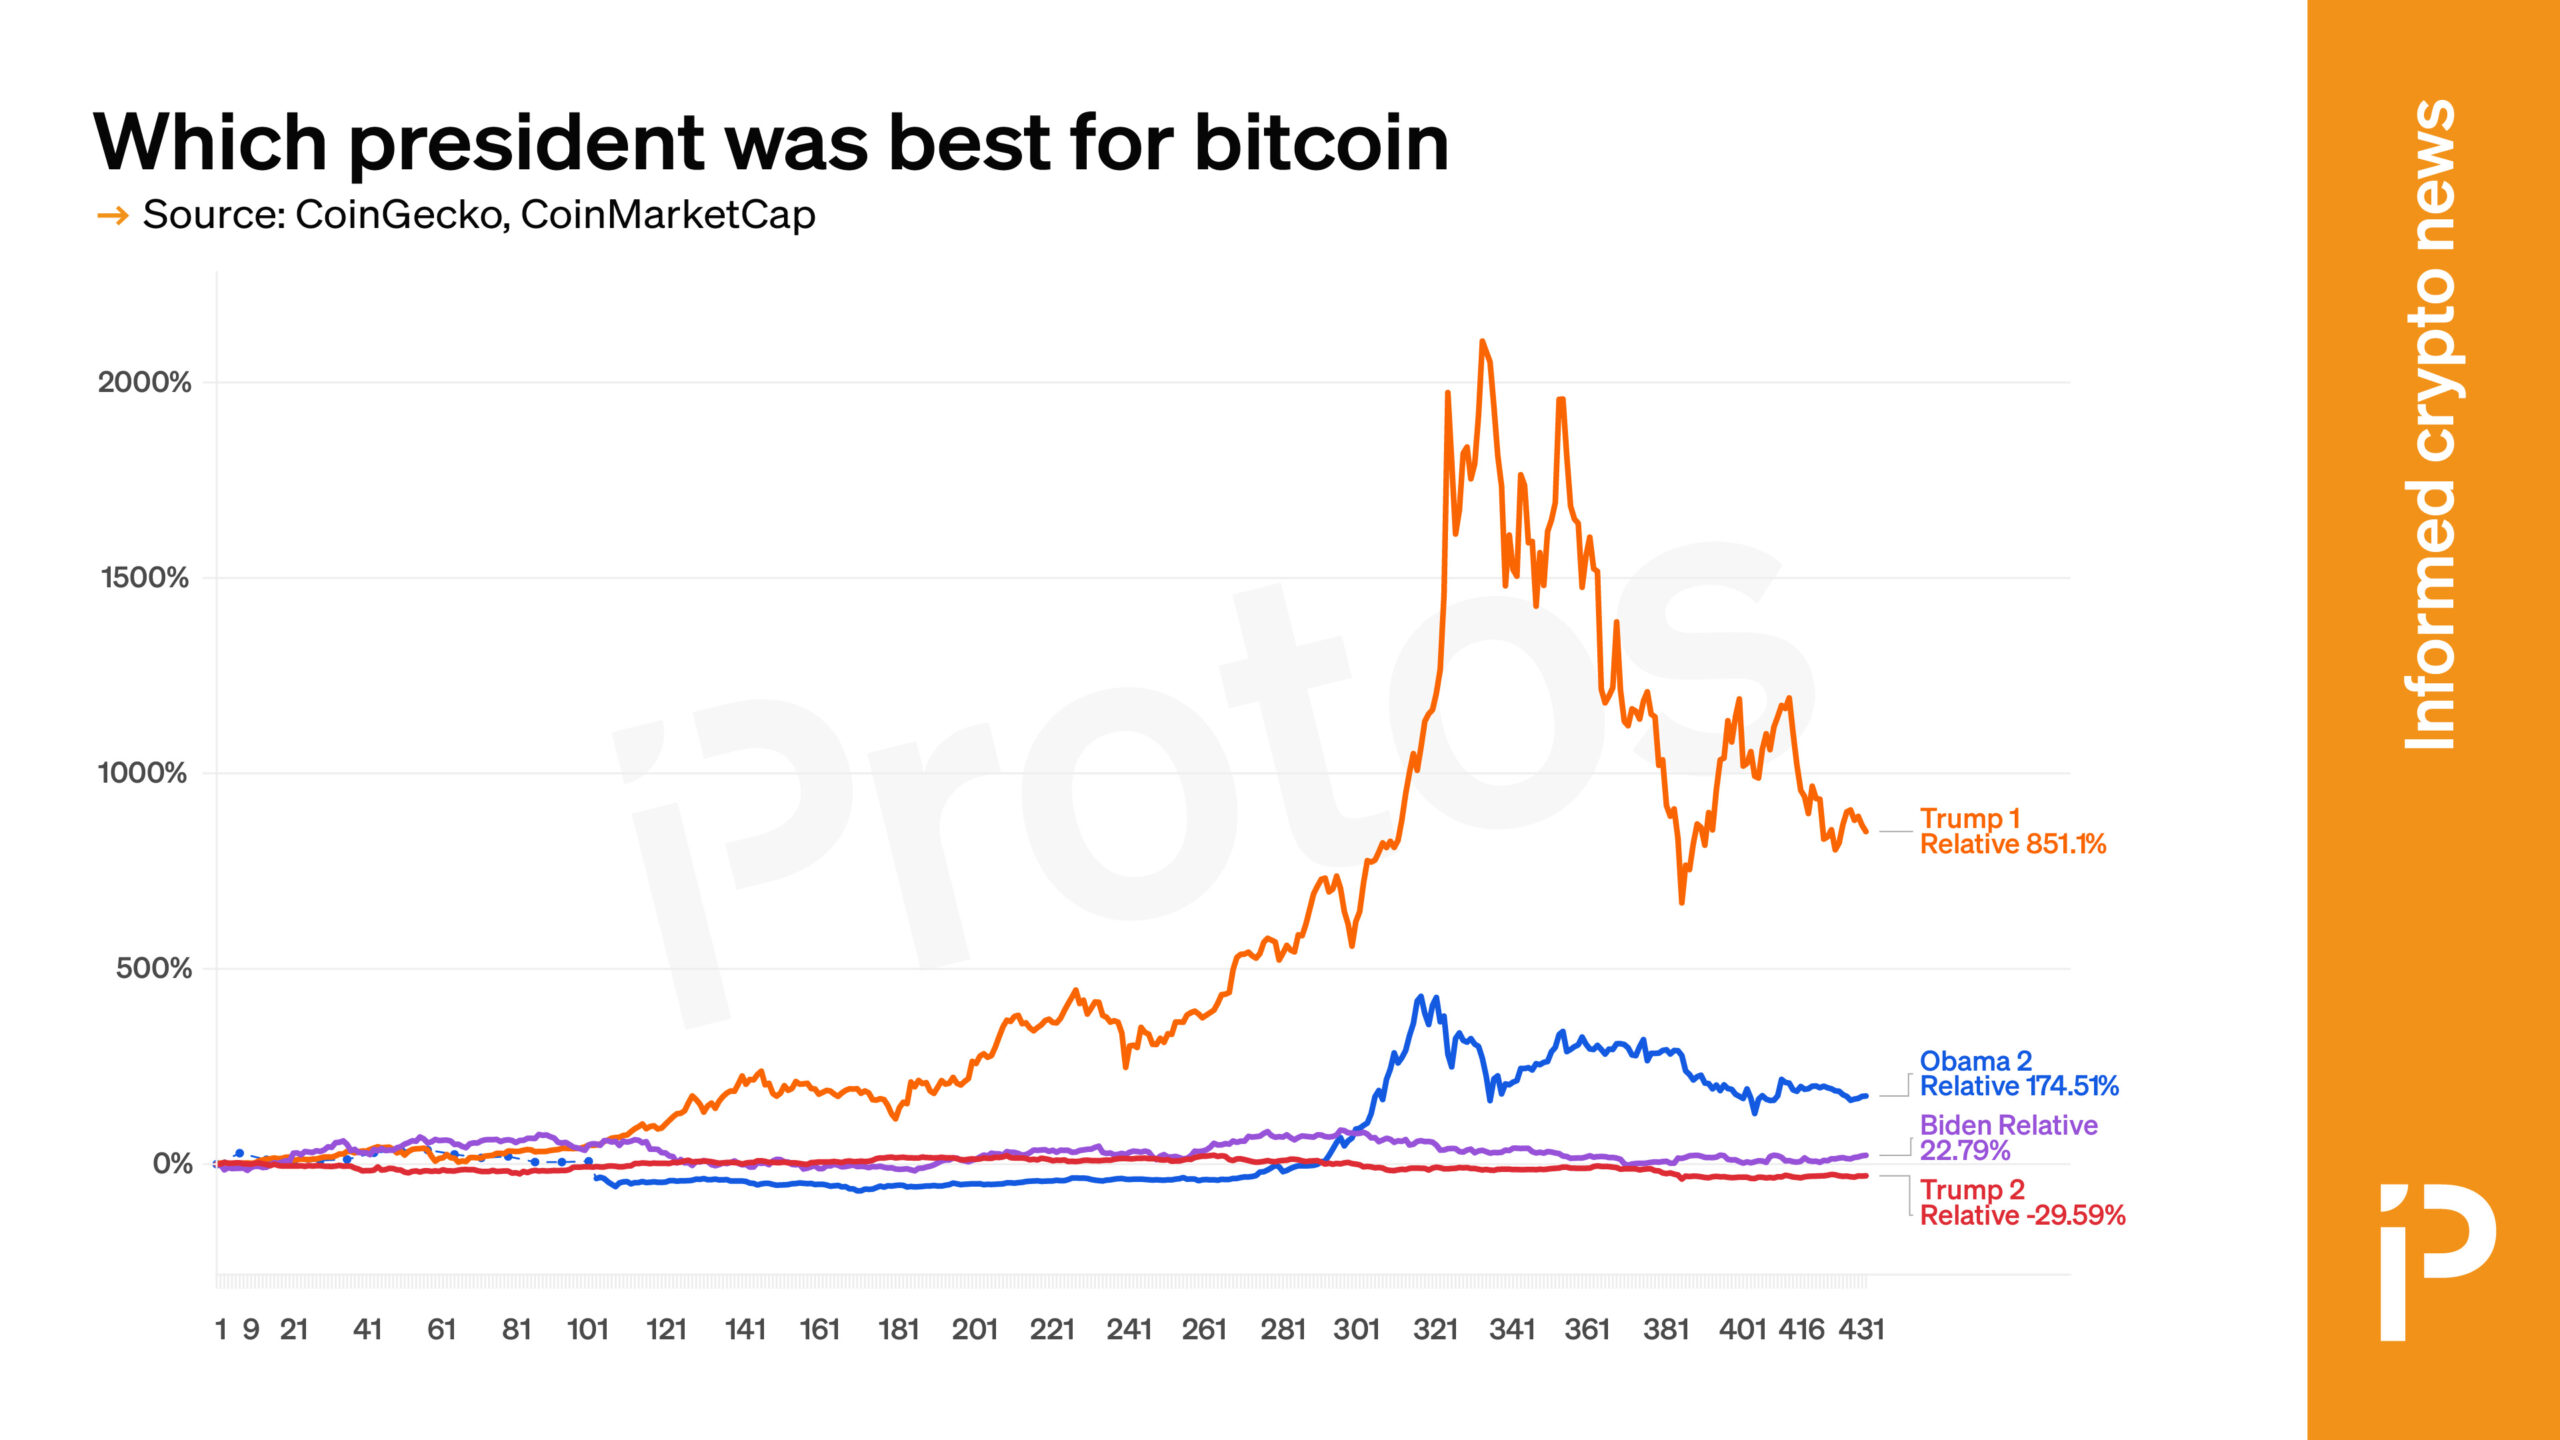

United States President Donald Trump has marketed himself as the president who truly embraced bitcoin (BTC), but has his willingness to cooperate with the industry resulted in price appreciation compared to previous administrations?
Protos used data from CoinGecko and CoinMarketCap to plot BTC’s relative performance up to this point during Barack Obama’s second term, Trump’s first term, Joe Biden’s term, and Trump’s second term.
Read more: ANALYSIS: Eric and Donald Trump Jr. are cashing in on crypto
The best performance at this point was in Trump’s first term, which saw BTC appreciate from less than $900 to nearly $8,500, an increase of approximately 850%.
Meanwhile, the worst performance can be seen during the current Trump administration, which has overseen a fall for BTC from over $101,000 to just over $71,000, a decrease of nearly 30%.
The two Democrat presidents sit between these relative extremes, with Obama presiding over an increase in BTC’s price from $212 to $584, an jump of around 175%.
Biden and his much-maligned cryptocurrency regulatory regime saw the price increase from approximately $36,000 to $44,000, a rise of 23%.
Trump is the only one of these presidents who has set himself up to profit directly from the crypto industry.
He’s the co-founder emeritus of World Liberty Financial, earns returns from the $TRUMP memecoin and the line of Trump digital trading cards, and Trump Media and Technology Group, the firm behind his beloved Truth Social, has diversified into crypto exchange traded funds.
Got a tip? Send us an email securely via Protos Leaks. For more informed news, follow us on X, Bluesky, and Google News, or subscribe to our YouTube channel.
Crypto World
Argentina’s State-Backed Energy Giant YPF Launches Tokenization Initiative on XRP Ledger
Enertoken, developed by Justoken for YPF Luz, launched with over $800 million in tokenized energy assets on XRPL.
YPF Luz, the electricity subsidiary of Argentina’s largest energy company, has partnered with Buenos Aires-based blockchain infrastructure company Justoken to launch an energy tokenization platform built on XRP Ledger (XRPL), the firms announced earlier this month.
The platform, dubbed Enertoken, tokenizes, commercializes, and manages electricity contracts via XRPL, the public blockchain originally developed by Ripple Labs, which remains a core contributor. Meanwhile, Justoken recently emerged as the largest real-world asset (RWA) tokenization platform on XRPL by total value.
Per the announcement, the new platform from YPF Luz, developed by Justoken, is aimed at corporations and large energy consumers to help manage everything from consumption tracking, to billing, to contract execution, “fully supported by tokenized energy assets recorded on blockchain.”
Martín Mandarano, the CEO of YPF Luz — the parent company of which has had a turbulent history of state and private ownership — was quoted as saying in the announcement:
“The integration of tokenized energy assets allows us to optimize processes, enhance traceability, and deliver greater transparency to our clients, reinforcing YPF Luz’s innovative profile within the energy sector.”
Justoken’s Quiet Dominance
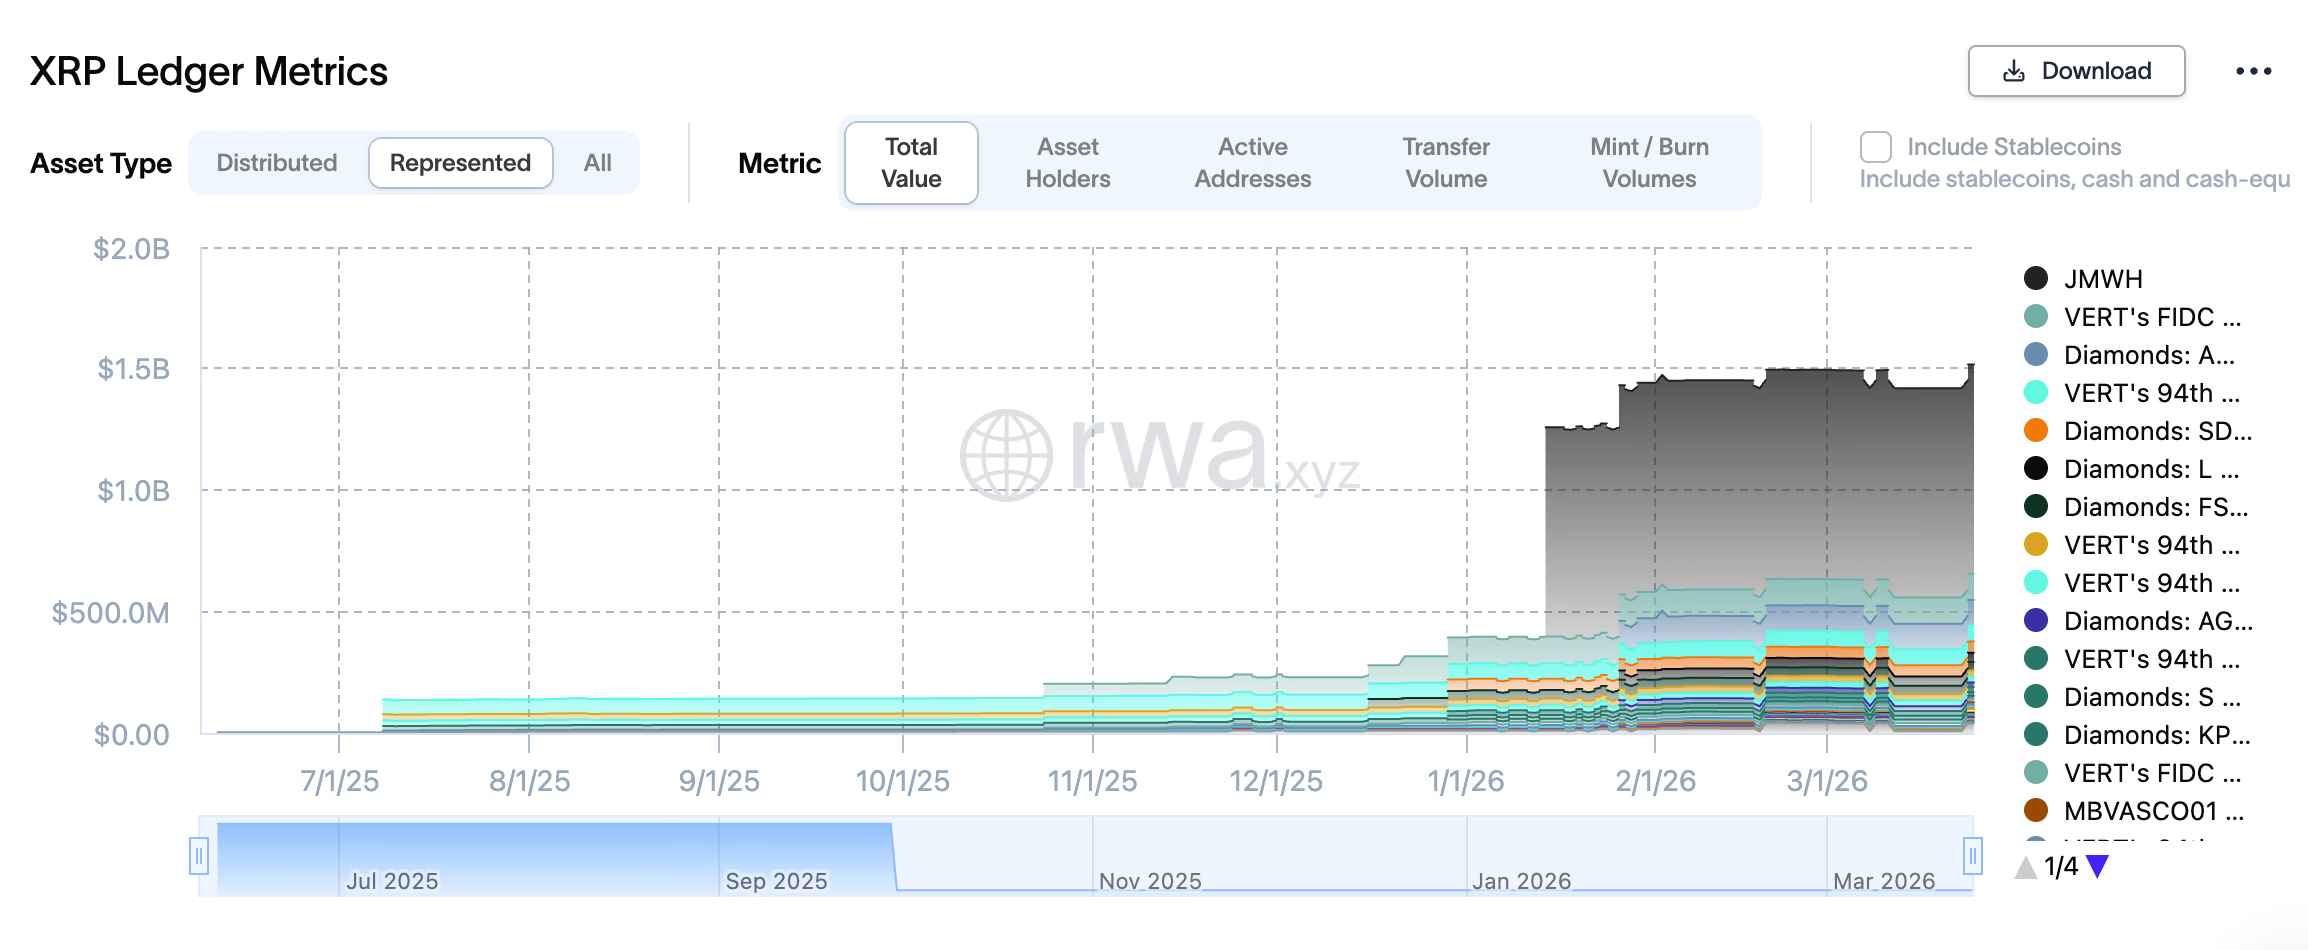
In what the companies are calling the project’s initial phase, Enertoken launched with over $800 million in tokenized energy assets on XRPL, per the announcement, evidently referring to Justoken’s tokenized energy fund, JMWH.
Justoken’s JMWH, which, per RWAxyz, represents real megawatt-hours (MWh) of energy, backed by energy producers in Latin America, quietly become the largest tokenized asset on XRPL by total value when it launched in mid-January with over $861 million on-chain. Meanwhile, Justoken has another $832.3 million in various other tokenized commodities on Polygon.

As of today, March 26, JMWH’s total asset value still stands at $861 million — representing nearly 57% of all so-called represented asset value on XRPL, and a nearly 45% market share of all tokenized RWA platforms on the network.
Per RWAxyz, “represented asset value” refers to tokenized assets that exist on a blockchain but cannot be distributed or transferred on-chain — they represent a real-world commitment recorded on-chain, not freely tradable tokens.
Represented vs Distributed RWAs
Luke Judges, Partner Director at RippleX, Ripple’s open developer platform, explained to The Defiant why JMWH falls into RWAxyz’s “represented” asset category, rather than “distributed” — a distinction that indicates how these assets are used on-chain, stating, “‘represented’ assets operate within more controlled environments, often reflecting regulatory or contractual requirements.”
In JMWH’s case, the tokens operate under Argentina’s capital markets regulator Comisión Nacional de Valores (CNV)’s regime for Virtual Asset Service Providers (PSAVs), with issuance, allocation, delivery, and retirement all tied to contractual obligations. This, Judges argues, explains why Justoken opted for a “closed loop approach.”
“The blockchain serves as a verifiable record of ownership and fulfilment rather than a trading venue,” Judges added.
He also noted that represented assets on XRPL are “an important starting point for many institutional use cases, with distributed assets playing a larger role as liquidity, infrastructure, and regulatory clarity continue to evolve on XRPL.”
Selecting XRPL
Ariel Scaliter, co-founder and CTO of Justoken, told The Defiant that the choice of XRPL was deliberate on multiple fronts, citing speed and scalability for teams building on the blockchain network:
“XRPL was selected for several strategic reasons. First, its institutional quality stands out. Many companies in the energy ecosystem are publicly listed, which aligns with the profile of counterparties involved in this type of business.”
Scaliter also cited the ability to build quickly on the XRPL EVM Sidechain before migrating to the mainnet, and flagged Ripple’s institutional legitimacy, as well as custody as a critical infrastructure consideration. He told The Defiant:
“XRPL, alongside contributions from Ripple, is well positioned to attract institutional investors. This global credibility and trust are essential for high-stakes, regulated use cases like energy tokenization.”
RippleX’s Judges elaborated on the architecture: “Justoken was looking for a way to bring renewable energy credits onchain that could support both traceability and automated compliance for corporate clients, while still fitting within existing custodial structures.”
YPF Luz and Its State-Backed Parent
YPF Luz is the power generation subsidiary of YPF (Yacimientos Petrolíferos Fiscales), Argentina’s majority state-owned oil and gas company. The nation’s largest crude producer was originally established over a hundred years ago as Argentina’s state oil company, but was privatized in 1999 and purchased by Spanish energy giant Repsol.
In 2012, Argentine President Cristina Fernández de Kirchner renationalized YPF, ousting Repsol after a dispute over slumping oil output and investment, Bloomberg reported at the time. Argentina’s Congress nationalized YPF through an overwhelming lower-house vote, clearing the way for President Fernández to sign the bill into law, per Reuters.
RWA Surge
XRPL has been steadily building its RWA credentials, and now has $1.5 billion in represented asset value on chain, and over $404 million in distributed asset value, per RWAxyz.
In late 2024, Ripple announced plans to tokenize the first-ever money market fund on XRPL, collaborating with UK-based digital securities exchange Archax and global investment firm Abrdn, as The Defiant reported. Last March, Ondo Finance deployed its tokenized short-term U.S. Government Treasuries product (OUSG) on the XRP Ledger, aiming to bring it to XRPL’s institutional user base.
Zooming out, the broader tokenized RWA market tripled from roughly $5.5 billion to $18.6 billion over the course of 2025, per The Defiant’s year-end analysis.
This article was written with the assistance of AI workflows. All our stories are curated, edited and fact-checked by a human.


ZachXBT blasted YoungHoon Kim’s $LAMB presale as a religion-wrapped grift, pointing to botted engagement, recycled scam copy and a playbook he’s seen in prior fraud investigations.
Summary
- On-chain investigator ZachXBT publicly questioned whether “grifting religion to promote a crypto token presale” is a viable strategy in 2026, targeting a token launch by self-proclaimed IQ 276 holder YoungHoon Kim.
- Kim, who bills himself as a World Memory Championships-recognized genius, launched the $LAMB token on March 25 via Fjord Foundry, claiming all profits would go to building churches worldwide.
- The presale’s sale marketcap reached $1.496 million with a fully diluted value of $6.804 million, while ZachXBT alleged the presale announcement relied on botted engagement.
Blockchain investigator ZachXBT fired a pointed public callout on March 26 at a religion-themed crypto token presale, asking on X whether “grifting religion to promote a crypto token presale for a glorified paid group is still a viable strategy in 2026.” The post drew 48,700 views, 1,200 likes, and 51 retweets within hours, touching off a wave of mockery and scrutiny across crypto Twitter directed at the project behind it: $LAMB, a token launched by YoungHoon Kim, who describes himself on X as the world’s highest IQ 276 holder and founder of @LAMB276_X.
Kim announced the presale on March 25 in a post that accumulated 176,000 views and 1,000 likes, writing: “Today, I launch my mission token to build churches across the world where Jesus Christ alone is Lord. Every profit belongs to His Kingdom because Jesus Christ is Lord.” The token was offered through Fjord Foundry, a decentralized token launchpad, with contract address 0x019E1f53Bf2EA52558c33feD363b491362c0d533. By the time ZachXBT weighed in, the presale had raised $51,910 against a token price of $0.246, a liquidity pool of $1.837 million, and a fully diluted valuation of $6.804 million.
Kim, who markets himself as a No. 1 Amazon bestselling author in Christian Apologetics and a Mensa member, had listed Conor McGregor — described as a “5-time World Champion” — as an advisor on the project’s promotional materials. ZachXBT’s screenshots of the LAMB276 website showed marketing language describing $LAMB as “the heartbeat of our community.” A separate reply by ZachXBT suggested the engagement surge around the presale announcement was artificial, writing: “Is botted engagement on a presale announcement considered high IQ?”
The $LAMB Token’s Playbook
The structure of the $LAMB presale follows a pattern that has drawn increasing scrutiny across the industry. The project issued a total supply of 276,000,000 tokens — a number mirroring Kim’s claimed IQ — and framed the sale as a “final sale” ahead of a broader community rollout. Commenter @serpinxbt noted in the replies that the project’s website copy “is clearly also based on historical crypto scams,” pointing specifically to phrases like “LAMB IS THE HEARTBEAT OF OUR COMMUNITY.”
ZachXBT is no stranger to flagging such operations. In March 2026, he exposed a coordinated network of over 10 accounts on X that used geopolitical panic to funnel users into pump-and-dump crypto tokens, with on-chain evidence suggesting the scheme generated six-figure profits. Earlier the same month, he accused employees at crypto trading platform Axiom of misusing internal tools to profit from insider trading — allegations that sent shockwaves through the decentralized exchange community.
The $LAMB situation fits a longer arc of celebrity- and identity-backed token launches exploiting cultural credibility to attract buyers. As CCN reported, Kim’s previous crypto price predictions — including forecasts for Bitcoin to reach $276,000 and XRP to hit triple-digit prices — had not materialized within their suggested timelines. The project had previously operated on the Solana blockchain before the current presale on Ethereum.
ZachXBT’s sardonic follow-up — “guess us plebs cannot possibly understand the grander vision since we’re not 276 IQ” — proved to be among the more viral lines in a thread that quickly went beyond crypto circles. @patty_fi summarized the community sentiment with blunt simplicity: “He’s using the prophet for profit!” As crypto.news has previously reported, social engineering and identity-based manipulation remain among the most effective — and recurring — vectors for retail crypto fraud in 2026.
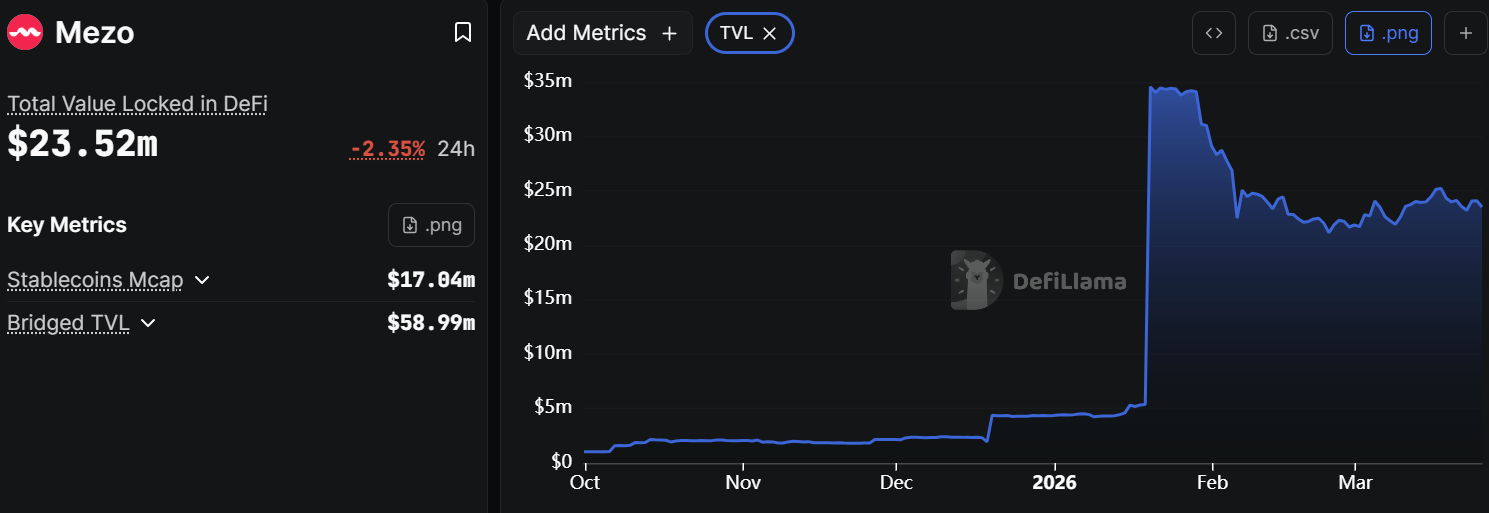
Mezo, a Bitcoin-native lending protocol, will collaborate with Aerodrome Finance to support trading activity for its token and Bitcoin-backed stablecoin on the Base network, as projects look for ways to bring more financial use cases to Bitcoin.
In a Thursday announcement, Mezo said it will allocate 2.25% of its MEZO token supply to Aerodrome’s vote-escrow (veAERO) participants — users who lock tokens in exchange for governance rights and rewards. The program is designed to encourage those users to direct funds into MEZO trading pairs, increasing activity around the token and its US dollar-backed stablecoin, MUSD.
Aerodrome is a liquidity provider on Base built by the team behind Optimism, a configurable enterprise blockchain infrastructure.
The partnership links Base-based traders with a newer group of Bitcoin-focused applications, as developers experiment with adapting existing DeFi models to Bitcoin.
Mezo, which allows users to borrow against their Bitcoin (BTC) holdings, said it has issued more than 2,000 loans and helped move roughly $23 million in Bitcoin-denominated assets from Ethereum.

The move gives Mezo access to a large and active DeFi user base on the Base network. Bitcoin-native applications often struggle to attract enough trading activity. On Base, infrastructure such as Aerodrome can help support more consistent trading in new tokens and stablecoins.
Related: Coinbase’s Base transitions to its own architecture with eye on streamlining
Bitcoin DeFi activity grows as new platforms emerge
Bitcoin is increasingly being positioned as a base layer for decentralized finance, driven in part by increasing institutional participation and long-term holders seeking ways to generate returns on idle assets.
Bitcoin-based DeFi activity has picked up since 2024, with a growing number of platforms aiming to bring lending, borrowing and yield strategies to the network.
Recent examples include Lombard, which is building Bitcoin-based lending infrastructure and has teamed with Bitwise to allow institutional investors to earn yield and borrow against their Bitcoin holdings.
Another project, Hashi, has recently launched on the Sui network with early participation from BitGo, Bullish and FalconX, among others. The platform enables users to earn yield on Bitcoin through onchain lending and borrowing.
Related: Babylon-Ledger tie-up expands access to Bitcoin Vaults for collateral use

Explosive device found at MacDill Air Force Base: Siblings charged

Natural Gas Recovery Gains Traction As Geopolitical Support Pushes Price Toward $3.02
Bitcoin Slides Below $69,000 as Iran Stalemate Fuels Global Selloff


-
 Crypto World6 days ago
NIO (NIO) Stock Plunges 6.5% as Shelf Registration Sparks Dilution Worries
-

 Fashion6 days ago
Weekend Open Thread: Adidas – Corporette.com
-
 NewsBeat1 day ago
Manchester United reach agreement with Casemiro over contract clause amid transfer speculation
-

 Politics6 days ago
Jenni Murray, Long-Serving Woman’s Hour Presenter, Dies Aged 75
-

 Crypto World5 days ago
Best Crypto to Buy Now: Strategy Just Spent $1.57 Billion on Bitcoin During Fear While Early Investors Quietly Enter Pepeto for 150x Potential
-

 Crypto World5 days ago
Bitcoin Price News: Bhutan Sells $72 Million in BTC Under Fiscal Pressure, but the Smart Money Entering Pepeto Sees What the Market Does Not
-

 Tech7 days ago
inKONBINI Lets You Spend Summer Days Behind the Register
-

 News Videos17 hours ago
Parliament publishes latest register of MPs’ financial interests
-

 Sports3 days ago
Remo Stars and Kano Pillars Strengthen Survival Hopes in NPFL
-

 Politics7 days ago
Gender equality discussions at UN face pushbacks and US resistance
-

 Business4 days ago
No Winner in March 21 Drawing as Prize Rolls to $133 Million for Next
-

 Sports3 days ago
Gary Kirsten Accuses Pakistan Cricket Board Of ‘Interference’, Mohsin Naqvi Responds
-

 Tech4 days ago
Give Your Phone a Huge (and Free) Upgrade by Switching to Another Keyboard
-

 Sports6 days ago
2026 Kentucky Derby horses, odds, futures, preview, date: Expert who nailed 12 Derby-Oaks Doubles enters picks
-

 Tech4 days ago
AI enters the chat: New Seattle dating app relies on tech to facilitate meaningful human connections
-

 Business7 days ago
DLocal: Entering 2026 At Escape Velocity
-
Business6 days ago
Columbia Sportswear enters $500 million credit agreement with JPMorgan Chase
-

 Tech5 days ago
Today’s NYT Connections Hints, Answers for March 22 #1015
-

 News Videos3 days ago
Ch 9 Financial Management Part 1 | Detailed One Shot | Class 12 Business Studies Boards 2026
-

 Business4 days ago
Will Duke Basketball Win It All? Duke Basketball Enters Second Round as Third Favorite to Claim NCAA Title
You must be logged in to post a comment Login